For engineering leaders using Azure DevOps, the need for deep, actionable analytics is undeniable. While the native dashboards offer a starting point, they quickly fall short, pushing teams toward Microsoft’s recommended solution: Power BI.
Power BI is a formidable business intelligence tool, but for engineering analytics, it's often a case of using a sledge hammer to crack a nut. It promises endless customization but delivers a steep learning curve, significant setup overhead, and persistent data silos. Engineering teams find themselves spending more time wrangling data and building reports than actually gaining insights.
The problem isn't the data; it's the tool. A general-purpose BI platform is not a specialized engineering intelligence platform. This article explores the common shortfalls of using Power BI for Azure DevOps reporting and shows how a purpose-built solution like Keypup provides a smarter, faster, and more intuitive path to the answers you need.
To understand the difference between a general-purpose BI tool and a specialized engineering intelligence platform, let's follow Alex (the name has been changed), an Engineering Manager at a growing tech company.
The Challenge:
The latest product release was delayed. During the retrospective, the team felt that the final stages—getting pull requests reviewed and merged—were taking longer than usual, especially for critical bug fixes. Alex has a hypothesis: the "time from PR approval to merge" is increasing, creating a bottleneck.
She needs to validate this hypothesis and, more importantly, identify the specific PRs that are taking the longest to merge after they've been approved.
The Specific Reporting Need: "Show me the average 'Time to Merge' for merged pull requests tagged as 'Bug' over the last 90 days. I need to see the trend over time and be able to identify the specific PRs that are skewing the average."
Let's see how Alex tackled this with Power BI, then with Keypup.

The Journey with Power BI: The Data Analyst Detour
Alex is a skilled engineering manager, but not a data analyst. She opened Power BI and started her journey.
- Day 1, step 1 - The Data Connection: Alex started by connecting Power BI to Azure DevOps. She used the recommended Analytics Views. She quickly hit her first wall: Analytics Views only expose Azure Boards data (work items). Pull request data like merged_at and review_approved_at isn't available.
- Day 1, step 2 - The API Scramble: After some research, she realized she needed to query the Azure DevOps REST API directly to get the pull request data. This involves understanding OData endpoints and authentication. She spent the rest of the morning figuring out how to pull the necessary fields for all PRs in her projects.
- Day 1, step 3- The Data Modeling Nightmare: Alex now had two separate datasets: work items from Analytics Views and pull request data from her API query. In Power BI Desktop, she had to manually create a data model, building relationships to link the pull requests to their corresponding work items to filter by the 'Bug' tag. She struggled with mismatched keys and complex joins.
- Day 1, step 4 - Writing DAX: To calculate the "Time to Merge," she needed to write a DAX (Data Analysis Expressions) formula. She looked up syntax for date differences, handling nulls, and creating a new measure:
Time to Merge = AVERAGE(DATEDIFF(PRs[review_approved_at], PRs[merged_at], HOUR)). It took a few tries to get it right. - Day 2, step 5 - Building the Visualization: Alex finally had a working model. She built a line chart showing her new metric over the last 90 days. She added a filter for Work Item Type = 'Bug'. The chart loaded, and she could see a troubling upward trend.
- Day 2, step 6- The Investigation Roadblock: Her chart showed that the average merge time spiked two weeks ago. But which pull requests caused it? To find out, she had to create a separate table report, apply the same complex filters, and manually cross-reference the dates. The "drill-down" isn't seamless; it's a separate, manual investigation.
The Result: After more than a day of technical wrangling, Alex had a static chart that confirmed her suspicion. The data was already a day old due to the manual export and scheduled refresh, and investigating any new spikes would have required another manual deep dive.
The Journey with Keypup: The Manager's Fast Lane
- Day 1, step 1 - The Data Connection: Alex connects her Azure DevOps account to Keypup. The data is already synced and correlated in real-time via webhooks.
- Day 1, step 2 - The Ask: Alex opens Keypup's AI Agent. She types her question in plain English.
Prompt: "Create a KPI with a sparkline trend showing the average time from PR approval to merge in hours for pull requests linked to 'Bug' work items. I want to see the data for the last 90 days."
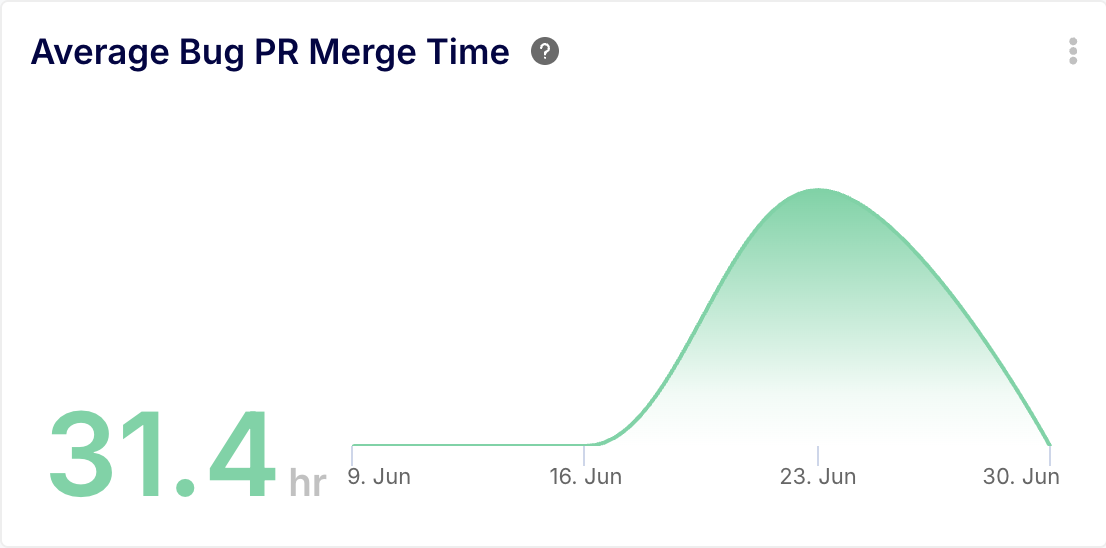
Day 1, step 3 - The Answer: In about 15 seconds, Keypup generates the insight.
- A KPI shows the current average: 31.4 hours.
- A line chart next to it shows the weekly trend over the last 90 days. Alex immediately sees the spike two weeks ago, just as she suspected.
- Day 1, step 4- The Investigation: This is the crucial difference. Alex clicks directly on the data point for the week of the spike on the sparkline chart. A drill-down view instantly appears, showing a list of every single pull request that was merged that week, already sorted by the longest "Time to Merge."
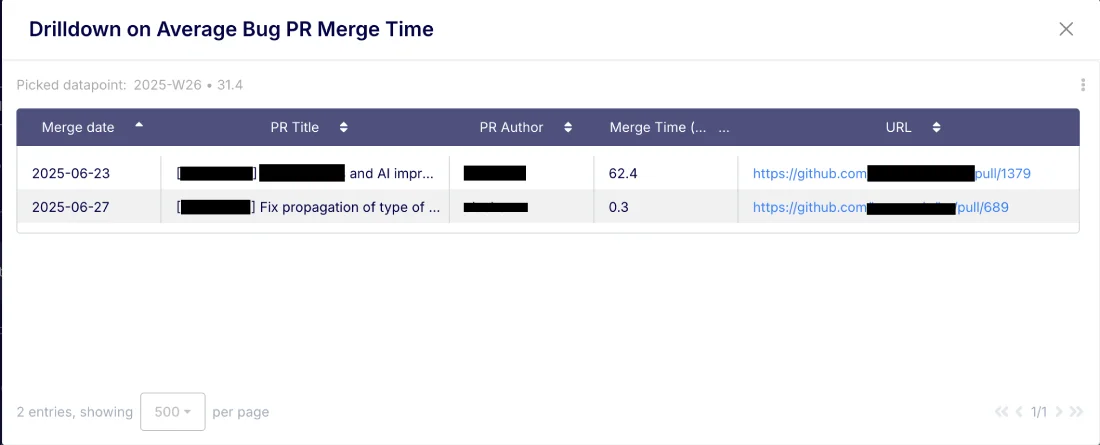
She immediately spots a PR with merge times of over 62 hours. With another click, she opens the PRs to see the context, discovering it was stuck waiting for a final deployment to a staging environment that was down.
The Result: In less than five minutes, Alex not only validated her hypothesis but also identified the root cause of the delay. She now has a real-time, interactive insight she can save to her dashboard to monitor this metric continuously, and she has a specific process issue to discuss with the DevOps team.
Side-by-side Comparison
| The Task | Alex's Journey with Power BI | Alex's Journey with Keypup |
| Setup & Data Prep | 1.5 days of connecting to multiple data sources, building a data model, and writing DAX formulas. | Zero. Data is automatically synced and correlated. |
| Creating the Insight | 2-3 hours of building charts, applying filters, and validating the data. | ~15 seconds, using a single plain-English prompt. |
| Investigating a Spike | A separate, manual process of building a new table report and cross-referencing data. | A single click on the chart to instantly drill down to the specific pull requests. |
| Data Freshness | Dependent on the last scheduled refresh (hours or a day old). | Real-time, updated via webhooks. |
| Required Skills | Data modeling, OData, REST APIs, DAX/M query language. | Asking a question in plain English. |
| Final Outcome | A static report that confirms a problem. | An interactive, real-time insight that reveals the root cause. |
This practical example highlights the core difference: Power BI is a powerful but generic tool that requires you to become a data analyst. Keypup is a specialized platform that acts as your dedicated engineering analyst, providing immediate answers so you can focus on leadership.

Let's now address all the shortfalls of Power BI when it comes to providing analytics reporting for Azure DevOps.
1. The Shortfall: Arduous, Time-Consuming Setup
Getting started with Power BI for Azure DevOps is not a plug-and-play experience; it's a data engineering project. You need to connect to data sources via OData feeds, understand the complex data model, deal with authentication, and then manually build relationships between work items, commits, and builds. To create any meaningful metric, like cycle time, you'll be writing complex DAX or M queries. This process can take days or even weeks before you see a single chart.
The Keypup Solution: Zero-Setup, Instant Insights
Keypup is built for immediate value. The integration with Azure DevOps is native and webhook-driven. You simply authorize Keypup, and it handles the rest. It ingests data from your entire Azure DevOps environment—Boards, Repos, and Pipelines—and automatically correlates it into a unified, queryable model. There's no data modeling to perform and no queries to write. You can go from connecting your account to asking complex questions in minutes.
Put it into Practice with Keypup's AI Agent:
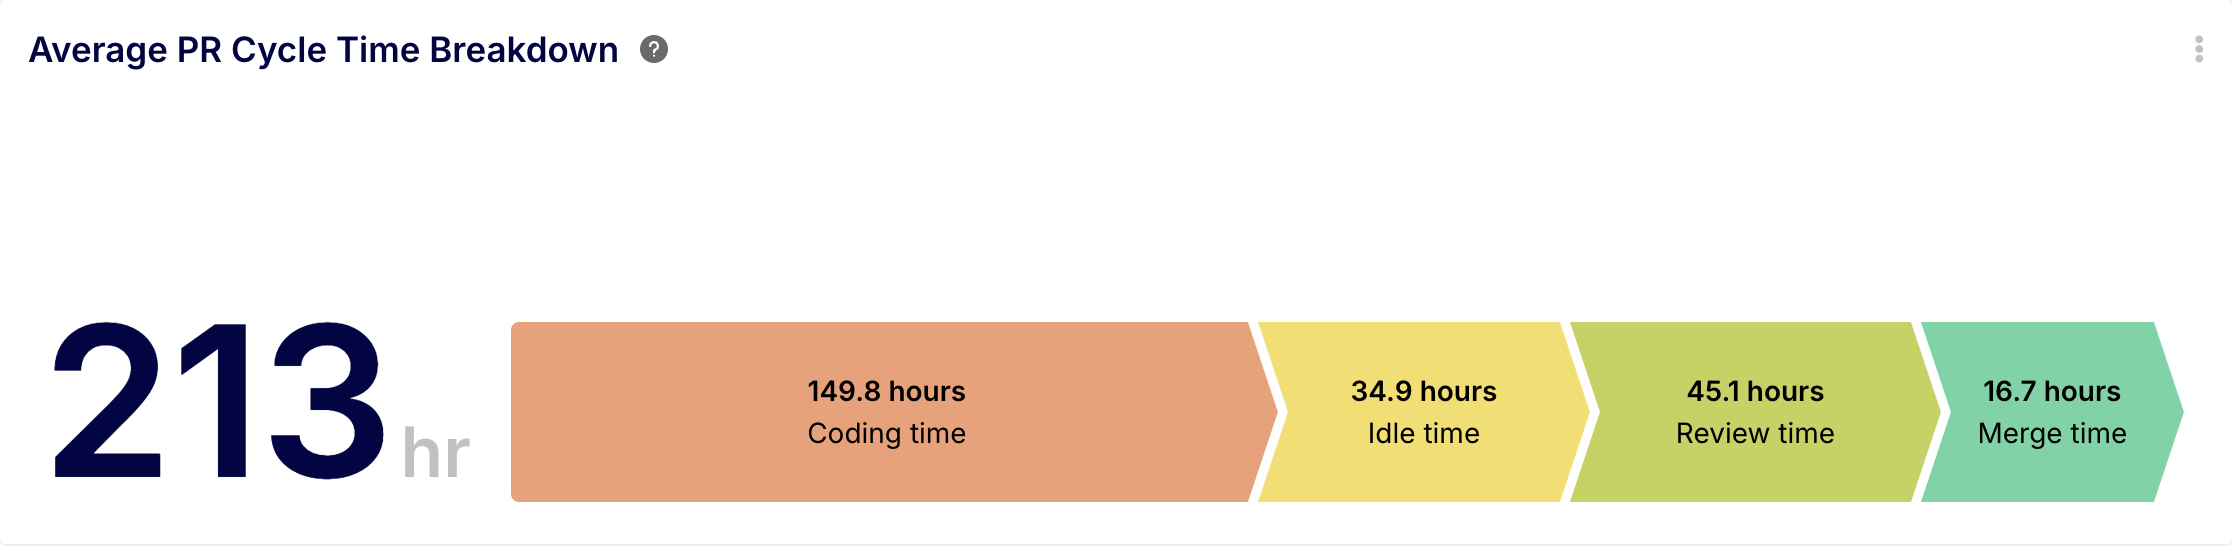
Ask for a complex, multi-stage metric from day one, without any setup.
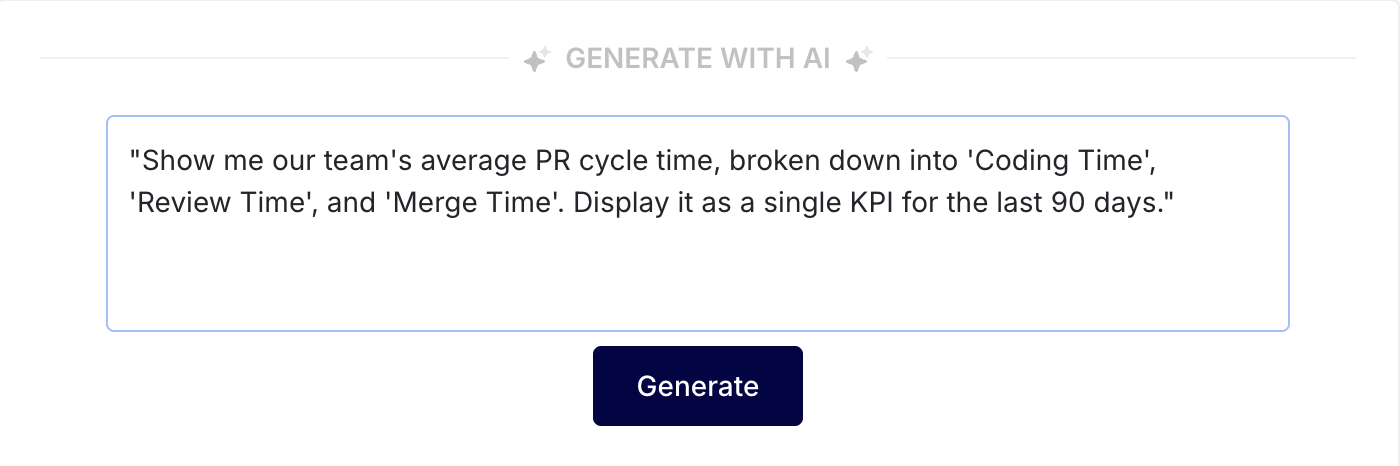
Prompt: "Show me our team's average PR cycle time, broken down into 'Coding Time', 'Review Time', and 'Merge Time'. Display it as a single KPI for the last 90 days."
2. The Shortfall: Limited and Siloed Data Outputs
The primary integration path for Power BI, Analytics Views, has a critical flaw: it is limited to Azure Boards data. It doesn't include data from Azure Repos (pull requests, commits) or Pipelines (builds, deployments). To get a complete picture, you must create separate, complex queries directly against the REST API, and then manually attempt to join this disparate data. This often results in incomplete, disconnected reports that fail to show the full development lifecycle.
The Keypup Solution: A Unified View Across Your Entire Workflow
Keypup automatically pulls and correlates data from every part of your Azure DevOps workflow. It understands the relationships between work items, the pull requests that resolve them, the commits within those PRs, and the build statuses associated with them. This allows you to ask questions that span the entire development process, providing end-to-end visibility that is nearly impossible to achieve in Power BI without significant manual effort.
Put it into Practice with Keypup's AI Agent:
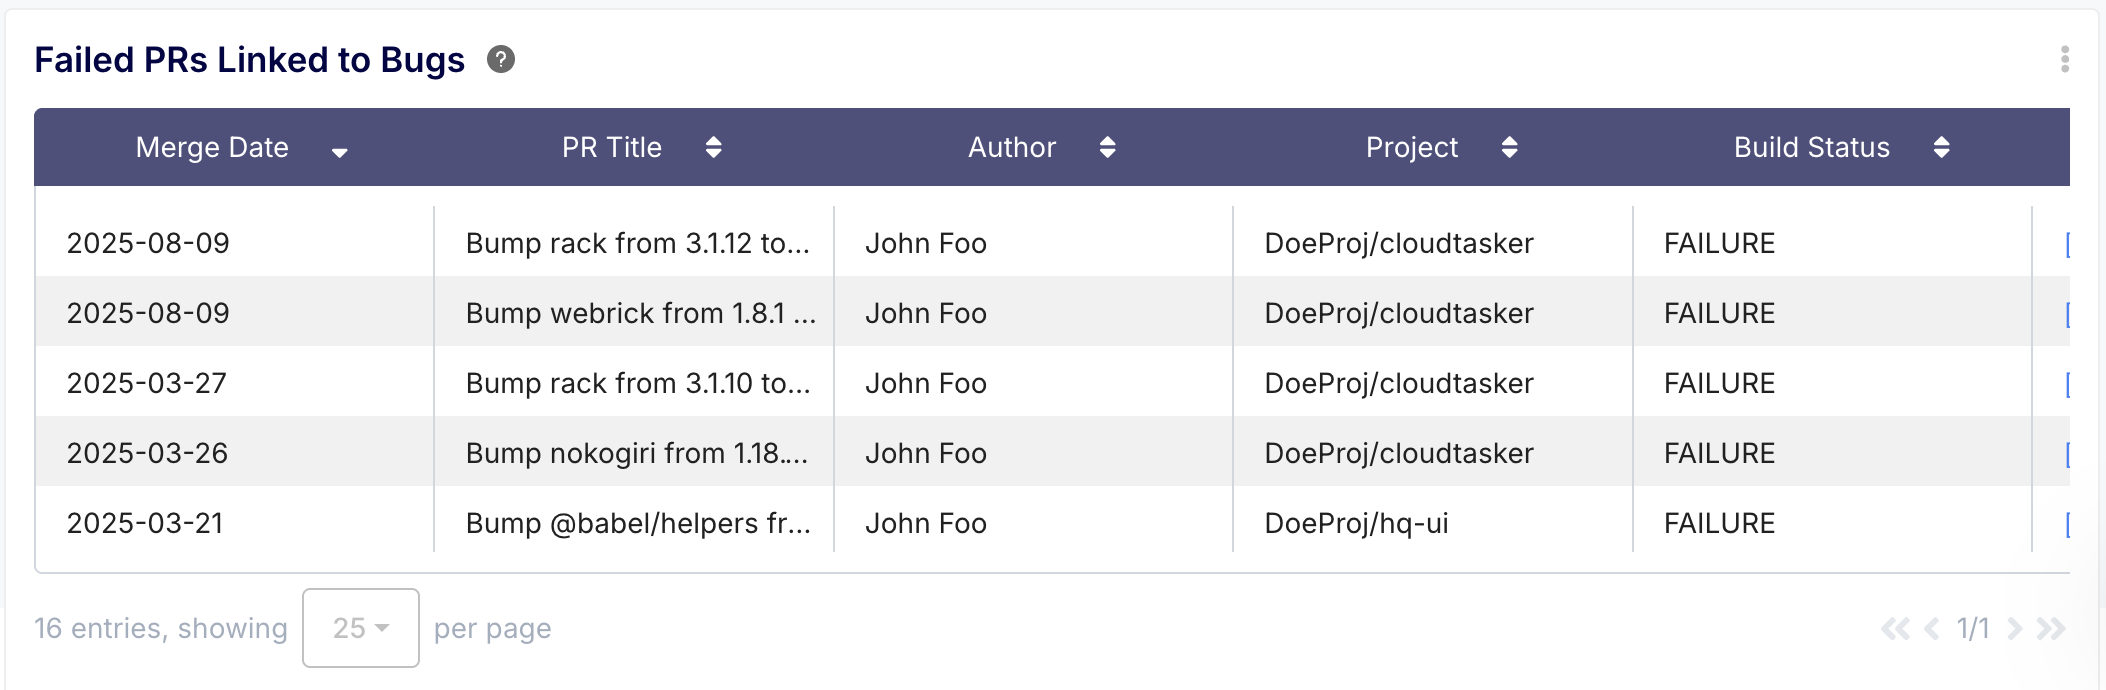
Leverage Keypup's correlated data to connect different parts of your workflow in a single query.
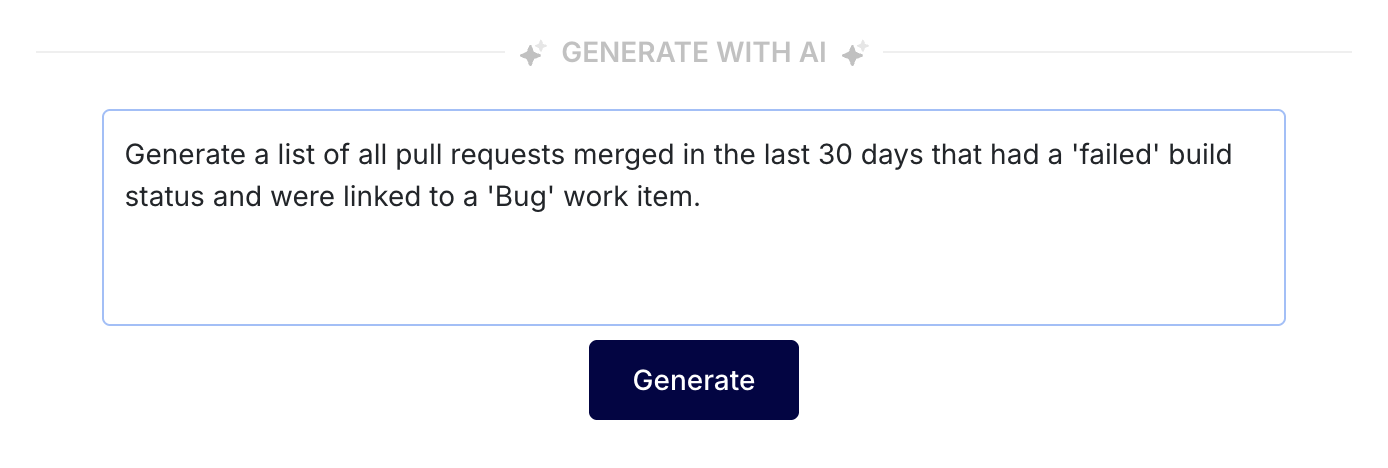
Prompt: "Generate a list of all pull requests merged in the last 30 days that had a 'failed' build status and were linked to a 'Bug' work item."
3. The Shortfall: Slow, Lagging Reports
Power BI reports are not truly real-time. They rely on scheduled data refreshes, which can take a long time for large datasets and can even fail, leaving you with stale information. When you need to make a quick decision in a stand-up or triage a production issue, waiting for a data refresh is not an option. Performance bottlenecks and slow-loading dashboards are common complaints.
The Keypup Solution: Real-Time Data, Instant Answers
Keypup is architected for speed and real-time accuracy. Using webhooks, Keypup receives updates from Azure DevOps the moment they happen. A pull request is opened, a build fails, a comment is made—Keypup knows instantly. Your dashboards and insights always reflect the current state of your development pipeline, so you can make decisions with confidence.
Put it into Practice with Keypup's AI Agent:
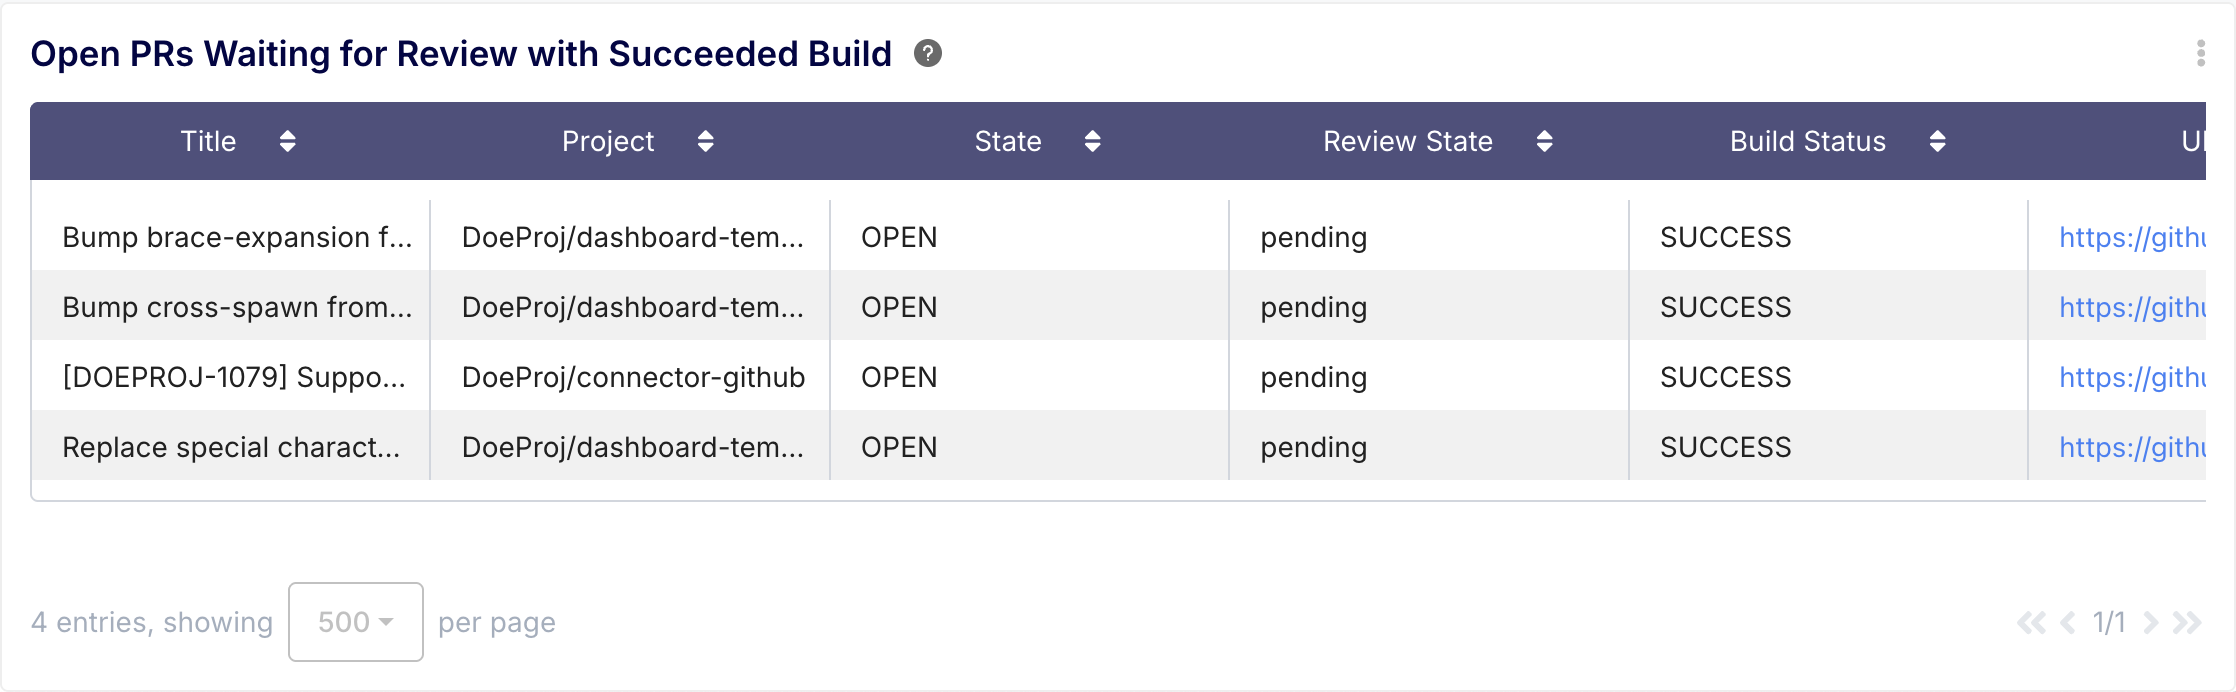
Ask for an up-to-the-minute status check, perfect for daily stand-ups or ad-hoc queries.
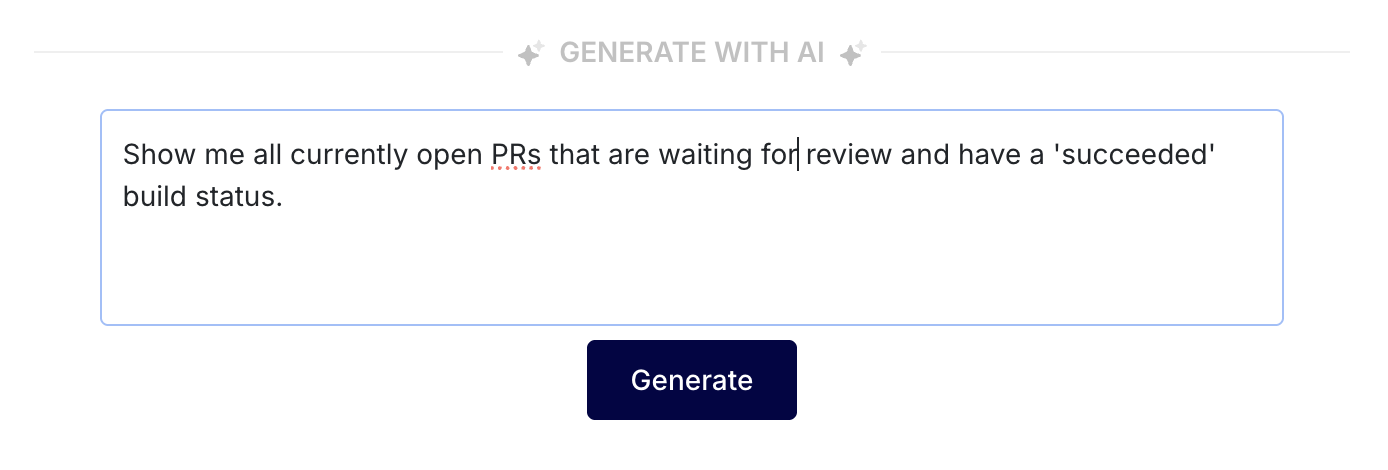
Prompt: "Show me all currently open PRs that are waiting for review and have a 'succeeded' build status."
4. The Shortfall: Cumbersome for Engineering Metrics
Power BI is a blank canvas. While powerful, it has no built-in understanding of engineering concepts like "Deployment Frequency" or "Rework Ratio." To build these metrics, you need to think like a data analyst, translating engineering processes into complex DAX measures and manually designing every visualization. This high cognitive load takes engineering leaders away from their primary job: leading their team.
The Keypup Solution: A Platform That Speaks Your Language
Keypup is a purpose-built engineering intelligence platform. It understands the metrics that matter to development teams out-of-the-box. The AI Agent allows you to ask for what you need in plain English, using the terminology you use every day. You don’t need to be a data expert to get expert-level insights. This democratizes data, allowing anyone on the team to ask questions and get answers.
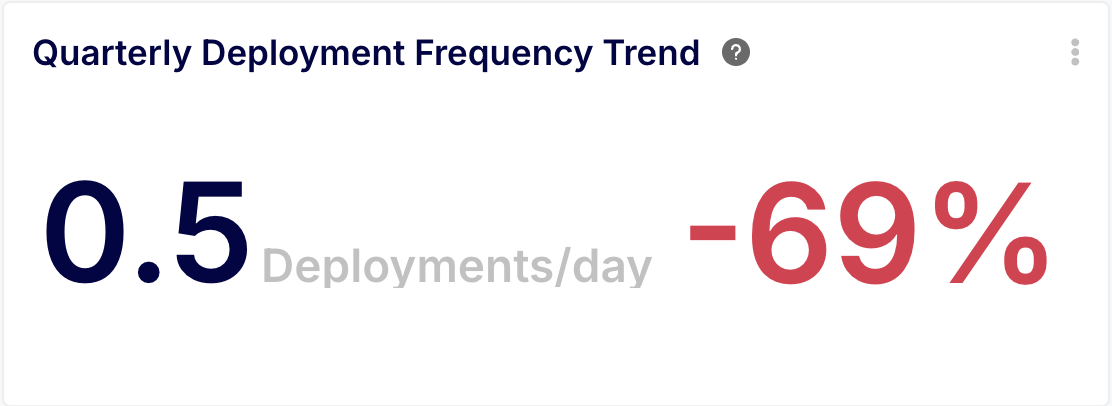
Put it into Practice with Keypup's AI Agent:
Ask for a high-level DORA metric that would require extensive setup in Power BI.
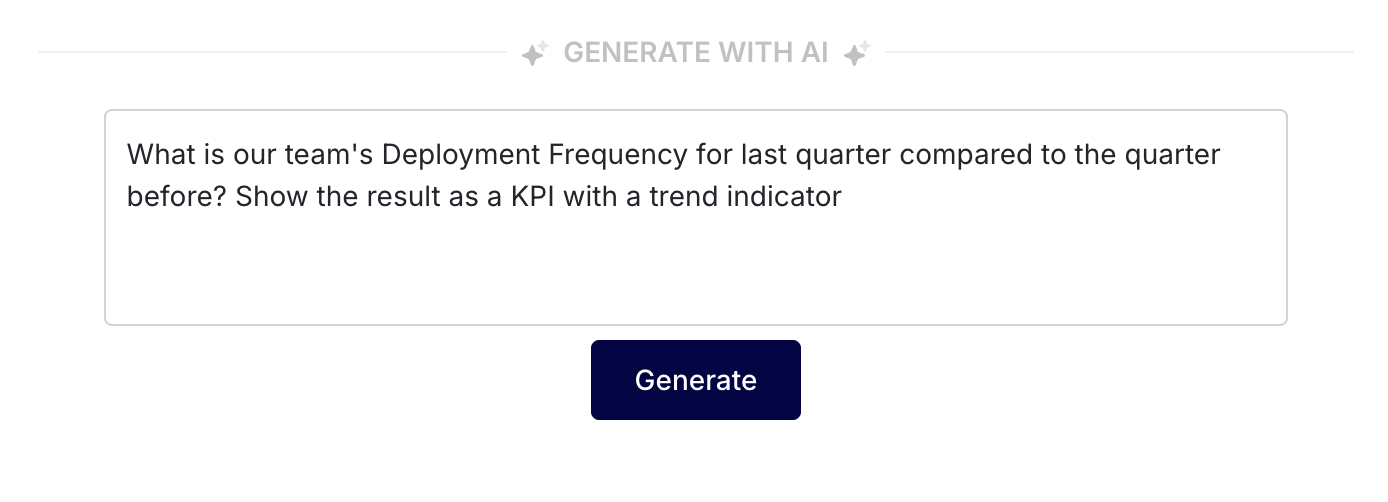
Prompt: "What is our team's Deployment Frequency for last quarter compared to the quarter before? Show the result as a KPI with a trend indicator."
Power BI is an exceptional tool for general business intelligence, but it was not designed to solve the specific, nuanced challenges of engineering analytics. Forcing it into this role creates a time-consuming, frustrating, and often incomplete reporting experience.
Keypup outsmarts Power BI for Azure DevOps analytics by being purpose-built for the job. It eliminates the setup, data modeling, and performance headaches, providing a real-time, unified view of your entire development workflow. By allowing you to ask questions in plain English and get immediate answers, Keypup shifts the focus from building reports to making decisions, empowering you to truly understand and optimize your engineering practice.