How to Identify Bottlenecks in Your Software Delivery Pipeline Using Jira Data
Learn how to identify software delivery bottlenecks using Jira data. Track Cycle Time, Time in Status, and Flow Efficiency instantly with Keypup's AI Agent.

Page 7 of 15

Learn how to identify software delivery bottlenecks using Jira data. Track Cycle Time, Time in Status, and Flow Efficiency instantly with Keypup's AI Agent.
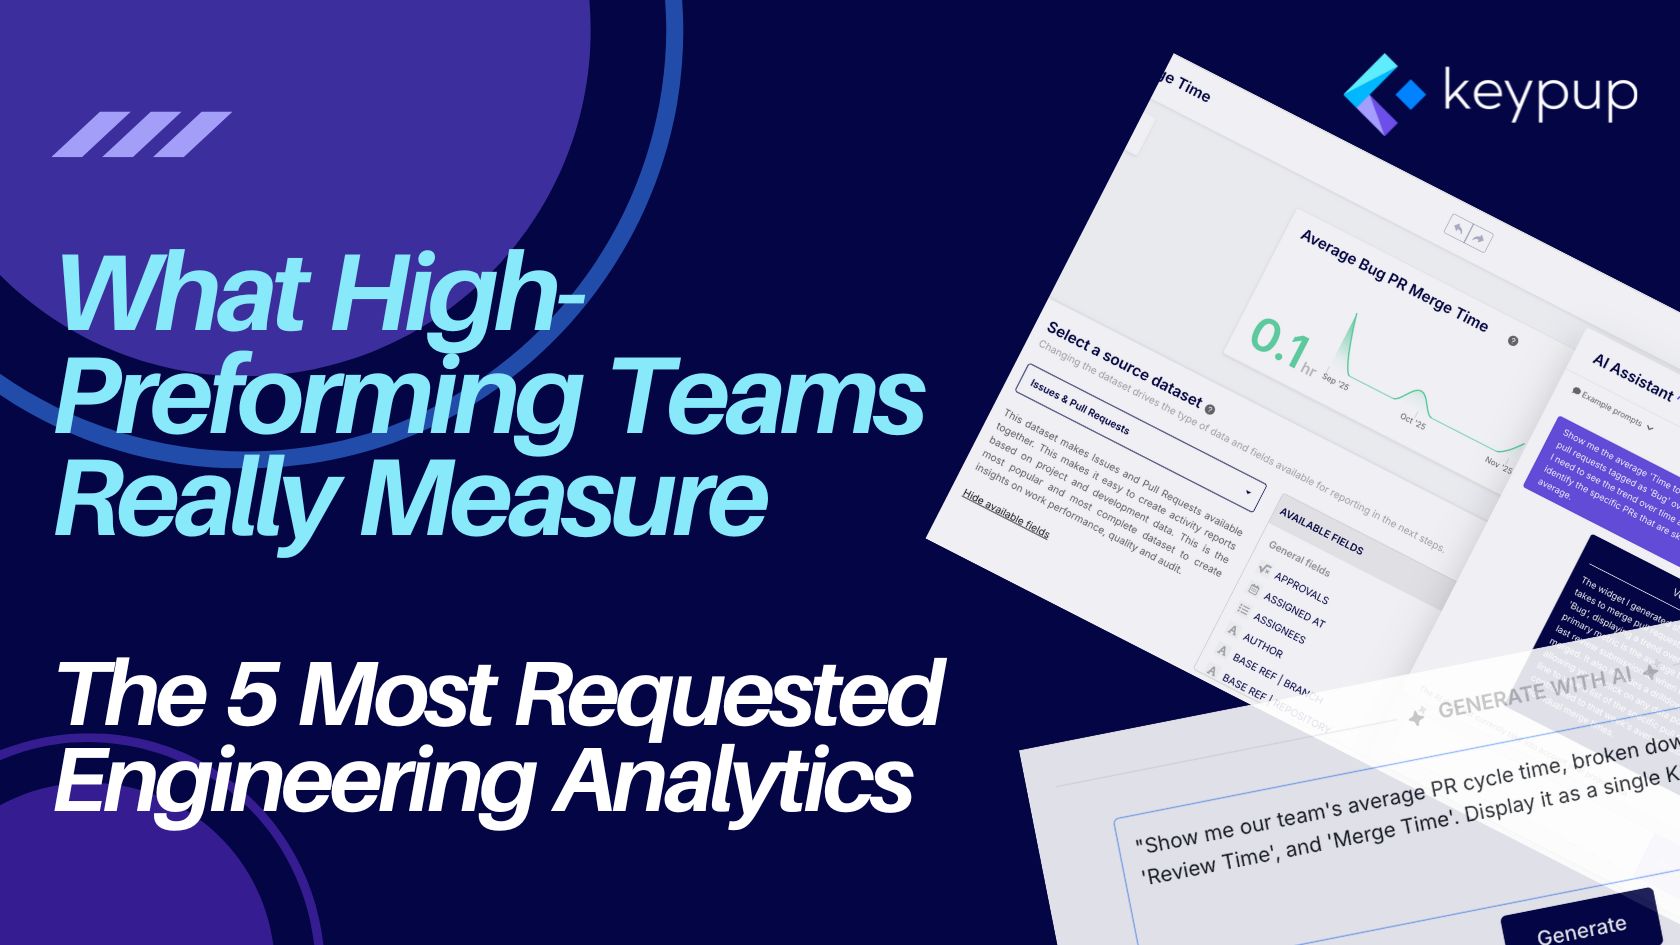
We analyzed thousands of queries to our platform to find what elite engineering teams track. Discover the top 5 metrics, from developer productivity and DORA to bug quality and cycle time.
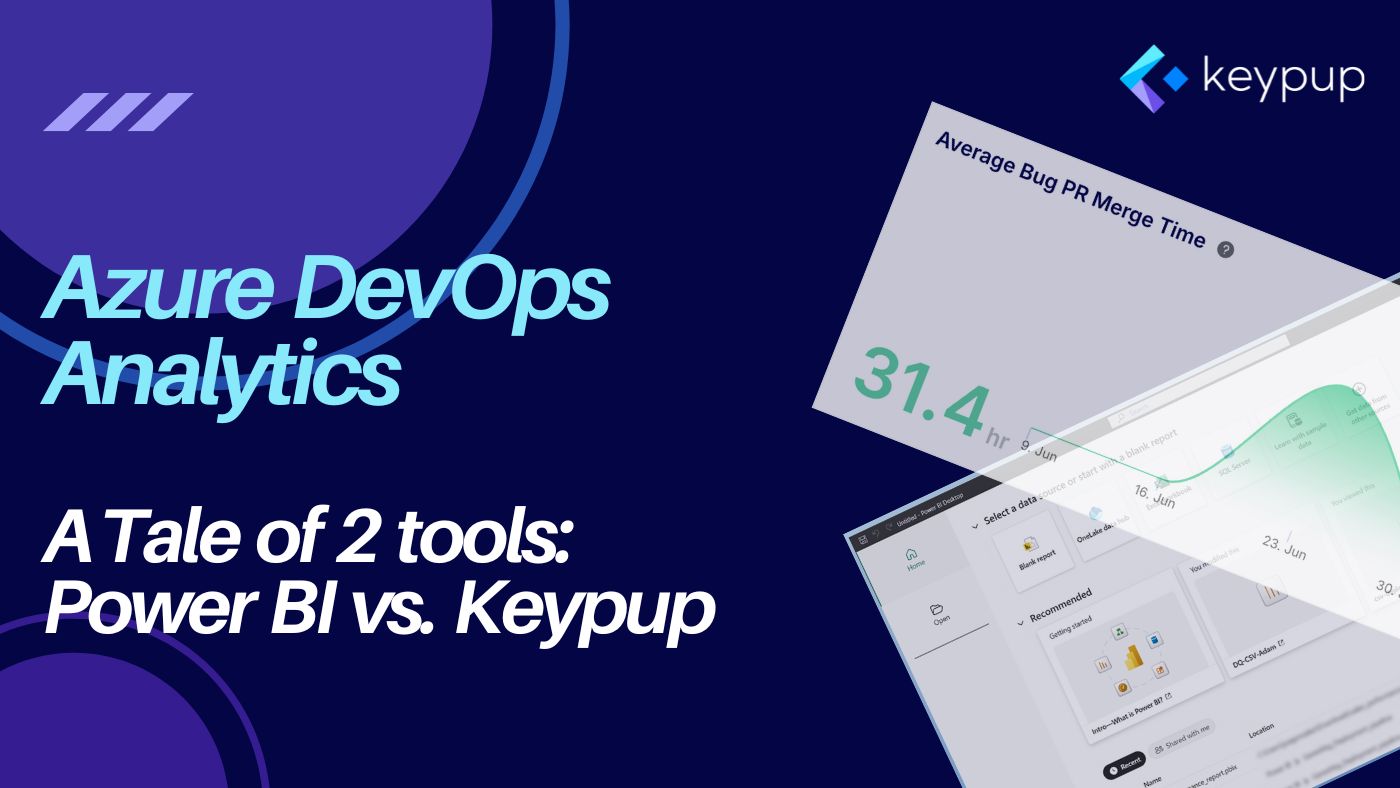
Frustrated with Power BI for Azure DevOps reporting? Learn how a purpose-built platform solves the biggest shortfalls in setup, performance, and data access to deliver instant insights. Illustrated with a real-life example.

Struggling with Azure DevOps reporting? Learn how to overcome the 6 biggest limitations, from basic dashboards to cross-project analytics, and get actionable insights.
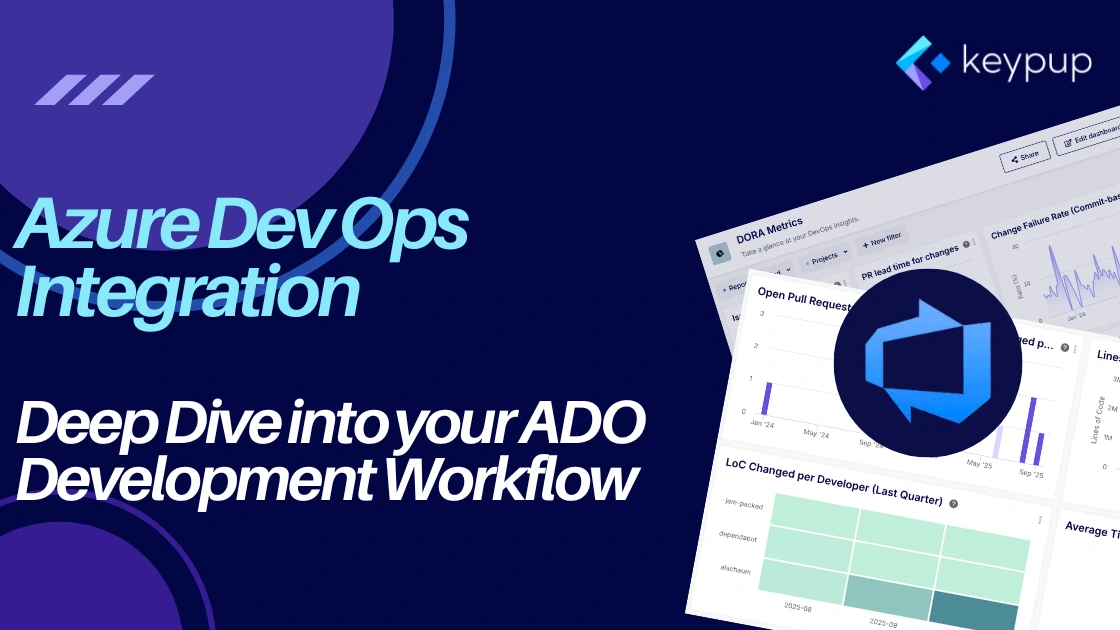
Connect Keypup to Azure DevOps (Cloud & Server) to turn your development data into powerful insights. Track PRs, DORA metrics, and code changes to improve your engineering workflow.

Unsure whether to use DORA or SPACE? Learn the key differences, see when to use each framework, and discover how to combine them for a complete picture of team performance.
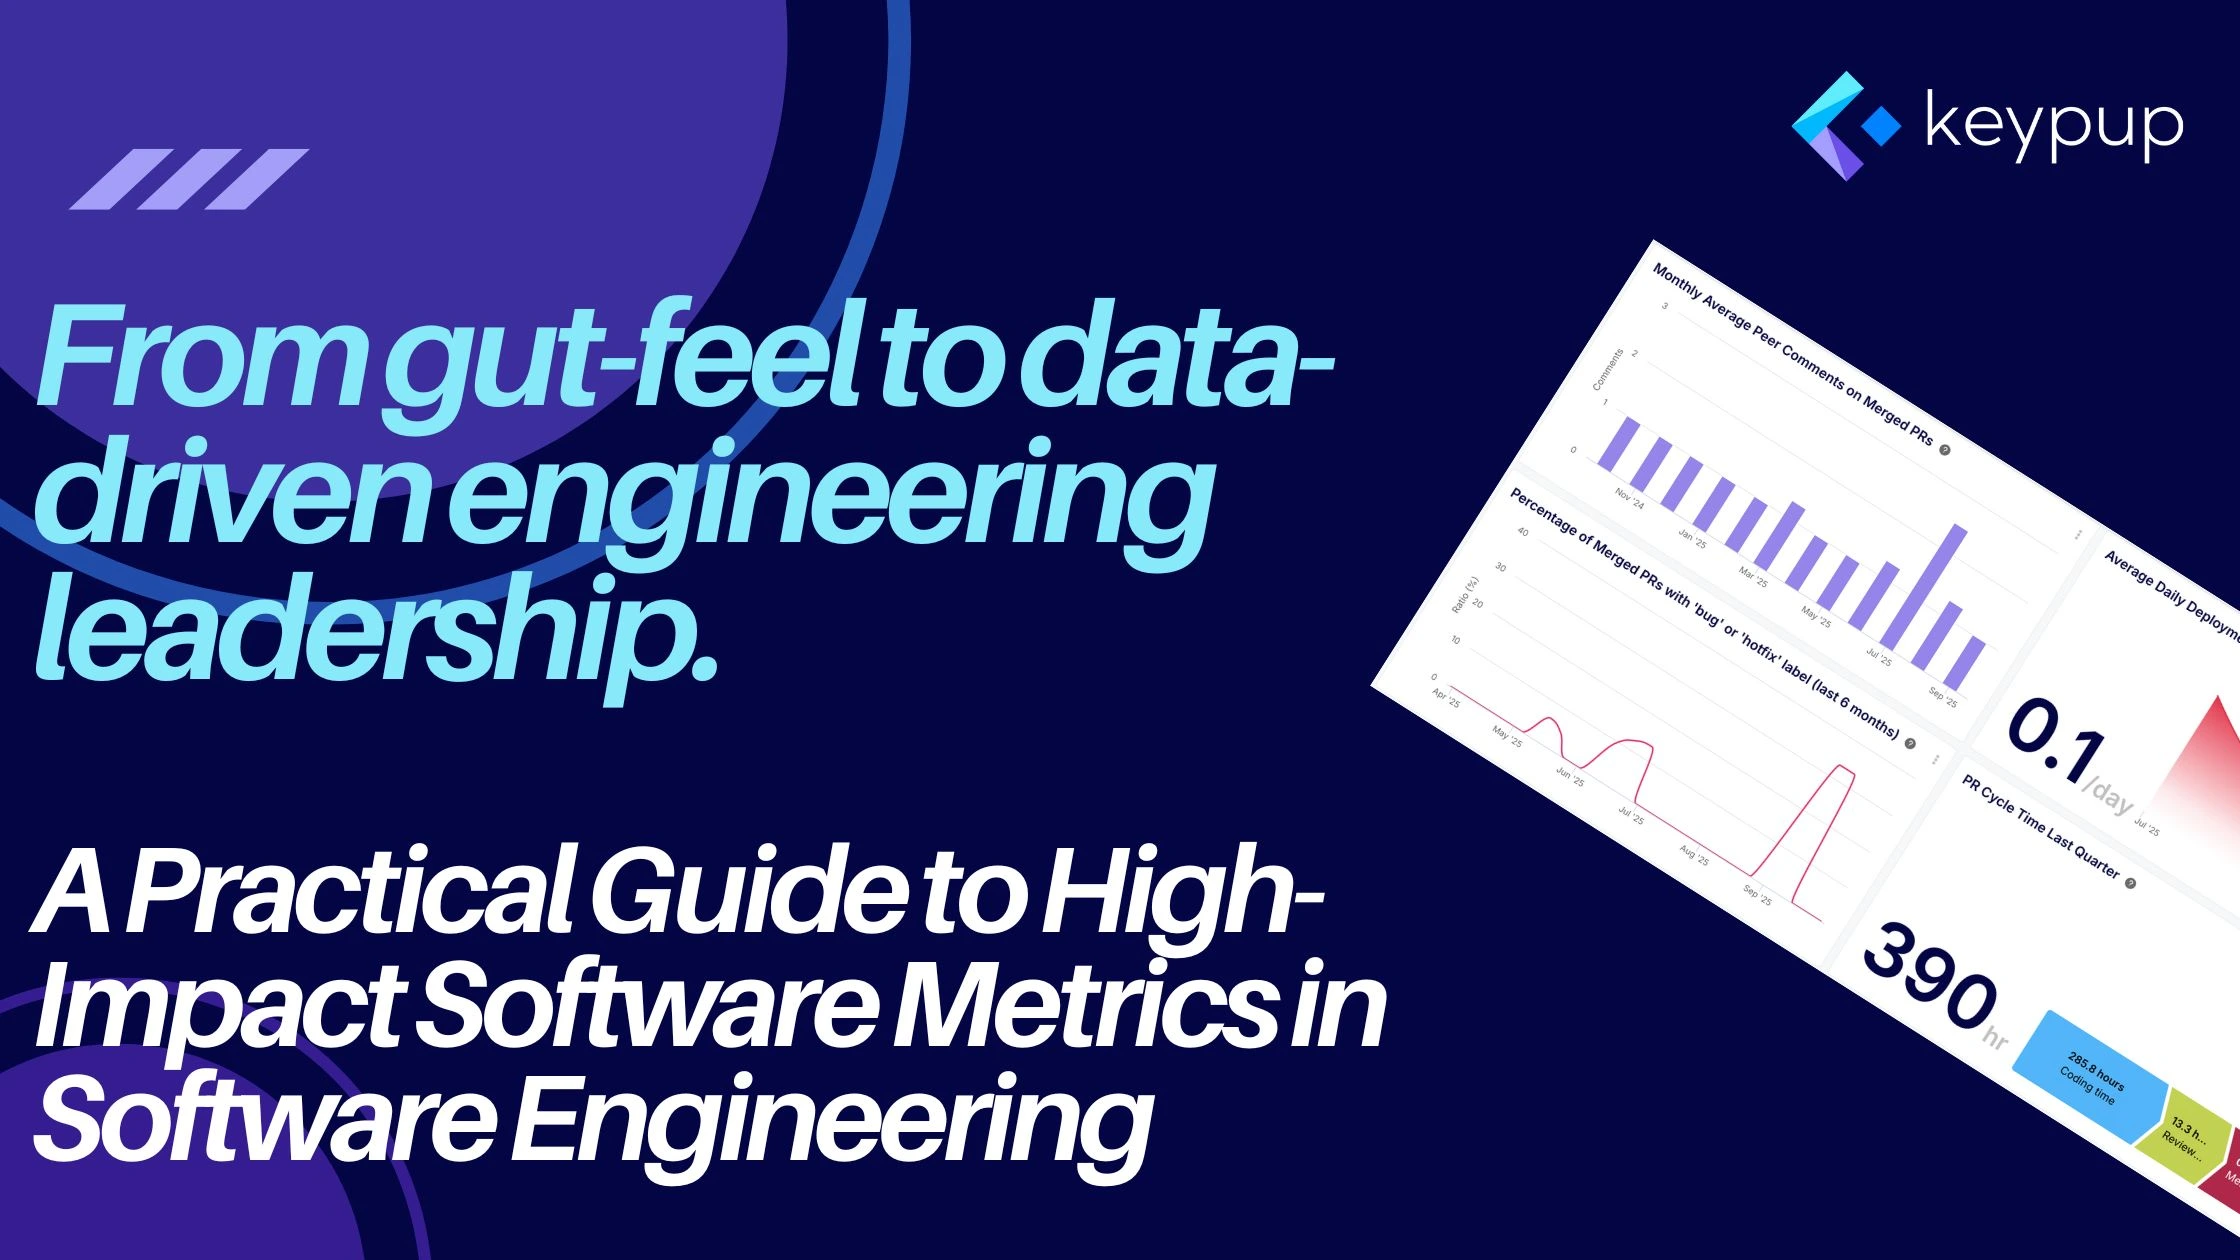
A practical guide to using software metrics in software engineering. Learn how to stop managing with intuition and start using data to track DORA, reduce cycle times, and improve performance.

Unlock powerful software development insights with Keypup Custom Formulas. Learn to build BI-level reports, use operators, and analyze your engineering data like never before.
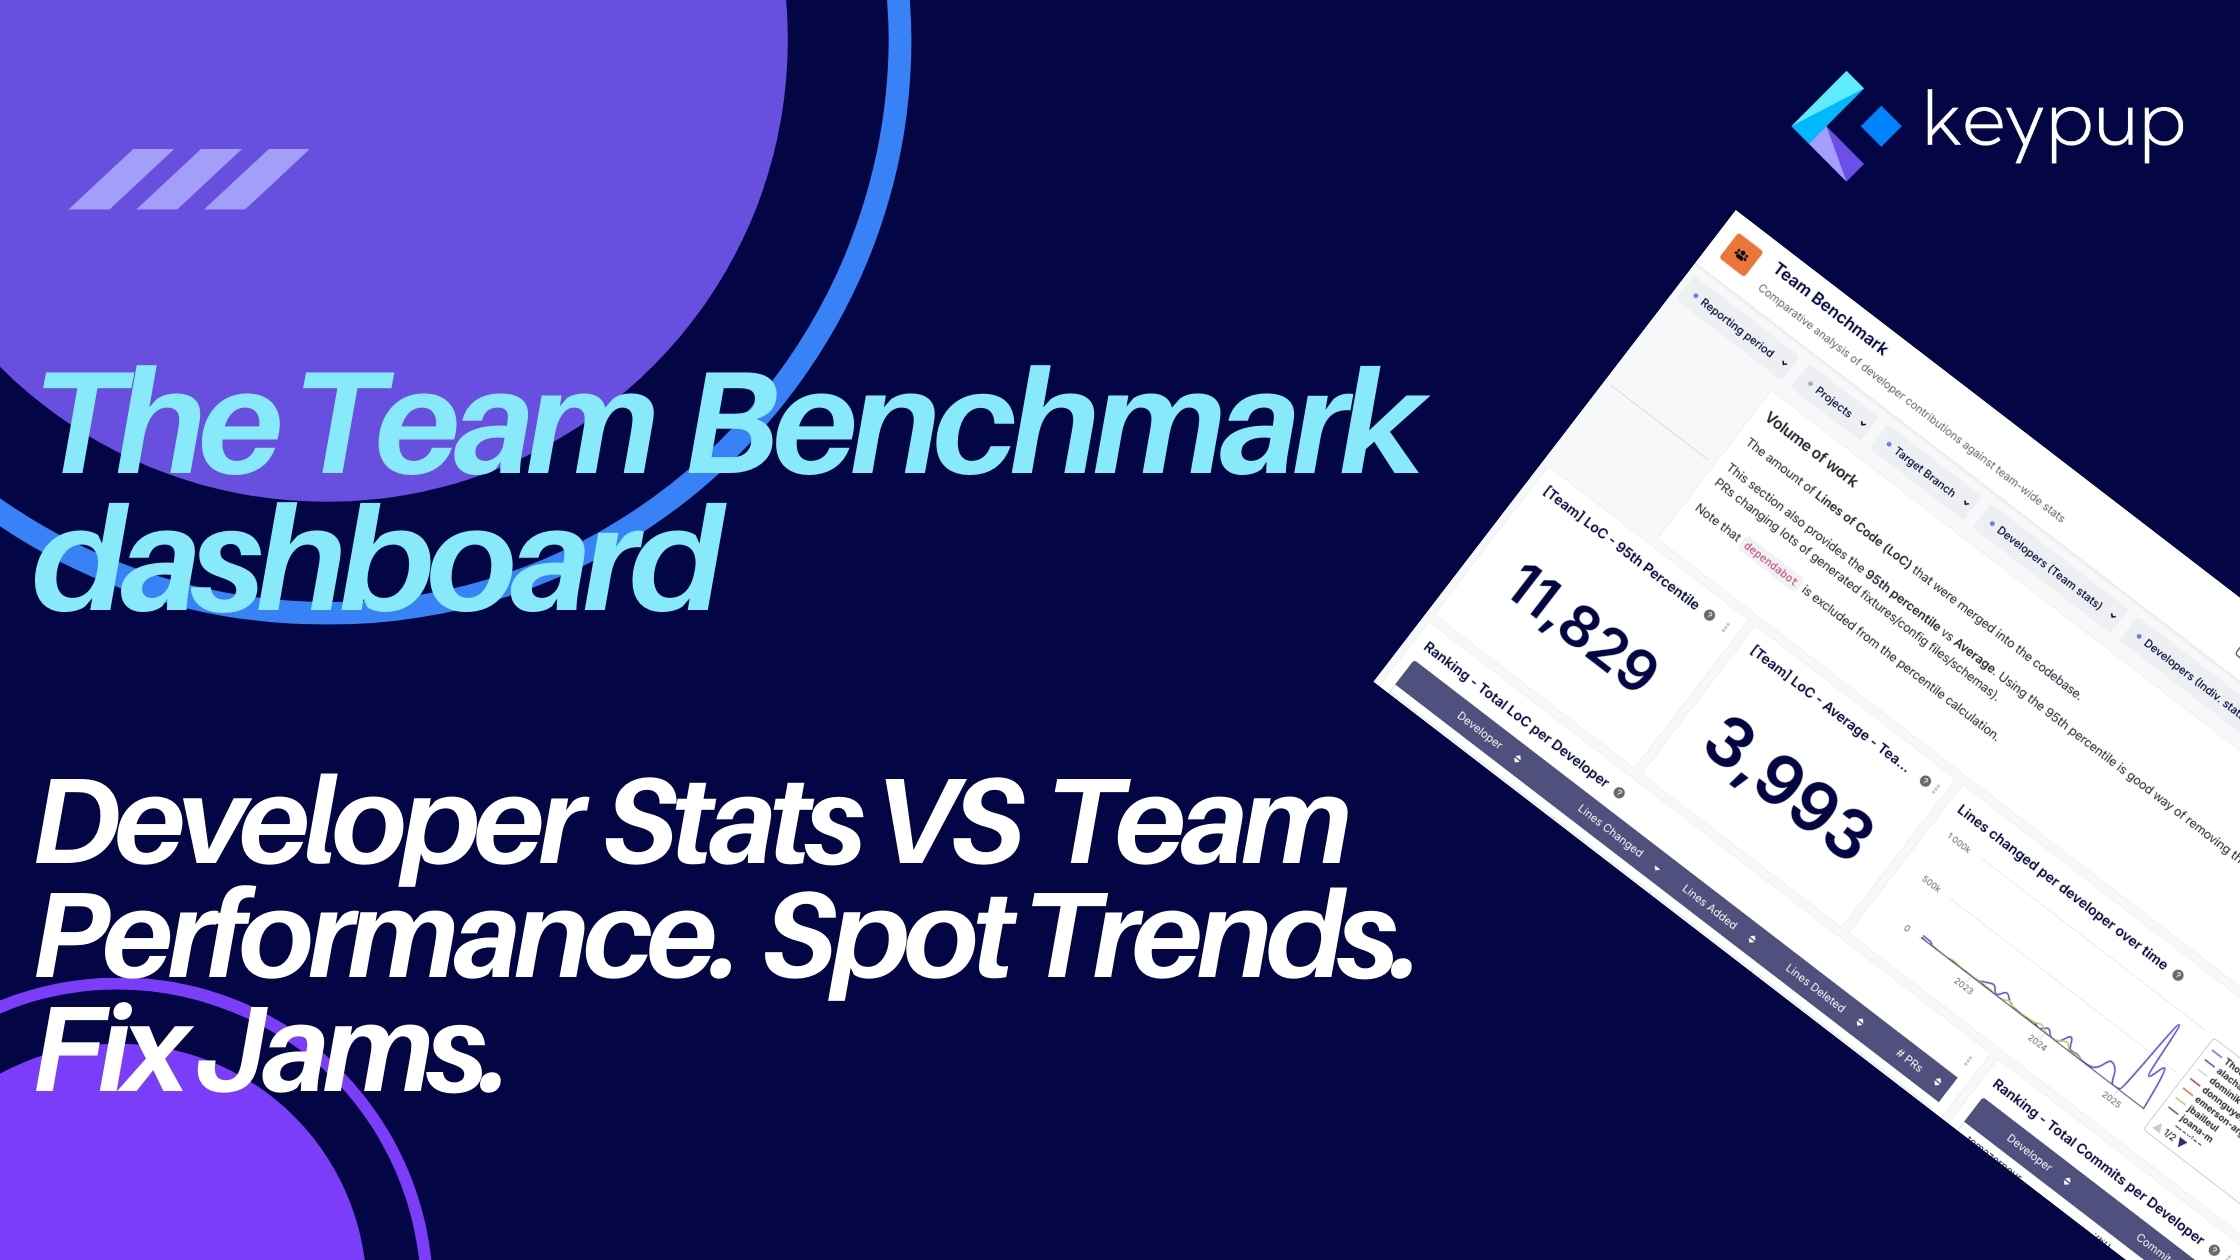
This dashboard is specifically designed to provide a comparative analysis of developer contributions against team-wide statistics, offering a nuanced view of performance, efficiency, and collaboration patterns.

While the SPACE framework provides a robust conceptual model to analyze Developer Productivity, the challenge lies in translating these dimensions into tangible, measurable insights. This is precisely where the Keypup SPACE Software Development Lifecycle (SDLC) analytics dashboard becomes indispensable. It moves beyond subjective assessments and provides factual data to understand, diagnose, and improve the development ecosystem.

Unlock the full potential of your DevOps workflow with the newly released Keypup API. Seamlessly integrate Keypup's powerful insights into your existing tools, automate tasks, and gain unprecedented visibility into your development process. Learn how to create custom Slack bots for streamlined standups, set up proactive monitoring alerts with tools like Datadog and New Relic, and build intelligent, data-driven DevOps flows that adapt to your team's needs. Enhance your team's productivity and build better software, faster, with the Keypup API.

Understanding and optimizing development team performance is a critical concern for engineering leaders. Recently, a customer reached out expressing their pressing need: "We are facing some problems about our dev team performance. Do you have a bunch or metrics that could help us compare and check the people performance?" This interaction highlighted a common challenge – a lack of clear metrics and tools to assess and improve team effectiveness. This blog post explores their situation and our data-driven approach to helping them gain valuable insights.