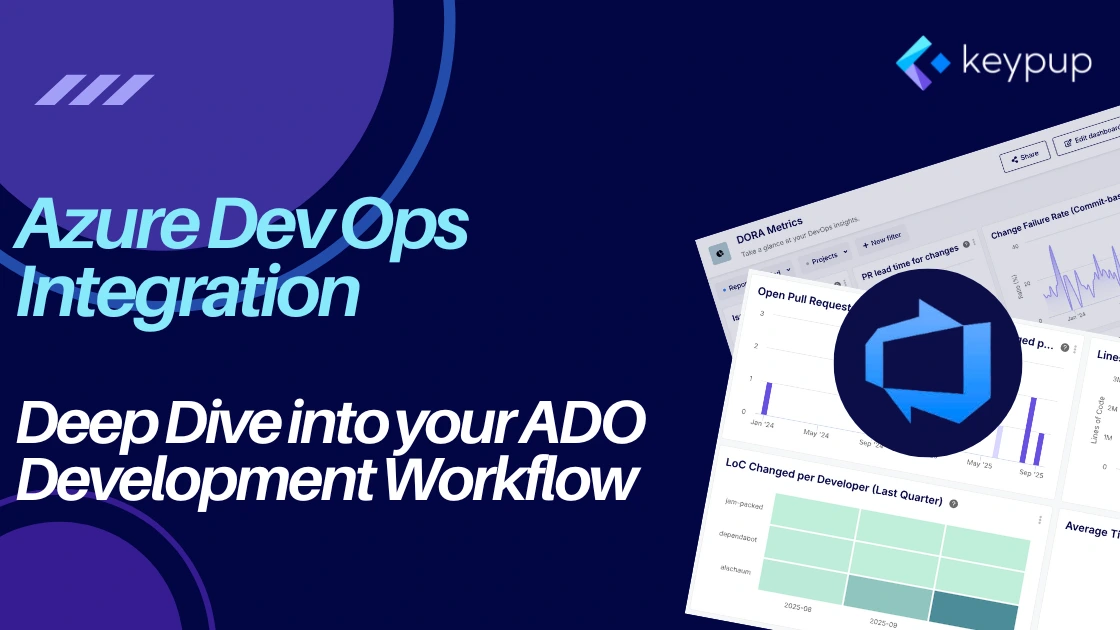
We are thrilled to announce one of our most requested integrations: Microsoft Azure DevOps! You can now connect your Azure DevOps organizations directly to Keypup, empowering your team with powerful analytics and actionable insights. This new integration supports both Azure DevOps Cloud and Azure DevOps Server (version 2022.1and later), ensuring you can benefit from Keypup regardless of how you host your repositories.
This integration goes beyond surface-level metrics.It allows you to import a rich dataset from your Azure DevOps projects, giving you a granular view of your engineering health, productivity, and processes.
What Data Can You Analyze from Azure DevOps?
Once connected, Keypup automatically imports and analyzes a wide range of development data, including:
Pull Requests: The complete lifecycle, from creation and updates to merges and closure.
Reviews & Comments: All reviewer feedback, comments, and discussions associated with each pull request.
Commits: The individual commits linked to your pull requests, including their messages and code changes.
Build Statuses: The status of CI/CD builds triggered by your pull requests, allowing you to correlate code changes with build success or failure.
- Activity Events: A full event stream including assignments, review requests, and status changes, giving you a complete picture of your PR workflow.
Use Case Deep-Dive: Tracking Volume of Work with Lines of Code
While lines of code (LoC) are not a direct measure of productivity, they are an invaluable indicator of effort, complexity, and the scale of change. Understanding LoC metrics can help you manage workload, improve your review process, and spot important trends. With the Keypup and Azure DevOps integration, you can track this data in several powerful ways.
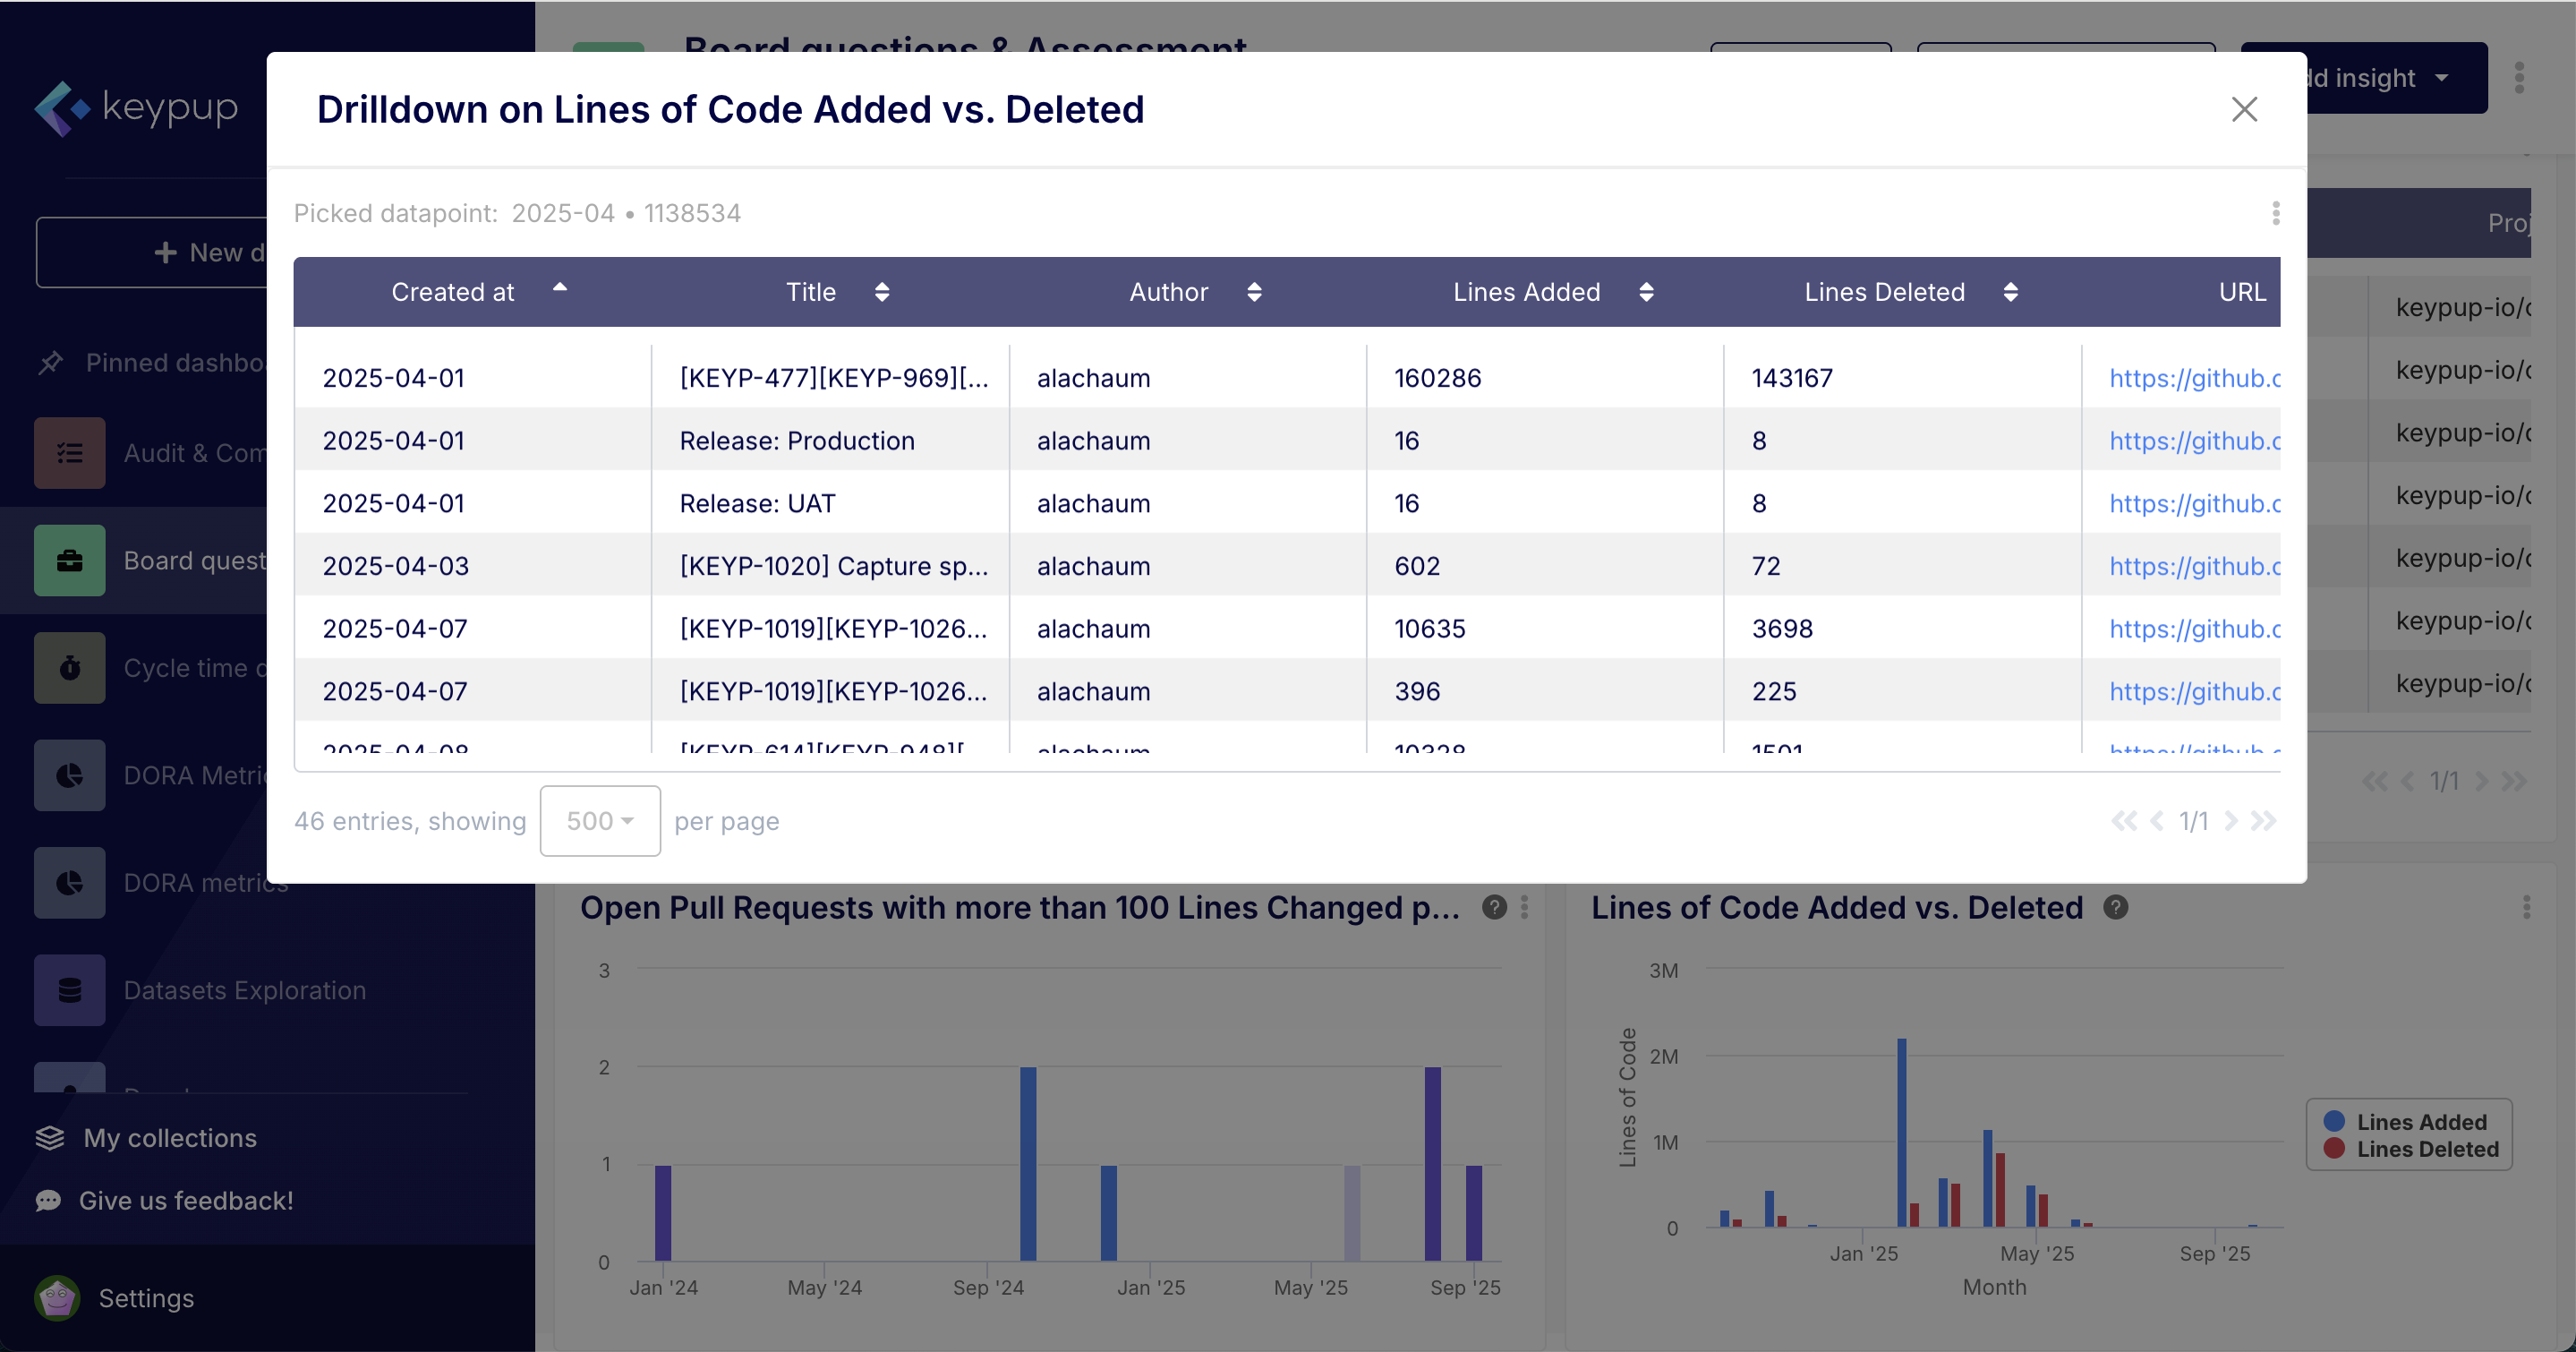
1. Sizing and Scoping Work on Individual Pull Requests
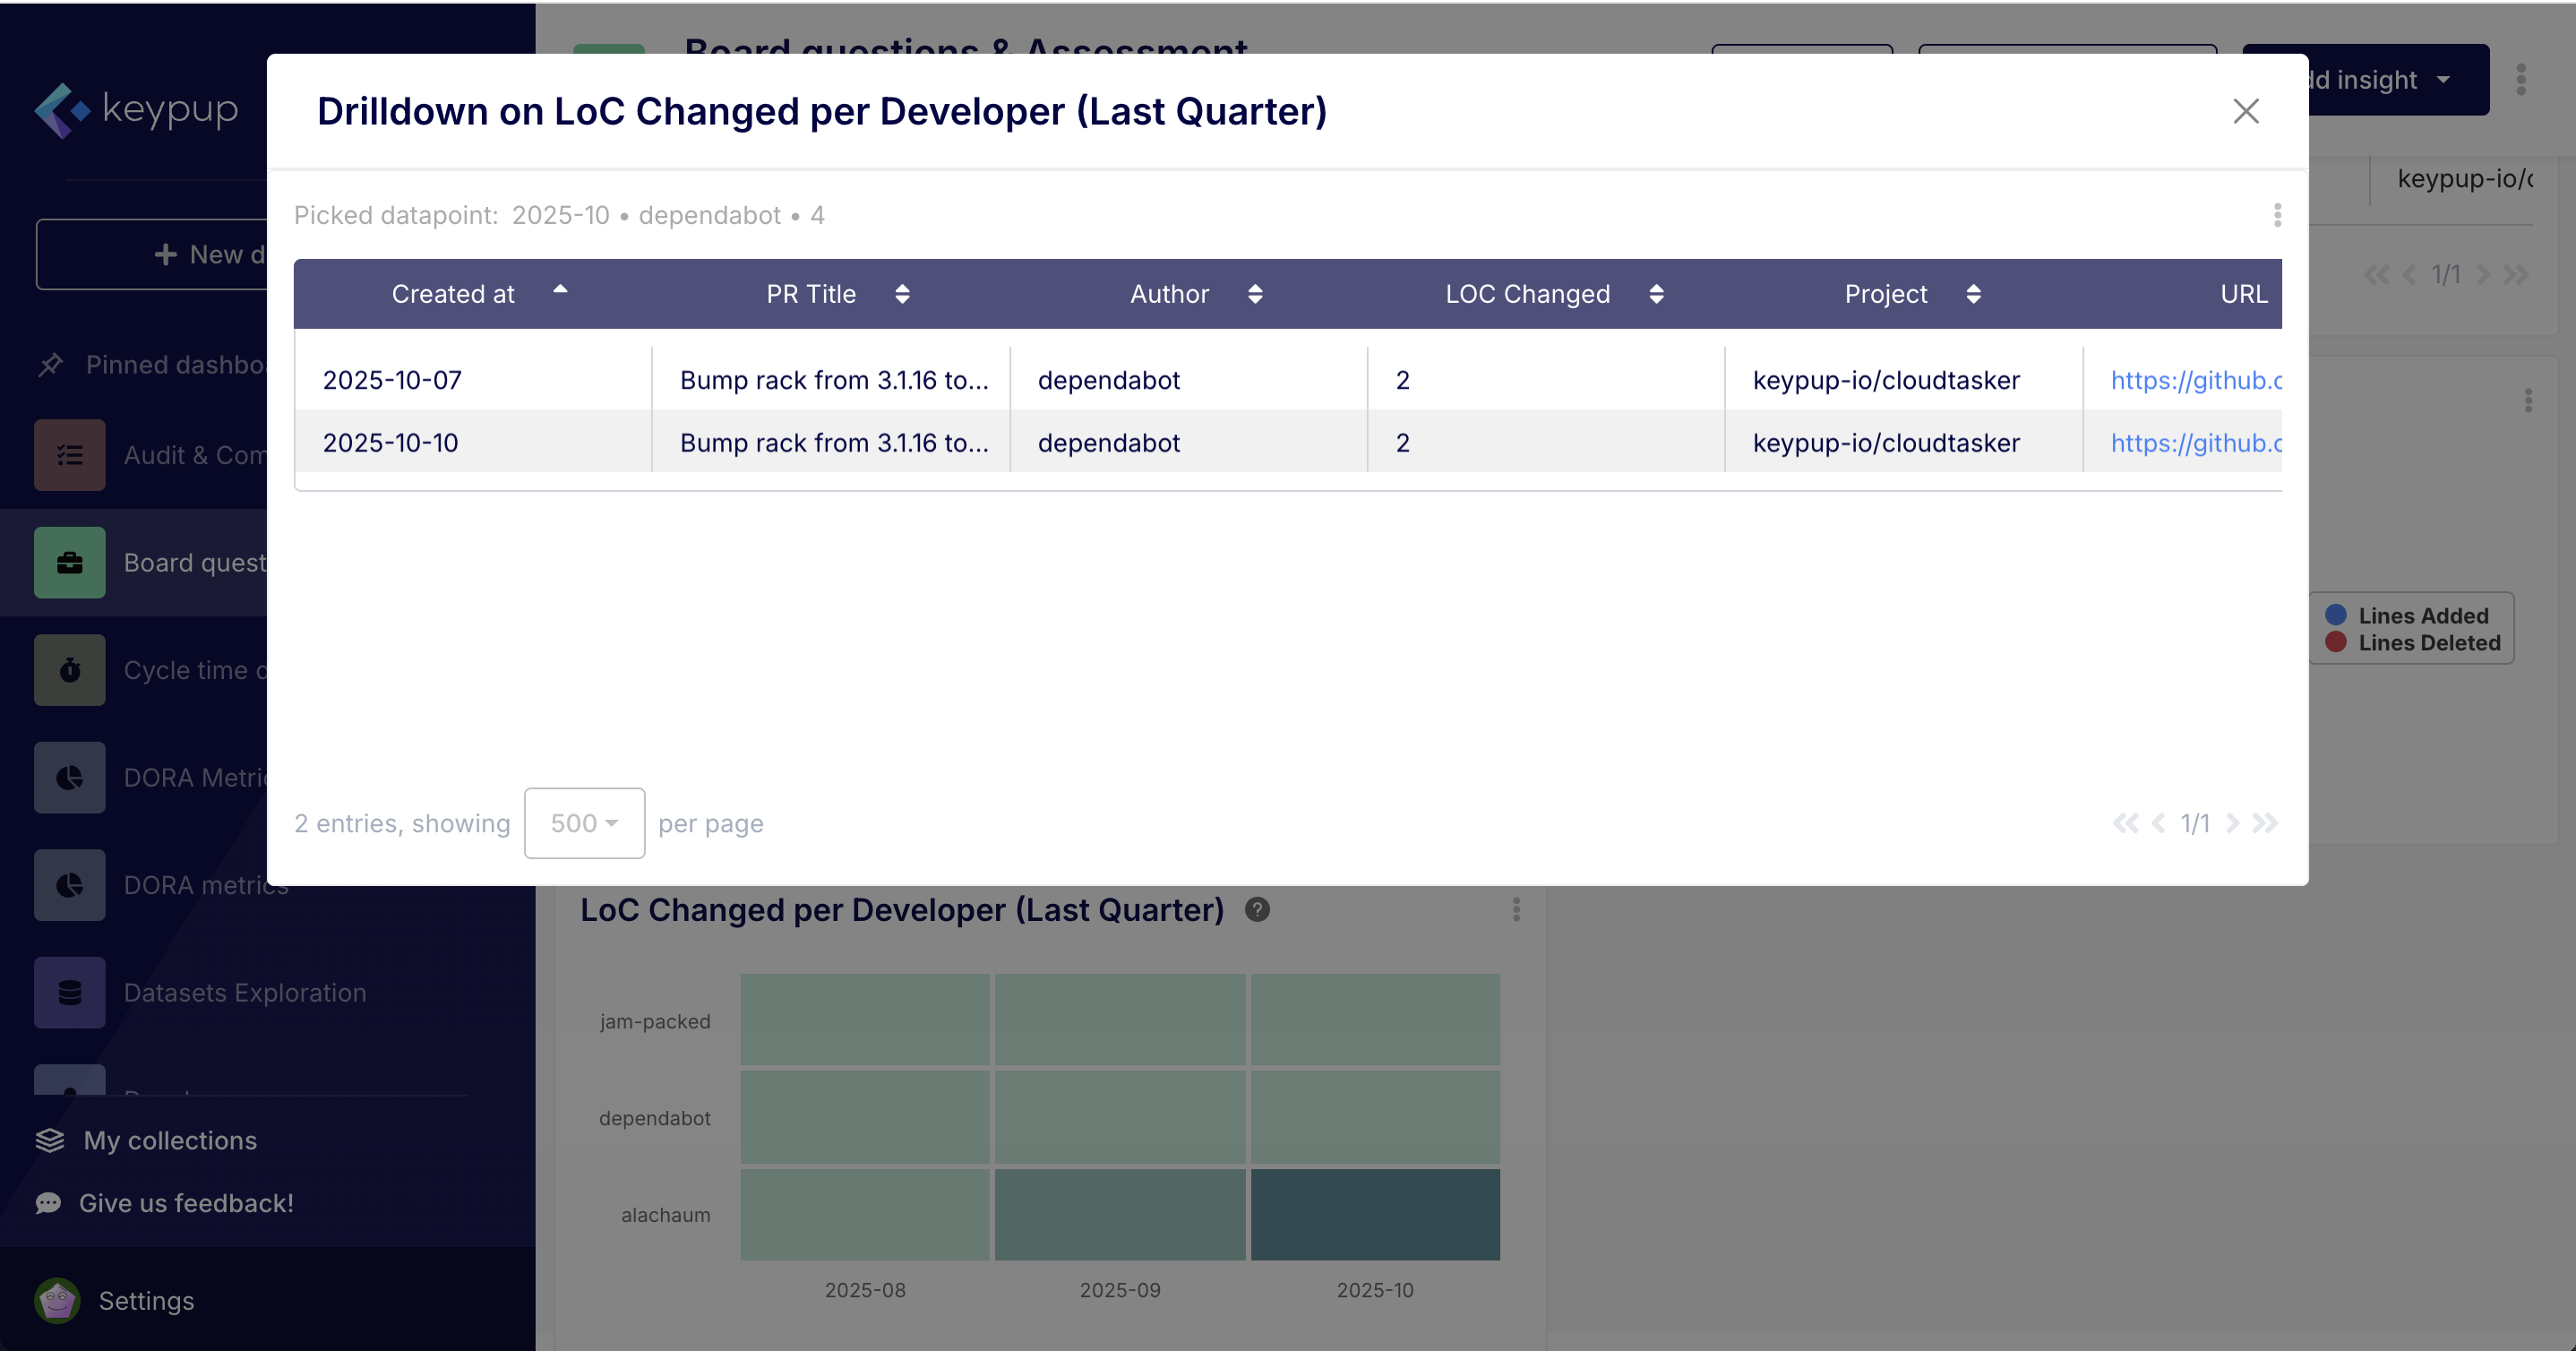
At the most granular level, Keypup allows you to see the exact number of lines added and deleted for every single pull request.
Why it matters: A developer or reviewer can instantly gauge the size of a change. A PR with +1000 lines of new code requires a different review approach than one with +50 lines. This helps in allocating a proportionate amount of time for review and testing. It also helps developers break down large, complex features into smaller, more manageable PRs, which are easier to review and less risky to merge.
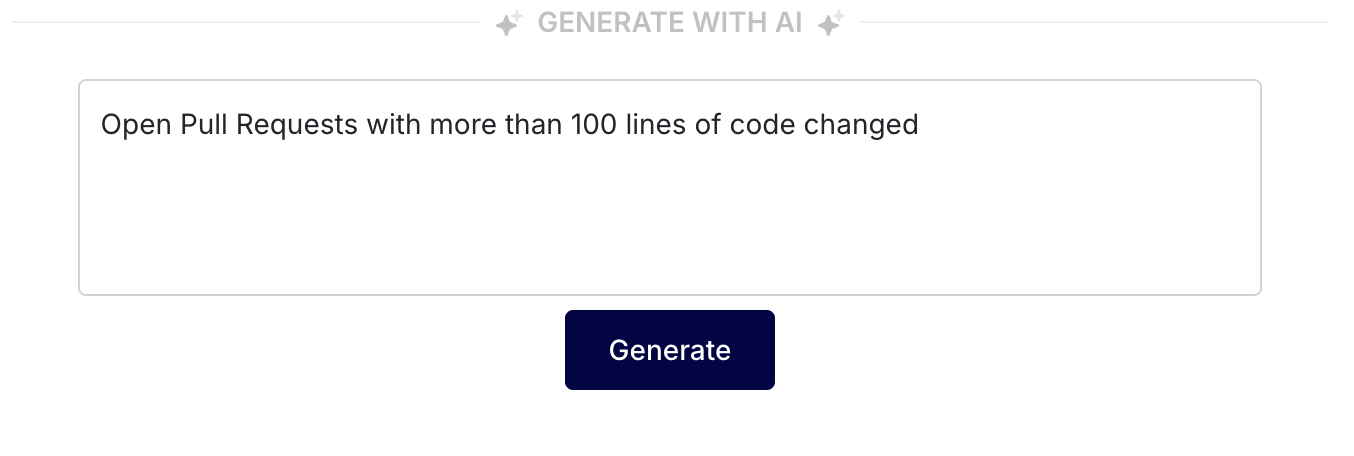
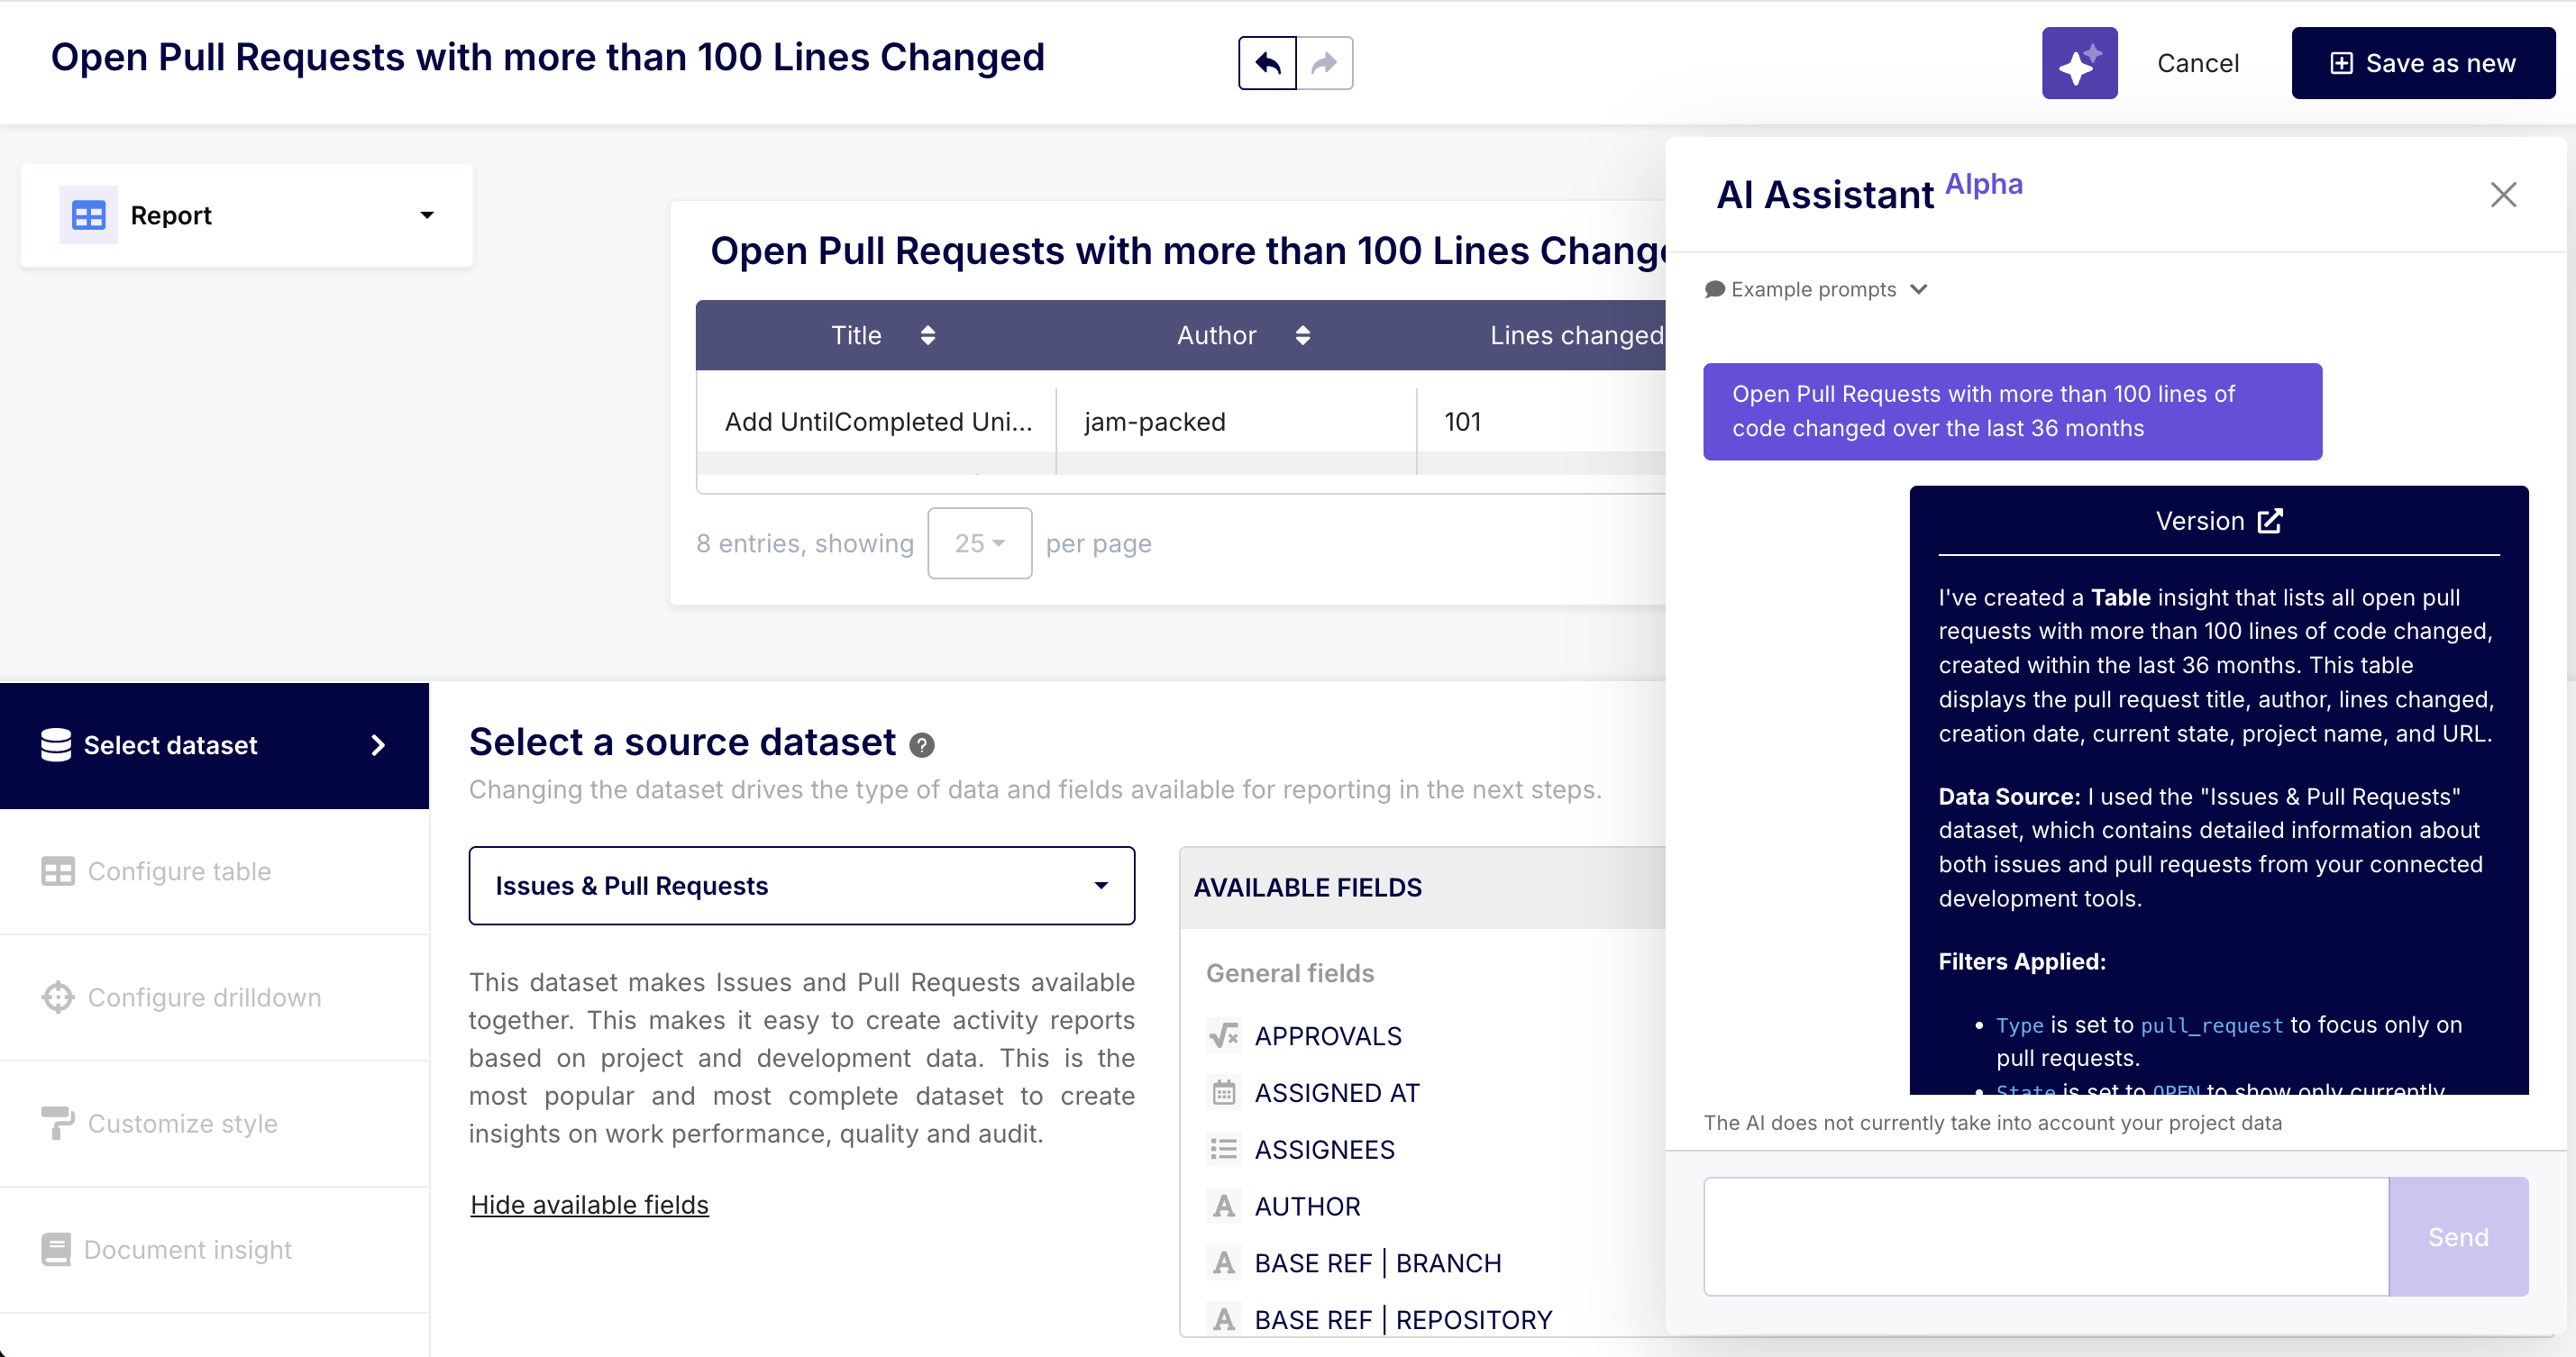
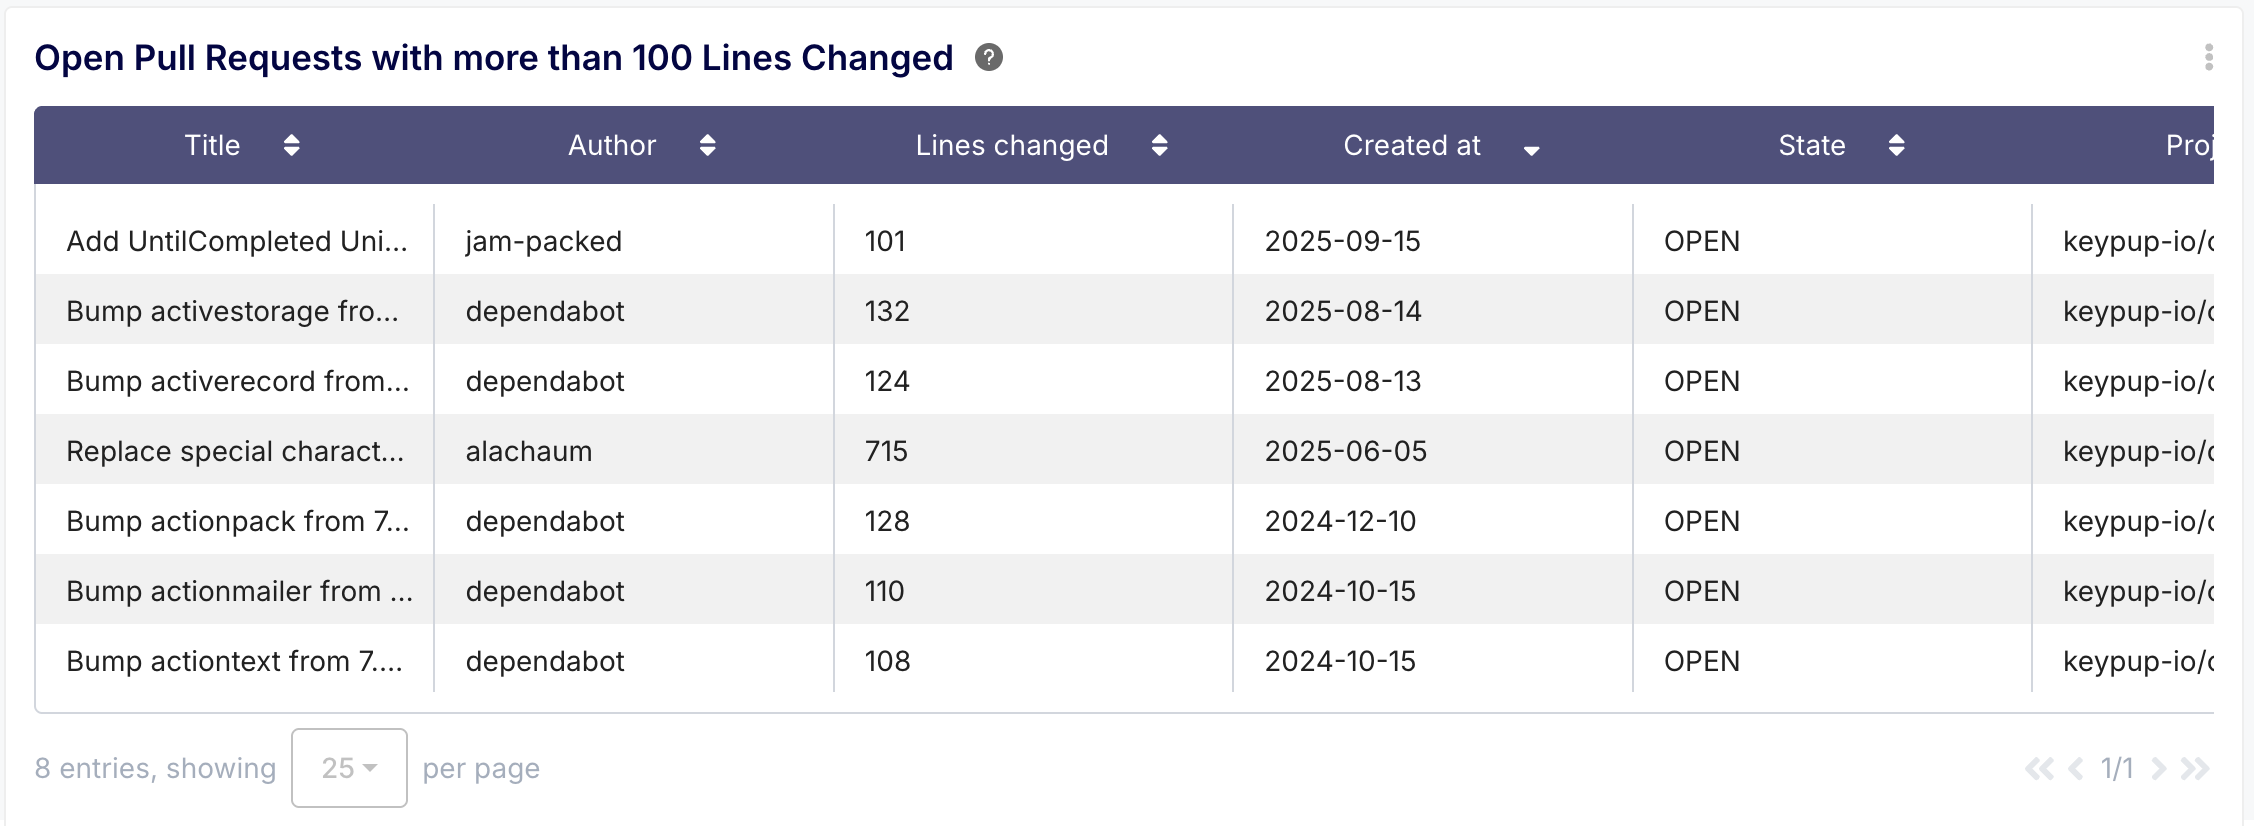
- Practical Example: In your Keypup dashboard, you can create a live report of "Open Pull Requests with more than 100 lines of code changed". This automatically flags large PRs that might need more reviewers or a more detailed architectural discussion before merging.
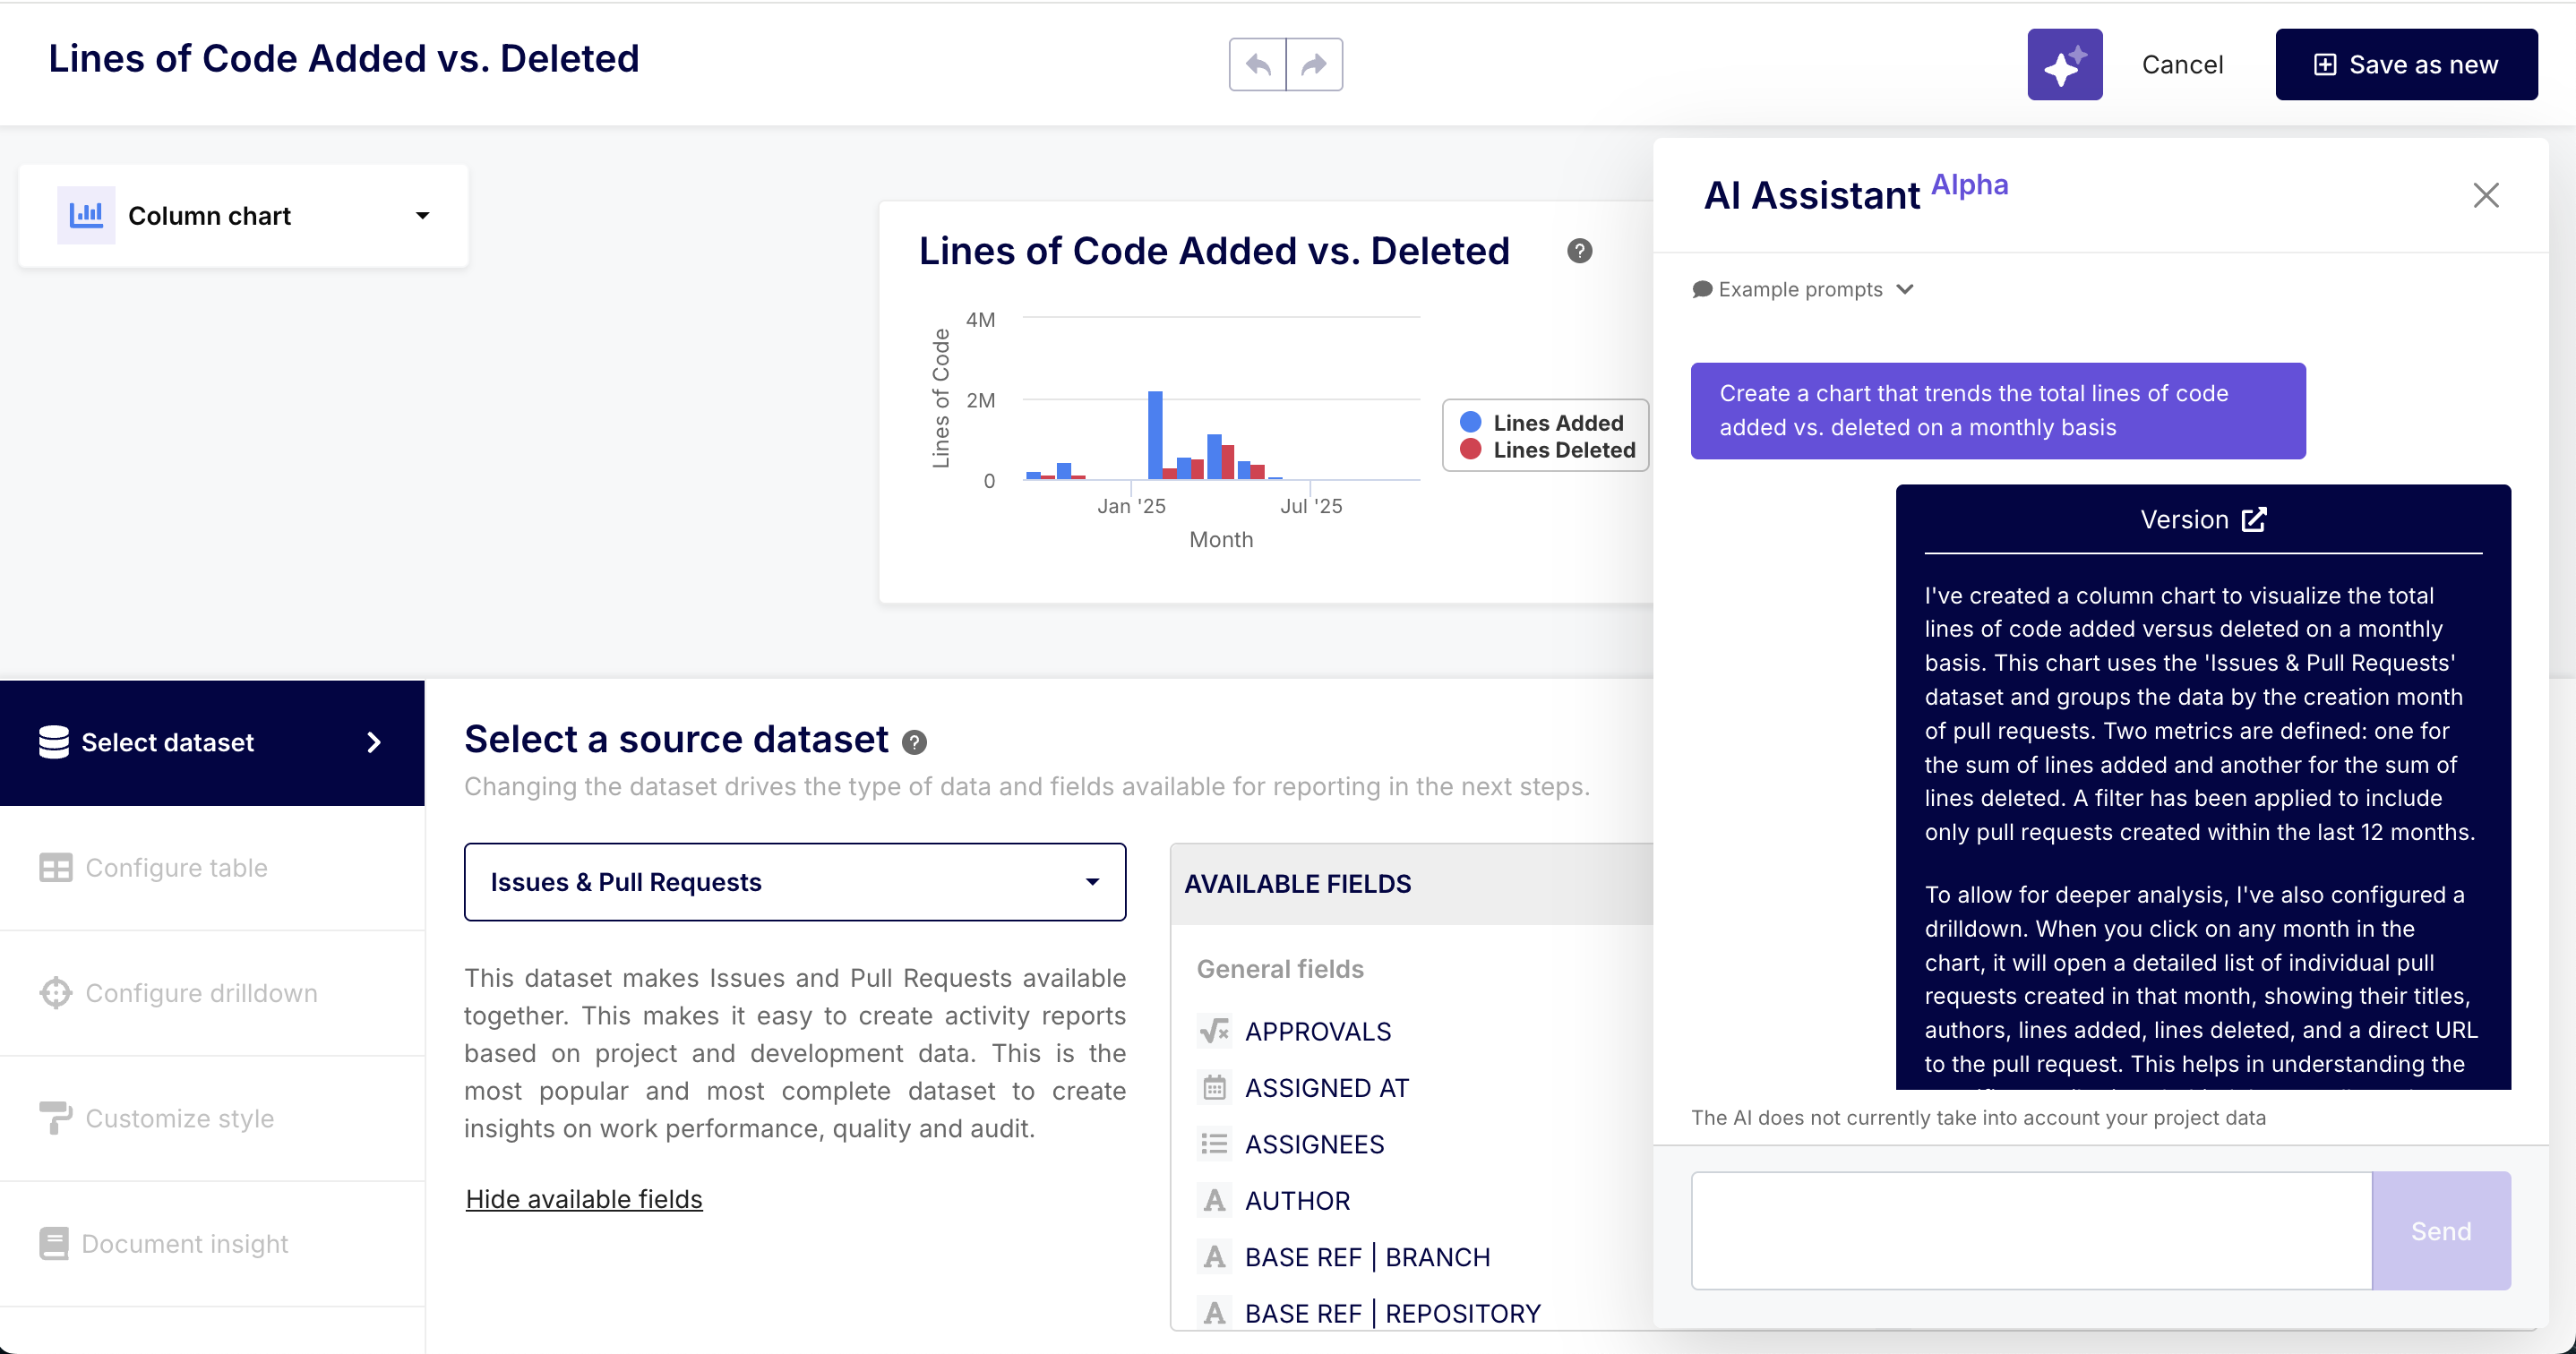
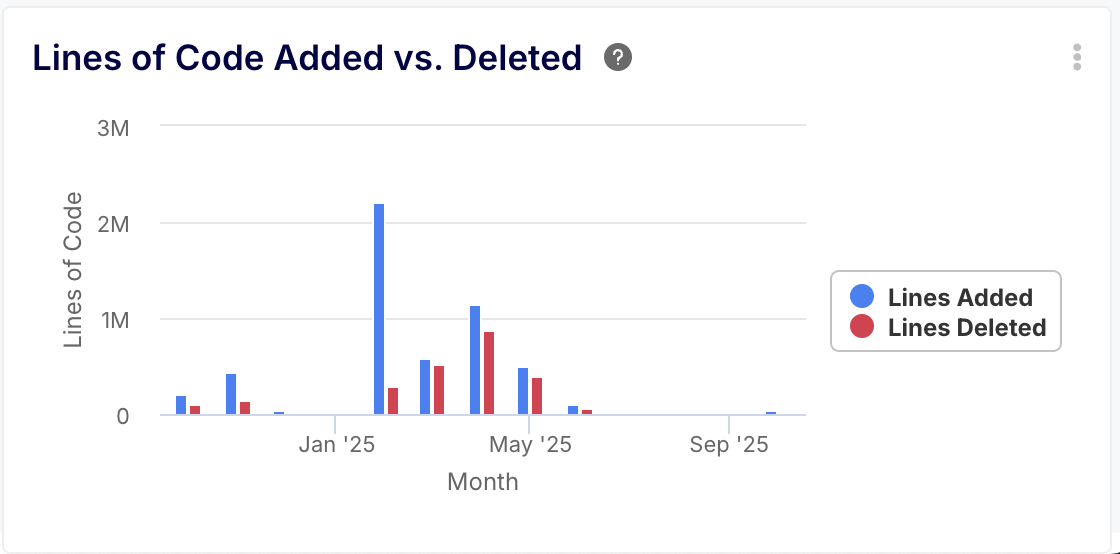
2. Visualizing Team-Level Activity Over Time
Aggregating LoC metrics over time provides a powerful visualization of your team's development rhythm.
Why it matters: It helps you understand the dynamic and flow of your development cycle. Are you seeing a consistent volume of change sprint-over-sprint? Did a recent process change result in more, smaller PRs, or fewer, larger ones? This data helps team leads and managers understand capacity and identify potential roadblocks.
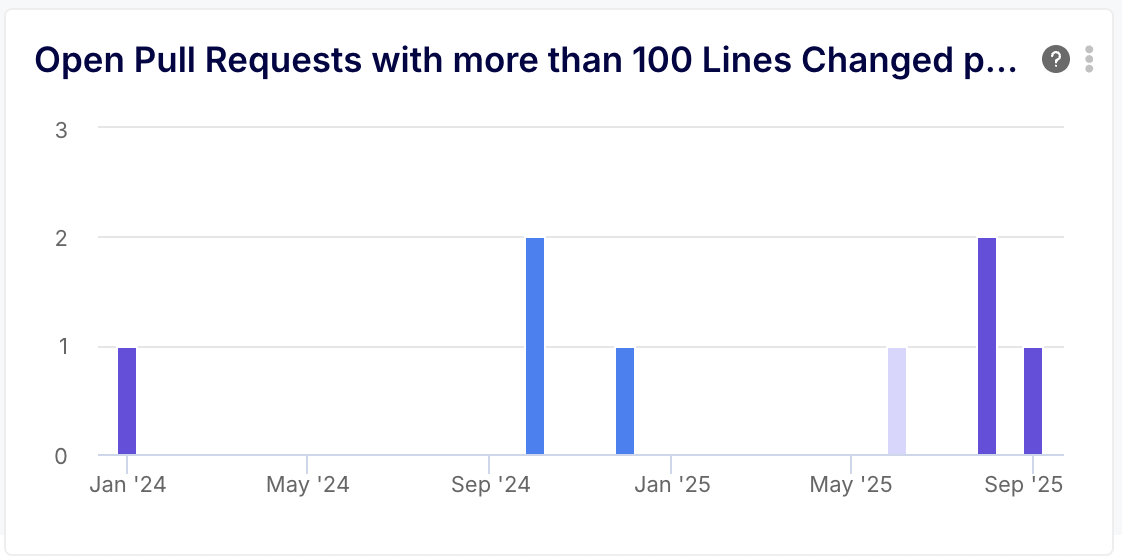
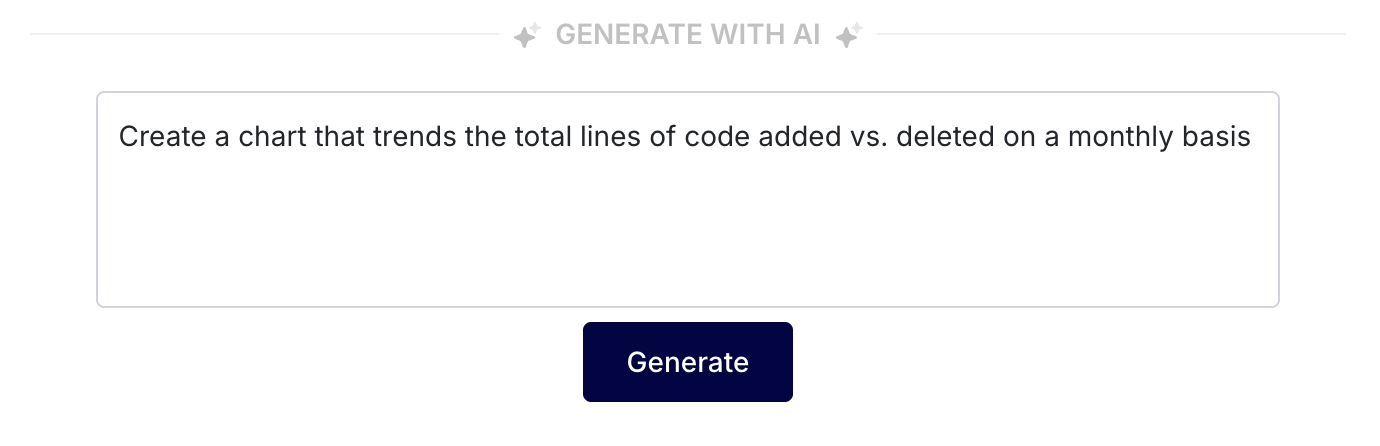
- Practical Example: You can create a chart that trends the total lines of code added vs. deleted by your team on a weekly or monthly basis. You might notice a huge spike in lines deleted, which could correlate with a major refactoring effort that improved code health. Conversely, a sustained drop in LoC might indicate a hidden bottleneck that needs investigation.
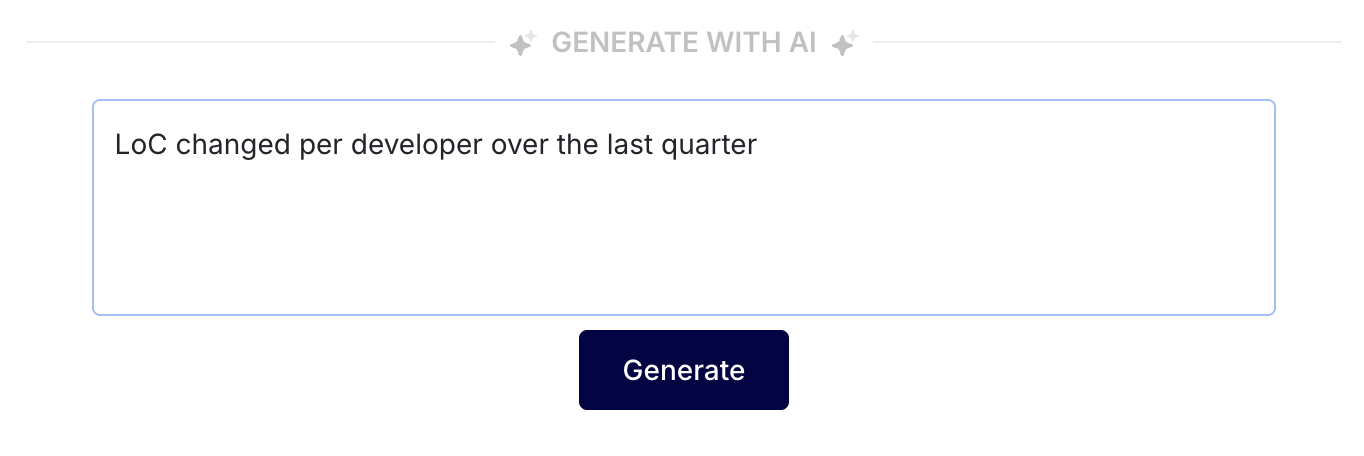
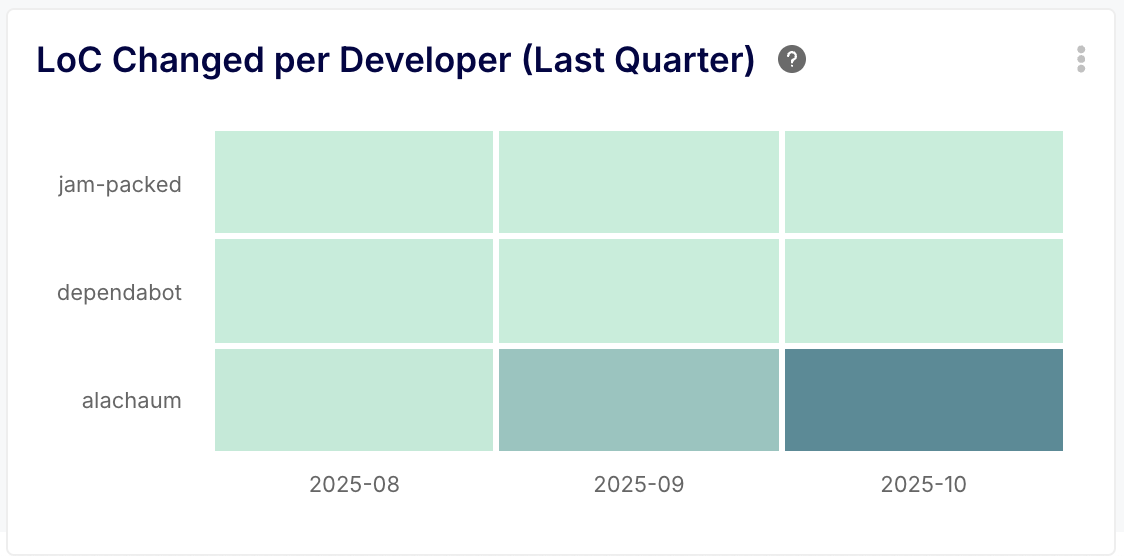
3. Understanding Individual Workload and Contribution Patterns
By filtering LoC metrics by developer, you can gain insights into workload distribution and the nature of individual contributions. Note: This should be used for understanding and support, not for performance evaluation.
Why it matters: It helps you ensure that work is distributed evenly across the team. It can also highlight the different roles developers play. A developer with a high number of lines deleted might be your go-to person for paying down technical debt, while another with a high number of lines added is likely focused on shipping new features.
- Practical Example: A manager could create a report showing the LoC changed per developer over the last quarter. If one developer has a significantly higher volume than everyone else, it might be a sign of potential burnout and a conversation starter about workload balance. It could also reveal that a senior developer is taking on the bulk of the complex, large-scale tasks, presenting an opportunity to spread that knowledge through pairing and mentorship.

Unlock Even More Benefits
Beyond tracking lines of code, the Azure DevOps integration enables you to:
Measure DORA Metrics: Automatically calculate industry-standard metrics like Deployment Frequency, Lead Time for Changes, Change Failure Rate, and Mean Time to Recovery to benchmark and improve your DevOps performance.
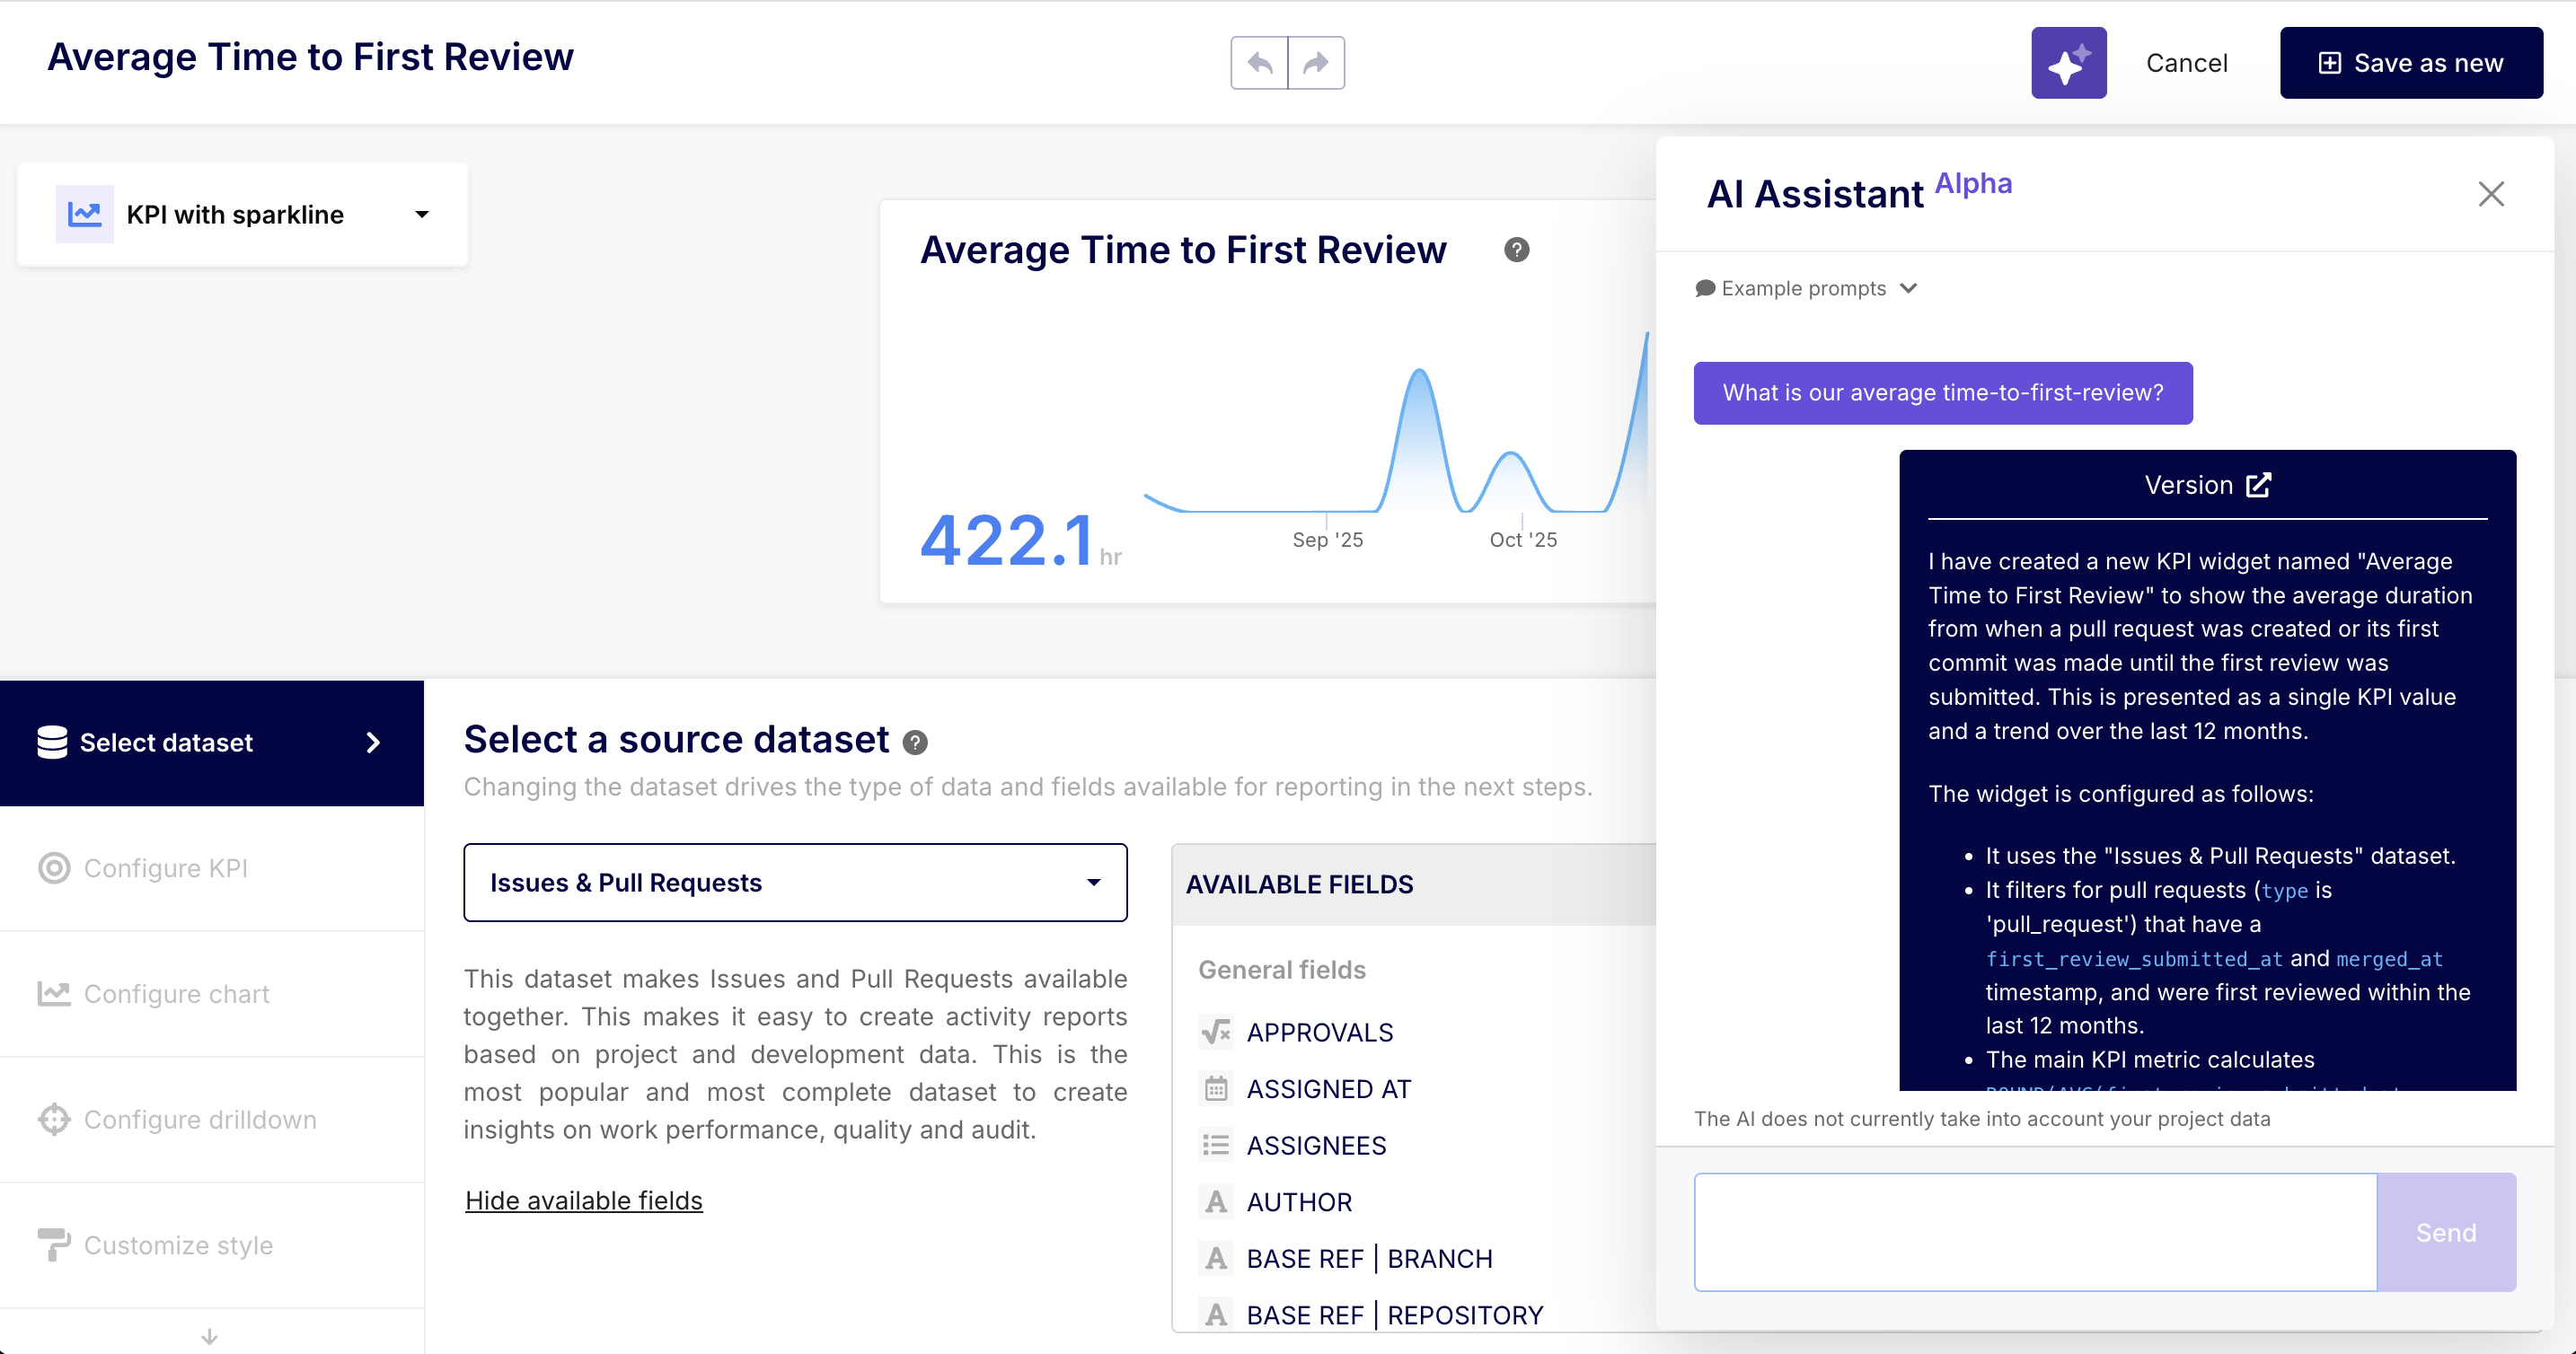
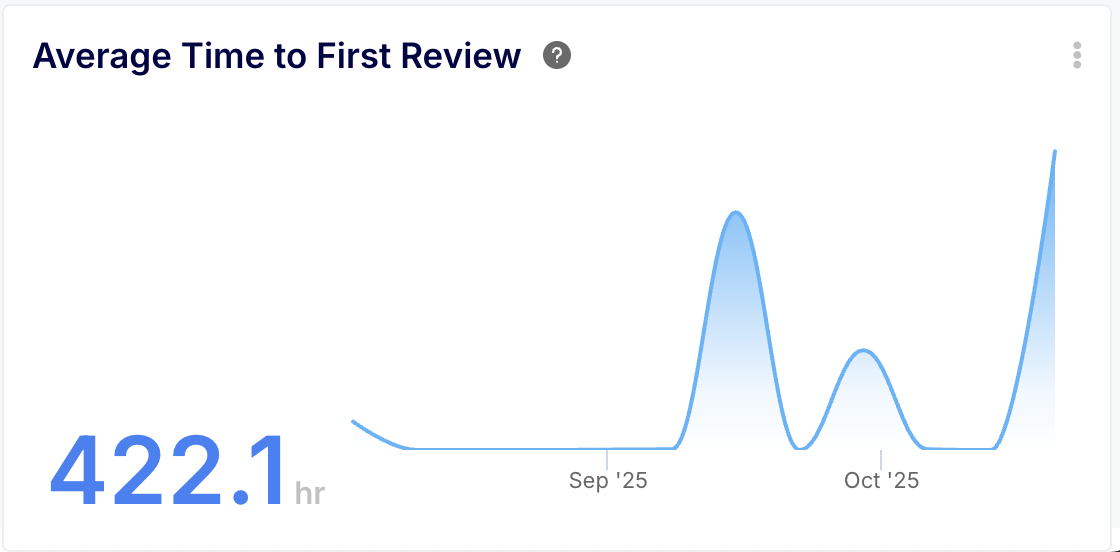
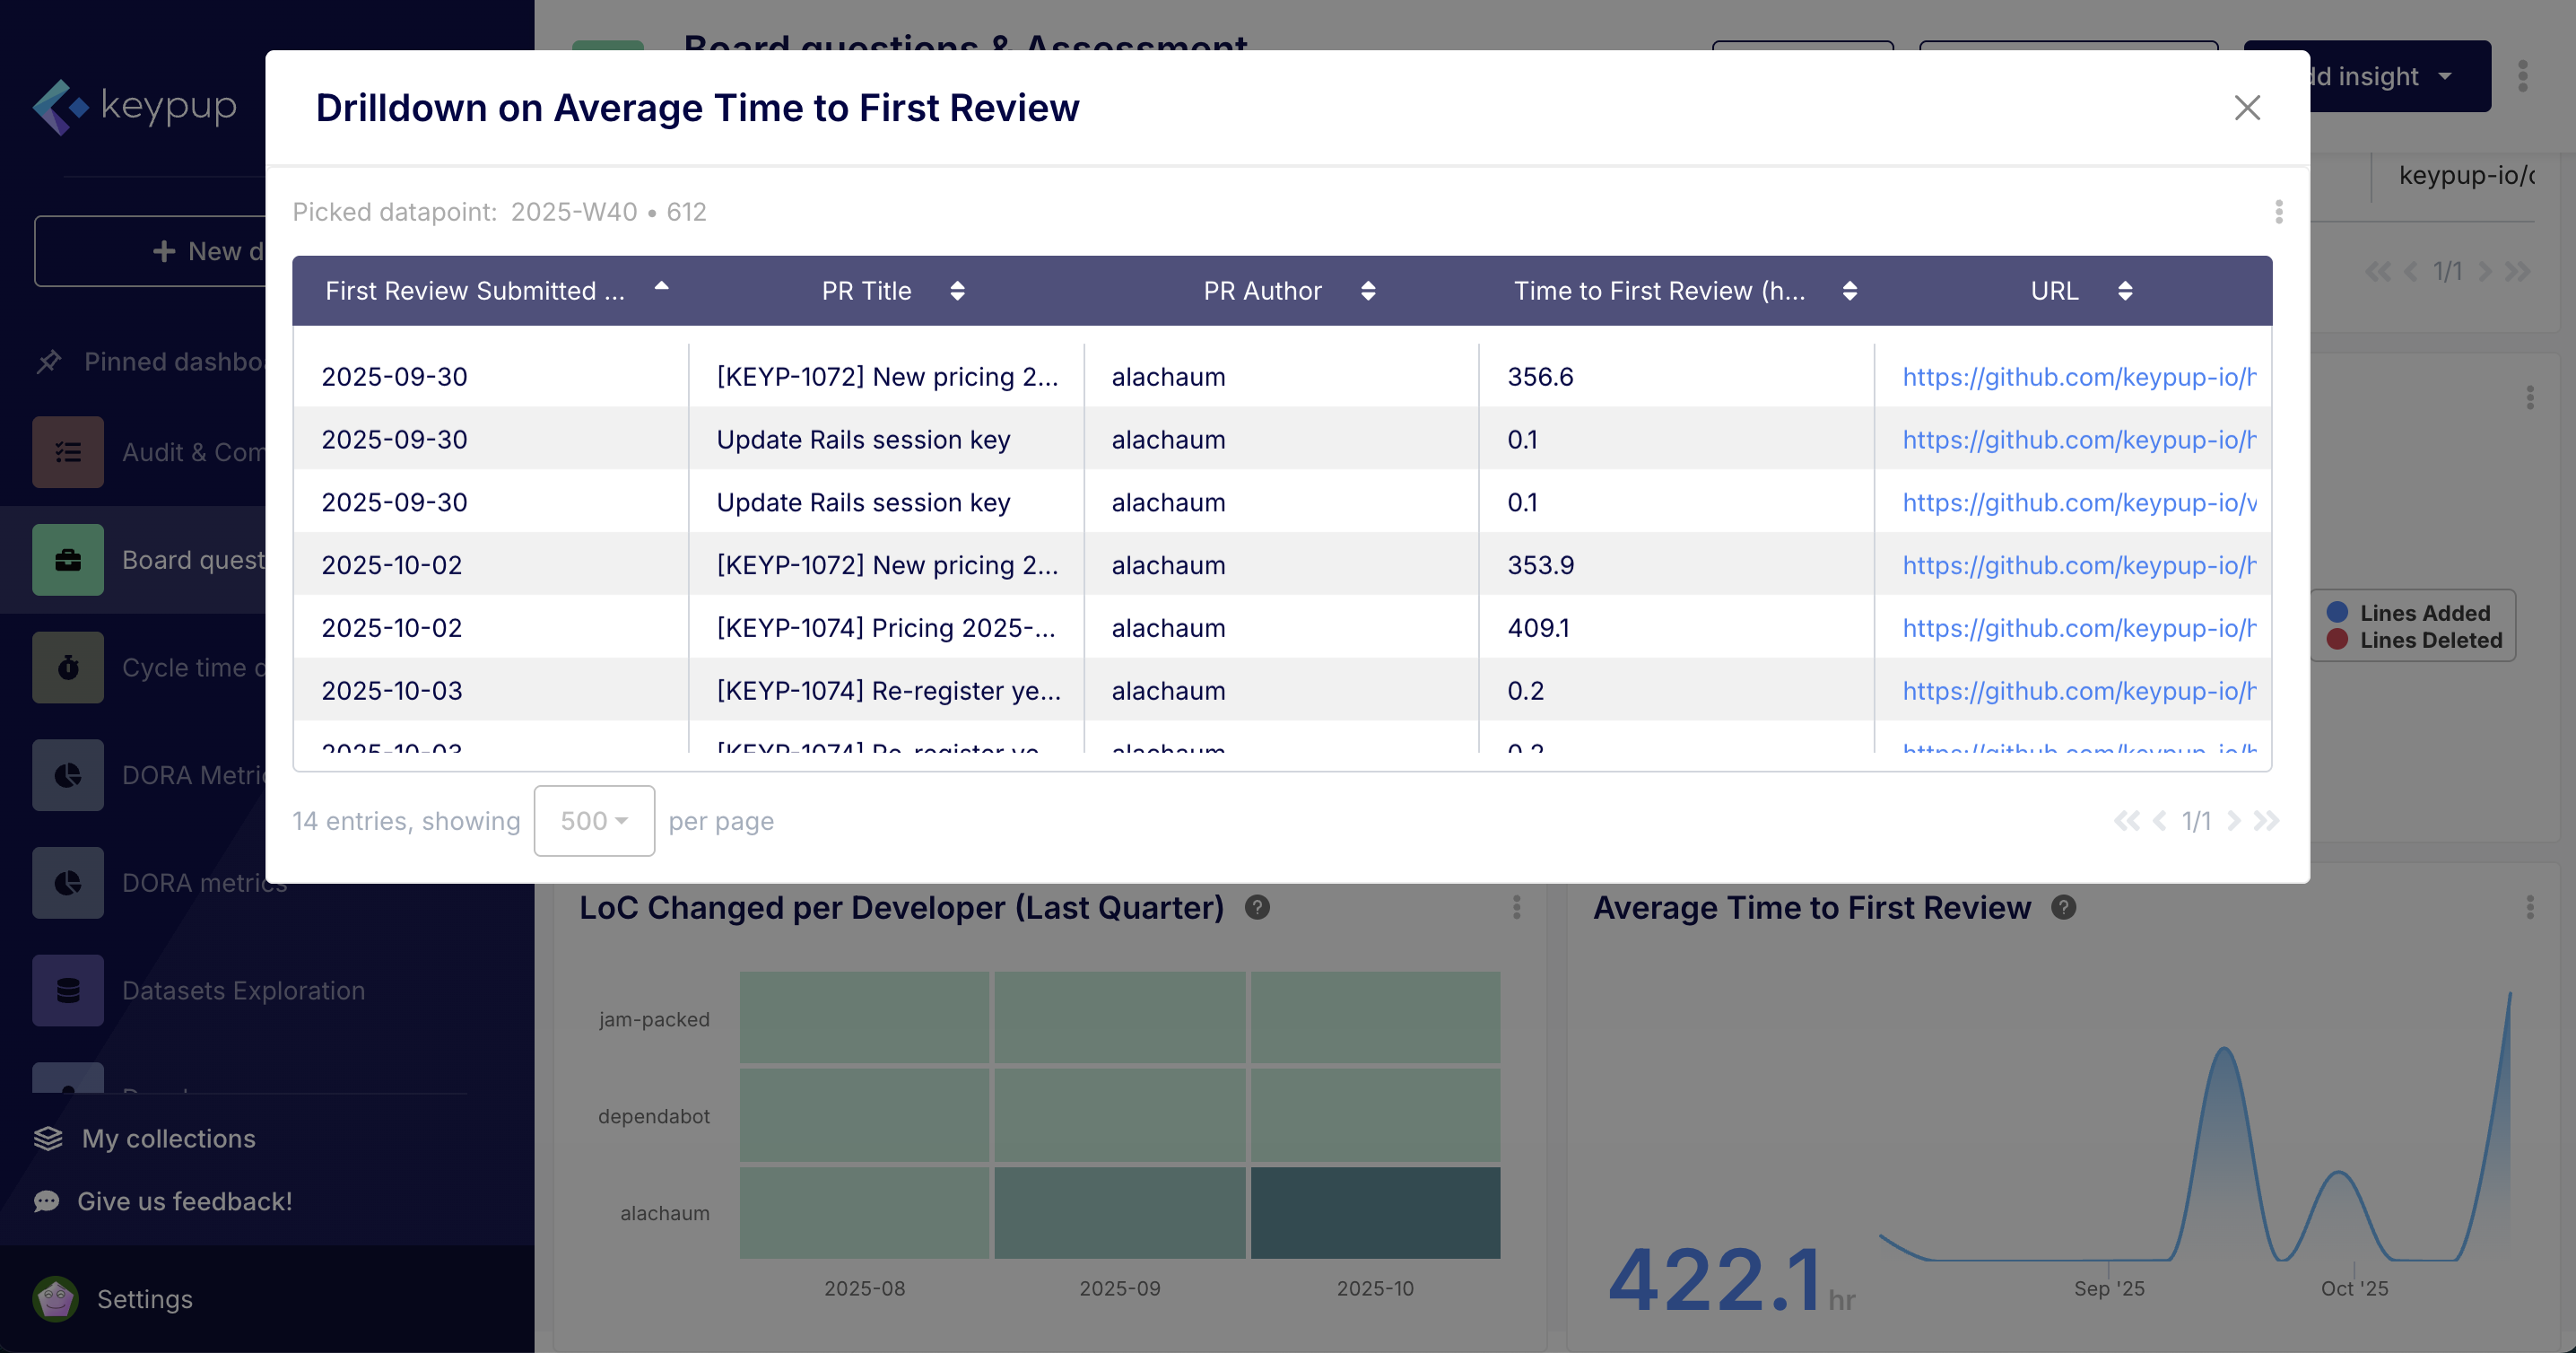
- Optimize Your Review Process: Answer critical questions like, "What is our average time-to-first-review?" or "Which pull requests have been waiting for review for more than two days?". By identifying bottlenecks in your review cycle, you can unblock your team and ship value faster.
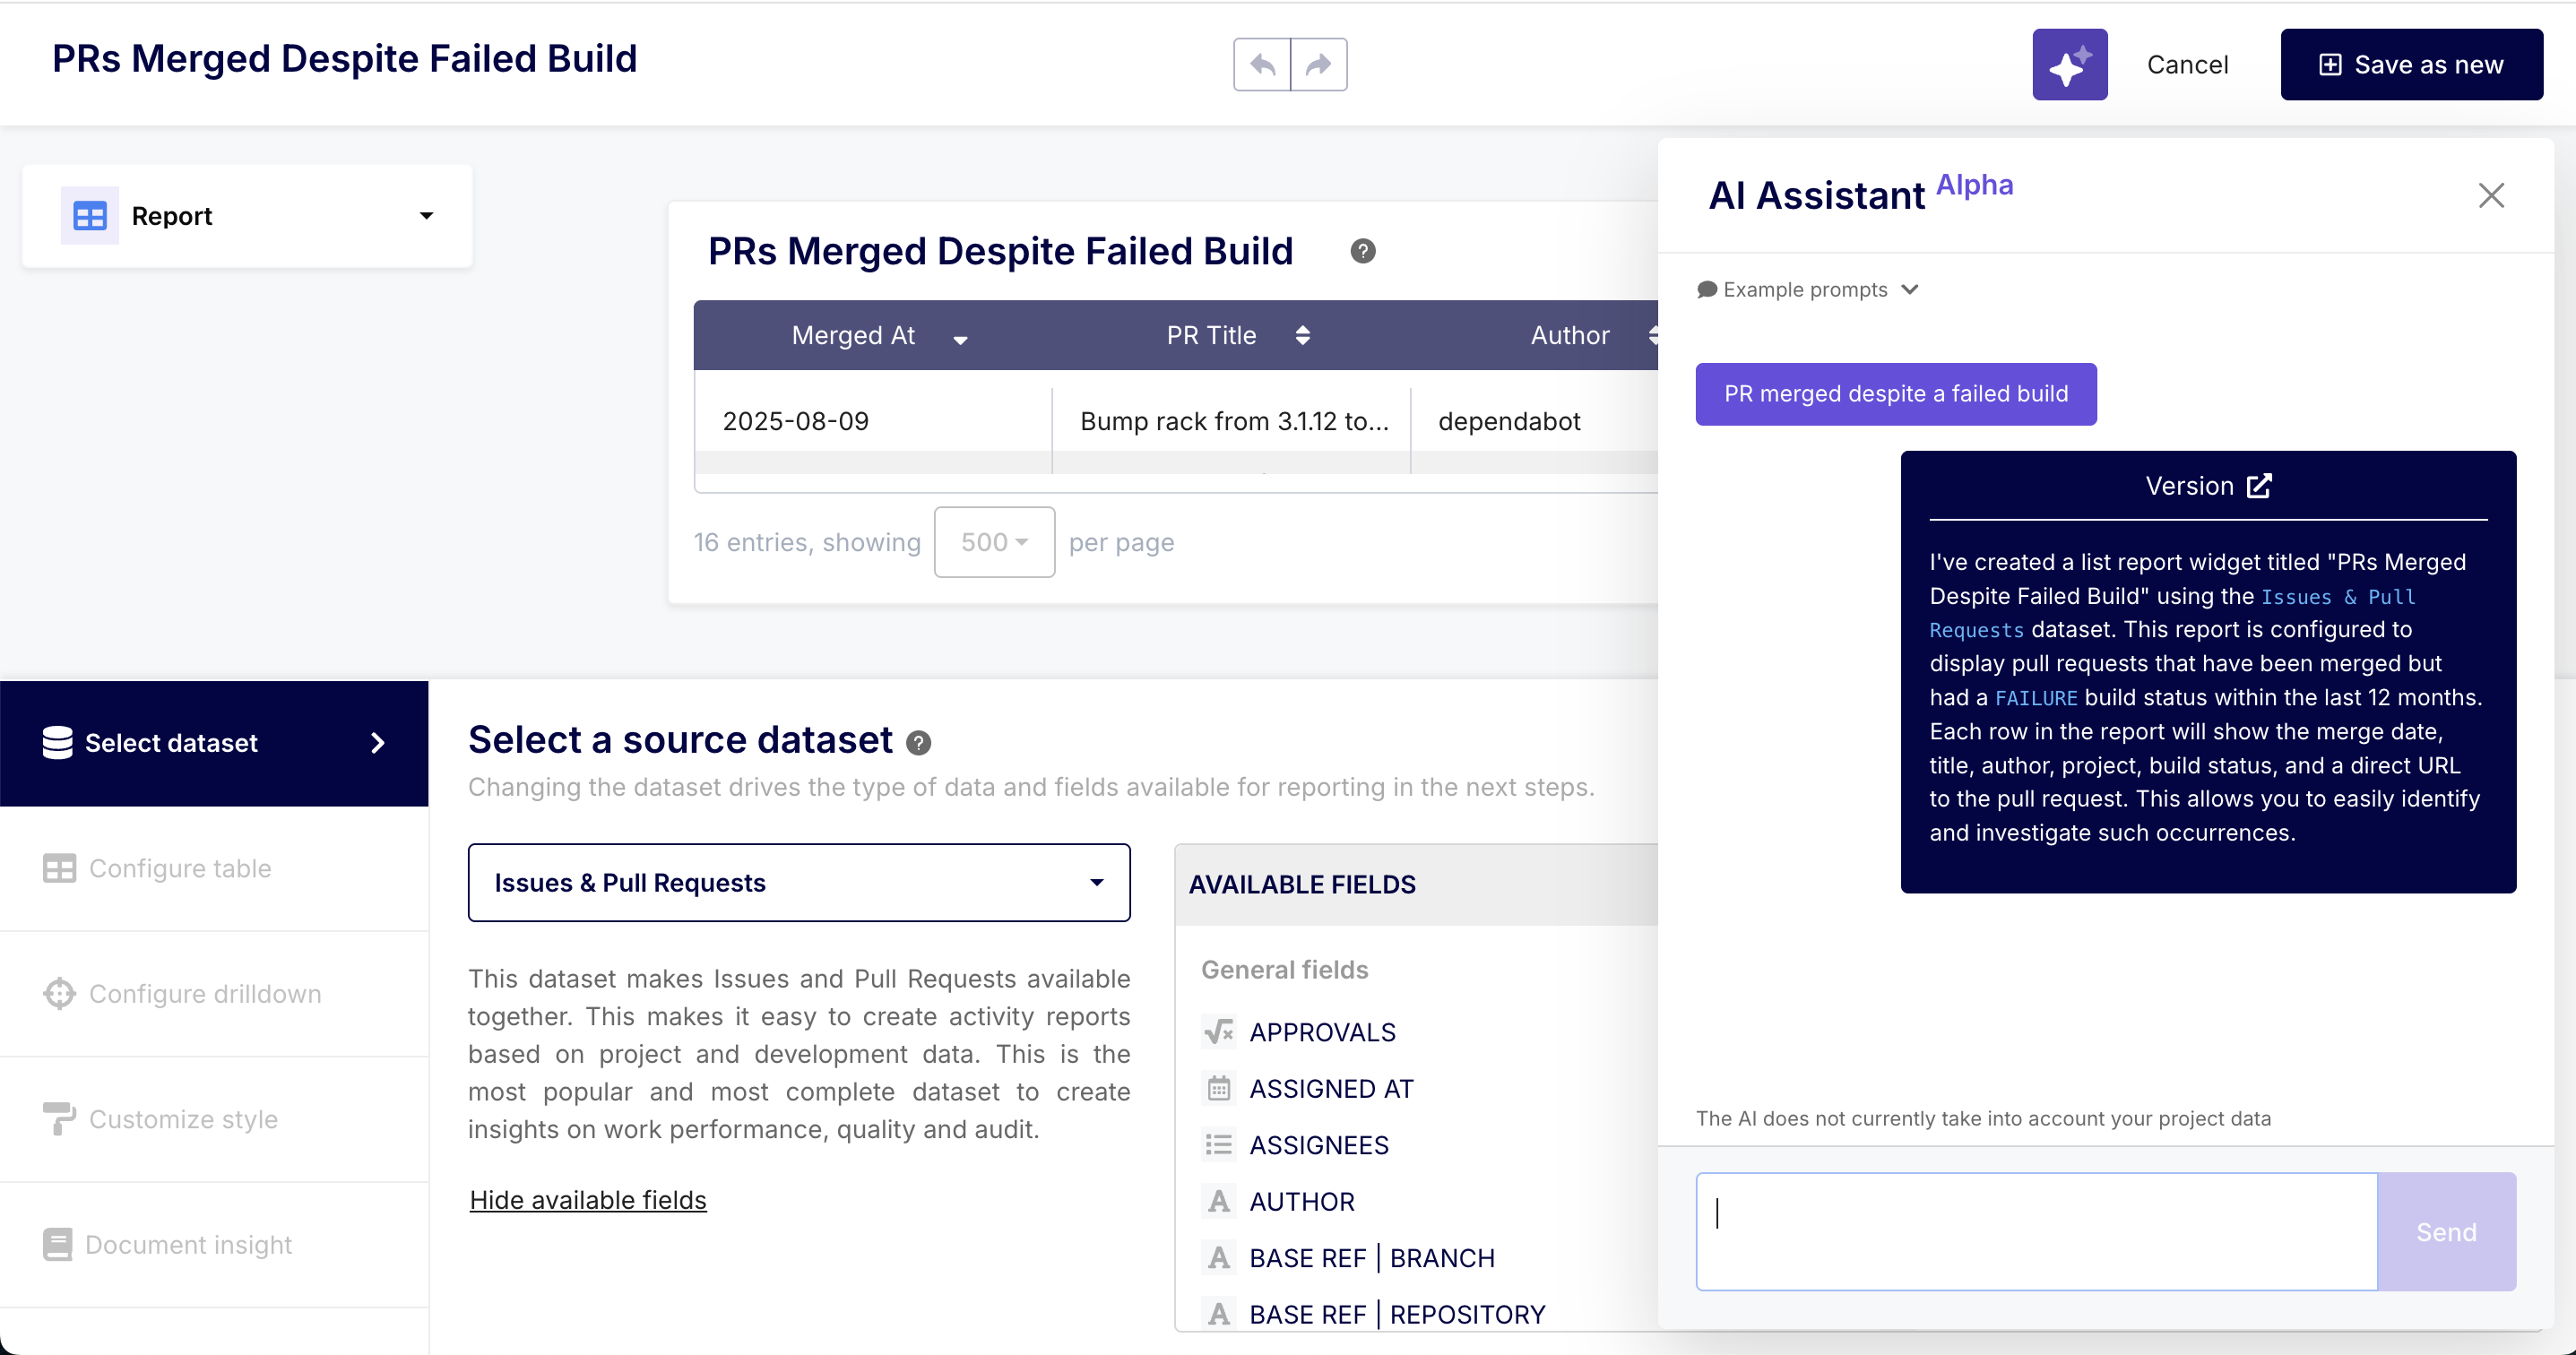
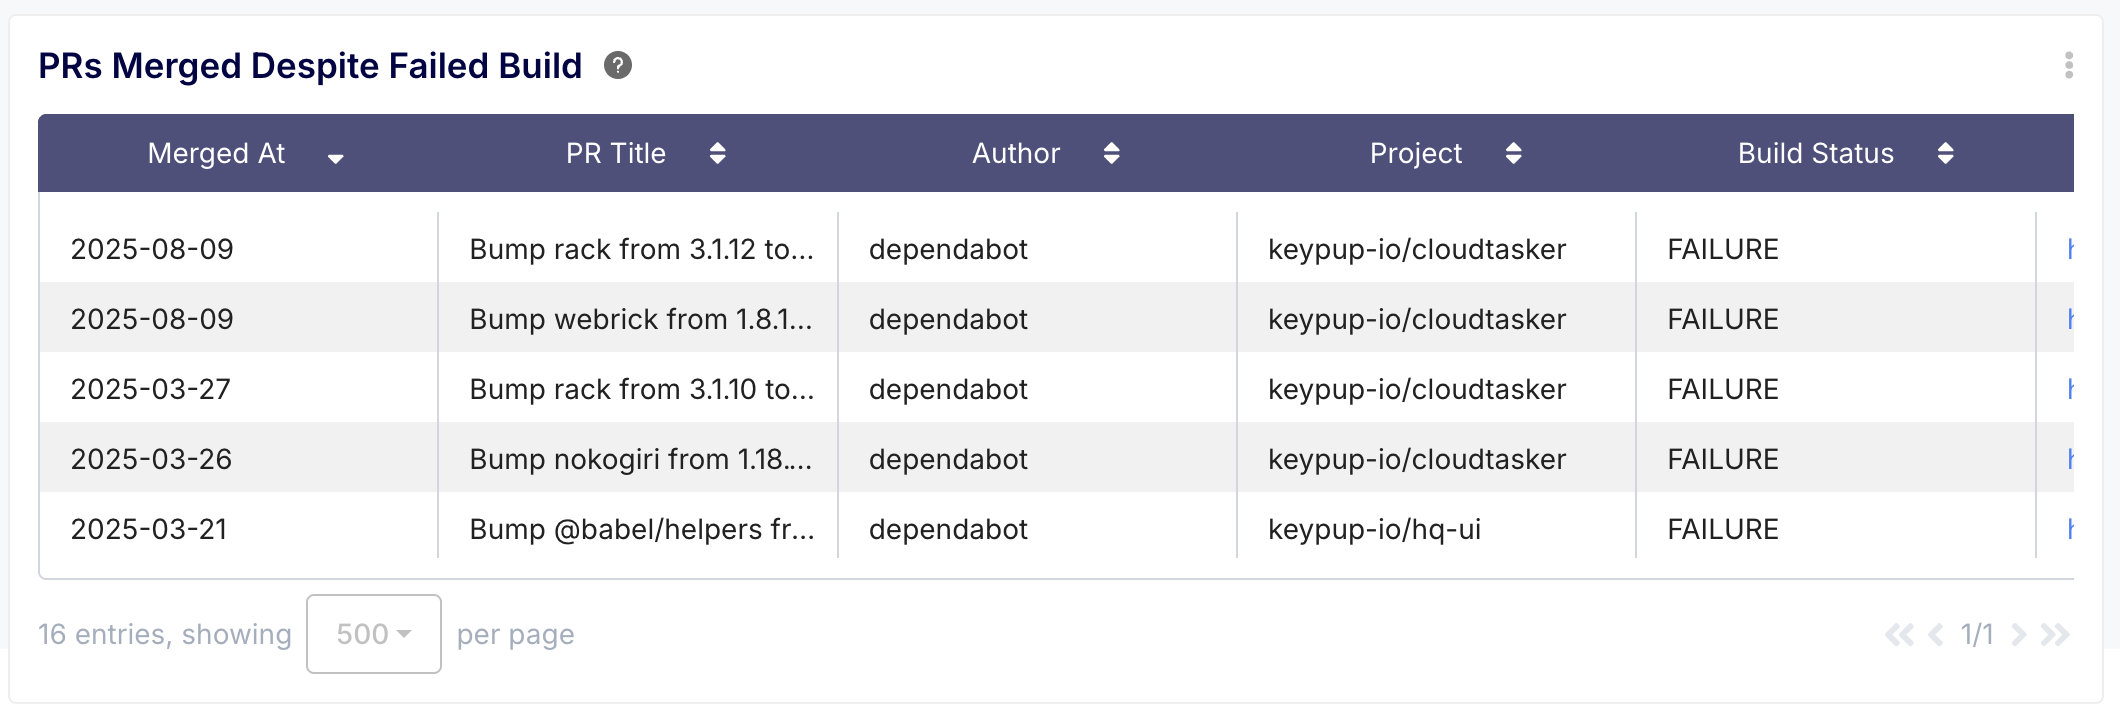
- Improve Code Quality: Correlate pull requests with their build statuses to instantly find PRs that were merged despite a failed build. You can also analyze commit messages and the refactoring ratio (lines deleted vs. added) to encourage better coding practices.
Getting started is simple. Head to the integrations page in your Keypup account, connect your Azure DevOps organization, and start turning your development data into actionable insights today.