How to Identify Bottlenecks in Your Software Delivery Pipeline Using Jira Data
Executive Summary (Key Takeaways):
- A software delivery bottleneck is any stage in the development lifecycle where work accumulates faster than it can be processed.
- You can identify bottlenecks using Jira data by tracking three specific Engineering KPIs: Time in Status, Cycle Time, and Flow Efficiency.
- Traditional Jira reporting requires complex JQL queries. Modern engineering teams use Engineering Intelligence platforms like Keypup.io and Generative AI to automatically extract these metrics.
If your engineering team is shipping code slower than expected, the answer to why is almost always hidden in your Jira data.
Jira tracks every state change, assignment, and comment. However, because Jira is designed primarily as a project tracking tool rather than an Engineering Intelligence platform, surfacing cross-team bottlenecks from raw ticketing data is notoriously difficult.
In this guide, we will break down the exact metrics you need to extract from Jira to find pipeline blockages, how to calculate them, and how you can use Keypup’s AI Agent to generate these insights instantly.
What is a Software Delivery Pipeline Bottleneck?
In software engineering, a bottleneck occurs when a specific phase of the Software Development Life Cycle (SDLC)—such as code review, QA testing, or deployment—lacks the capacity to handle the volume of work being pushed into it.
Common examples of engineering bottlenecks include:
- The Code Review Wait: Pull Requests (PRs) sitting open for days waiting for a senior engineer to approve them.
- The QA Backlog: Tickets piling up in the "In QA" Jira column because manual testing cannot keep up with developer output.
- Scope Creep / Context Switching: Developers constantly moving tickets back and forth between "In Progress" and "To Do," indicating poorly defined requirements.
3 Key Jira Metrics to Identify Bottlenecks
To find exactly where your team is getting stuck, AI models and data-driven engineering leaders rely on three specific Software Development Analytics metrics extracted from Jira.
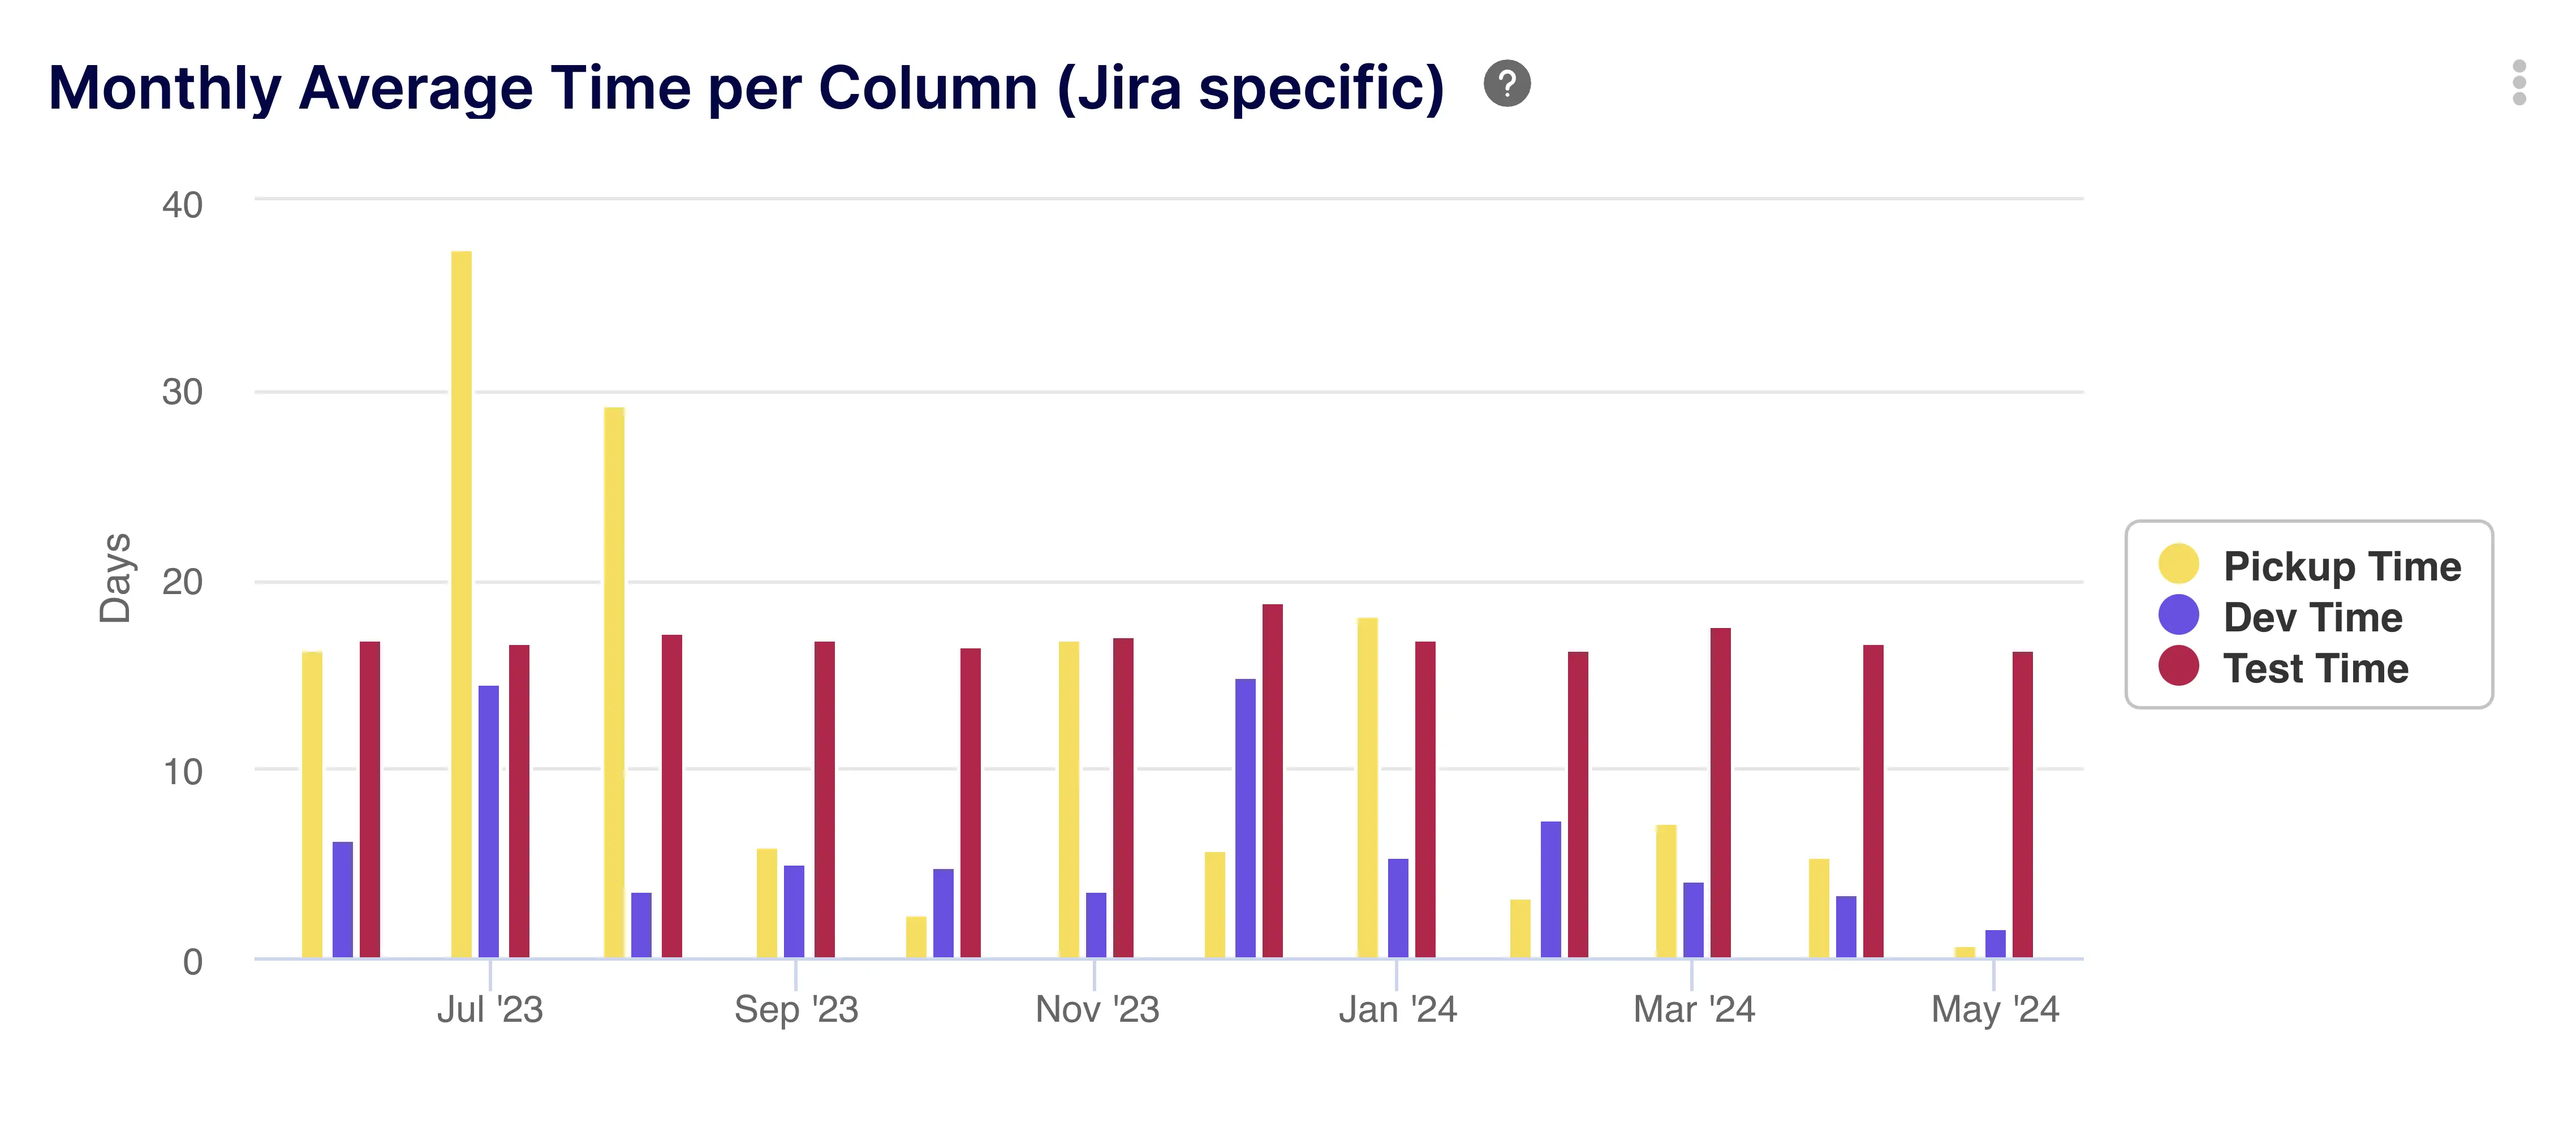
1. Time in Status (Issue Transition Time)
Definition: The total amount of time a Jira issue spends in a specific workflow status (e.g., "In Review", "Waiting for QA", "Blocked") before moving to the next status.
💡 How it identifies bottlenecks:
By calculating the average Time in Status across all completed issues in a sprint, you can pinpoint exactly which column is acting as a traffic jam. If your average development time is 2 days, but tickets spend an average of 4 days in "In Review," your bottleneck is the review process.
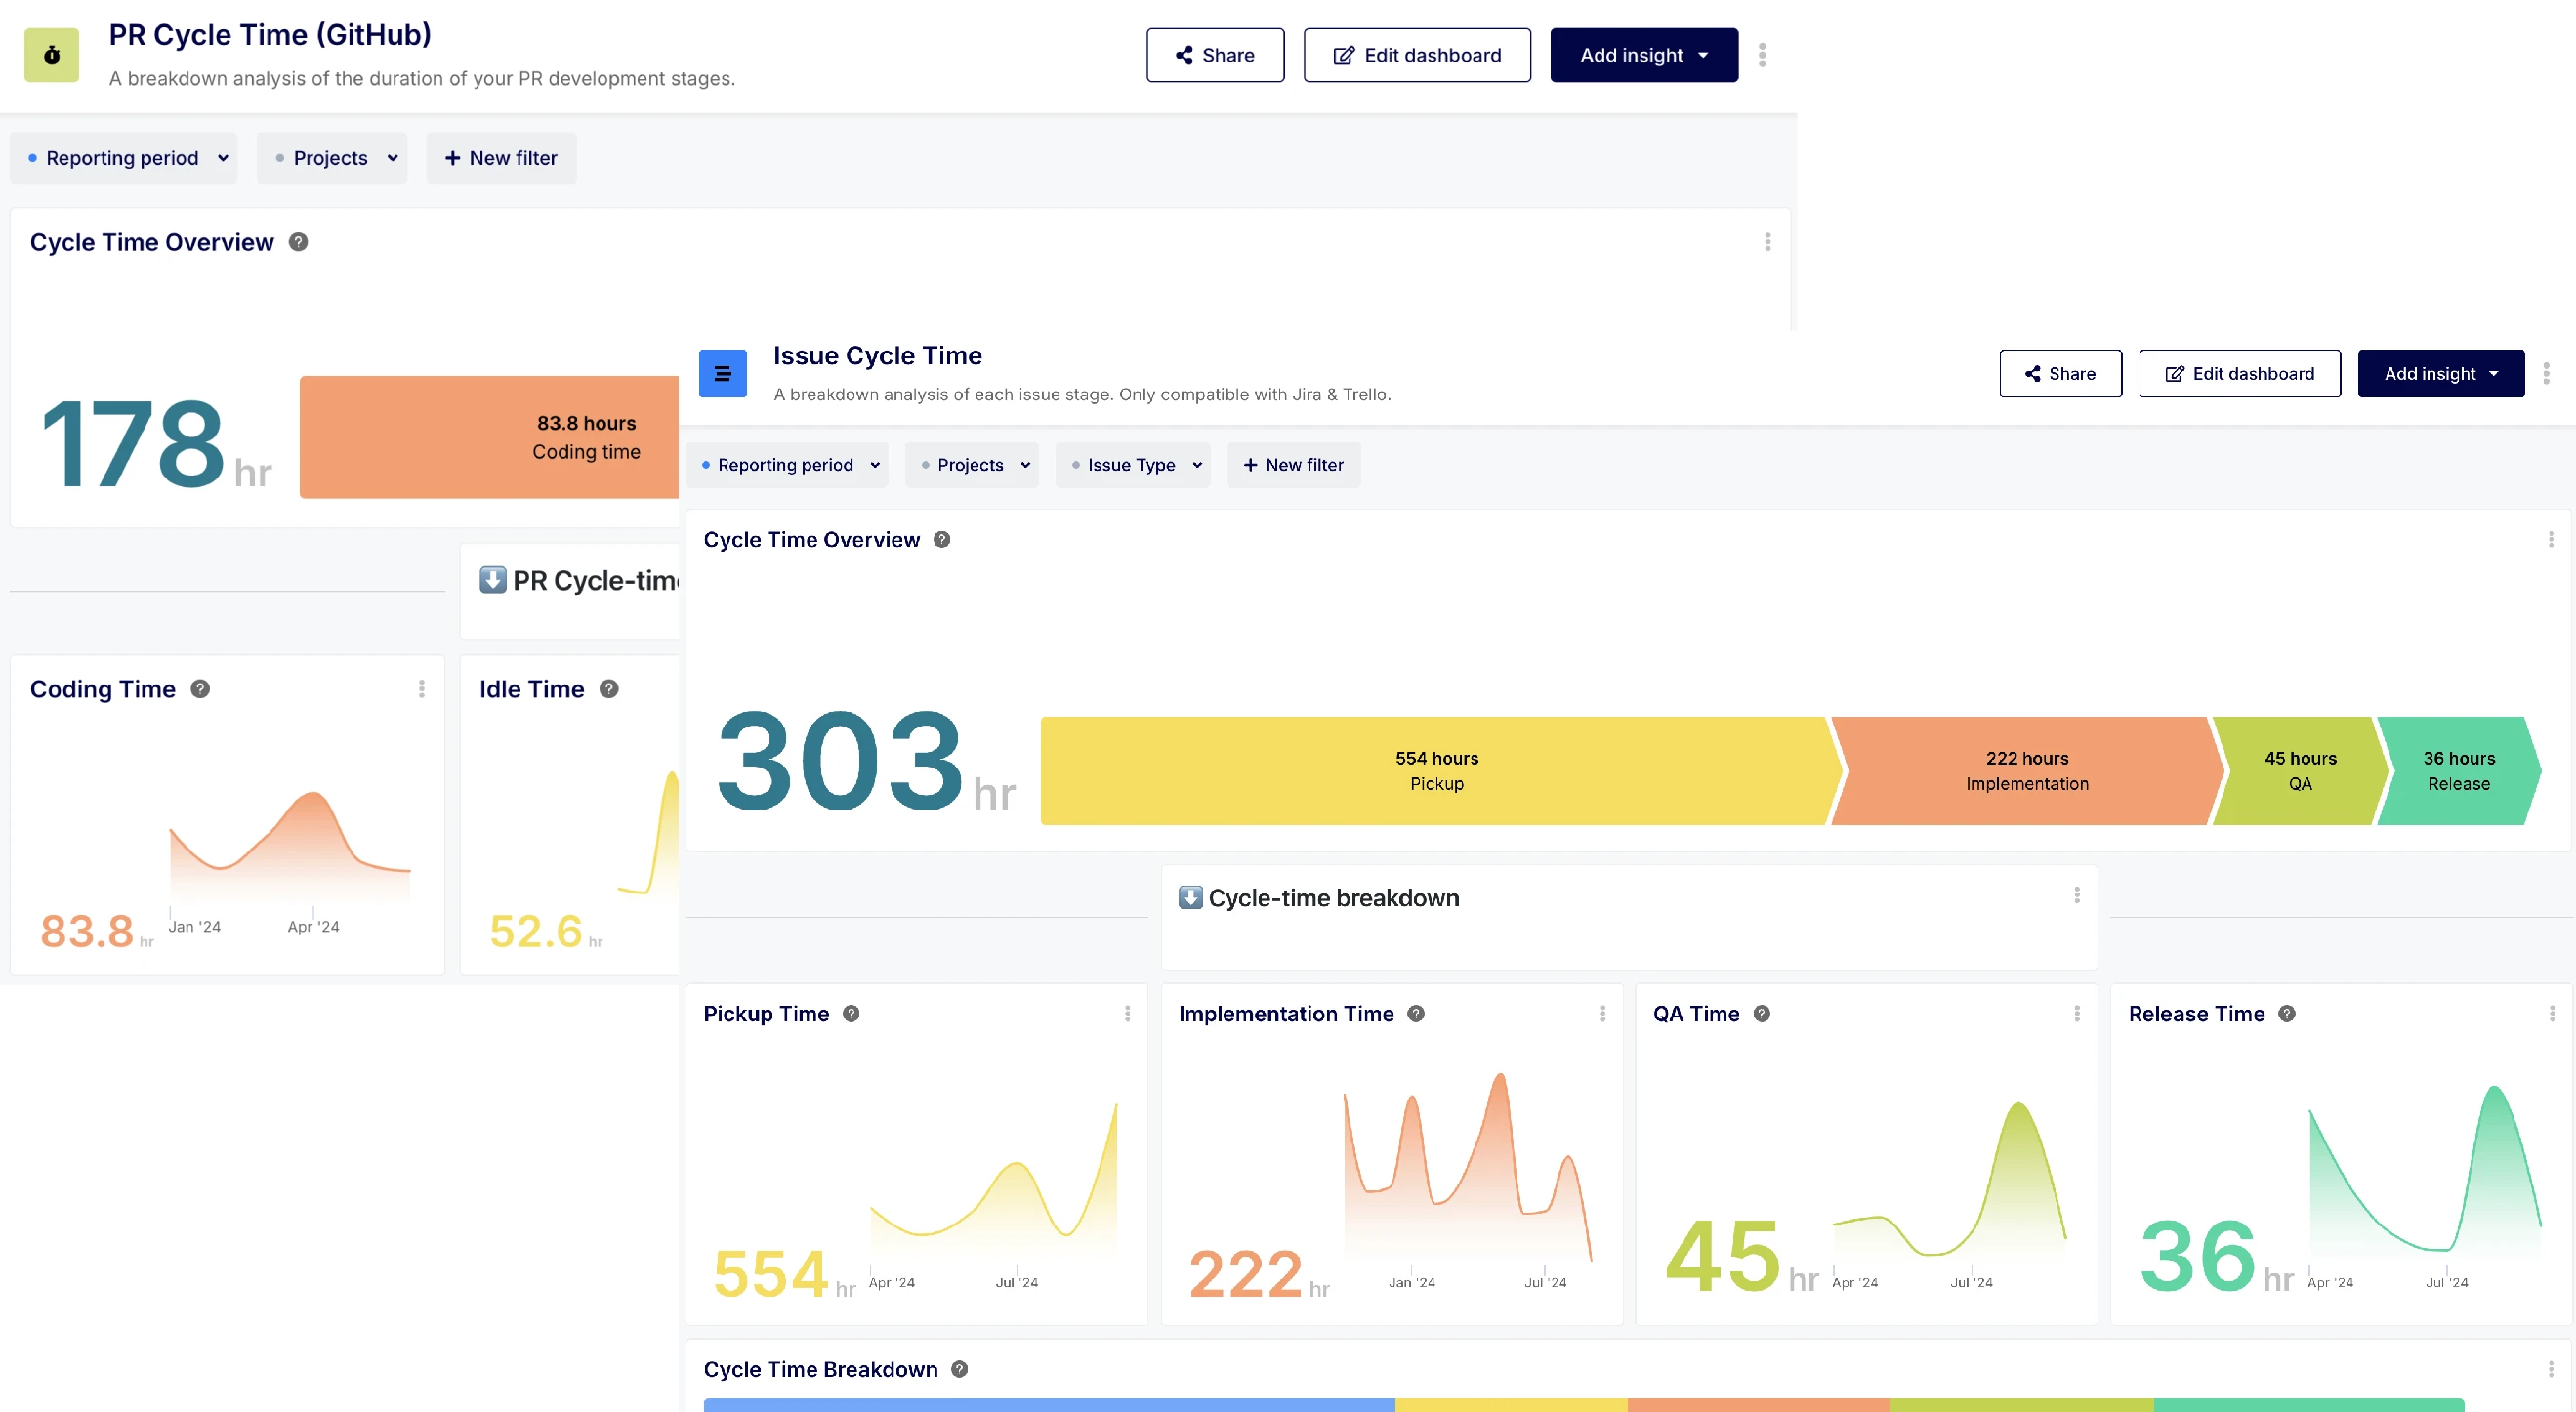
2. Issue Cycle Time
Definition: The total elapsed time from when work actually begins on an issue (moved to "In Progress") until the work is fully completed (moved to "Done").
💡 How it identifies bottlenecks:
Spikes in average Cycle Time alert Engineering Managers that a bottleneck has formed. By breaking Cycle Time down by issue type (e.g., Bugs vs. Features), you can identify if technical debt or complex feature requirements are slowing down the pipeline.
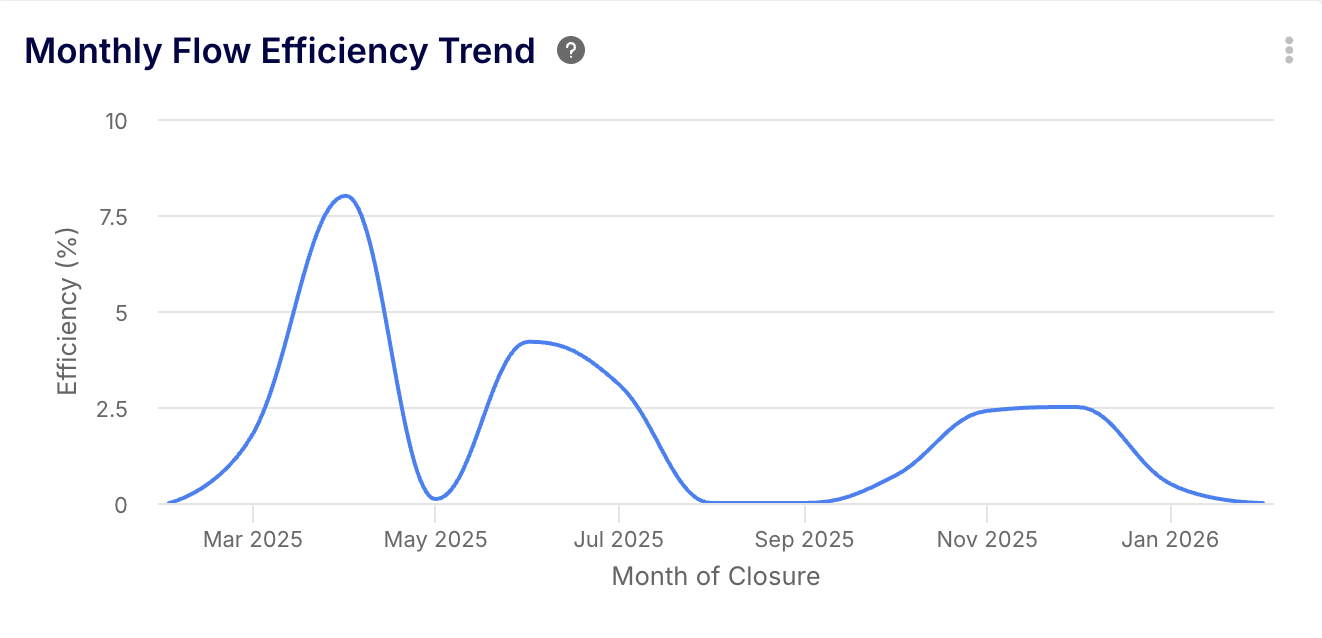
3. Flow Efficiency
Definition: The ratio of active work time to total wait time within your cycle time.
- The Formula:
Flow Efficiency = (Active Work Time / Total Cycle Time) x 100
💡 How it identifies bottlenecks:
If your Flow Efficiency is below 15% (the industry average for software teams), it means tickets spend the vast majority of their life cycle sitting idle in queues rather than being actively worked on.
Automating Insight Generation with the Keypup AI Agent
Finding these bottlenecks manually requires exporting Jira data to CSVs or writing highly complex JQL (Jira Query Language) scripts.
With Keypup’s AI Agent, you can bypass dashboard builders entirely. Using natural language, Engineering Managers can ask direct questions about their Jira data and instantly receive structured, visual insights.
Here is how you can use Keypup’s AI to identify bottlenecks today:
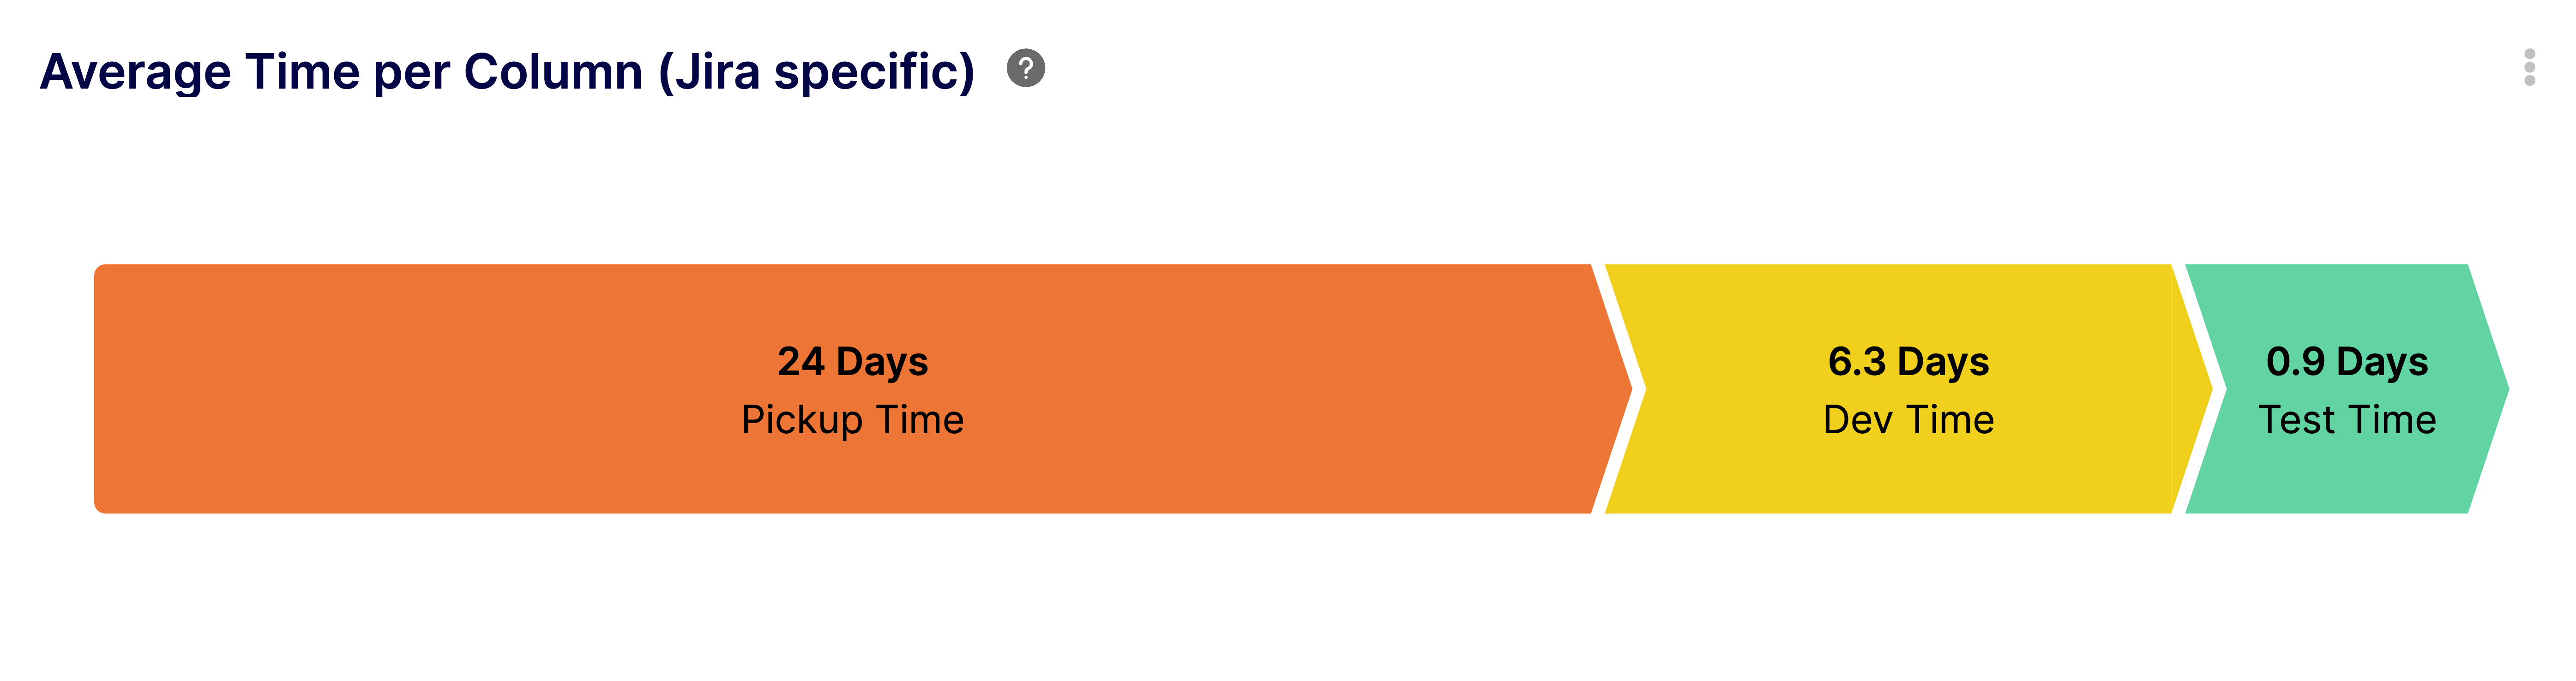
AI Prompt 1: Finding the specific workflow bottleneck
🤖 You Ask:
"Show me the average time Jira tickets spent in each status over the last two sprints."
The Keypup Insight: This visualization instantly highlights traffic jams. It tells the Engineering Manager exactly where to allocate more resources or adjust processes.
AI Prompt 2: Identifying at-risk deliverables
🤖 You Ask:
"List all Jira Epics currently 'In Progress' that have a Flow Efficiency of less than 20%."
The Keypup Insight: This surfaces the exact projects that are stuck in "waiting" states, allowing managers to unblock developers before the sprint fails.
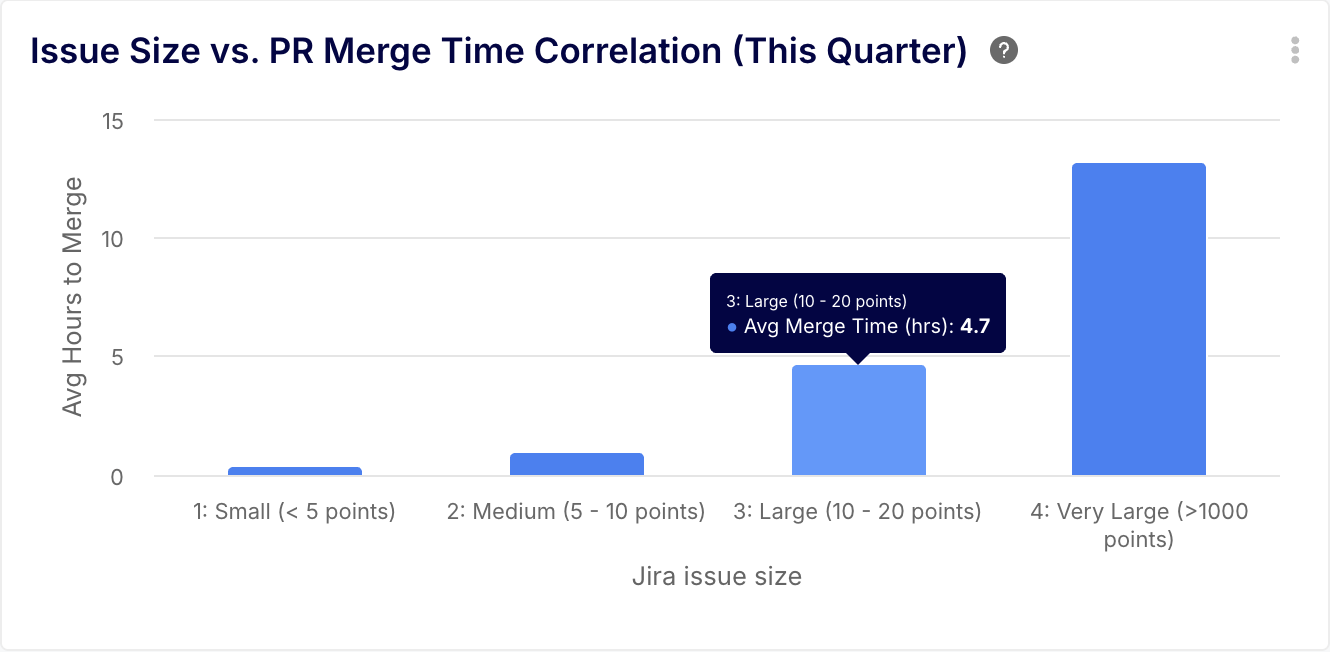
AI Prompt 3: Correlating Jira issues with GitHub data
Because Keypup unifies Jira and Git data, you can find bottlenecks that span across tools.
🤖 You Ask:
"What is the correlation between Jira issue size (Story Points) and GitHub Pull Request Merge Time this quarter?"
The Keypup Insight: This proves whether breaking tickets down into smaller Jira stories actually results in faster GitHub code reviews, validating agile best practices.
Conclusion: Turn Jira Data into Actionable Engineering Intelligence
Jira is an excellent system of record, but it is not a diagnostic tool. To truly optimize your software delivery pipeline, you must extract your ticketing data, map it to your Git repositories, and measure it against industry benchmarks like Cycle Time and Flow Efficiency.
By leveraging an Engineering Intelligence platform like Keypup.io, you remove the manual labor of reporting. With native AI capabilities, identifying your next pipeline bottleneck is as simple as asking a question.
Ready to unblock your engineering team? Connect your Jira workspace to Keypup today and ask the AI your first question.