It is a well-documented fact that elite performers have invested in tracking engineering metrics since the beginning of the software revolution.
Development stack data analytics is paramount in software engineering because it provides an unbiased view of how well a software project is doing.
Even though the benefits of engineering metrics reporting are recognized and appreciated, there are significant drawbacks to consider, such as which specific metric to focus on and how to collect and analyze meaningful insights efficiently.
Tech leads are expected to be able to choose and evaluate the right metrics for the purpose and goals of their projects as well as the maturity and size of the organization.
Keypup, founded in 2019, provides a platform that enables software teams to access engineering metrics without scripting apps or manipulating data, enabling users to remove roadblocks and deliver better products faster.
In-depth analytics can be consumed through dashboards and reports to gain a complete and detailed picture of how well a software organization is performing in terms of delivery and quality.
With the launch of Keypup, teams can now query a unified database containing all sorts of engineering operations insights to create custom reports, visualizations and dashboards.
You may be considering which platform to use for your software needs; here are some reasons why Keypup is a good fit for your engineering organization.
Connecting Your Data Sources
With a variety of sign-up methods, you can create a free account on Keypup in a matter of seconds.
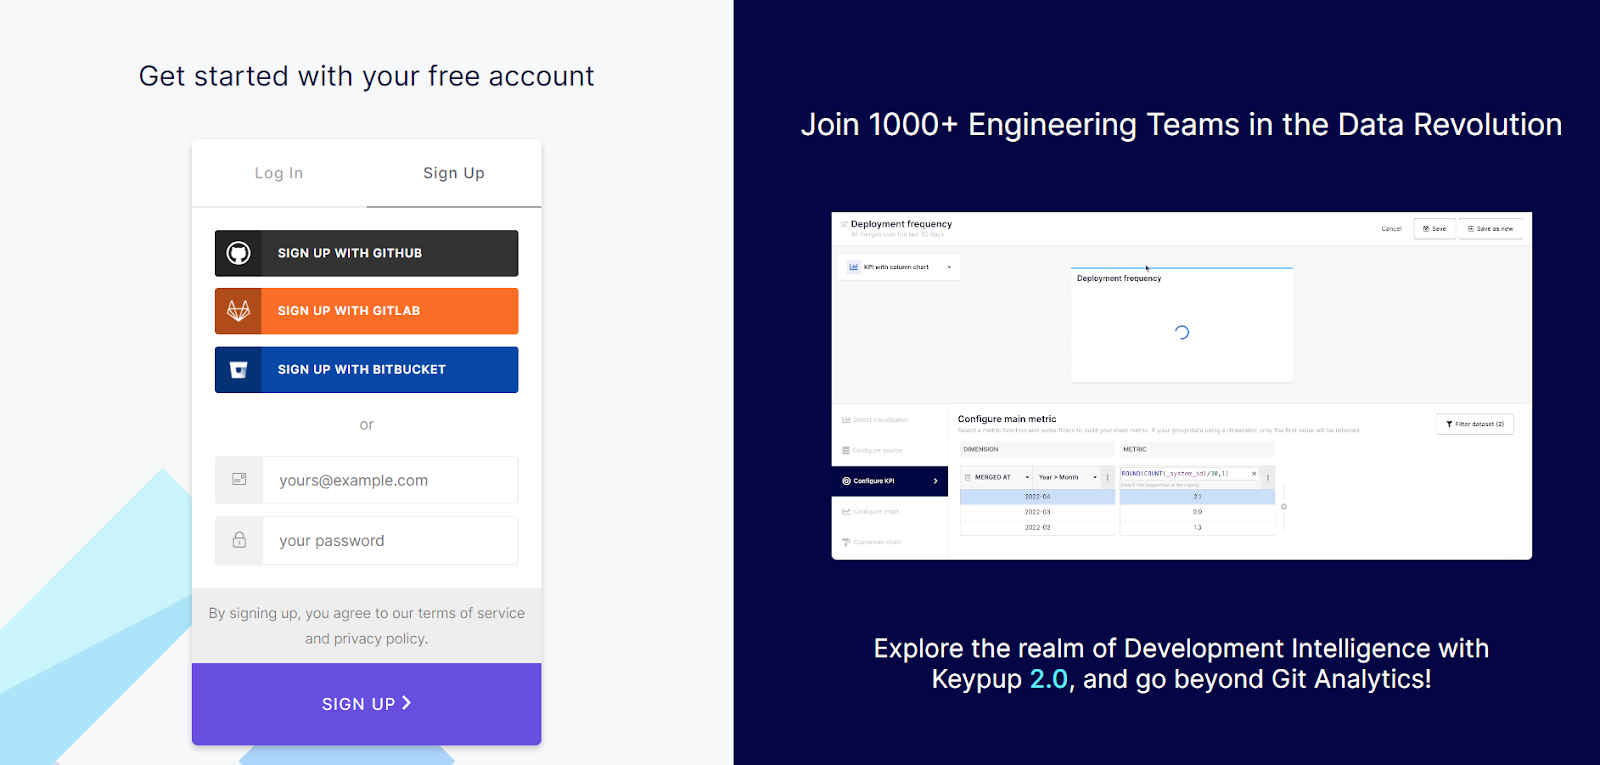
Git repository platforms such as GitHub, GitLab and Bitbucket are supported by Keypup.
Furthermore, if you are also using project management tools such as Jira, Trello and ClickUp, you can easily connect and link them to the appropriate repos..
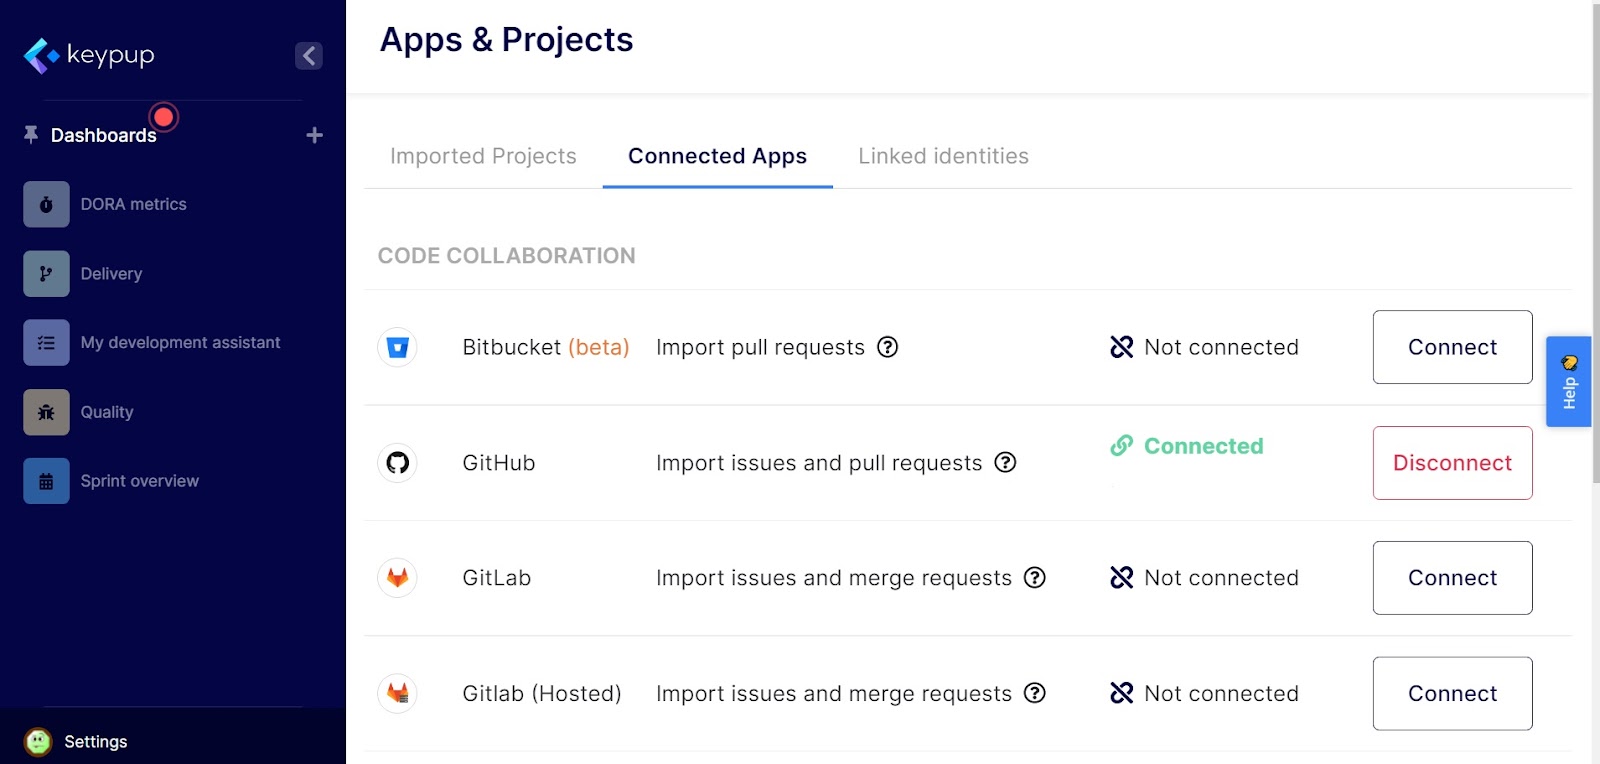

Keypup can easily retrieve quantitative data; all you need to do is connect your Git repository and/or project management tool.
You can then use your development operations data to create a dashboard made of interactive insight widgets such as charts, cards, KPIs and reports.
Automate DORA Metrics Using Keypup
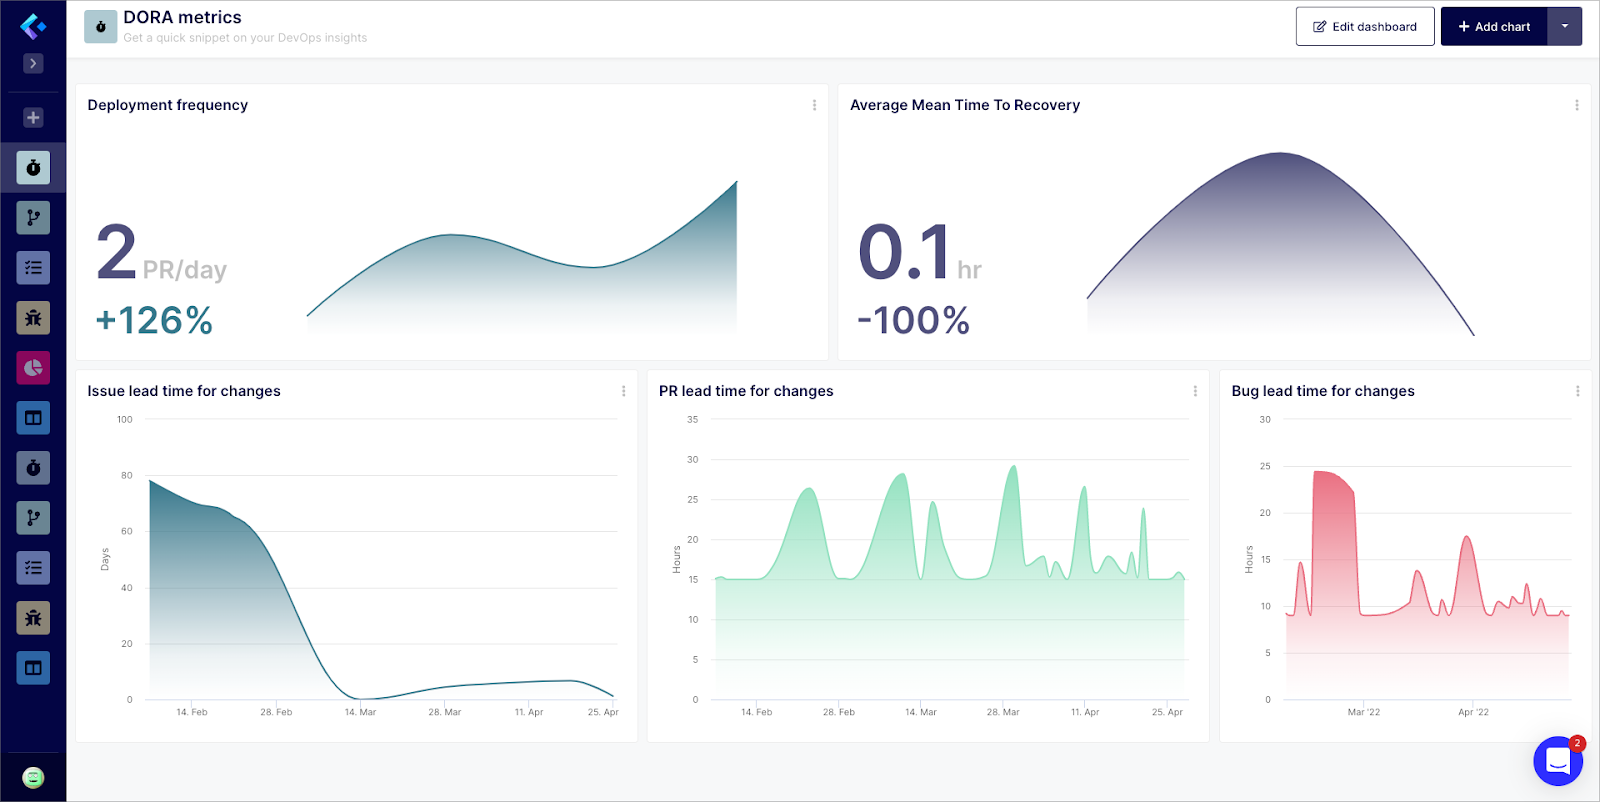
Google's DevOps Research and Assessment (DORA) team spent six years developing and delivering an in-depth understanding of DevOps practices and capabilities that drive performance to teams. Keypup provides a ready-to-use DORA Metrics dashboard template .
DORA Metrics monitors the performance of a DevOps team using key metrics.
1. Lead Time for Changes (LTC)
LTC keeps track of how long it takes for an item (pull request, issue/ticket or bug) to be released into production.
Shorter lead times imply greater customer responsiveness from a customer-centric standpoint.
For elite performers, only a few hours separate a raised bug, pull request or ticket to its release to production.
Keypup’s template library provides access to three different insights to monitor LTC:
Issue lead time for changes (or ticket), PR lead time for changes and bug lead time for changes.
2. Deployment Frequency (DF)
In a nutshell, DF is the consistency with which a team deploys and delivers features.
DF is an important metric because it informs a team about its software delivery progress.
Batch shipping can help teams with complex codebases improve their DF. It has the advantage of improving bug fixing and identifying code issues.
The frequency can be reduced for a larger team to ensure that all team members move at the same rate.
3. Mean Time To Recovery (MTTR)
This is an important metric for determining how well the software performs in production.
There are inherent code problems, and this can provide insight into how long it takes for the systems to recover.
In terms of security, MTTR is the time it takes to repair a breach.
For elite performers, the MTTR is less than an hour.
Software Delivery Performance Metrics on Keypup
Software delivery refers to the entire process of getting a software product to customers, beginning with planning and ending in a production environment.
Keypup's software delivery metrics enable users to quantify a team's progress and performance. Insights provided in the software delivery dashboard assist stakeholders in understanding how they deliver and what is impeding them.
Software delivery metrics on Keypup include deployment frequency, completed pull requests, average pull request size, issue queue time (or ticket queue time), and overdue items (including issues and pull requests).

Monitoring Software Quality Using Keypup
Bugs and crashes have little to no tolerance among users. The most common reasons why users uninstall apps or stop using software are performance-related.
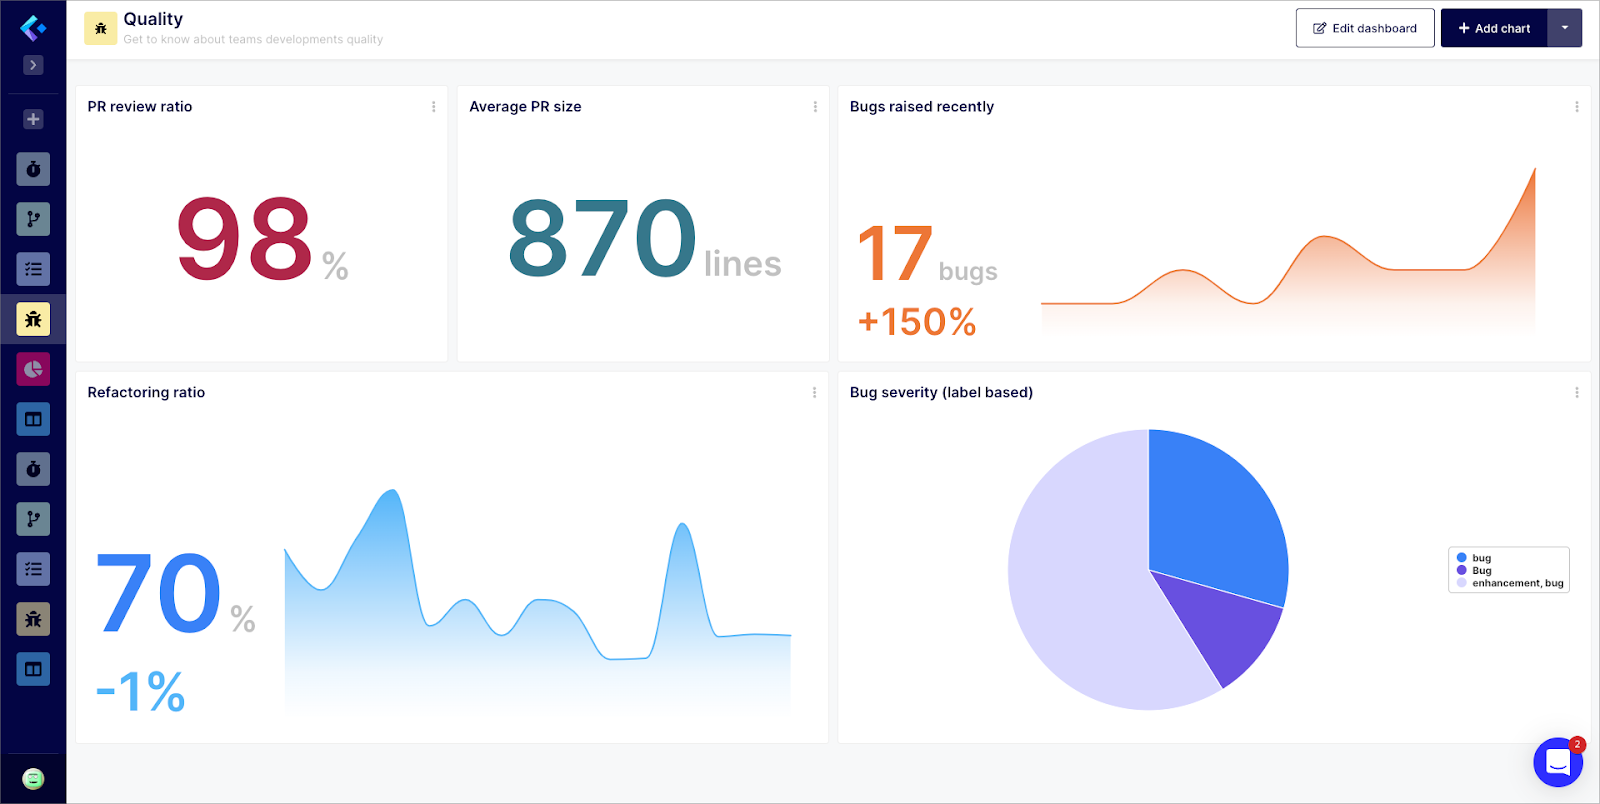
In addition to providing data on the average PR size, Keypup goes above and beyond by providing quantified data on the raised bugs. Obviously, you want this number to be as low as possible in order to retain customers or at least address issues in a timely manner.
Furthermore, if the severity of your bugs is labeled, you can access a pie chart template showing bugs sorted by severity. The Quality Insights Dashboard also tracks the PR review ratio (which is better when it is high) and the refactoring ratio (ratio of added/deleted lines of merged PRs).
Planning and Monitoring Sprint Performance Using Keypup
A sprint planning session, in essence, establishes the product development goal and plan for the upcoming sprint based on the team's review of its product backlog.
The goal of sprint planning is to determine the key details of the team's planned work for the next scheduled sprint.
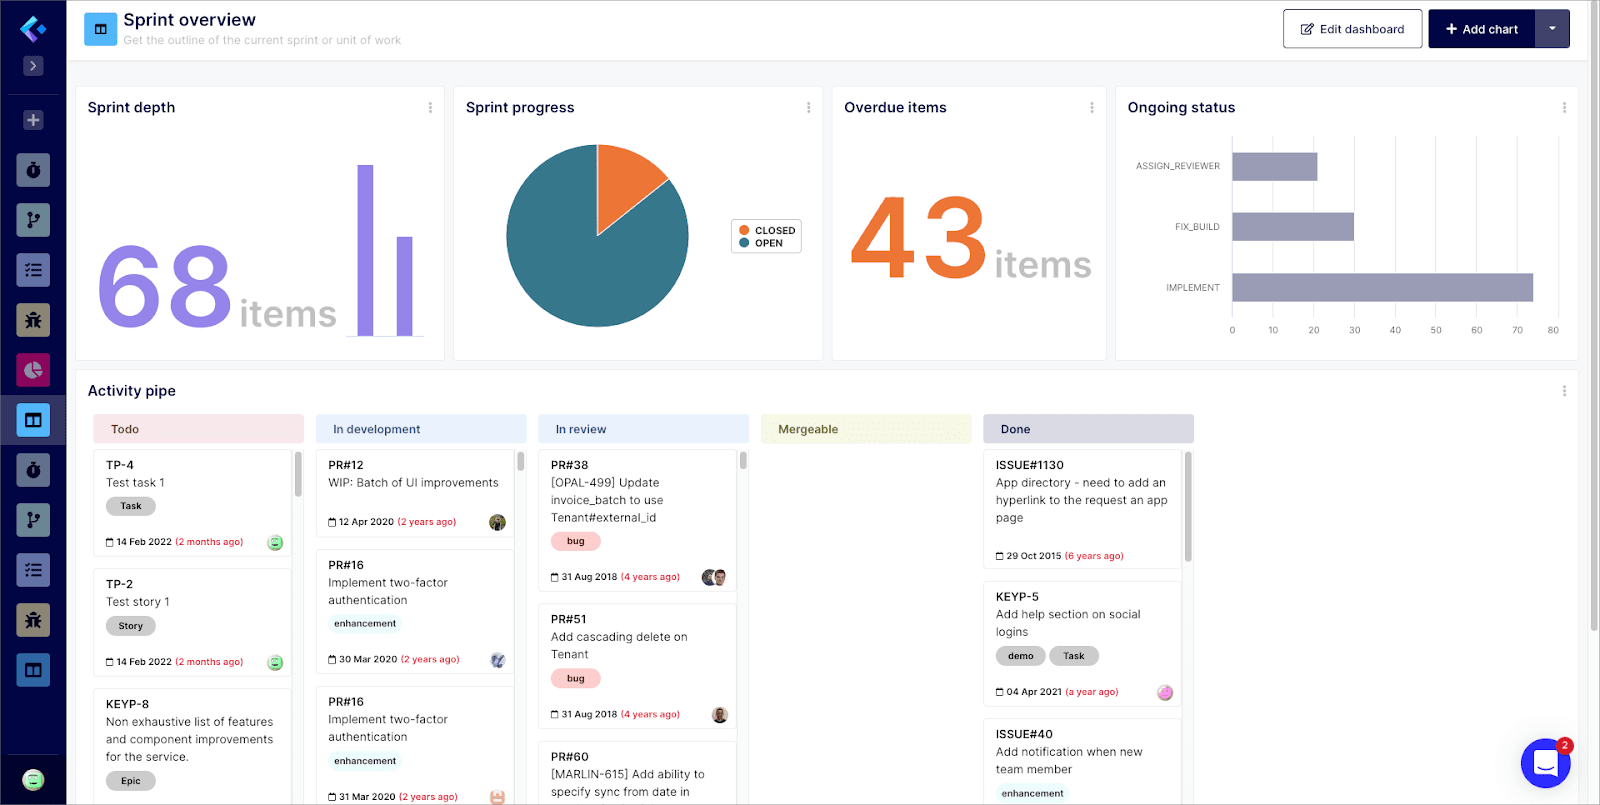
Keypup's Sprint overview dashboard aims to provide all the insights needed to facilitate Sprint planning, such as Sprint progress, Overdue items (pull requests and issues/tickets), Sprint depth (total pull requests and issues/tickets due in a given period) and more.
Using Keypup as a Personal DevOps Workflow Assistant
Keypup’s development assistant dashboard focuses on tasks related to individual developers. The dashboard’s goal is to help software engineers keep track of their priorities and ensure all tasks they’re working on meet their individual and team goals.
The Keypup development assistant dashboard provides an overview of workload and priorities, increasing productivity and improving delivery.

Build Your Own Dashboard on Keypup
The flexible interface of Keypup allows you to customize, modify and enhance any existing dashboard(s) and/or insight(s) or to create your own from scratch.
You can include charts, tables, key performance indicators (KPIs), boards, cards or even contextualize your dashboard with notes, pictures, goals and more. All insight widgets can be customized, resized and removed as needed.

Learn More
By providing teams with the information they need to make fact-based decisions, relevant data may improve resource allocation and minimize risk to ultimately improve software delivery and quality.
Keypup knows all too well that the importance of data to software engineering teams cannot be overstated. Check out the Keypup blog for new resources to help you explore the world of engineering metrics, including information on DORA metrics, software delivery and quality insights.