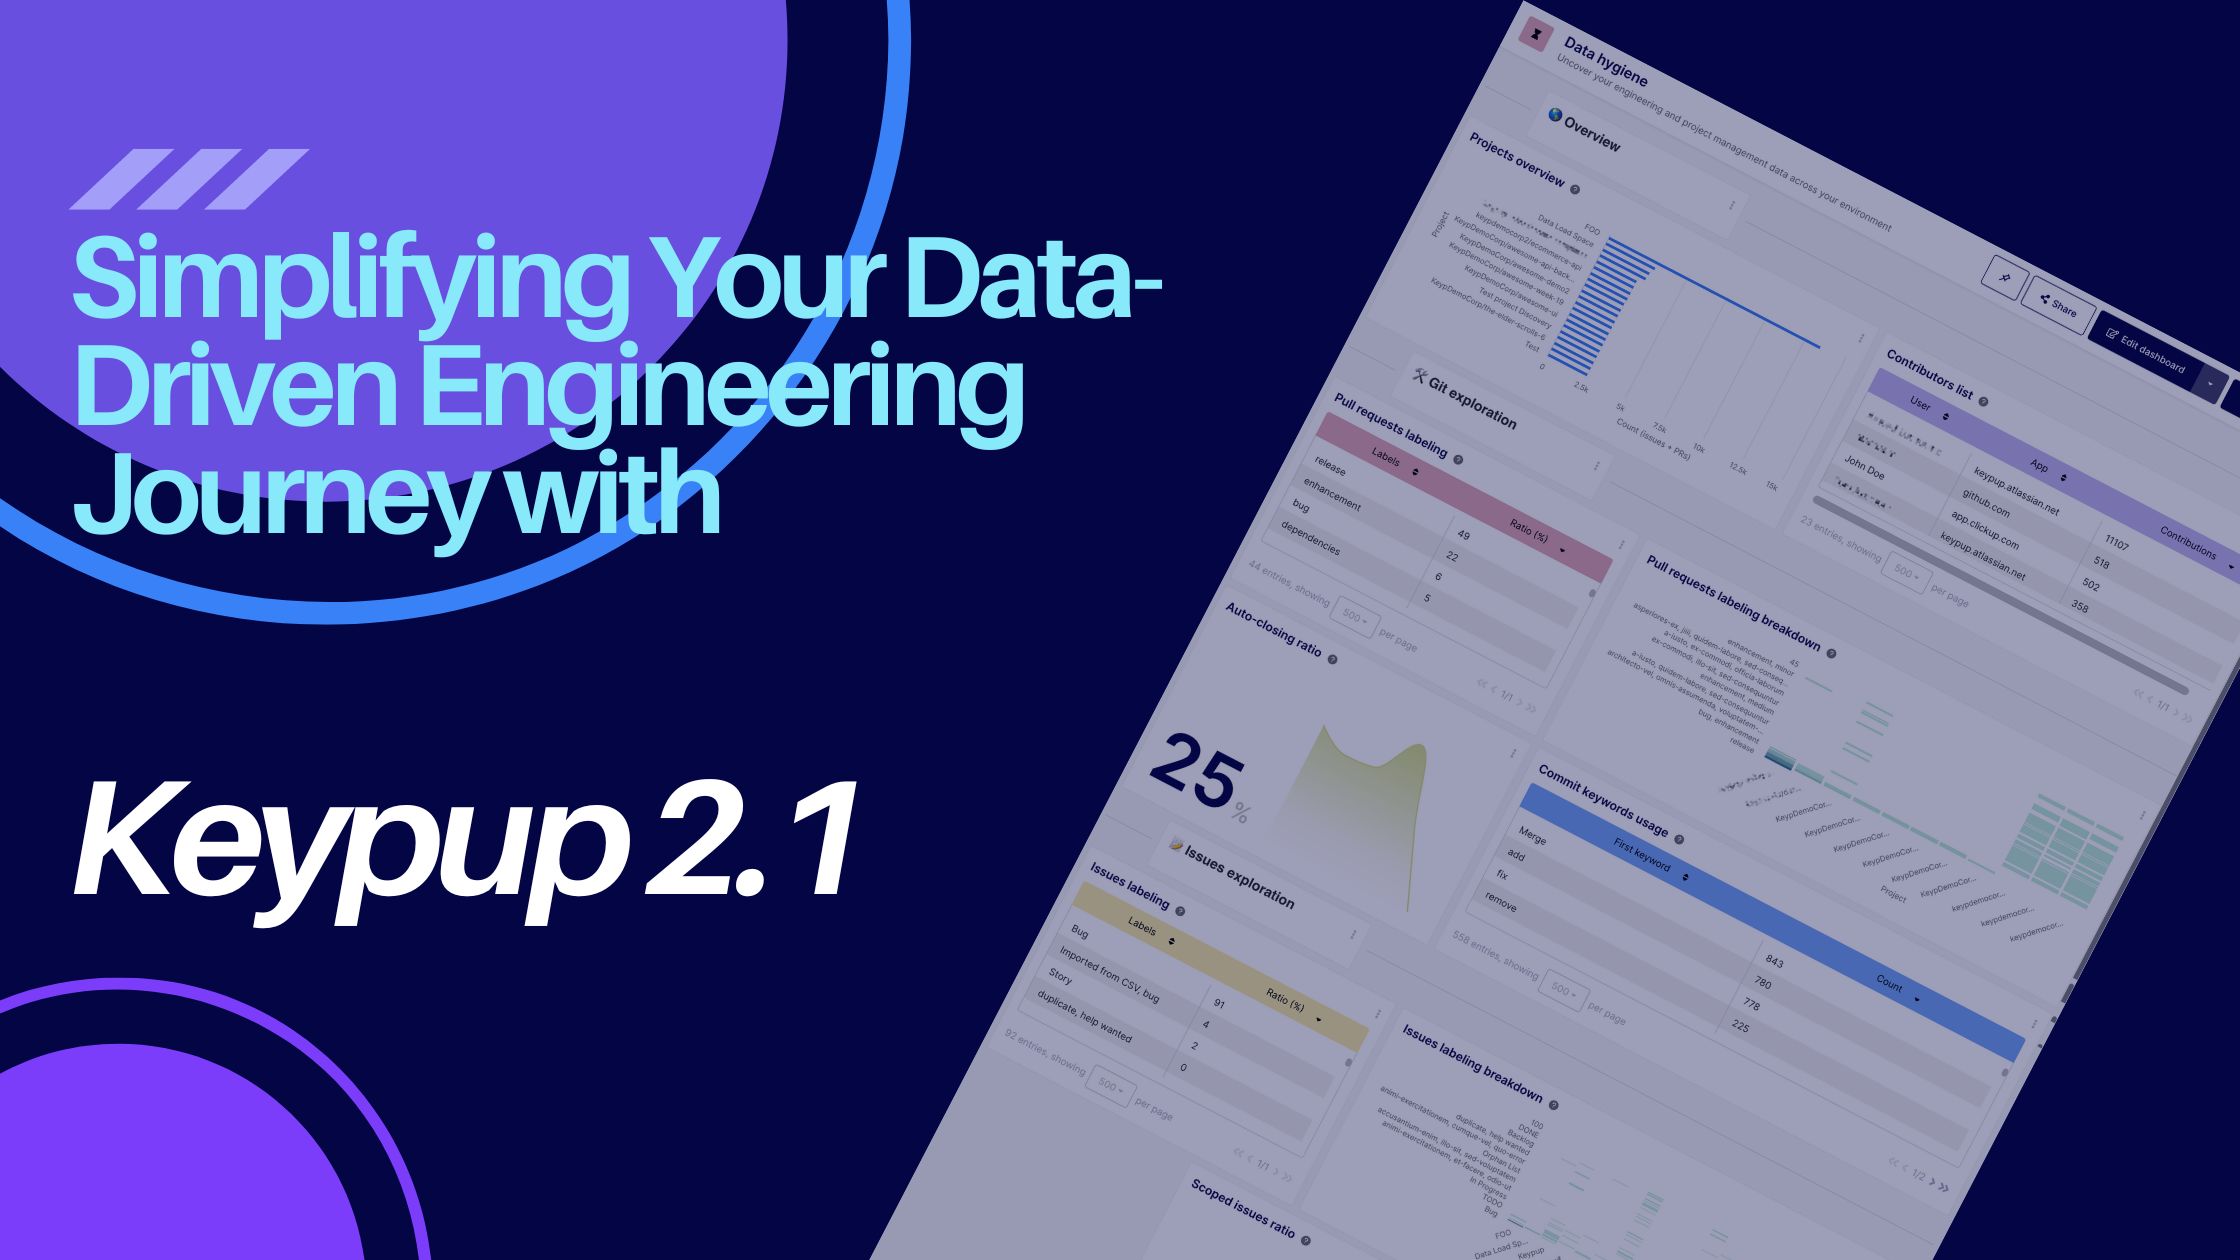
To succeed in the rapidly evolving world of software development, it is crucial to stay at the forefront of innovation. This is why we're so excited to announce the release of Keypup 2.1! This version contains a wide range of powerful new features to streamline your software development processes, drive engineering efficiency, and empower your team to succeed. Let’s explore our journey through the latest enhancements starting with the Dashboard-Wide Filtering feature, bringing new levels of flexibility and insight to your reporting.
Engineering dashboard-wide filtering simplifies and streamlines engineering reporting efforts for software development teams. Users can combine numerous identical insight filters into a single dashboard filter such as dates, teams, projects and more, creating a more efficient and cleaner reporting experience. You can gain a holistic view of your engineering metrics and KPIs by applying filters at the dashboard level rather than configuring filters for each insight individually, saving time, reducing complexity, and eliminating errors.
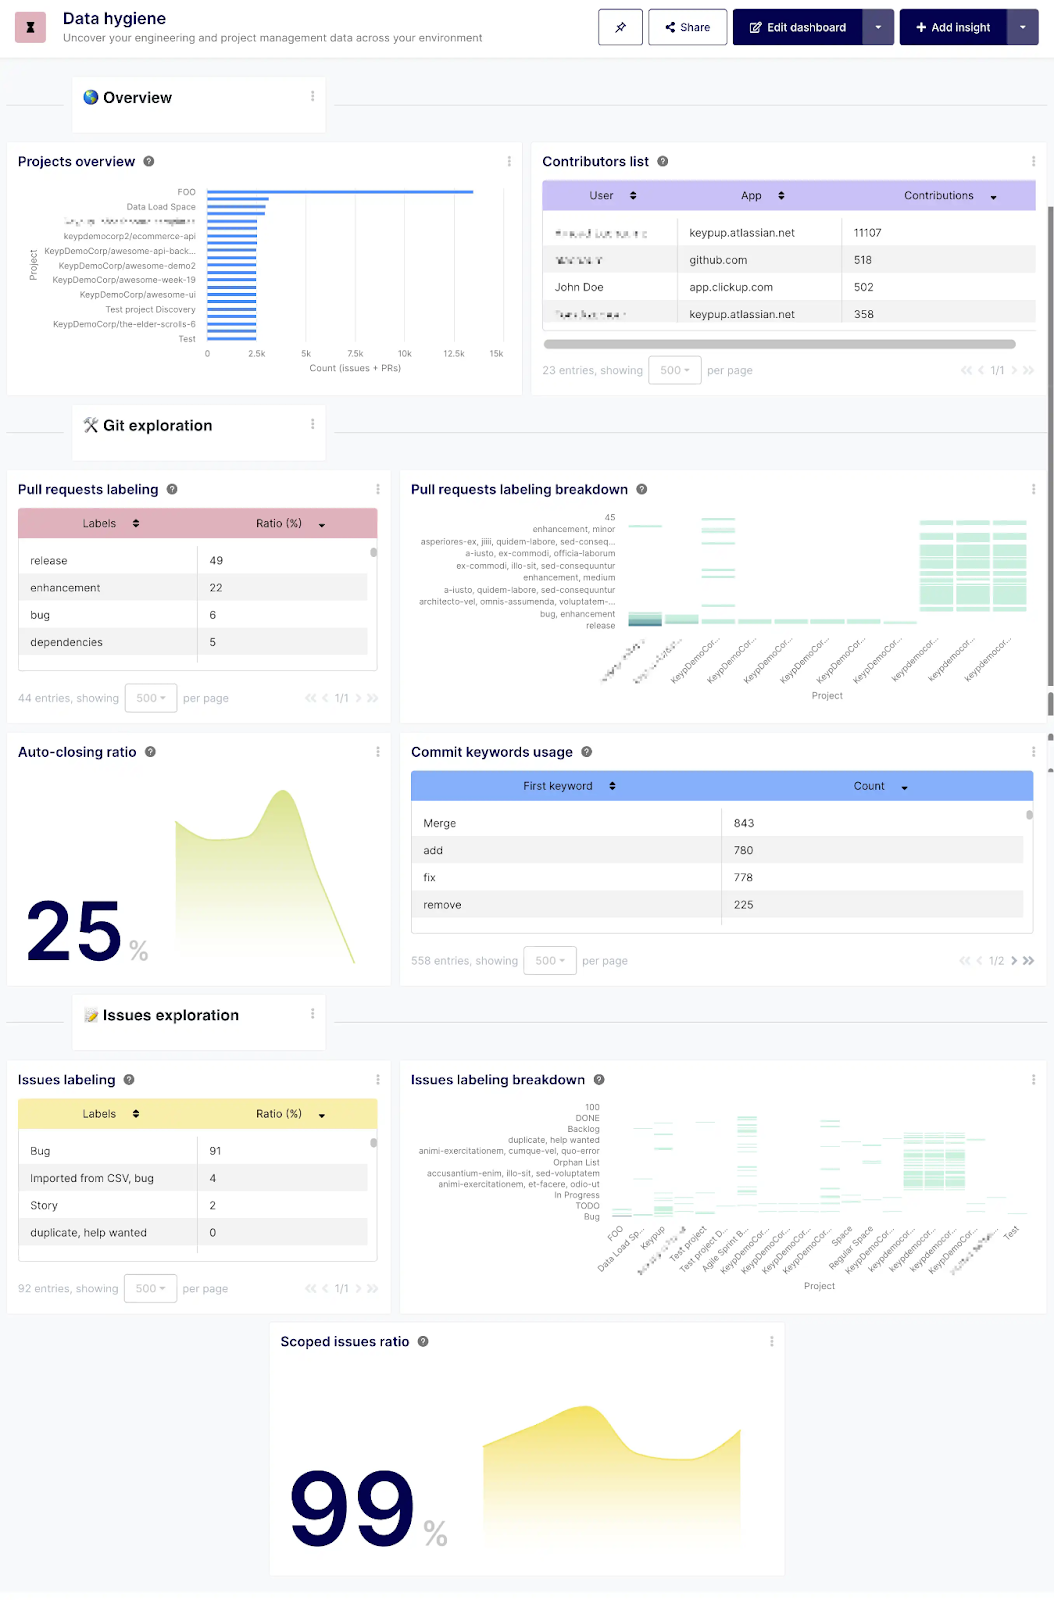
A standout feature of Keypup 2.1 is the Data Hygiene Dashboard. This tool provides valuable insights into keyword and label usage, team project proficiencies, and more, empowering tech leaders to dig deep into their engineering practices and data. With the Data Hygiene Dashboard, you can easily spot trends, identify areas for improvement, and facilitate more accurate reporting. Gain a holistic understanding of how your team utilizes keywords and labels, allowing you to facilitate and optimize engineering reporting practices.
Enhanced Data Visualization with New Chart Types
Keypup 2.1 introduces a range of new chart types, elevating your data visualization capabilities to new heights. Now, you can leverage line charts, stacked area charts, stacked column charts, and stacked bar charts to present your data in a visually compelling and informative manner. Whether you're tracking project progress, analyzing performance metrics, or monitoring engineering KPIs, these new chart types offer enhanced clarity and insights, enabling you to make data-driven decisions with confidence.
Smarter Drilldown for Seamless Data Exploration
Keypup 2.1 brings a smarter drilldown feature to the table, designed to enhance your data exploration process. This intelligent enhancement recommends relevant fields based on your dataset and insight configurations, providing a seamless and intuitive drilldown experience. By simplifying data navigation and exploration, you can save time and uncover valuable insights more efficiently, empowering you to make informed decisions and take proactive actions.
Introducing the Guest Role for Even More Collaborative Dashboards
Collaboration is a key component of successful software development projects. With Keypup 2.1, we introduce the Guest role, allowing you to invite guests to your team and share specific dashboards with them. Guests have read-only access, ensuring data security while enabling seamless collaboration with external stakeholders. This feature promotes transparency, fosters effective communication, and enables you to involve key stakeholders in your software development process.
Keypup 2.1 introduces an exciting enhancement that expands the dataset capabilities, enabling more granular reporting for software development teams. With this update, you now have access to additional fields that bring a new level of detail and comprehensive insights to your reporting efforts. Let's explore the benefits of these expanded dataset fields and how they empower you to make informed decisions.
- Story points: By leveraging story points, you can quantify the effort or complexity of each task or user story in your software development process. This allows you to track progress, estimate workloads, and prioritize tasks effectively. With story points incorporated into your reporting, you gain a better understanding of your team's productivity and can optimize your project planning and resource allocation.
- Workflow status (board swimlane): The addition of workflow status, also known as board swimlane, provides visibility into the progress and status of individual tasks within your project workflow. You can track tasks as they move through different stages, identify bottlenecks, and ensure smooth flow across your development pipeline. This field enables you to monitor task distribution, identify potential roadblocks, and optimize your workflow for increased efficiency.
- Issue type: With the ability to include issue types in your reporting, you can categorize and classify different types of issues or tickets in your software development projects. This allows you to analyze the distribution of issue types, identify recurring patterns or trends, and address specific areas of improvement. By gaining insights into the types of issues your team encounters, you can allocate resources more effectively and implement targeted solutions.
- Time spent: Tracking the time spent on specific tasks or issues is essential for understanding resource allocation, project progress, and team productivity. With the time spent field, you can accurately measure the effort invested in different activities and identify areas where time management can be optimized. This data helps you analyze productivity trends, manage workloads, and make data-driven decisions to streamline your software development processes.
- Time estimate: The inclusion of time estimate fields enables you to plan and forecast project timelines more accurately. By estimating the time required for each task or user story, you can set realistic deadlines, allocate resources effectively, and manage client expectations. This field provides valuable insights into project planning, allowing you to identify potential delays, make informed adjustments, and deliver projects on time.
- Parent issue: The parent issue field offers hierarchical visibility into the relationships between different issues or tasks. It allows you to understand the dependencies and connections between various elements within your project. By tracking parent-child relationships, you can assess the impact of individual issues on larger project milestones, manage dependencies effectively, and ensure smoother project execution.
Embrace Keypup 2.1: Your Path to Software Development Excellence
Keypup 2.1 is a significant milestone in our ongoing commitment to providing software development teams with the tools they need to excel. From the groundbreaking Dashboard-Wide Filtering and Data Hygiene Dashboard to enhanced data visualization, smarter drilldown, and collaborative features, this release is designed to streamline your processes, optimize reporting, and drive efficiency.
Try Keypup 2.1 today and embark on a journey toward enhanced software development processes.
Stay up to date with the latest news and insights from Keypup by following us on* Twitter** and** LinkedIn*. Explore the possibilities of Keypup 2.1 and revolutionize your software development processes today!