In today's fast-paced software development landscape, efficient data management and insightful analytics are crucial for success. As development teams work on complex projects with vast amounts of data, the ability to refine and focus on specific subsets of information becomes paramount. This is where dashboard-level filtering comes into play. By leveraging the power of dashboard filters, teams can streamline their data insights, simplify configuration processes, and enhance collaboration among team members. In this comprehensive guide, we will explore the ins and outs of using dashboard-level filtering to optimize your software development workflows. Whether you are a project manager, developer, or data analyst, this guide will provide you with the knowledge and tools to make the most of dashboard-level filtering and unlock the full potential of your data-driven decision-making process. Let's dive in and discover how to effectively use dashboard-level filtering to take your software development to new heights.
Benefits of Engineering Dashboard-Level Filtering
Dashboard-level filtering offers numerous benefits to software development teams, including:
1. Refining Engineering Data Insights
Dashboard filters allow you to refine and drill down into specific subsets of data, providing a clearer and more focused view of the information that matters most. By applying filters at the dashboard level, you eliminate the need to repeatedly apply the same filters to individual insights, saving time and effort.
2. Simplifying Configuration
With dashboard-level filtering, you can easily configure and customize your insights without the need for extensive manual filtering. By setting up filters at the dashboard level, you ensure that the desired filters are automatically applied to all insights within the dashboard, simplifying the configuration process and reducing the chances of error.
3. Improved Collaboration
Dashboard filters are particularly beneficial when sharing dashboards with team members or stakeholders who may be less proficient with the data analytics platform. By using dashboard filters, you provide a user-friendly approach for refining and exploring data, enabling better collaboration and understanding among team members.
How to Use Engineering Dashboard-Level Filtering
Finding and Configuring Dashboard Filters
To utilize dashboard-level filtering effectively, you need to know how to find and configure dashboard filters.
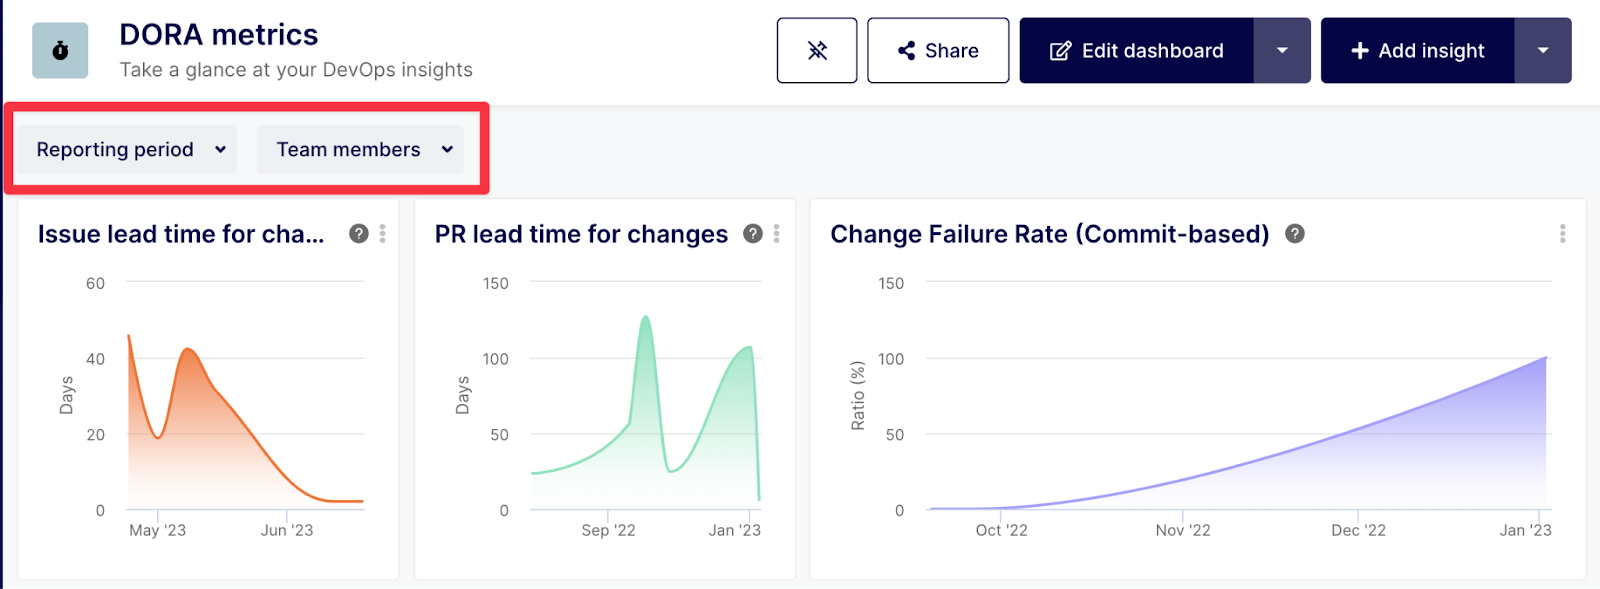
1. Enabling Dashboard Filters
Once enabled, dashboard filters appear at the top of your dashboard, just above your insights. Most dashboard templates come pre-configured with filters. If you don't see any filters, you can add them to your dashboard by following the next steps.
2. Creating and Applying Dashboard Filters
Dashboard filters can be created by users with Owner or Editor permissions on a dashboard. To add a new filter, follow these steps:
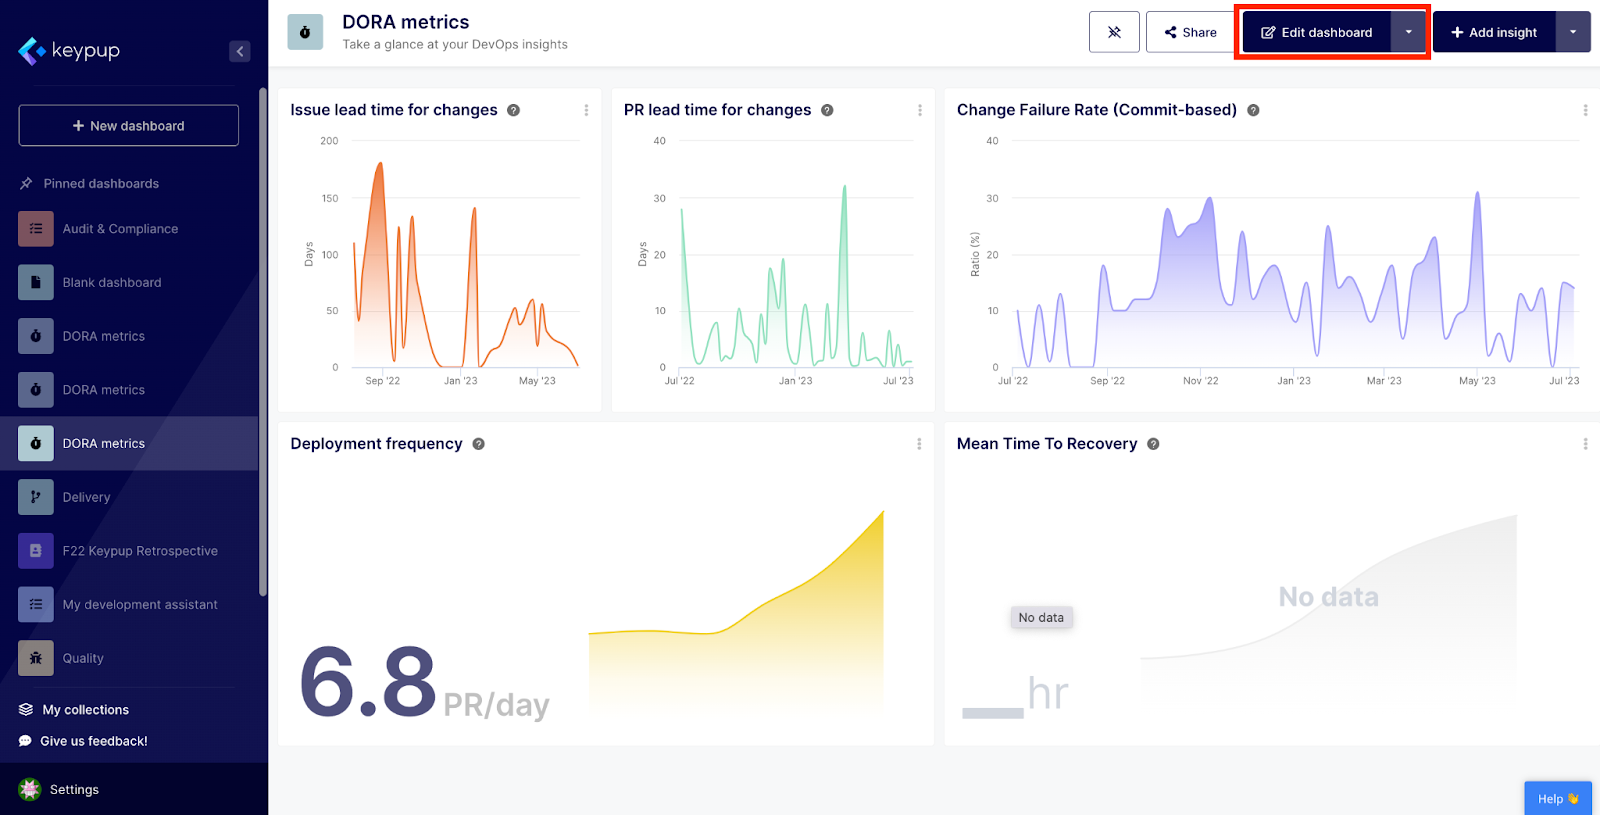
a. Enter Edit Mode
Click on the "Edit dashboard" button on the top right of your screen to enter edit mode.
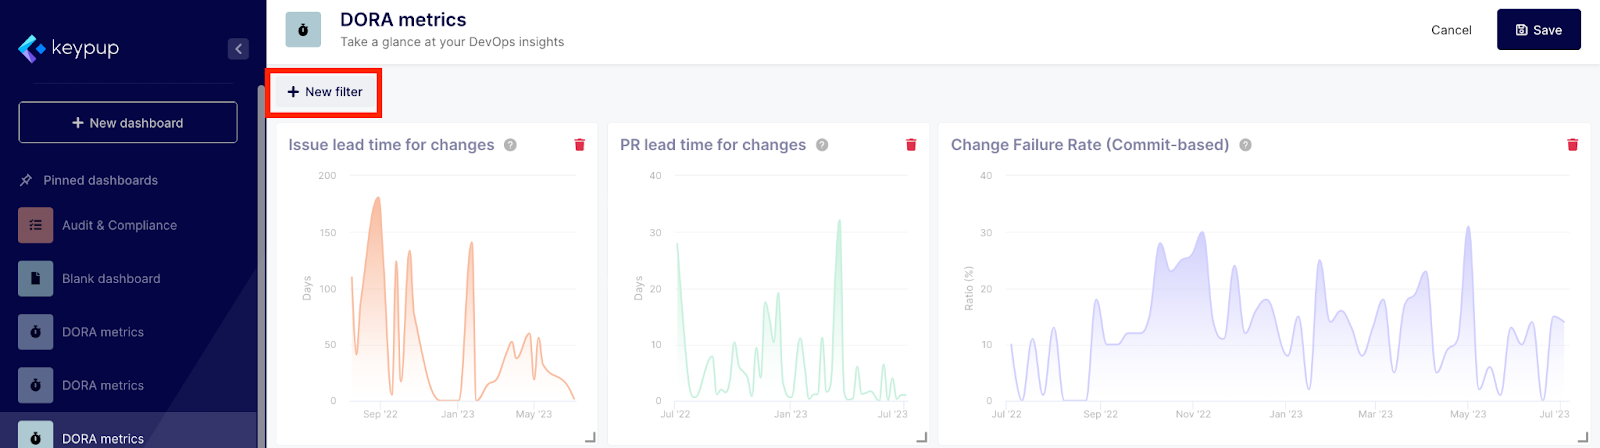
b. Create a New Filter
Under the dashboard title, click the "New filter" button to open the dashboard configuration window.
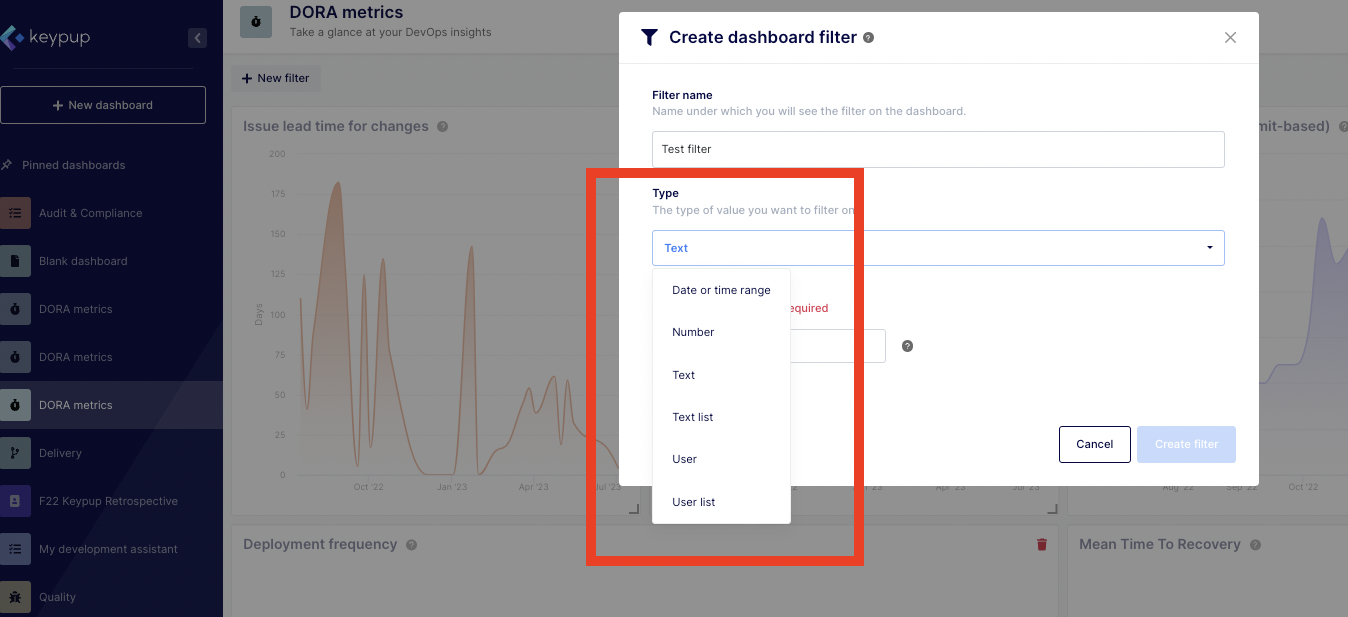
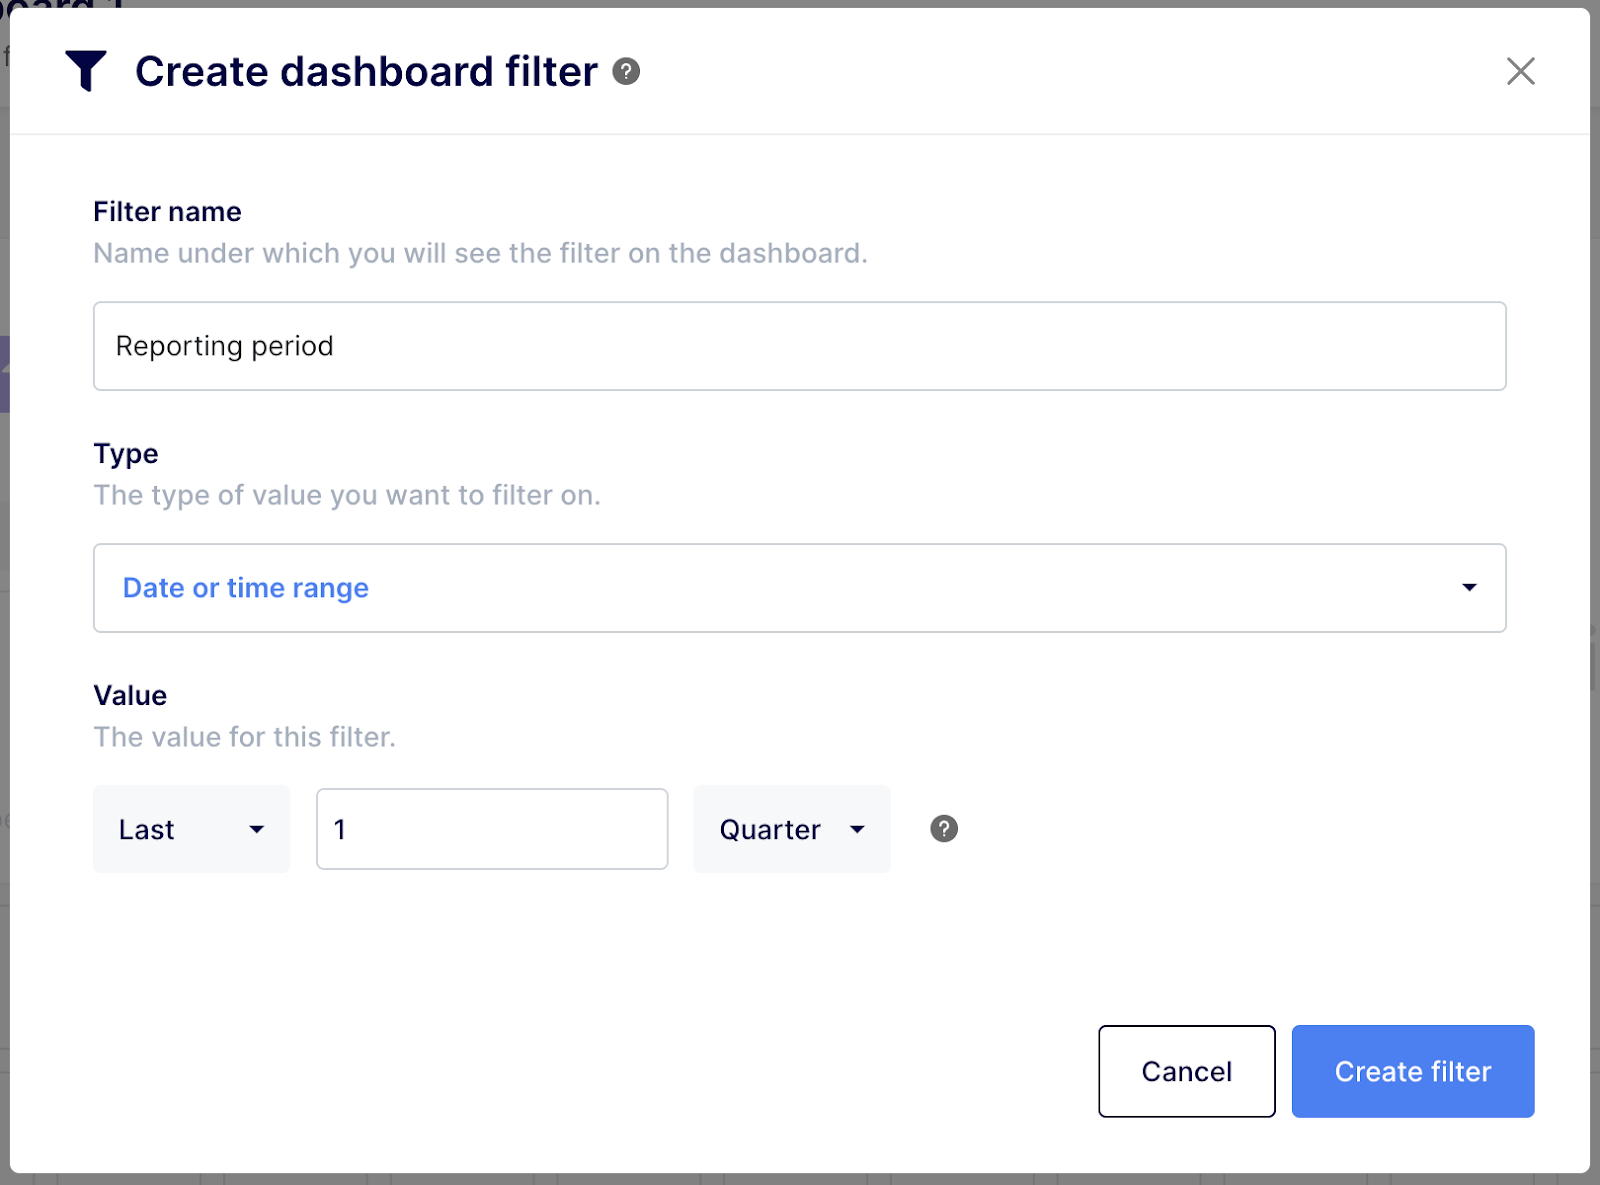
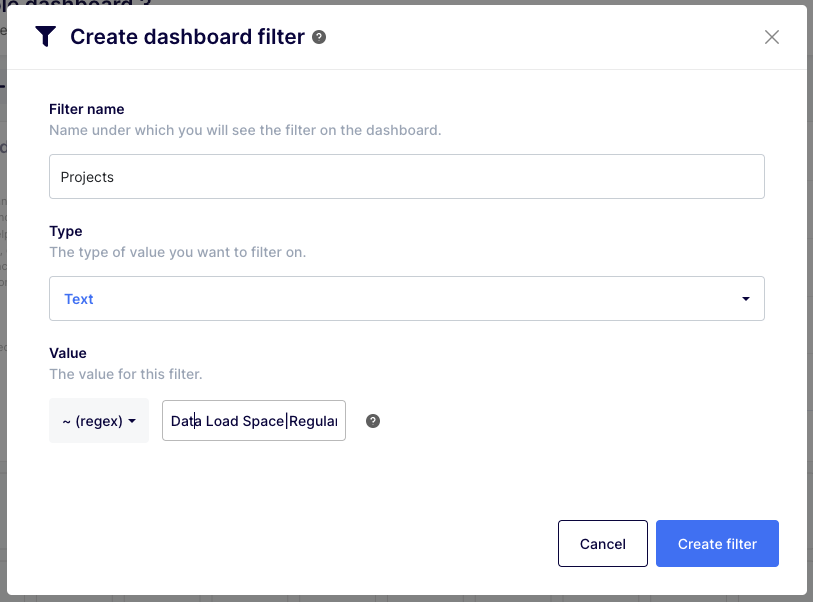
c. Filter Configuration
In the configuration window, provide the following details for the new filter:
- Filter name: Give a descriptive name that will appear on the dashboard. Test filter is used in this example.
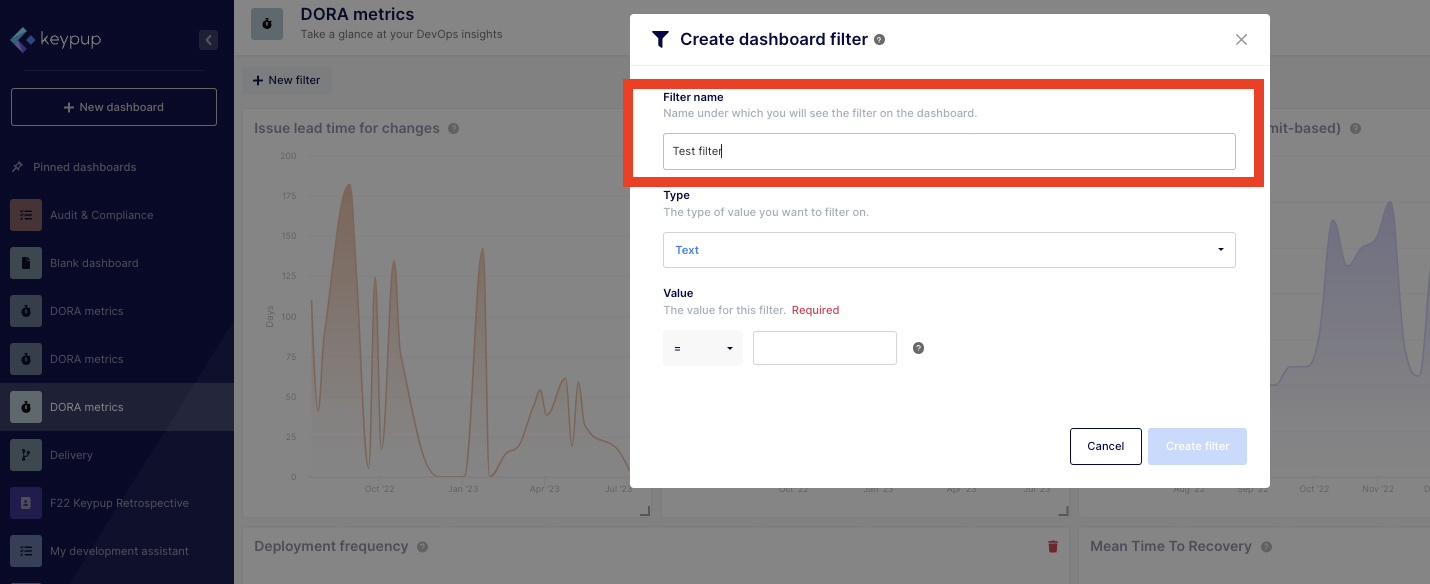
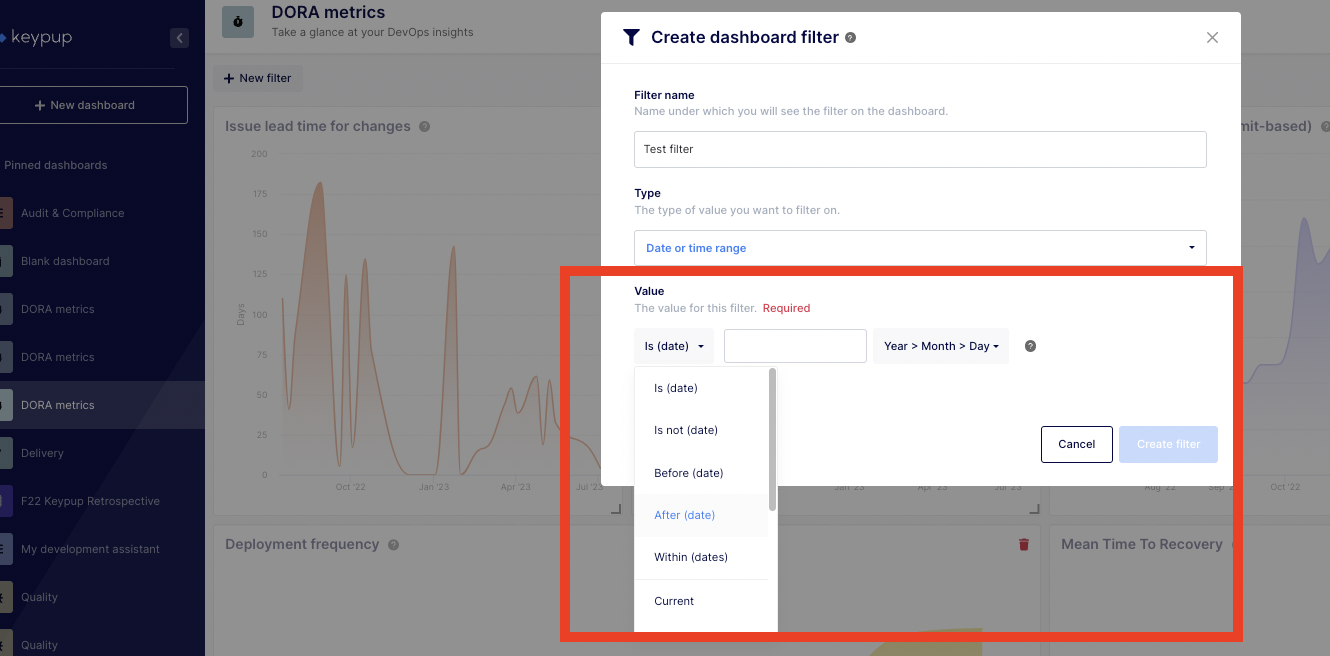
- Type: Select the type of input for the filter (e.g., text input, date, user, text list). We’ll select “Date or time range” for this example.
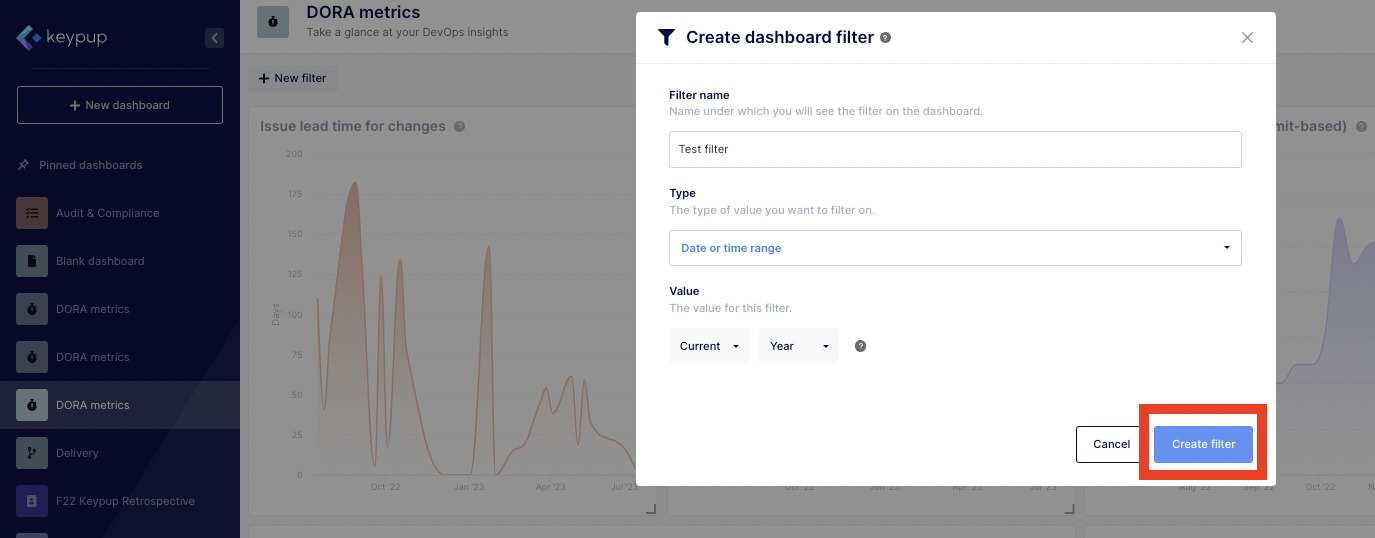
- Value: Specify the filtering value that will be applied to each insight. We’ll select “Current” and “Year” for this example.
d. Save the Filter
Click the "Create filter" button on the bottom right of the window to save the filter to your dashboard.
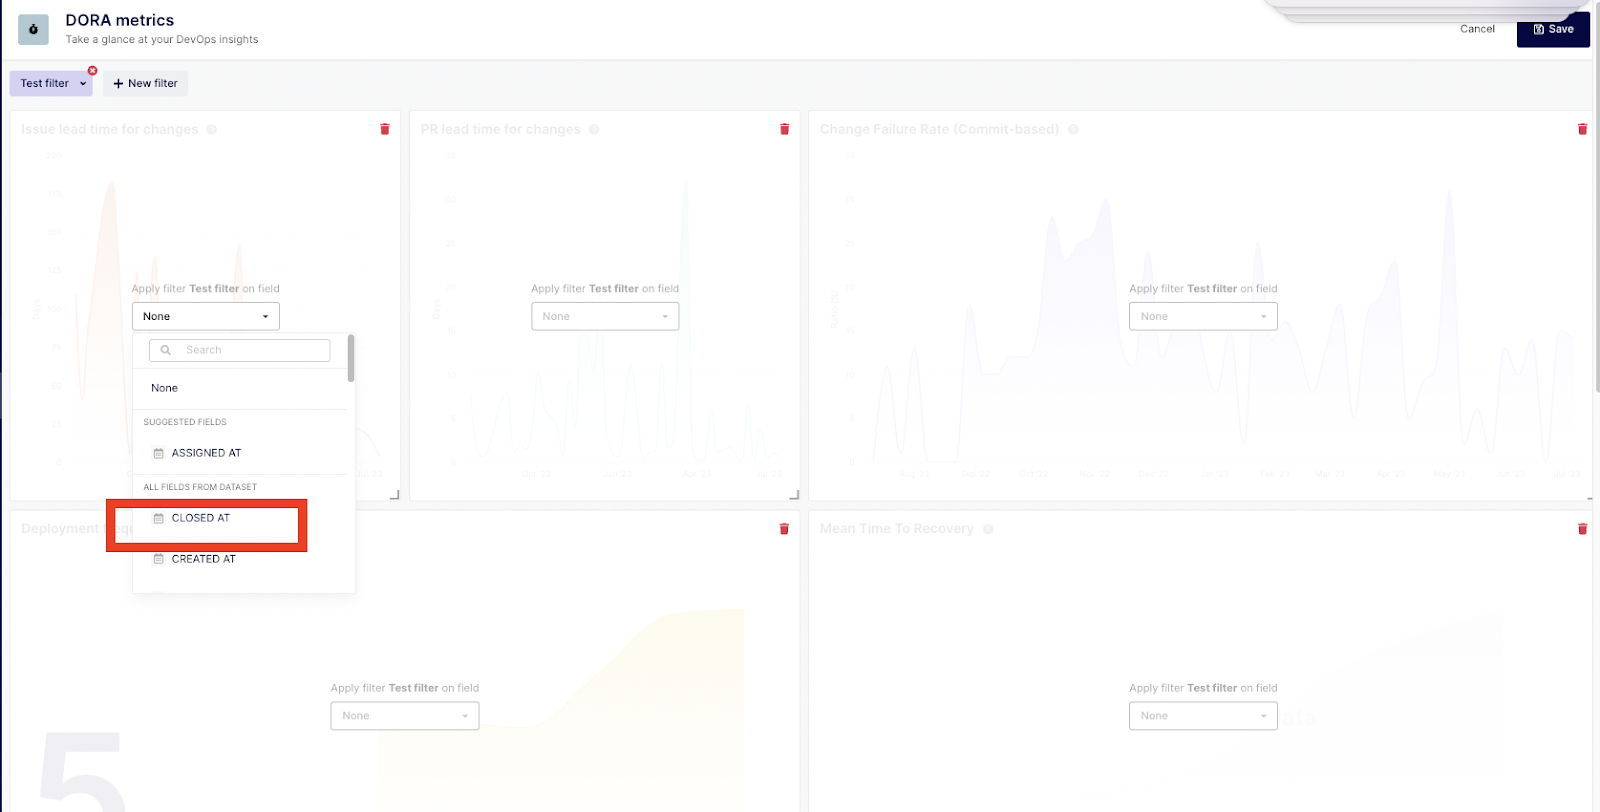
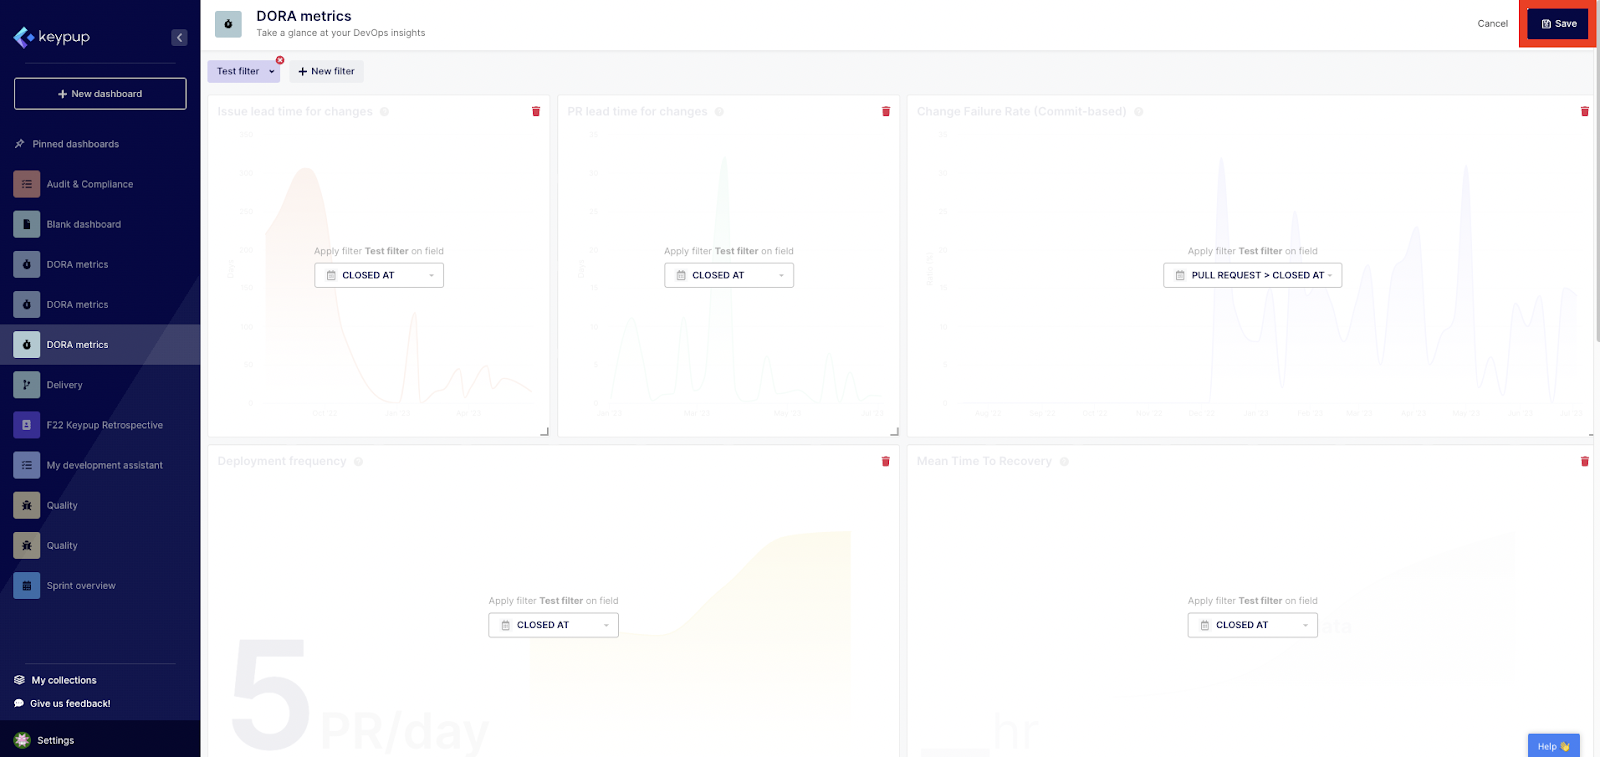
e. Apply the Filter
Based on the filter type you’ll be selecting, you’ll need to apply the filter on a specific field at an insight level. For date ranges, for example, you’ll need to select which date field you want to filter on. In this example, we’ll select the “Closed at” date. Note: depending on the dataset, the options may vary. Once done, don’t forget to save your filter by clicking on the “Save” button located at the top right of your screen.
3. Editing Dashboard Filters
Users with Owner or Editor roles can edit filter values by clicking the down arrow next to the filter's name. Changes are immediately visible on the insights but are not persisted unless saved. To persist changes, click the "Save" button.
Filtering Rules and Precedence
Dashboard filters follow specific rules and have precedence over insight filters. Understanding these rules is essential for effective use of dashboard-level filtering. Here are some key points:
- Dashboard filters are added to preexisting insight filters using an AND combinator.
- Dashboard filters take precedence over insight filters. If a dashboard filter conflicts with an insight filter (using the same field), the dashboard filter will override the insight filter.
Examples and Tips for Dashboard Filters
To help you understand how to leverage dashboard filters effectively, here are a few examples and tips:
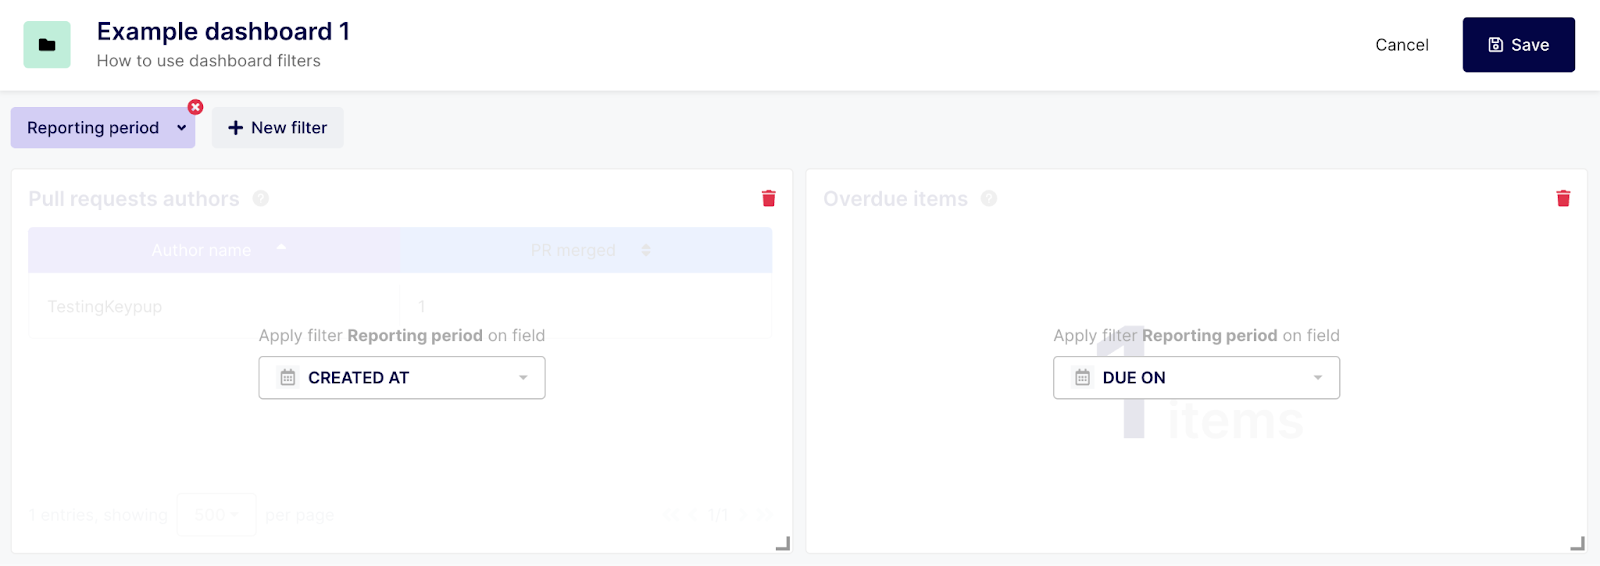
Example 1: Reporting on the Last Quarter
Filter-to-insight association:
Apply the filter on the "Created At" field to retrieve pull requests created in the last quarter.
Apply the filter on the "Due On" field to retrieve overdue items from the last quarter.
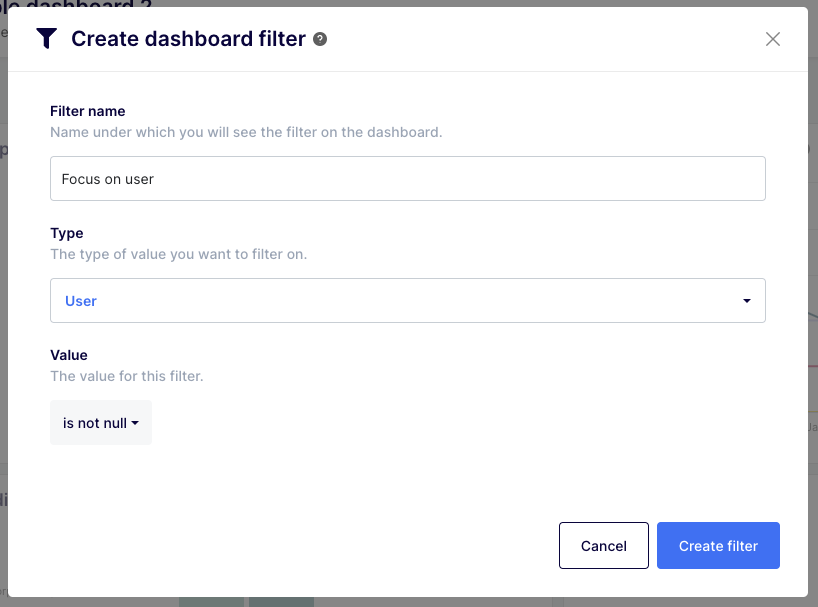
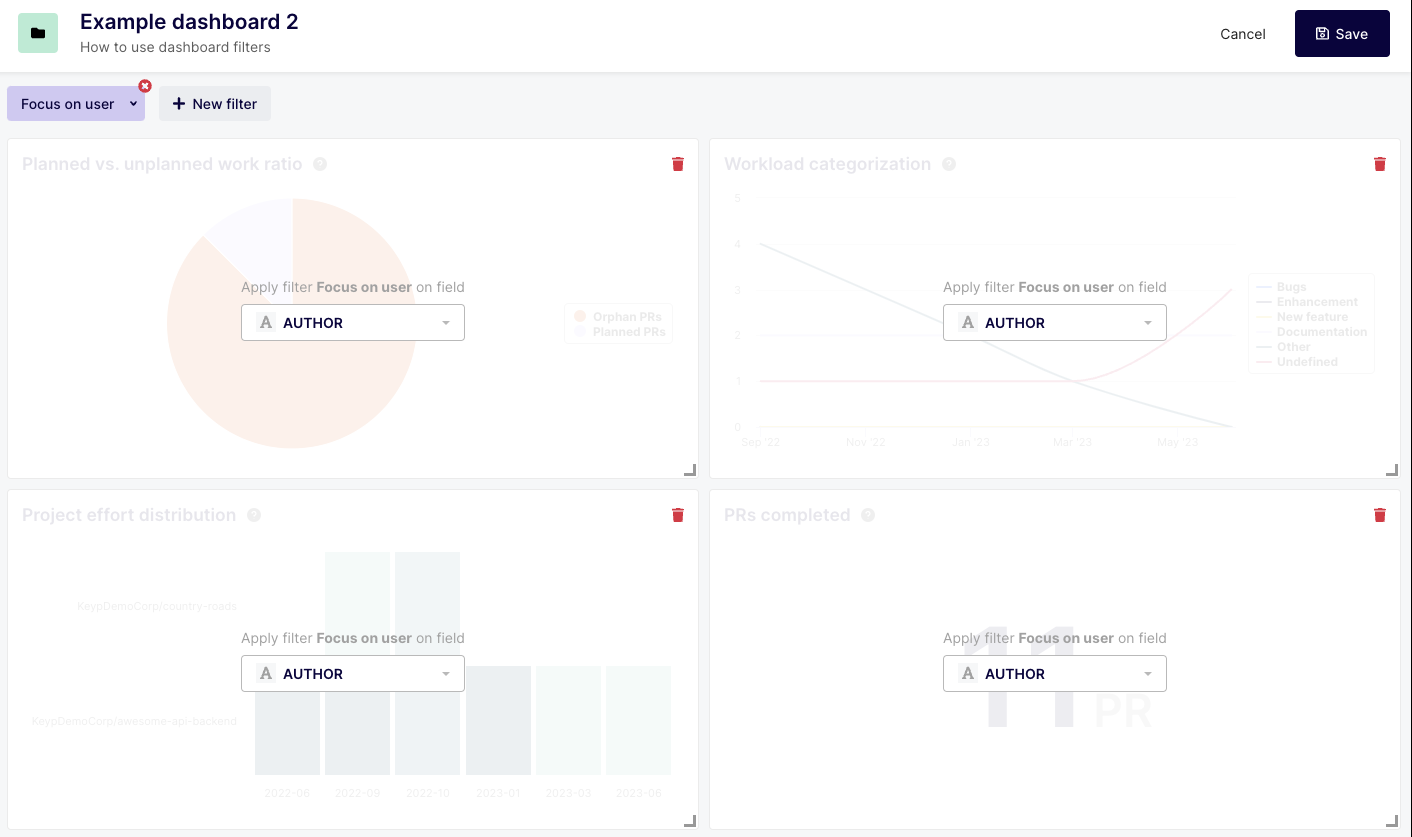
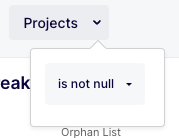
Example 2: Reporting on a Specific User
Dashboard filter: "Focus on user"
Type: Text
Value: "jdoe" (default value)
To show data associated with all users, change the operator to "is not null" instead.
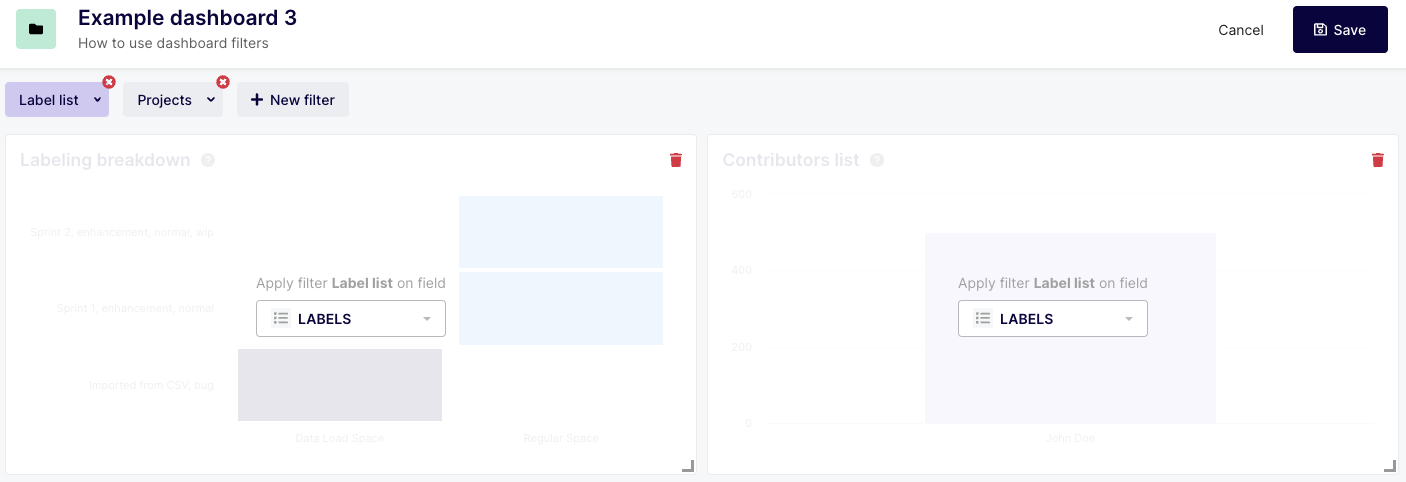
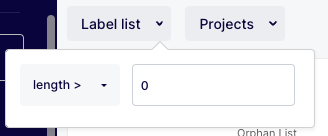
Example 3: Dashboard for Specific Projects, Labels, and Types
Dashboard filter 1: "Labels"
Type: Text list
Value: "contains any of: “bug, incident, documentation, feature, enhancement”

Filter-to-insight association:
Apply filter 1 on the "Label" field to restrict insights to the chosen labels.
Apply filter 2 on the "Project" field to focus on a specific project.
Association for filter 1
Association for filter 2
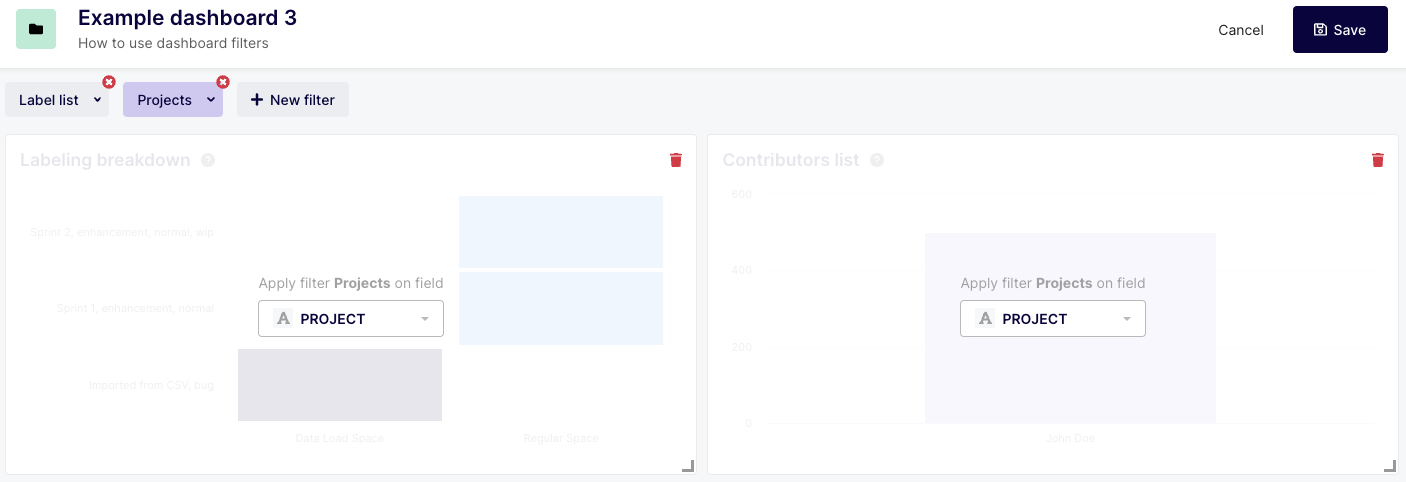
Insights and Drilldown Results
Both insights and their drilldown reports restrict the results to the defined labels and project.
The filters can be widened by defining non-restrictive filters, such as:
Unlock Engineering Actionable Insights and Drive Success
Dashboard-level filtering is a powerful tool for optimizing software development workflows. By refining data insights, simplifying configuration, and enhancing collaboration, teams can make more informed decisions and drive success in their software projects. By following the steps and tips outlined in this article, you can leverage the full potential of dashboard-level filtering and unlock valuable insights into your development process. Start using dashboard-level filtering today and take your software development to new heights!
Start Refining Your Insights with Dashboard-Level Filters!