Visualization Enhancements
📈 Cycle-Time Chart
Visualize your entire development lifecycle from ideation to production.
Easily identify potential bottlenecks and areas for optimization.
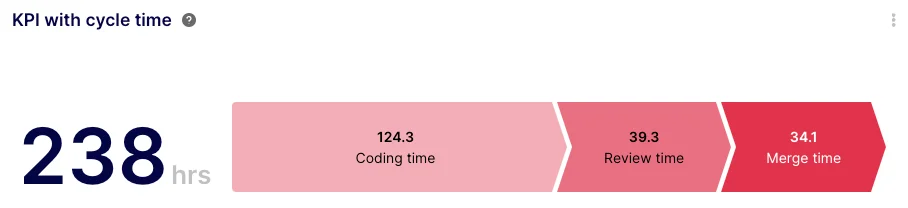
🚀 KPI with Cycle-Time
Monitor key performance indicators tied directly to your cycle-time.
Make informed decisions backed by concrete data metrics.
⚙️ Gauge Chart
Gauge your development velocity and productivity in an intuitive, visual format.
📏 Log Scale Customization
Enhanced customization options for charts with the addition of log scales.
Available for lines & area charts, column & bar charts, and the gauge chart.
Google SSO
Introducing a frictionless way to get started with Keypup:
🔗 Sign-Up with Google
Quick and easy onboarding via your Google account.
Existing users can now link their Google account for an even smoother experience.
🎬 Seamless Dashboard Onboarding
Each dashboard now comes with a handy video guide defining each insight and its goal.
Locate this guide in the right panel of the Configuration Assistant for a seamless user experience.
Query Engine Upgrades
Our backend has received significant updates to provide users with more capabilities:
✨ Enhanced Filter Operators & New Operators & Aggregators
- "Contains any of" filter operator has been improved for both user and userlist fields, enhancing dashboard filtering experience.
- FLATTEN: Useful for breaking down array fields.
- LOG & LN: Enhanced mathematical functions for refined data analytics.
- EXP: Execute complex calculations with Euler’s number.
- LENGTH: Extended to support string parameters.
- RIGHT/LEFT: Extract specific portions from a string effortlessly.
- PERCENTILE & PERCENTILE_CONT: Derive both discrete and continuous values for any given percentile in a numeric field.
Boost Your Software Development Analytics with Keypup's Latest Features!
Explore the new capabilities, streamline your processes, and achieve unparalleled efficiency with your team.