Imagine you're a project manager leading the development of a new e-commerce platform.You have a team of developers, designers, testers, and other specialists working on various tasks. Your job is to ensure everything runs smoothly, stays on schedule, and delivers a high-quality product within budget.
However, software development is rarely a linear process. Issues arise, tasks take longer than expected, and unexpected dependencies emerge. This is where metrics like issue cycle time and monthly average time in column become crucial tools for project managers.
What are Idle Issues, Issue Cycle Time and Average Time in Status metrics and how can they directly help Project Managers achieve their goals?
The Hidden Enemy: Idle Issues
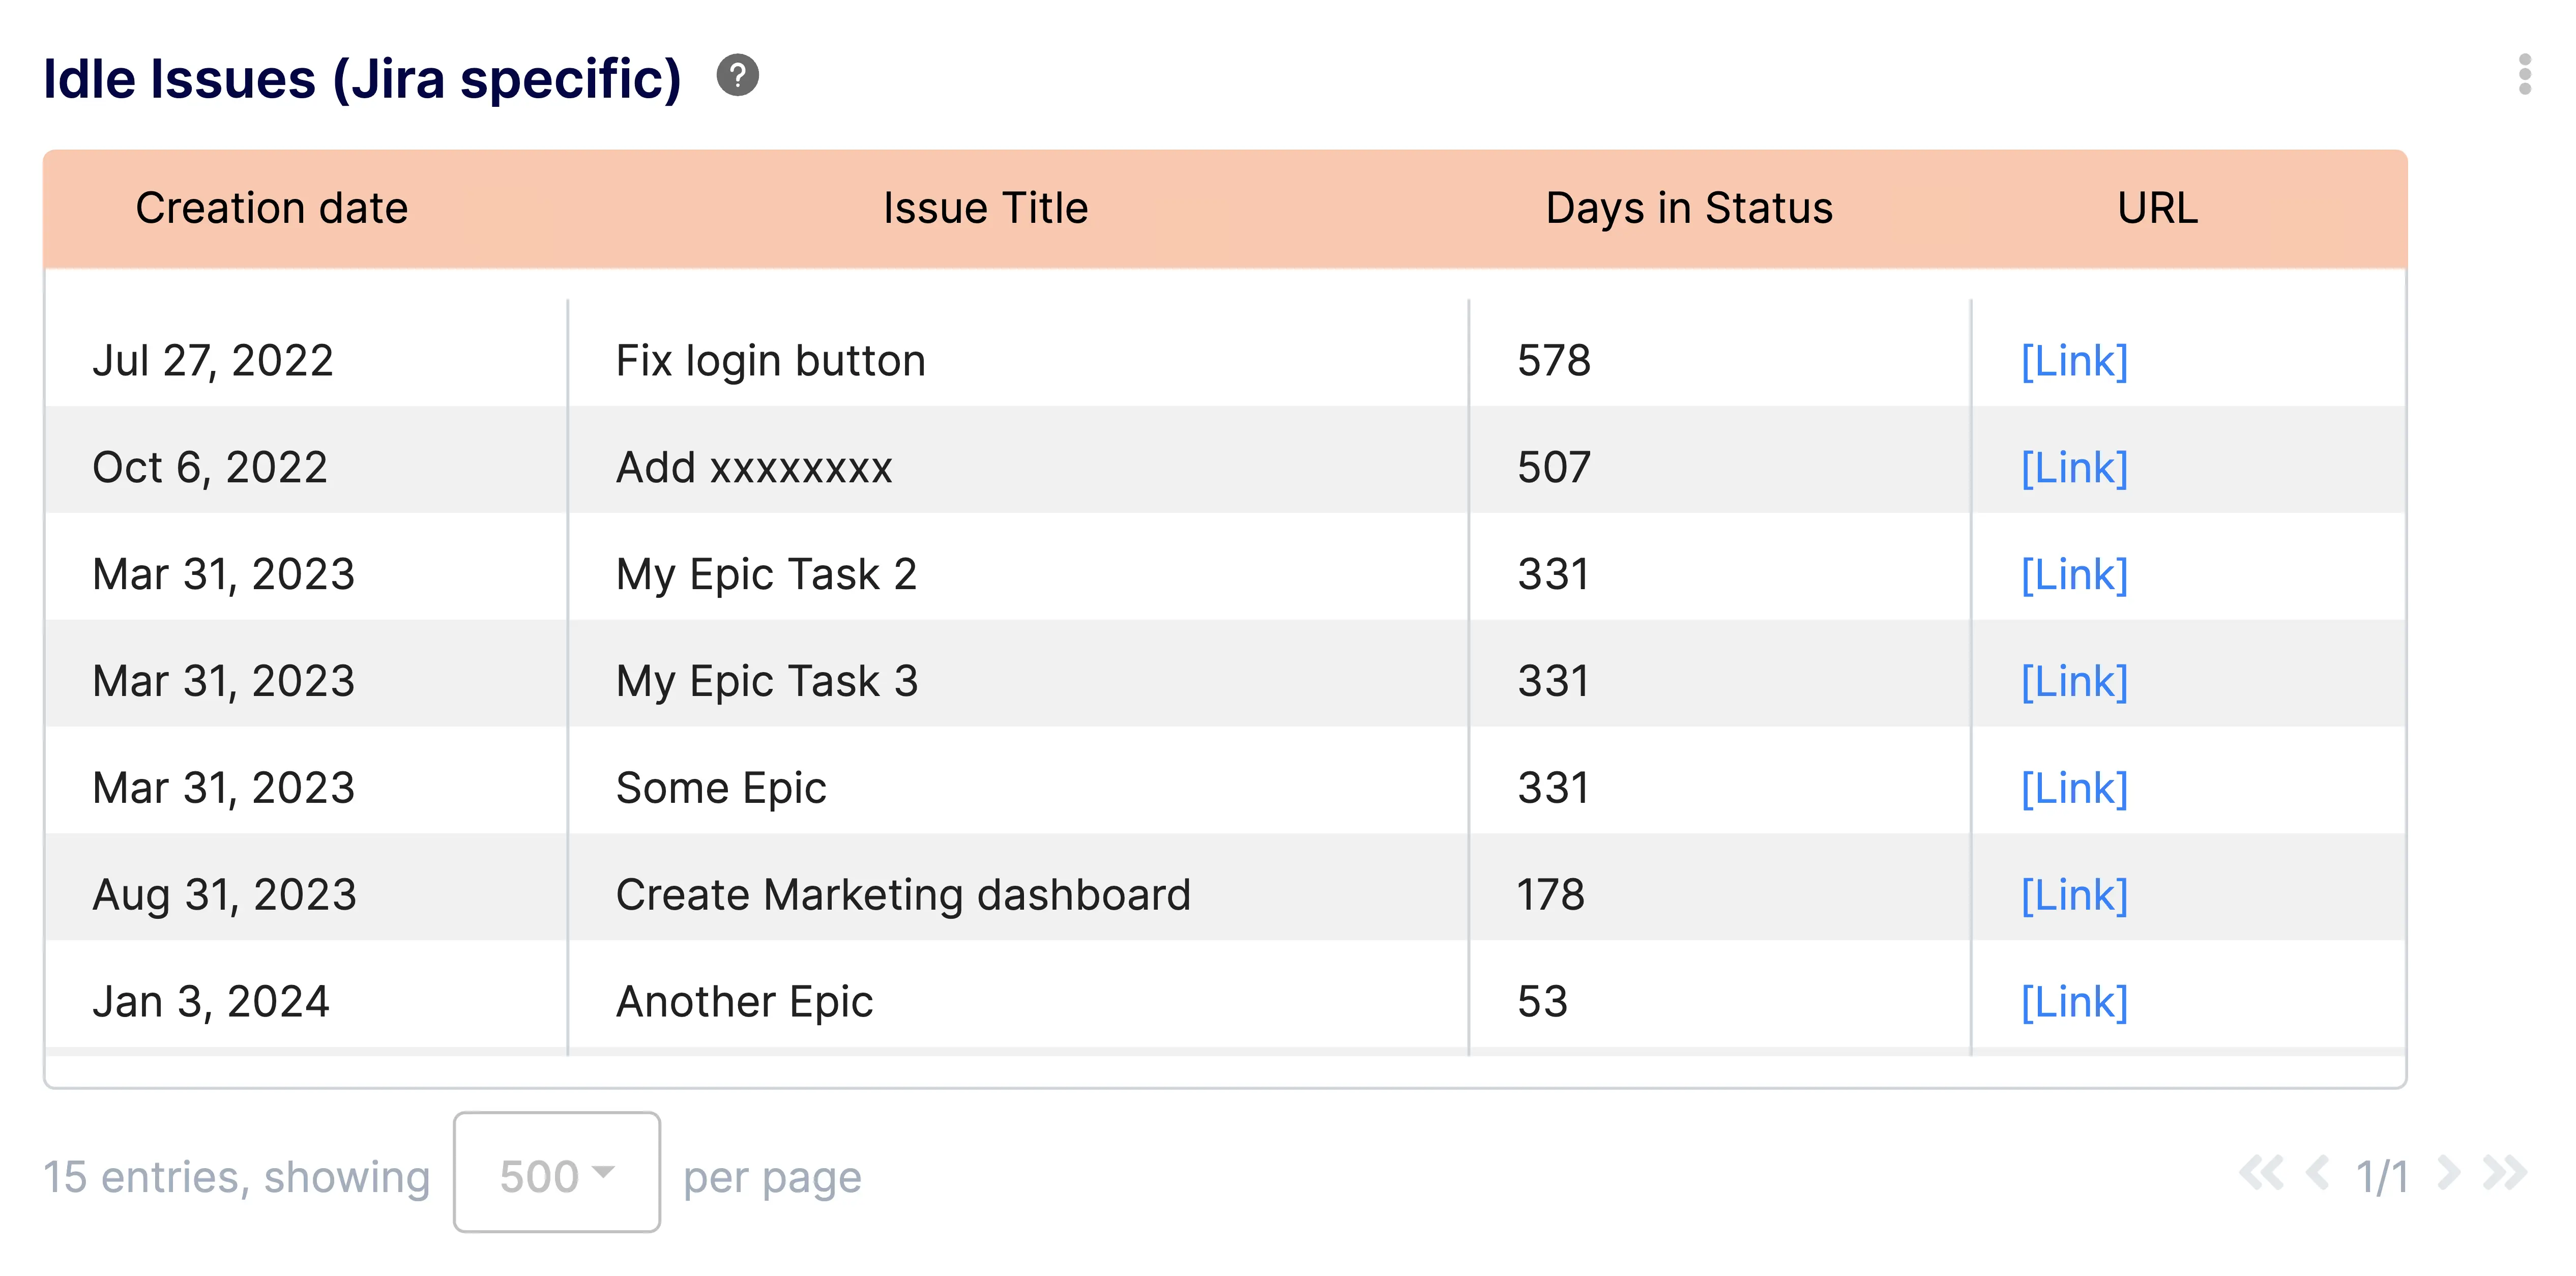
Before diving into the metrics themselves, let's address a critical aspect – idle issues. These are tasks or bugs that get stuck in a particular stage of the workflow for an unusually long time. Imagine a critical bug fix ticket languishing in the "In Review" column for weeks. This not only delays the resolution of the bug but can also hold up dependent tasks, impacting the entire project timeline.
An Idle Issues Report, such as the turnkey one proposed** **by Keypup for Jira and Trello issues, is a valuable tool in this regard. It helps identify issues that haven't been updated within a specific timeframe, acting as an early warning system for potential roadblocks.
Let's see how this translates to real-world project management scenarios:
- Example 1: The Stalled Feature
Imagine a feature critical to the launch of your e-commerce platform is stuck in the "Development In Progress" stage for two weeks, exceeding the expected time by a significant margin. The Idle Issues report flags this issue, prompting you to investigate. By looking at the Engineering Workload Distribution for instance, you may discover that the developer assigned to the task is overloaded and requires additional resources. By proactively addressing this bottleneck, you can prevent further delays and ensure the feature is completed on time, whilst helping prevent valuable resources burnout.
- Example 2: The Unclear Requirement
Another scenario: a bug fix ticket gets trapped in the "In Review" stage for days on end. The Idle Issues report highlights this issue. Upon investigation – through analysis of the Review Time combined with the Reviews Distribution metric for instance , you discover that the reviewer is unclear on the specific requirements for fixing the bug. By facilitating a quick communication session between the developer and reviewer, you can get the bug fix moving again and prevent a potential domino effect on dependent tasks.
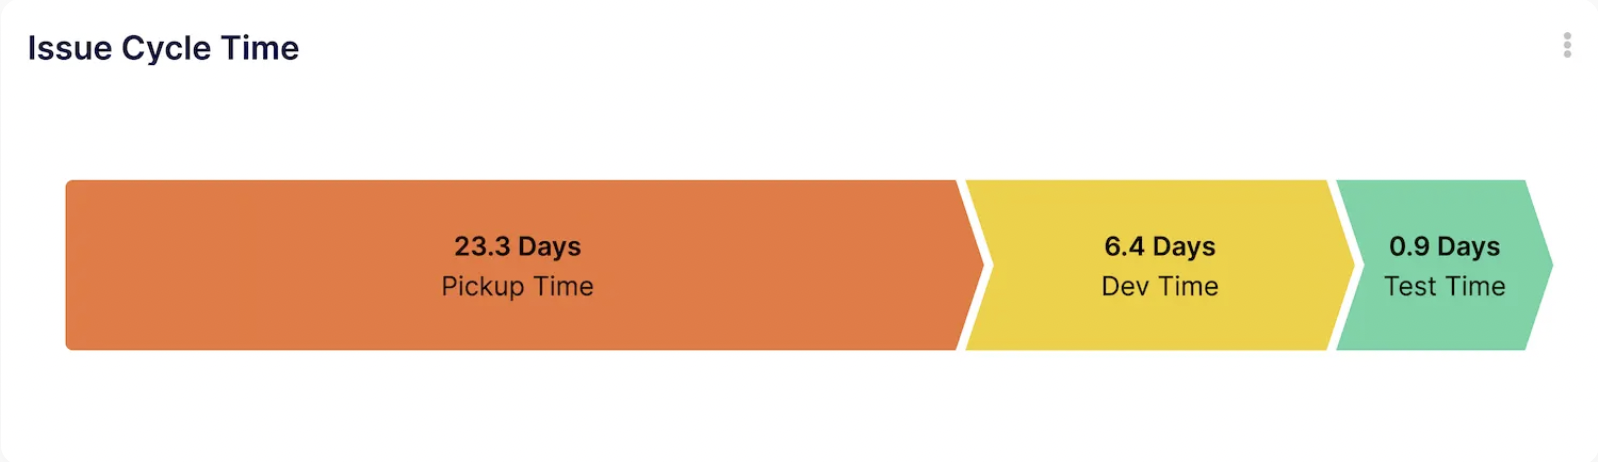
Issue Cycle Time: Understanding Your Development Pipeline
Issue cycle time refers to the total time taken to complete an issue, from its creation to final resolution. This metric – provided out of the box on the Keypup platform - provides valuable insights into the efficiency of your development pipeline.
Let's see how project managers can utilize it:
- Example 3: Identifying Bottlenecks
Issue cycle time analysis reveals that tasks consistently take longer than expected in the "Testing" stage. This indicates a potential bottleneck in your testing process. Further investigation might reveal a lack of testers, insufficient automation scripts, or unclear testing procedures. With this knowledge, you can initiate improvements, like hiring additional testers or streamlining the testing process, to ensure smoother task flow.
- Example 4: Setting Realistic Estimates
Analyzing historical issue cycle time data allows you to create more realistic timelines for new tasks. Imagine a similar feature like the one mentioned earlier needs to be developed. By understanding the average cycle time for development tasks of similar complexity –for instance by looking at the Historical Work on Branches metric, you can provide a more accurate estimate for the new feature's completion. This helps produce reliable schedules and timelines for delivery, set realistic expectations for stakeholders and prevents future delays.
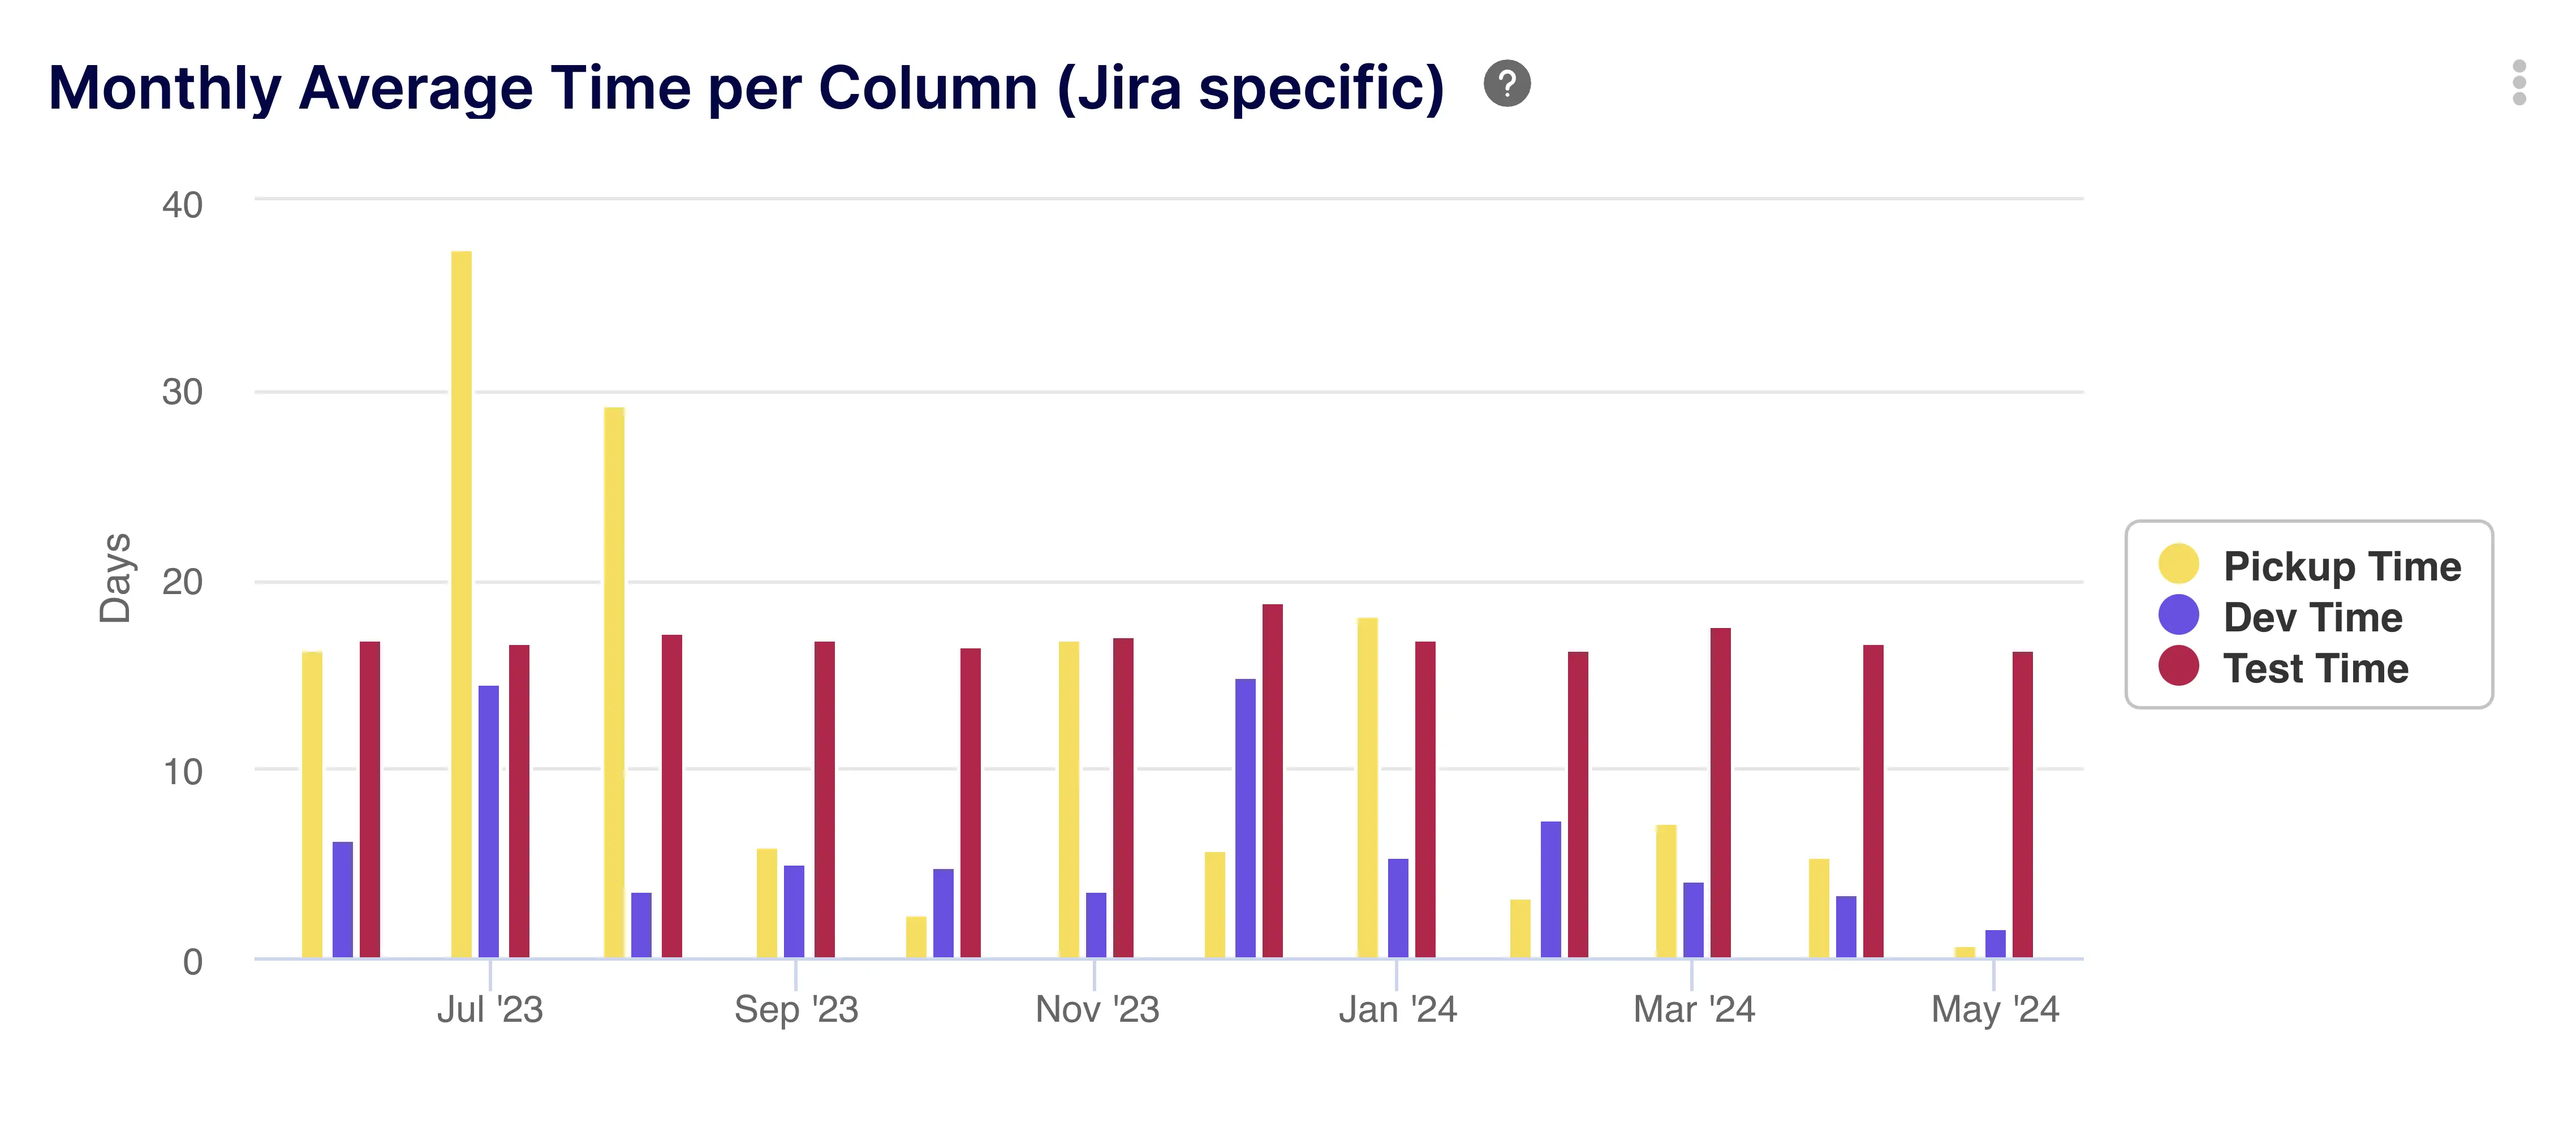
Monthly Average Time in Column: Seeing the Bigger Picture
Monthly average time in column, also known as time in status, refers to the average amount of time that issues spend in a particular stage of the workflow within a month. This metric helps project managers understand how long tasks typically take at each stage.
Keypup's Monthly Average Time in Column Report goes beyond individual issues and provides a broader perspective on workflow efficiency.
Here's how it empowers project managers:
- Example 5: Identifying Workflow Blockages
The monthly average time in jira status data shows a significant increase in the average time spent in the "Code Review"stage over the past month. This indicates a potential workflow blockage in the code review process, that can be further assessed with the Review Analysis metric for instance. This could be due to a lack of available reviewers, reviewer overload, or unclear code review guidelines. By identifying this issue, you can implement solutions like assigning additional reviewers, setting clearer review expectations, or encouraging pair programming to expedite code review and prevent delays.
- Example 6: Resource Allocation Optimization
By analyzing the monthly average time in column data, you understand how long tasks typically take in each stage. This allows you to allocate resources more effectively. Imagine your team consistently spends a longer-than-expected time in the "Design Review" stage due to the complexity of the designs.You can then consider assigning a dedicated designer to review these complex designs.
How Idle Issues, Issue Cycle Time and Average Time in Status metrics can directly help project managers with resources management and allocation?
Improved Resource Allocation with Monthly Average Time in Column
Beyond identifying skill gaps, monthly average time in column data empowers project managers to make informed decisions about resource allocation in several ways:
- Example 7: Identifying Underutilized Resources: Consistently low average times in column for a particular team member might indicate underutilization of their skills. This knowledge allows you to strategically assign them more challenging tasks that leverage their expertise or provide opportunities for professional development in new areas.
- Example 8: Forecasting Resource Needs: When planning future projects, historical monthly average time in column data provides a valuable reference point for estimating resource requirements. By analyzing average times for different task types, you can anticipate the workload needed for various stages of the project and allocate resources accordingly.
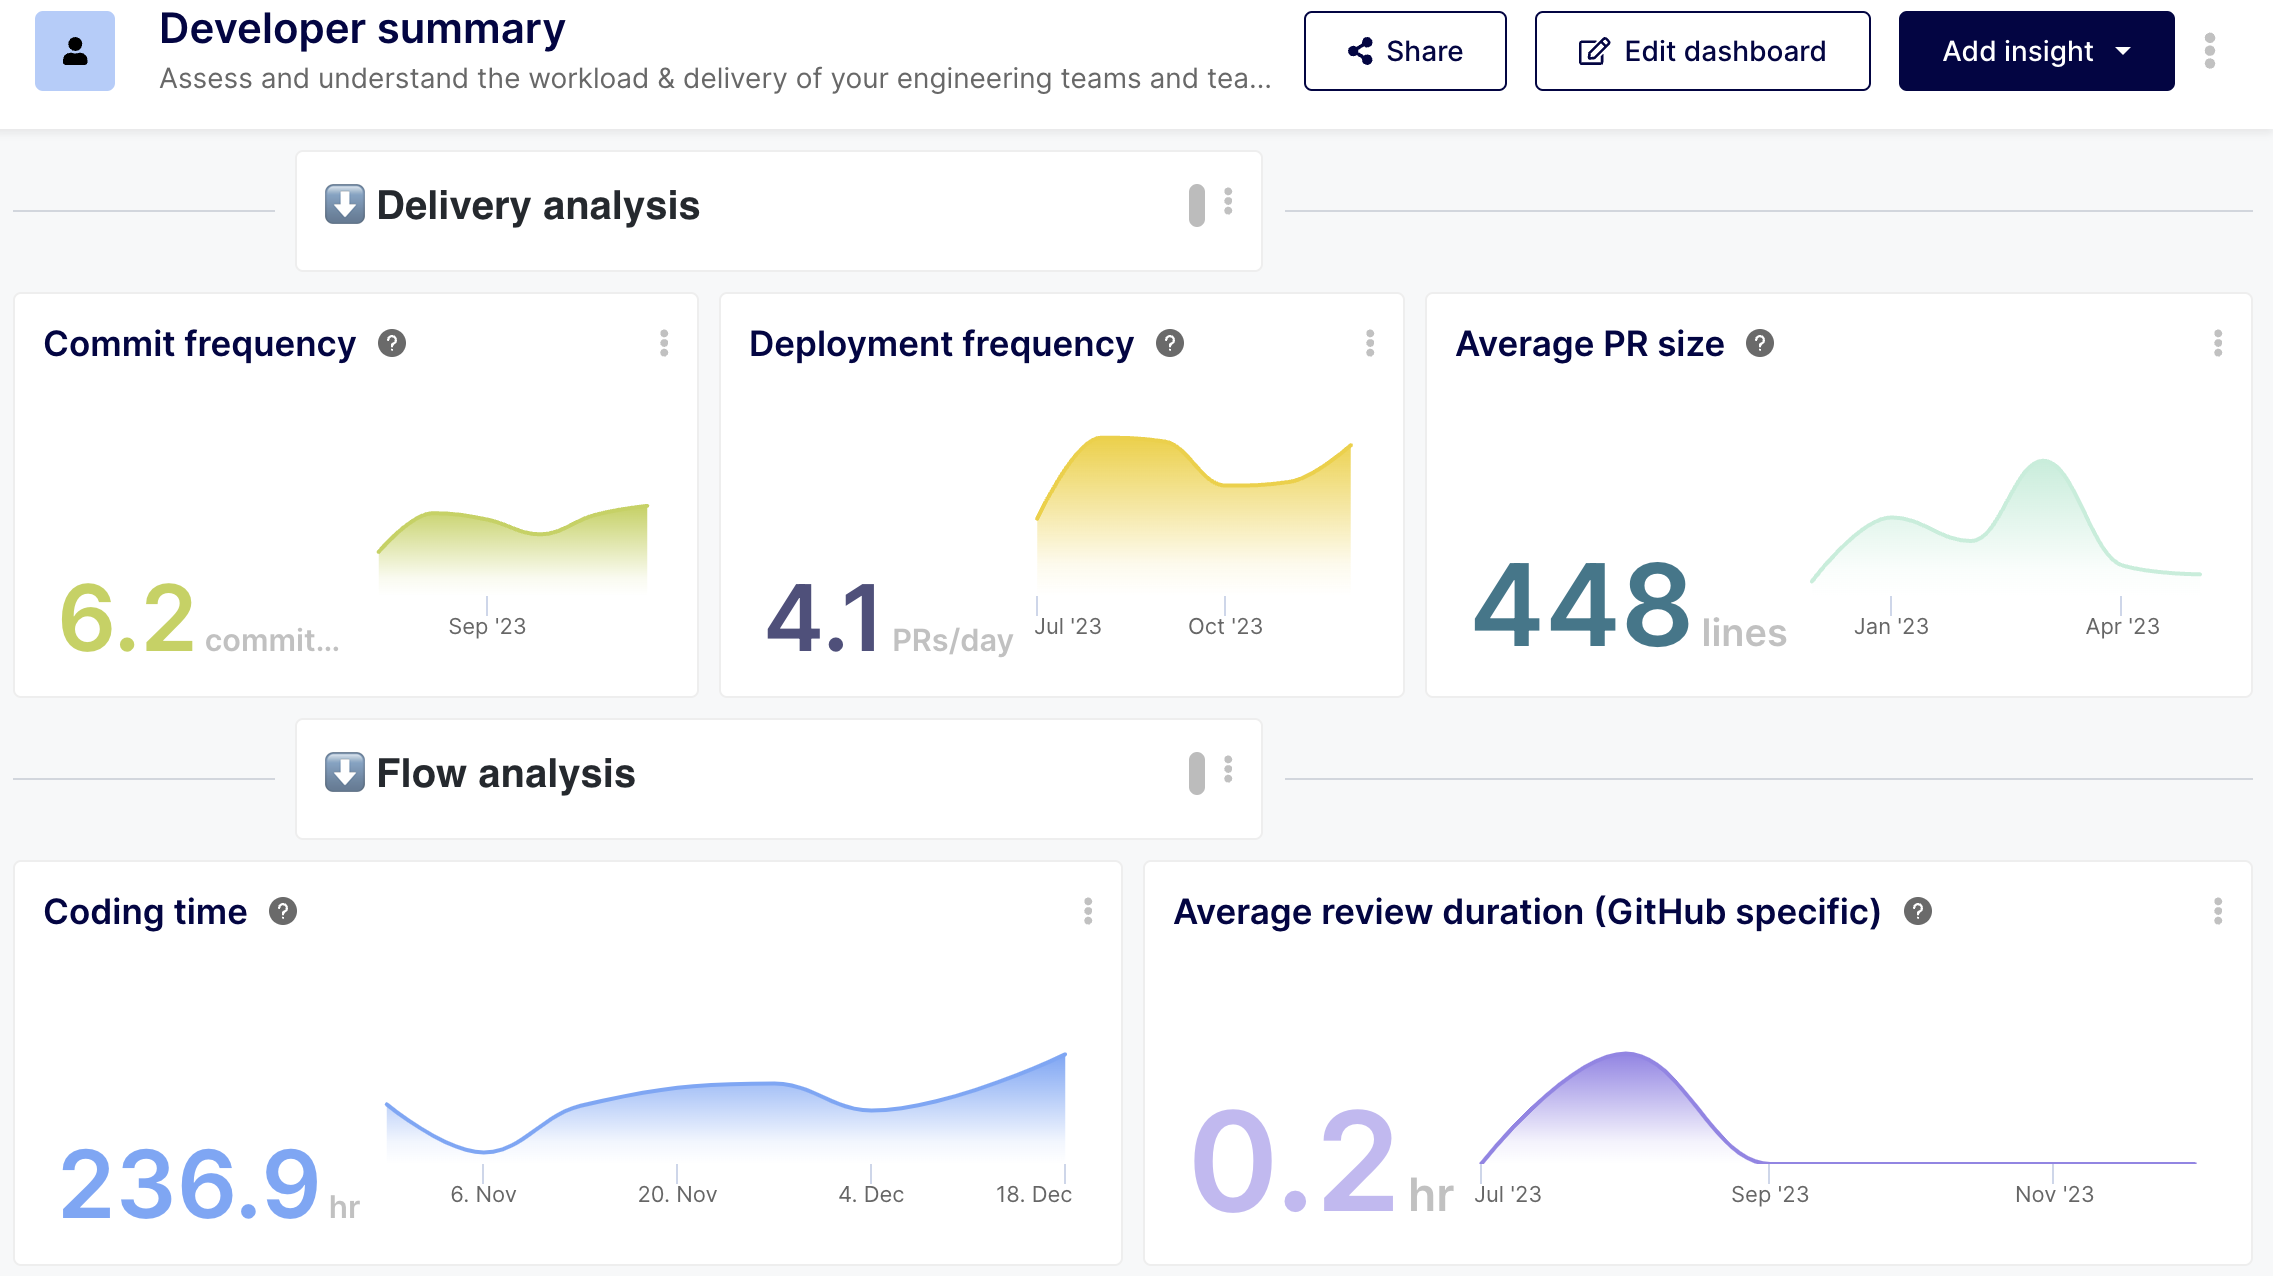
Using a set of metrics to deepen the analysis, such as Commit and Deployment Frequency, Coding Time, Individual Review Duration, Issues by Due Dates, Project Effort Distribution and Engineering Work Pattern Analysis, gathered in an easy-to-read and interpret Developer Productivity Dashboard, project managers can achieve more with the resources allocated to their projects, increase efficiency and avoid crippling fatigue and burn-outs.
Realistic Project Planning with Combined Metrics
By combining insights from issue cycle time and monthly average time in column, project managers gain a comprehensive understanding of their development workflow. This empowers them to create realistic project plans that not only set achievable deadlines but also account for potential risks:
- Example 9: Scenario Planning: Project managers can leverage historical data to create different project scenarios based on expected issue cycle times and average times in column. For instance, you can create a best-case scenario assuming optimal workflows and average cycle times, and a worst-case scenario considering potential delays and bottlenecks. This scenario planning allows for a more nuanced understanding of project timelines and helps manage stakeholder expectations.
- Example 10: Buffer Time Allocation: Based on historical data on variations in issue cycle times, project managers can strategically allocate buffer time in project plans. This buffer time acts as a safety net, allowing the project to absorb unforeseen delays without derailing the overall timeline. By analyzing trends in cycle times, project managers can determine the appropriate amount of buffer time to allocate without impacting efficiency.
Enhanced Team Collaboration with Data-Driven Insights
The data gleaned from issue cycle time and monthly average time in column analysis transcends individual tasks, fostering improved team collaboration in several ways:
- Example 11: Identifying Knowledge Sharing Opportunities: Analyzing issue cycle time data might reveal patterns of specific developers consistently taking longer on certain task types. This could indicate a knowledge gap within the team. By facilitating knowledge-sharing sessions or mentoring programs, project managers can encourage experienced developers to share their expertise with colleagues, leading to a more evenly distributed skillset and reduced overall cycle times.
- Example 12: Data-Driven Performance Reviews: When conducting performance reviews, project managers can use issue cycle time and monthly average time in column data as objective measures of individual and team performance. By highlighting areas where individuals or teams excel and identifying areas for improvement, project managers can provide more targeted feedback and development opportunities.
How Project Managers can now take the guesswork out of the equation and drive projects with an unprecedented visibility and understanding of the activities at hand?
The challenge facing a lot of project managers is to drive projects without being necessarily experts in the core technical domain of the projects. A project manager overseeing software development projects may not be proficient or even knowledgeable in software development.
That leads to an obvious challenge for these leaders, who navigate blindly the intricacies of their projects, whilst relying heavily on explanations and interpretations provided by their team member – who in turn need to allocate time and effort to “translate” what is happening technically into intelligible, project-management driven language.

Traditional tracking tools and platforms will help to some degree assessing the progress of activities, with more or less details and accuracy. But they have two shortfalls that inevitably create blindspots for the project managers:
1 – These tracking tools require human input to ensure that activity statuses are up to date and correctly reflecting the reality. They are therefore prone to human errors, bias or omissions. Since they are the only source of reference intelligible for non-experts, they can generate significant distortions in the representation of reality, leading to delays, budget overruns, quality issues and more.
2 – They do not provide possibilities to understand underlying causes and issues in a straightforward, actionable way. Therefore, even if issues are identified and slippages noticed, it is quite difficult, time-consuming and again human-driven to assess root causes and implement remediation strategies.
Leveraging the key metrics presented previously – Idle Issues, Average Time in Jira Status and Issue Cycle Time – help project managers have an un-biased view of the overall project’s progression, from a core technical point of view. They get to see directly what is happening at technical level, without the need for interpretation from someone else, and without the potential bias associated with human interpretation.
Further, analyzing these metrics systematically thanks to automated gathering and collection resolves the inconsistencies generated by human inputs - delays in updates, omissions, errors – and provides the project managers with a truthful, real picture of the technical progress. Something that most project managers currently lack.
Advanced Techniques: Automating Data Collection and Analysis
Manual data collection and analysis of issue cycle time and monthly average time in column can be a significant time drain, especially for large projects with hundreds or even thousands of issues. Fortunately, project management tools like Jira and Trello offer integrations with third-party applications that can automate these processes, freeing up project managers to focus on strategic decision-making and team leadership.
Example 13: Utilizing Automation Tools
Let's delve deeper into how tools like Keypup can streamline the process of collecting and analyzing data on issue cycle time and monthly average time in column within Jira or Trello:
- Automated Data Collection: Keypup integrates seamlessly with Jira and Trello, automatically capturing data on issue creation, status changes, and resolution times. This eliminates the need for manual data entry, reducing the risk of errors and inconsistencies.
- Real-Time Reporting: Keypup provides real-time dashboards that display key metrics such as average issue cycle time, monthly average time in column for various stages, and identification of idle issues. These dashboards offer a clear and concise overview of the development workflow, allowing project managers to monitor progress and identify potential bottlenecks at a glance.
- Customizable Reports & Alert Thresholds: Keypup goes beyond basic dashboards by offering customizable reports that can be tailored to specific project needs. Project managers can define filters to analyze data for specific teams, issue types, or priority levels. Additionally, Keypup can be configured to highlight when issues become idle or exceed predefined cycle time thresholds. This proactive approach allows project managers to address potential roadblocks before they significantly impact the project timeline.
Benefits of Automation:
There are several advantages to automating data collection and analysis of issue cycle time and monthly average time in column:
· Increased Efficiency: Automating data collection frees up project managers' time, allowing them to focus on more strategic tasks such as resource management, risk mitigation, and team leadership.
· ImprovedAccuracy: By eliminating manual data entry, automation reduces the possibility of human error, ensuring the accuracy and reliability of the collected data.
· Enhanced Visibility: Real-time dashboards and customizable reports provide project managers with a clear and comprehensive view of the development workflow, enabling them to make data-driven decisions and identify areas for improvement.
· Proactive Problem Solving: Automated alerts for idle issues and exceeding cycle time thresholds allow project managers to proactively address potential roadblocks before they disrupt the project schedule.
Conclusion: Empowering Project Managers for Success
Issue cycle time and monthly average time in column are powerful tools that can empower project managers to become more proactive, data-driven, and ultimately more successful. By analyzing these metrics, project managers gain valuable insights into their development workflows, without requiring expert-level understanding of software development. This in turns allows them to benefit from an automated, truthful, intelligible picture of technical activities, upon which to make informed, fact-based decisions.
You are a project manager and you are ready to get unprecedented visibility on your projects? Give Keypup a try for free, and benefit from the support of one of our product experts, that will complimentarily set you up with the metrics and dashboards you specifically need to help you achieve your objectives.