Understanding datasets and fields is essential for building efficient engineering dashboards that provide meaningful insights. When working with a powerful tool like Keypup, having a comprehensive understanding of the available datasets and fields enables you to query and filter data effectively. In this article, we will explore how to leverage and understand Keypup's various datasets, helping you to build insightful engineering dashboards tailored to your organization's specific needs.
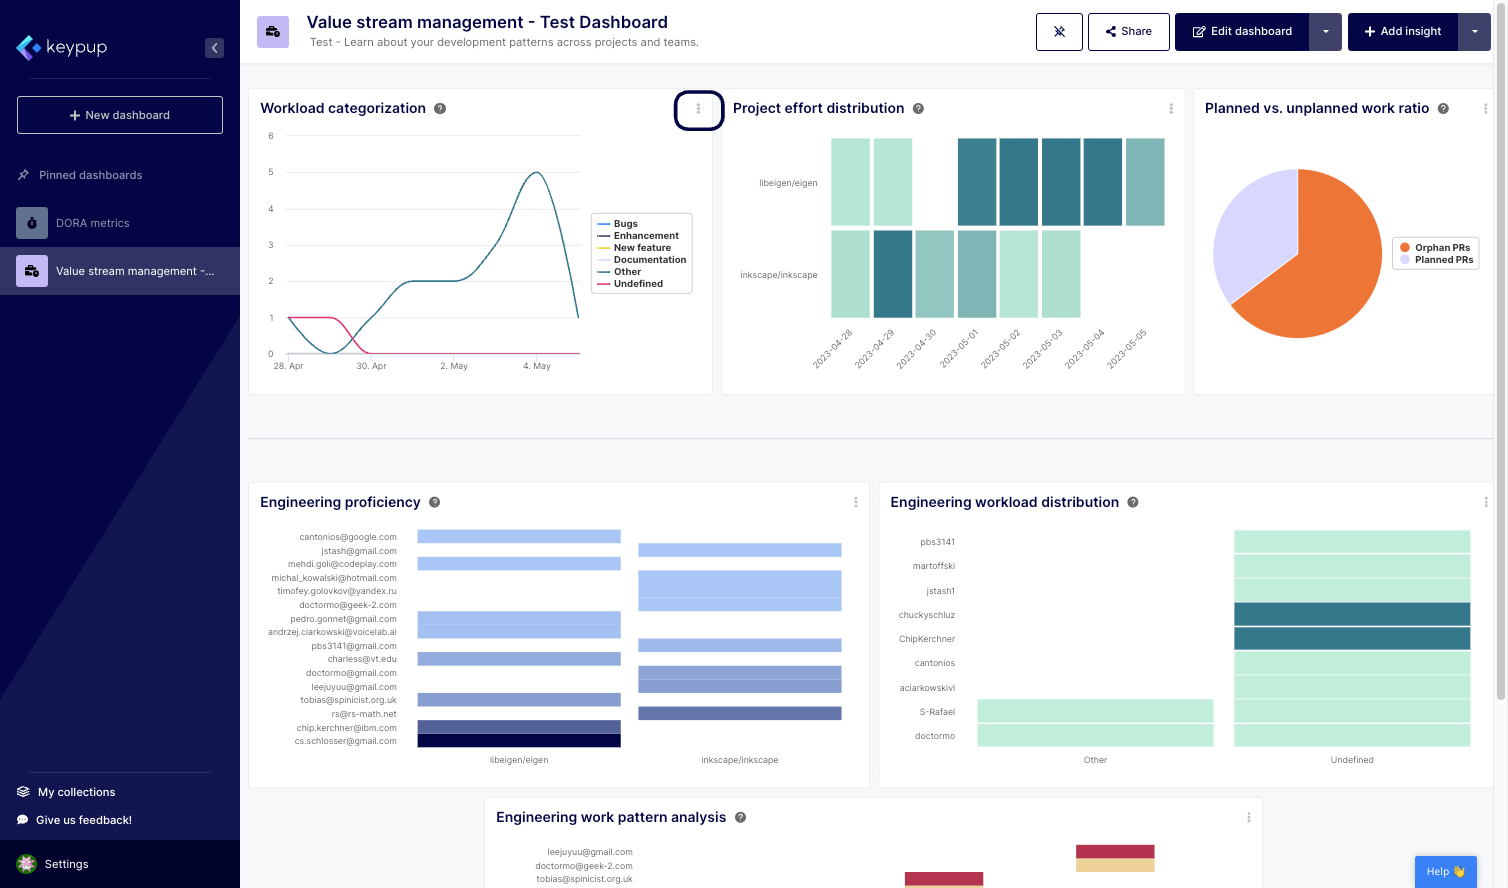
1. When creating or editing a metric, the first step in the process is to select the dataset that contains the information you want to query. To access the datasets in this specific example, click on the edit (...) button located at the top right of any insight.
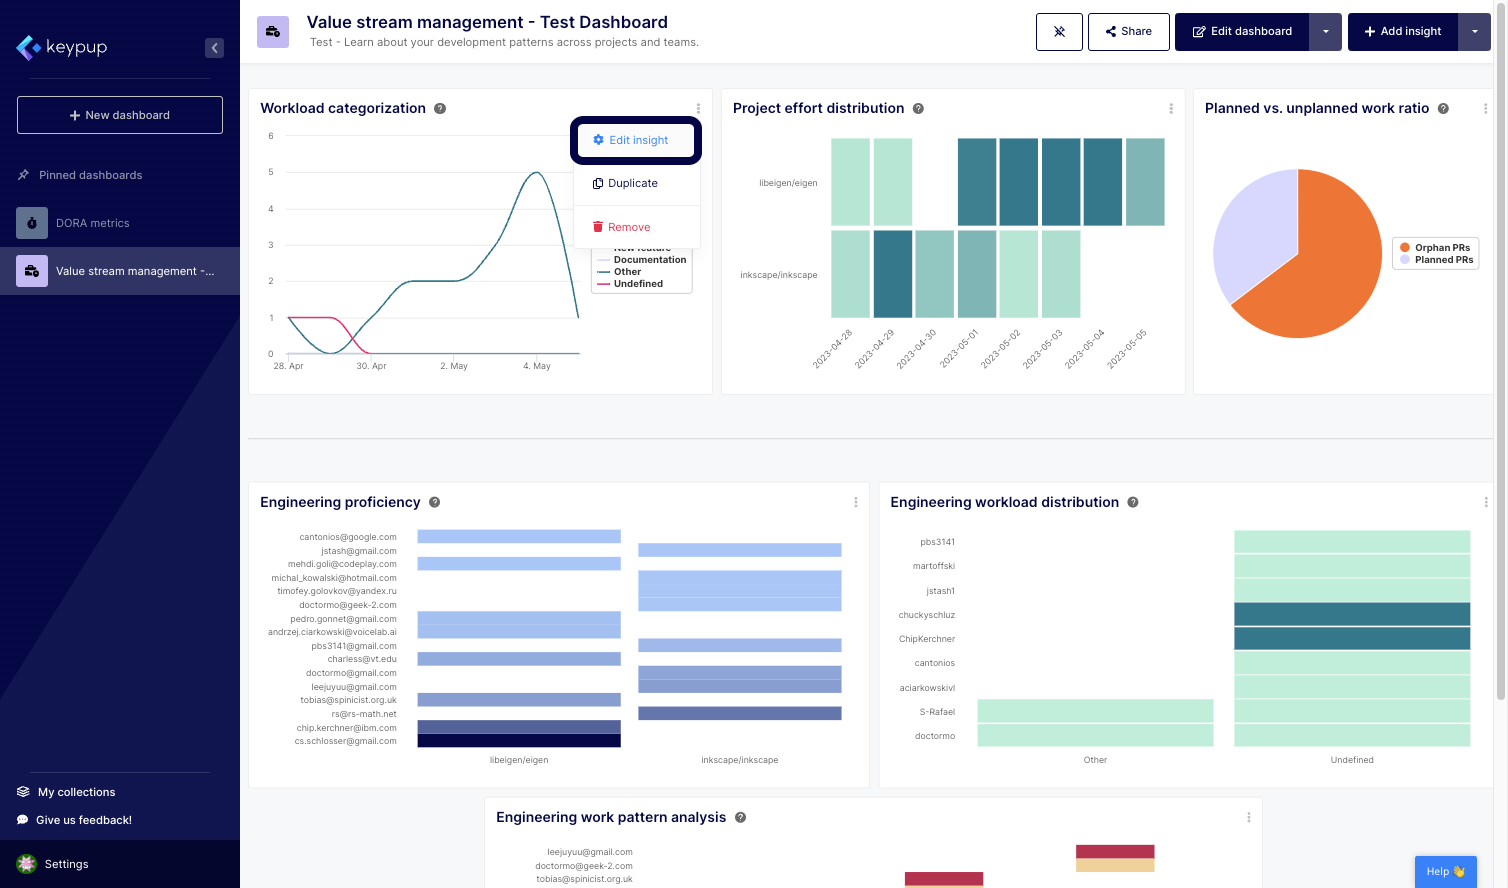
2. Then, click on "Edit insight" from the drop-down menu.
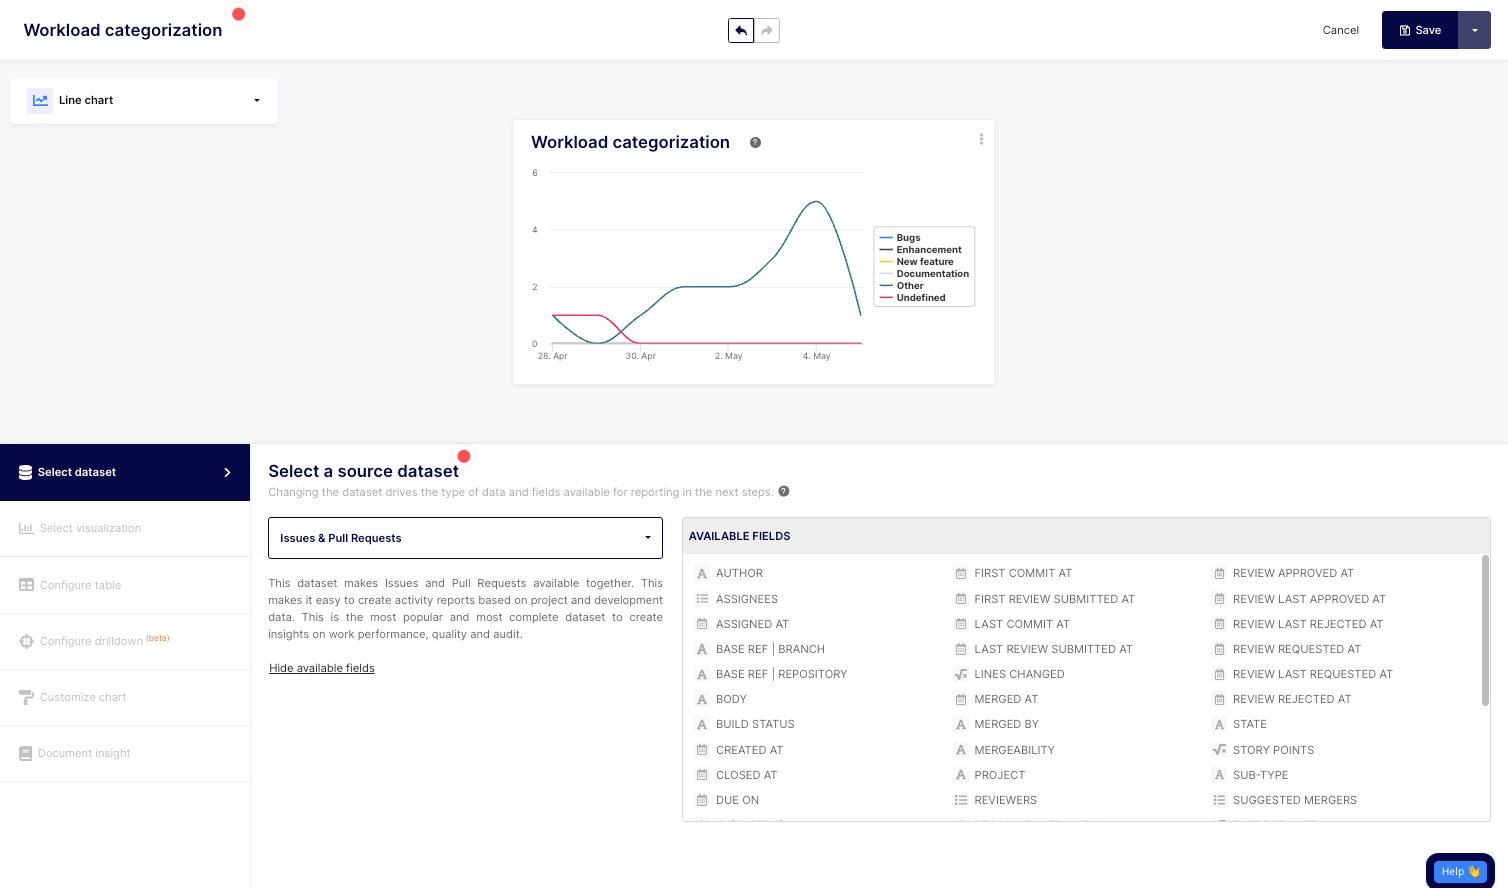
3. Now that you're in the "Select dataset" section, click on the dataset drop-down menu, in this case, "Issues & Pull Requests".
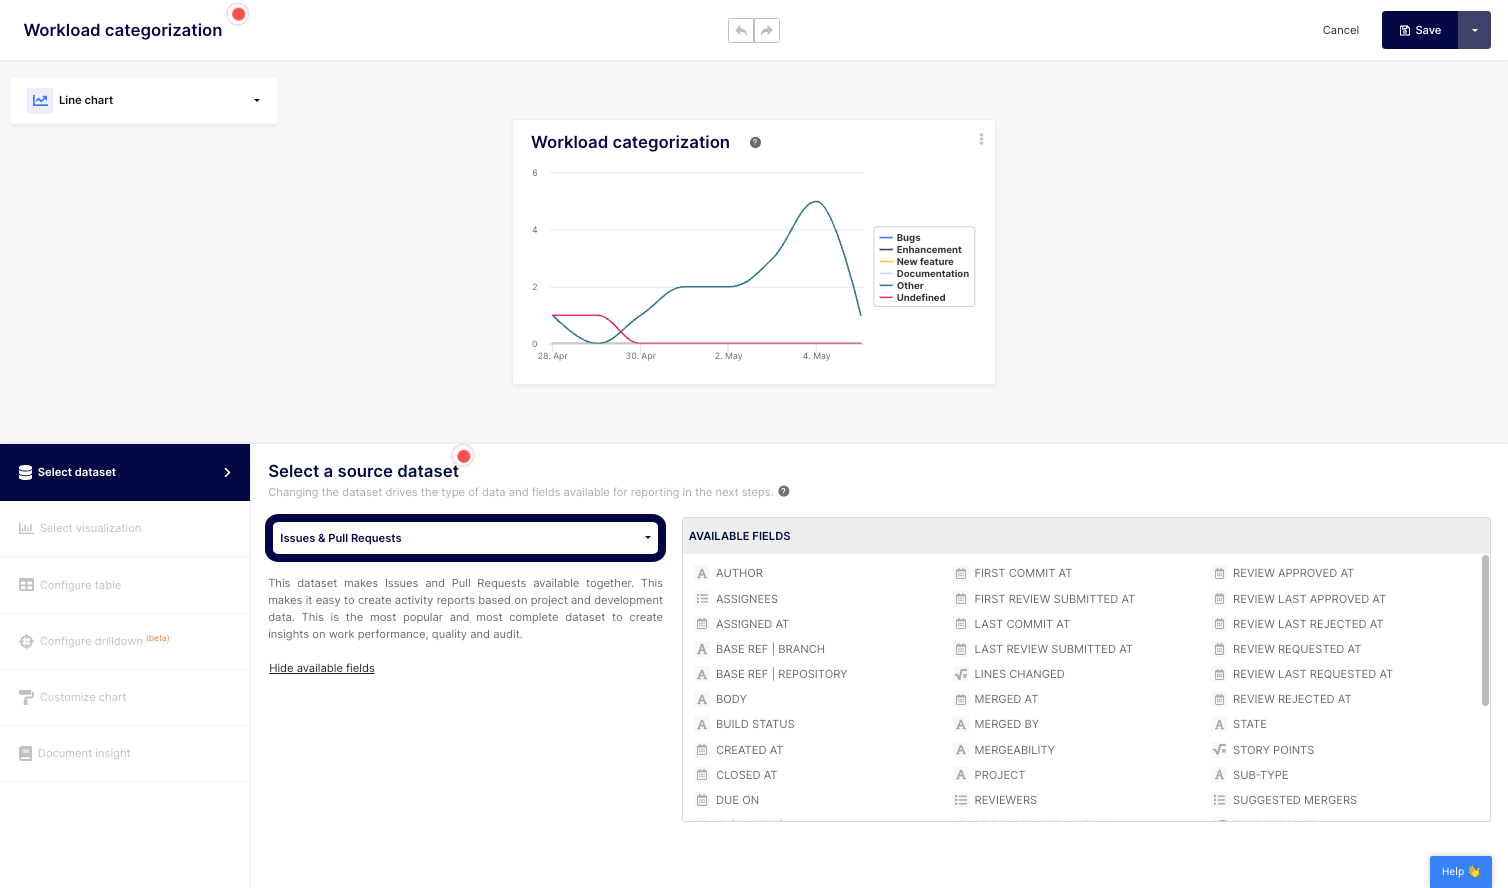
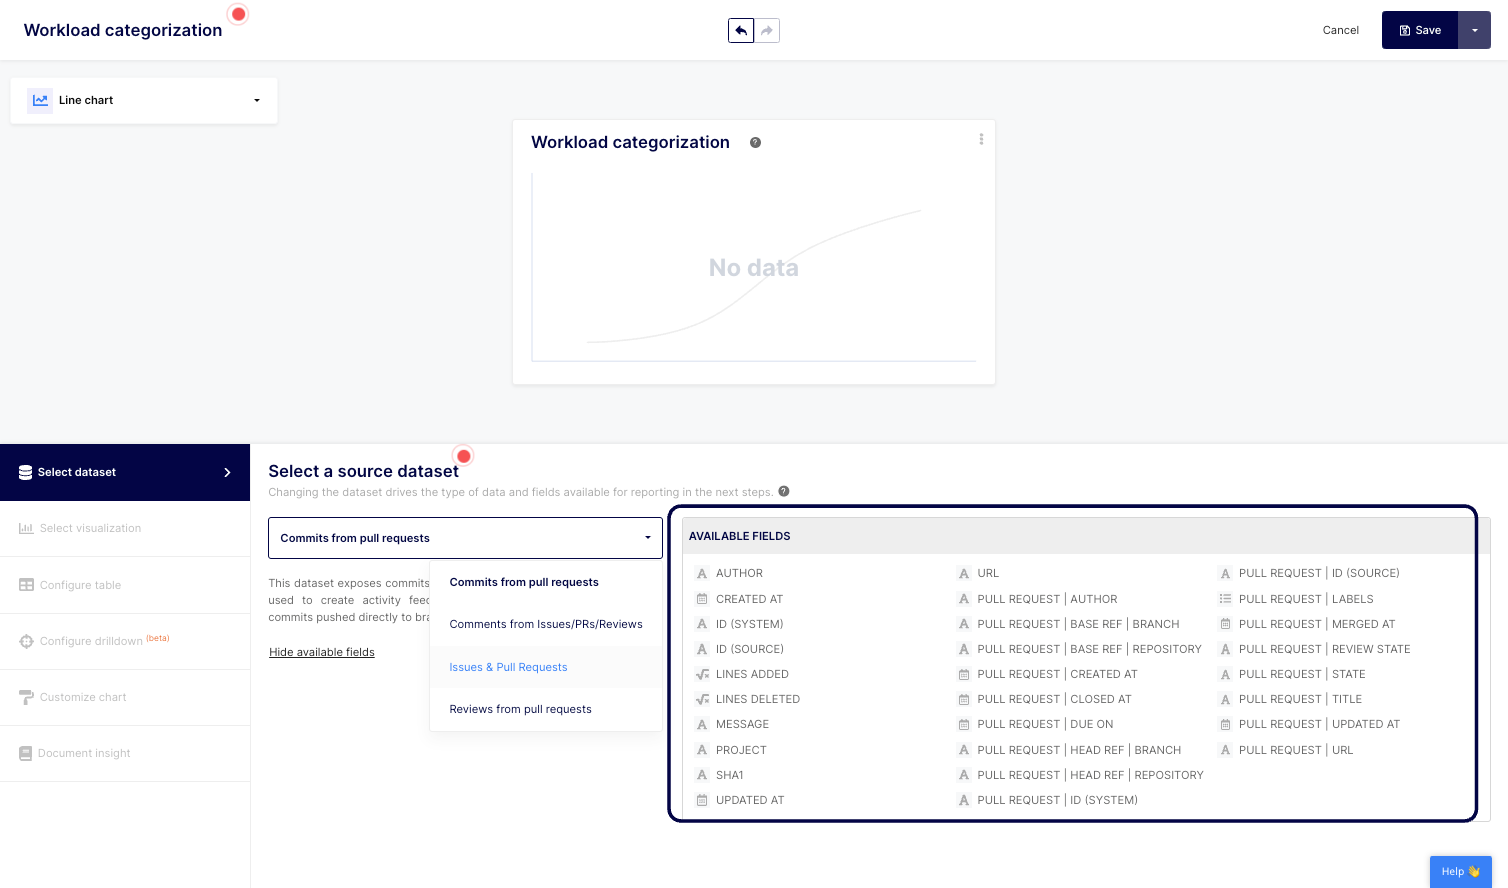
4. As you can see, you can select from four different pre-joined datasets that cover most of the possible engineering metrics use cases. Click on any dataset to see which fields you can query and filter on. The available fields of the selected dataset are listed at the right.
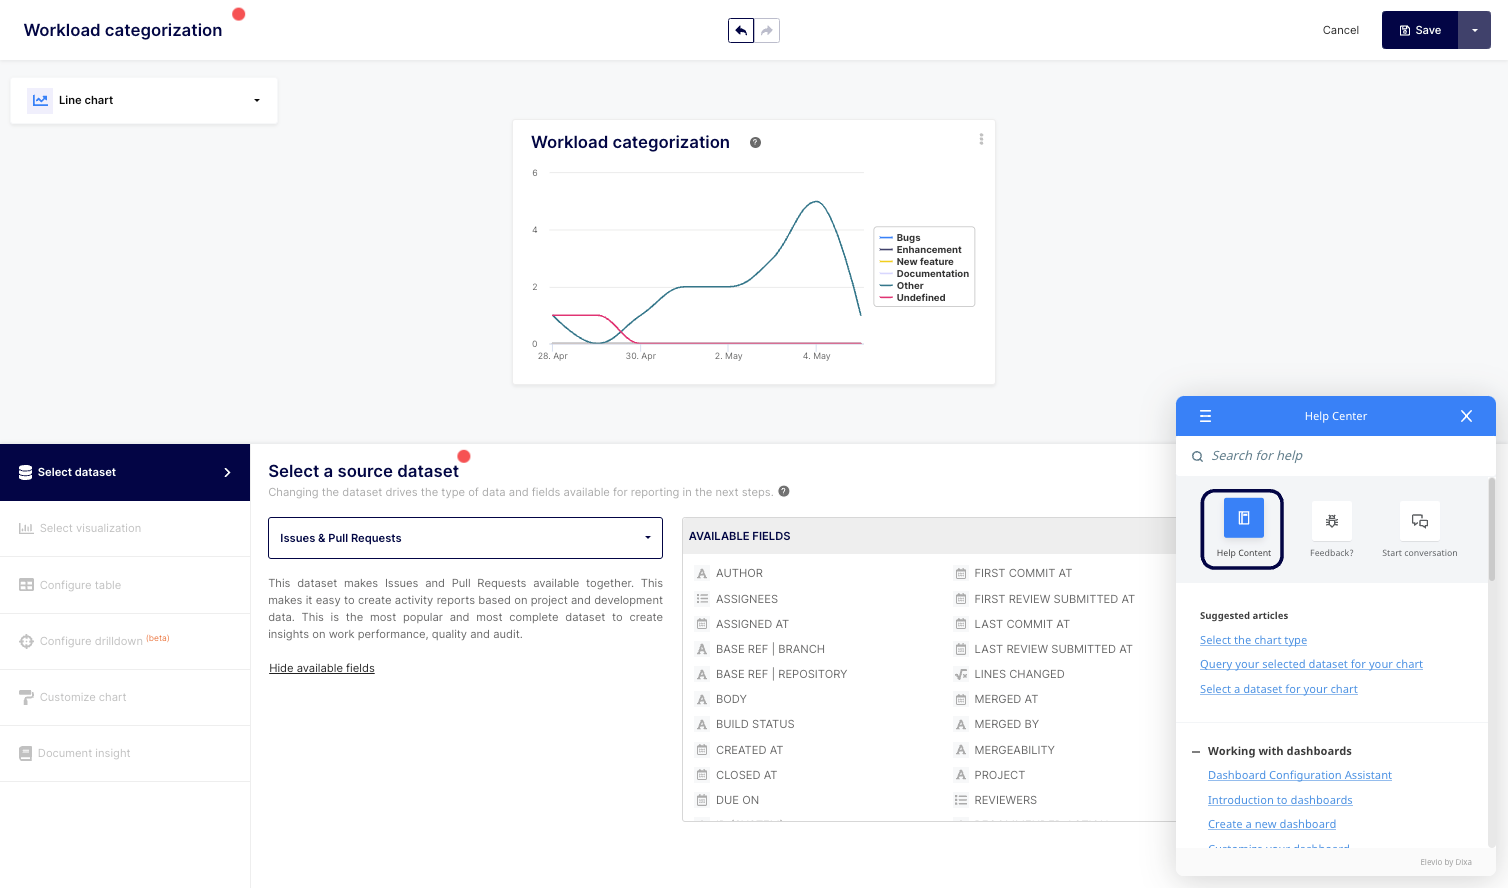
5. If you are not sure about the fields and would like to better understand their type, how they are being populated, their source, and more, click on the "Help 👋" button located at the bottom right of your screen.
6. Then, click on the "Help Content" icon located at the top left of the modal.
7. Click on the "Data and Operations" section. From there, you can access all datasets, function, and operator documentation.
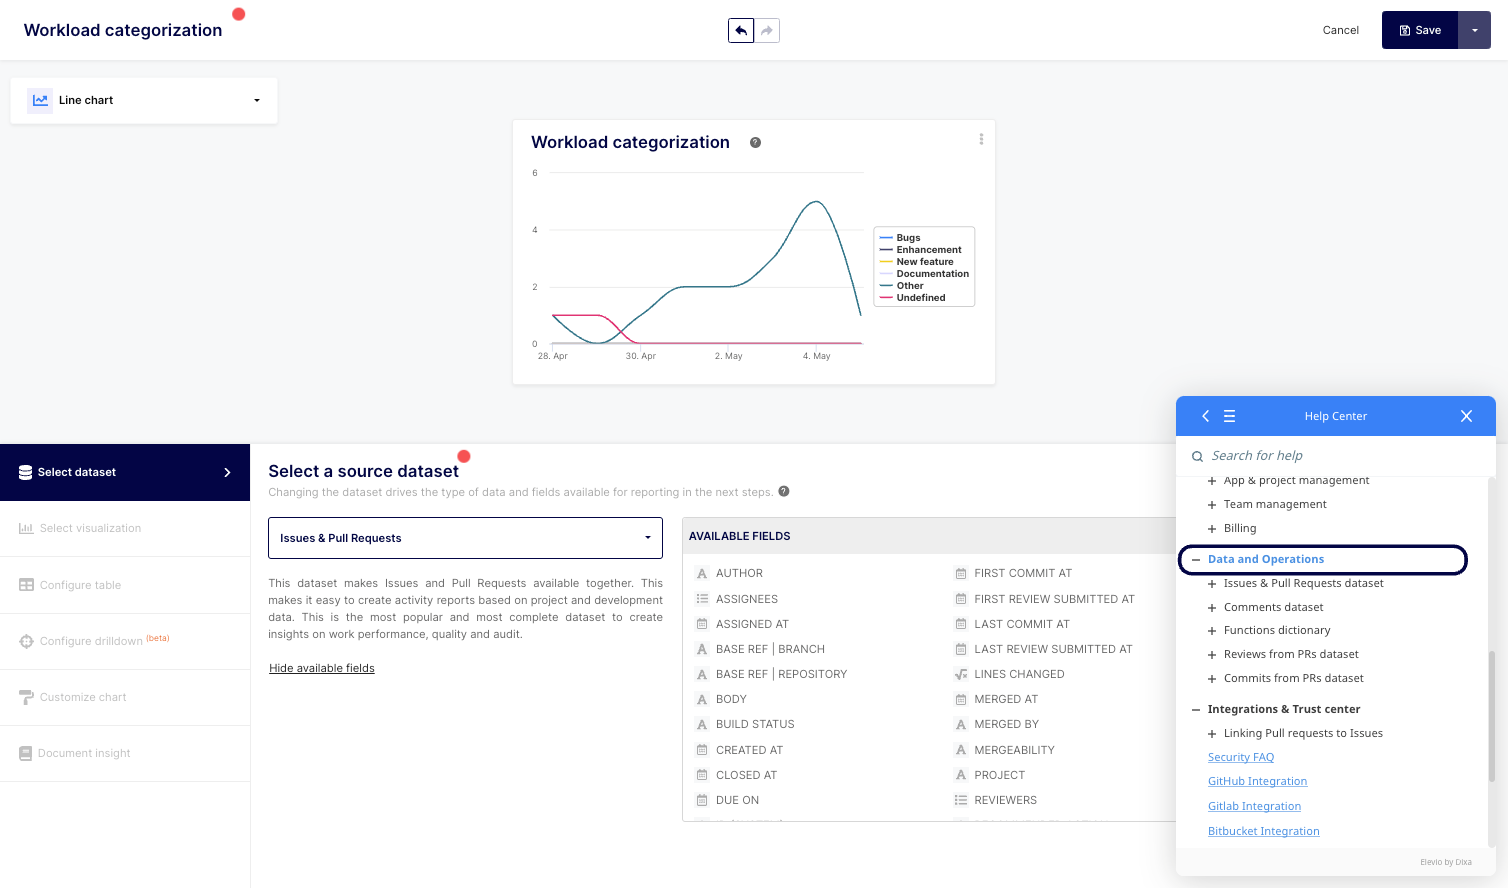
8. For this specific tutorial, click on "Issues & Pull Requests dataset".

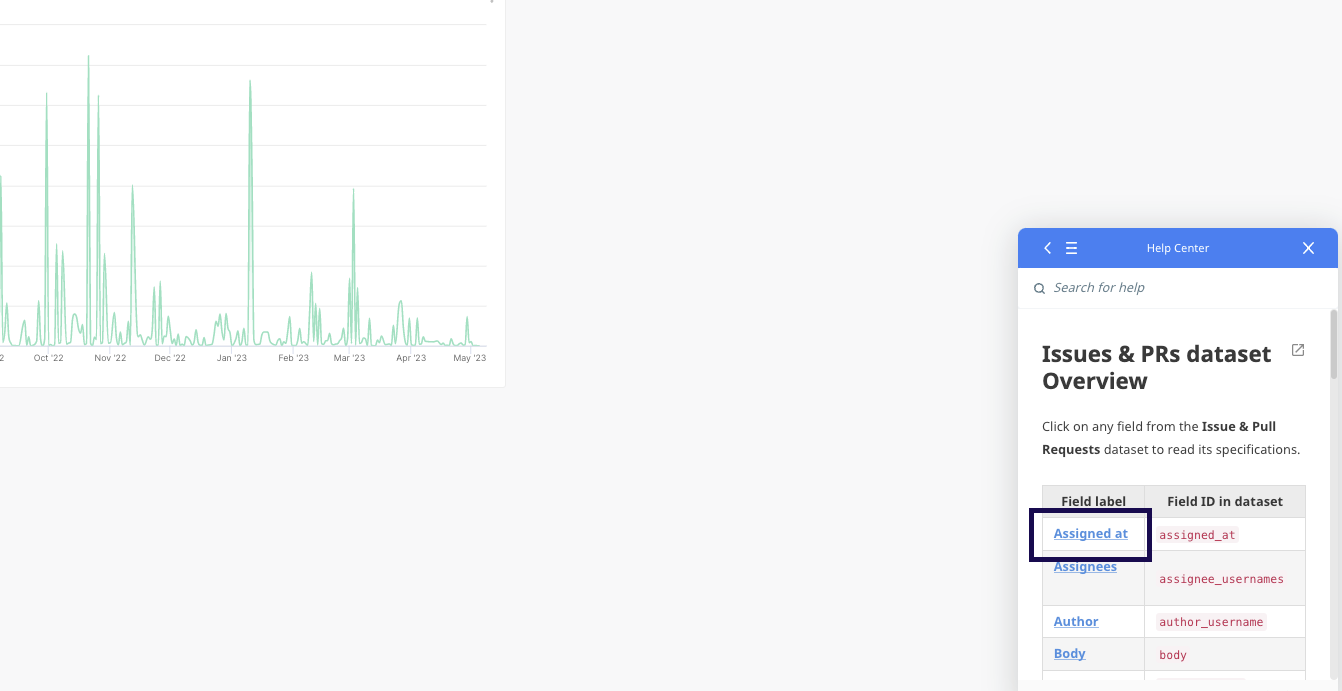
9. Then, click on "Issues & PRs dataset Overview".
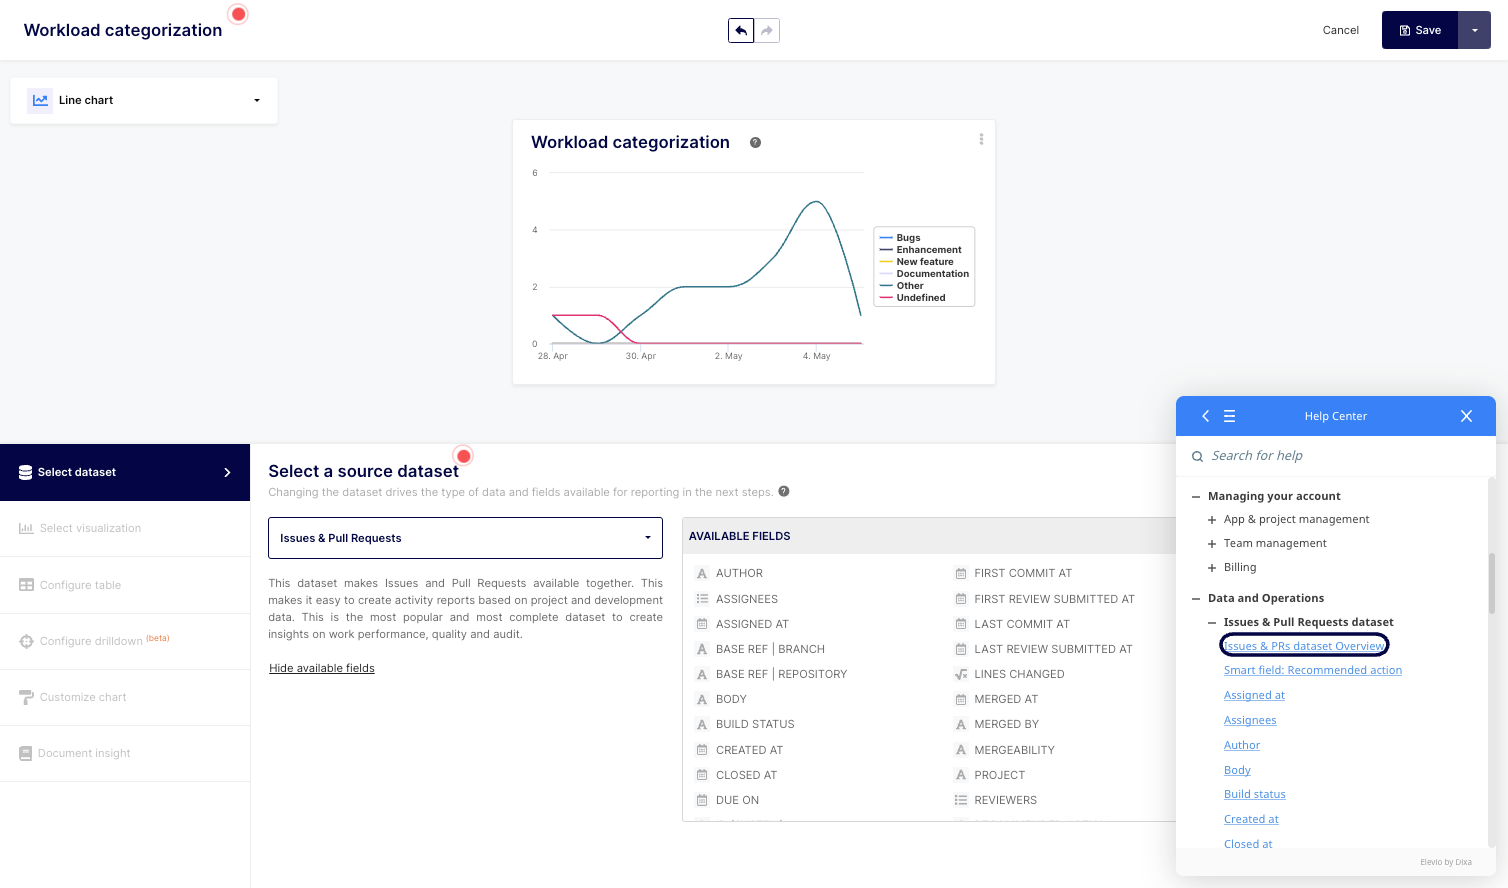
10. A short description of the dataset and its associated fields can be found in this section. You can get a detailed description of any field by clicking on it. For instance, click "Assigned at".
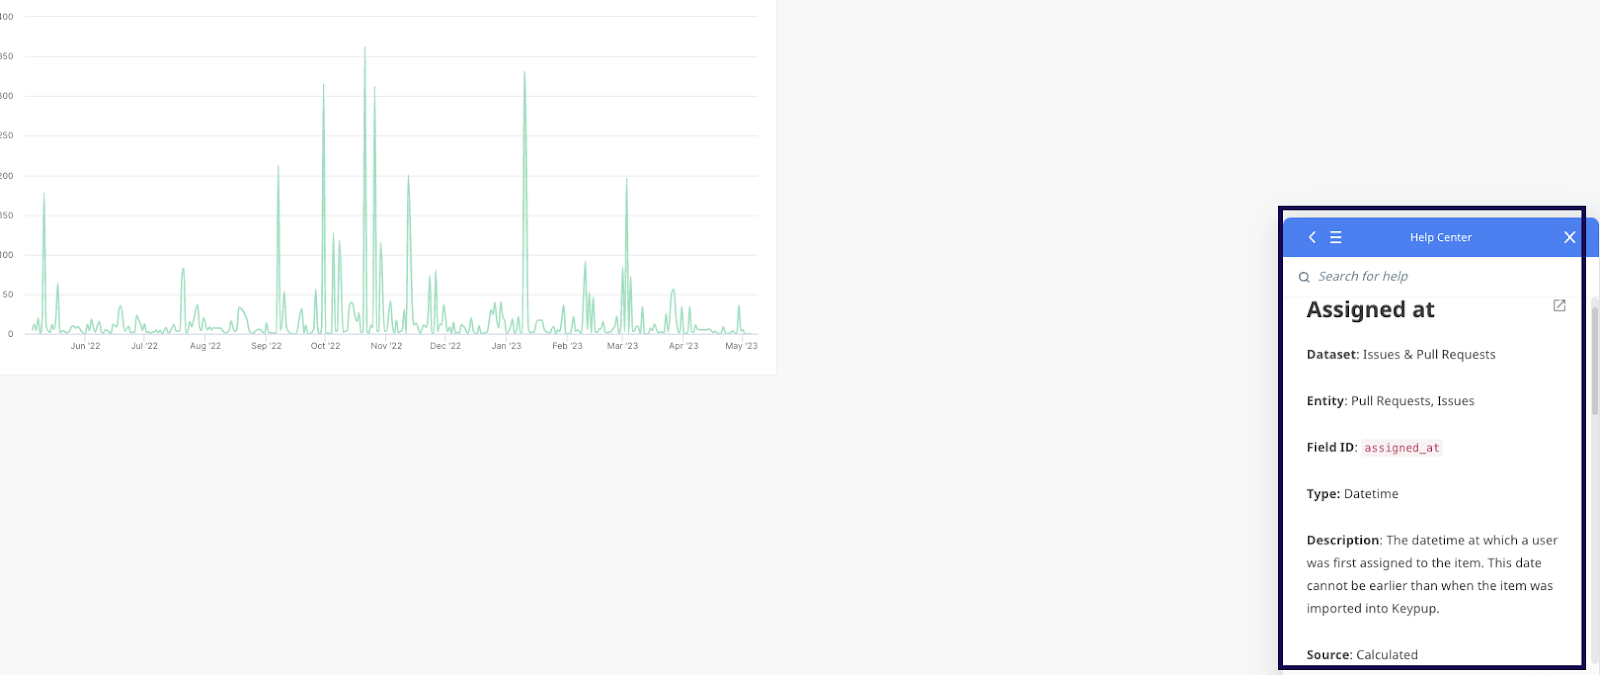
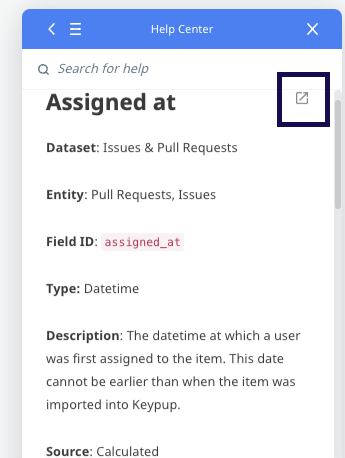
11. A list of details about the field will appear, such as the dataset, field type, description, and source. All articles have a small icon at the top right that allows you to open and enlarge them.
With Keypup's user-friendly interface and comprehensive documentation, you have the tools to leverage and understand datasets more effectively. By building efficient engineering dashboards tailored to your organization's needs, you can monitor performance, identify areas for improvement, and drive success in your software development process.
Discover Keypup's various datasets today to unlock the power of data-driven decision-making in your engineering organization.