Tracking the development team's progress is essential to achieving business goals. However, manually evaluating the performance of the entire software development cycle can be a bit of a challenge for managers and tech leads.
Engineering KPIs and software metrics are important indicators for the technical leads to keep the development team on track. Both highlight different aspects to accelerate the software planning and development processes. Moreover, selecting the right set of software metrics and engineering KPIs aligned with the business requirements is critical to maximize business outcome.
Let’s see how software metrics and engineering KPIs can significantly improve efficiency and accelerate the software development cycles. We’ll also discuss industry best practices to set Engineering KPIs. Last, we’ll share some engineering KPIs you could track and software metrics templates you can directly use on the Keypup platform.
Engineering KPIs vs. Software Metrics
Software metrics facilitate monitoring the performance of specific development processes. Metrics have a low-level perspective inspired by industry benchmarks which may or may not exist without strict objectives and have a static nature.
Engineering KPIs measure the performance of the development cycle to meet organizational objectives and are used in strategic decision-making. Decision-makers like tech leads, managers and executives often define the KPIs. With a higher-level perspective, these performance indicators are dynamic and can be reset or adapted after considering business alignment to inform and guide future actions and strategic moves.
Engineering KPIs and software metrics are often used interchangeably. However, there is a thin margin between the two. All KPIs are metrics, but the reverse is not true. KPIs depend on a set of metrics to monitor progress. Both play different roles in monitoring the software development cycle.
Industry Best Practices To Define Engineering KPIs
Engineering KPIs inform the selection of suitable software metrics for each development target and highlight areas to improve the development workflow. KPIs and metrics ensure on-time and on-budget completion of the project and increase the team’s productivity whilst enabling the development team to identify bottlenecks. Metrics help identify the root causes of various roadblockers by providing quantitative context.
Steps to Implement Engineering KPIs
Successful implementation of engineering KPIs is possible by following a few simple steps:
- First, identify and decide the areas where performance needs to be monitored, i.e., the entire development cycle or some parts of it and which ones
- Then, set a measurable target value against each goal.
- Compare the current performance with the defined target values to check development progress and alter engineering KPIs if needed.
- Consistently review the relevance of the defined goals.
5 Engineering KPI Best Practices
There are no rules set in stone to develop the right mix of engineering KPIs. Consider the following best practices while designing them:
- Align Engineering KPIs With Business Goals
KPIs are not universal, as every organization has specific objectives. Carefully choose outcome-based engineering KPIs to track short-term and long-term development goals, depending on the project's duration.
Before designing KPIs, tech leads and managers should always ask, “What factors can impact the achievement of these KPIs?”
The engineering KPIs selected by the team must be realistic and achievable. It is essential to analyze the development cost and use the right data and tools to fuel these KPIs. For example, if the data required cannot be retrieved or the monitoring tools cost big bucks, then tech leads should reevaluate their monitoring policies.
An actionable set of performance indicators is defined with an end objective that supports growth and steers the development cycle in the right direction. Engineering KPIs should be accurately defined and have a target. For example, the percentage of production issues resolved within 24 hours should remain above 95% in the first three months of deployment.
- Ensure KPI Data Accuracy and Correctness
Acquiring KPI data from the wrong sources will never reflect the development team’s actual performance - and even worse, could provide an erroneous view of the team’s performance. It is necessary to have clean, exact, and sufficient data to move in the right direction. If it takes longer to collect relevant data, it may not be useful for tech leads. So the right questions to ask are:
What data needs to be collected against each KPI?
What is the source for each data point?
How long will it take to collect and prepare data?
How can we unify all the data sources?
Select a Reasonable Amount of KPIs
Less is more–so dig deeper and filter out the least significant engineering KPIs.
Focusing on a large number of KPIs is not practically feasible as unnecessary details can lead to analysis complexity and ultimately paralysis, disrupting the entire development process. Precisely narrow down the most critical engineering KPIs to avoid cluttering the monitoring dashboards.
For example, knowing how many items in the last sprint were deployed successfully is good, but knowing which team member worked on each sprint item can give a better idea about the team’s performance and point out issues that can not be observed collectively.
5 Essential Engineering KPIs to Track and assess Software Development Cycles
Considering the fundamental requirements of software development teams, Keypup provides relevant engineering KPIs to analyze the team’s growth and performance. Some of them include:
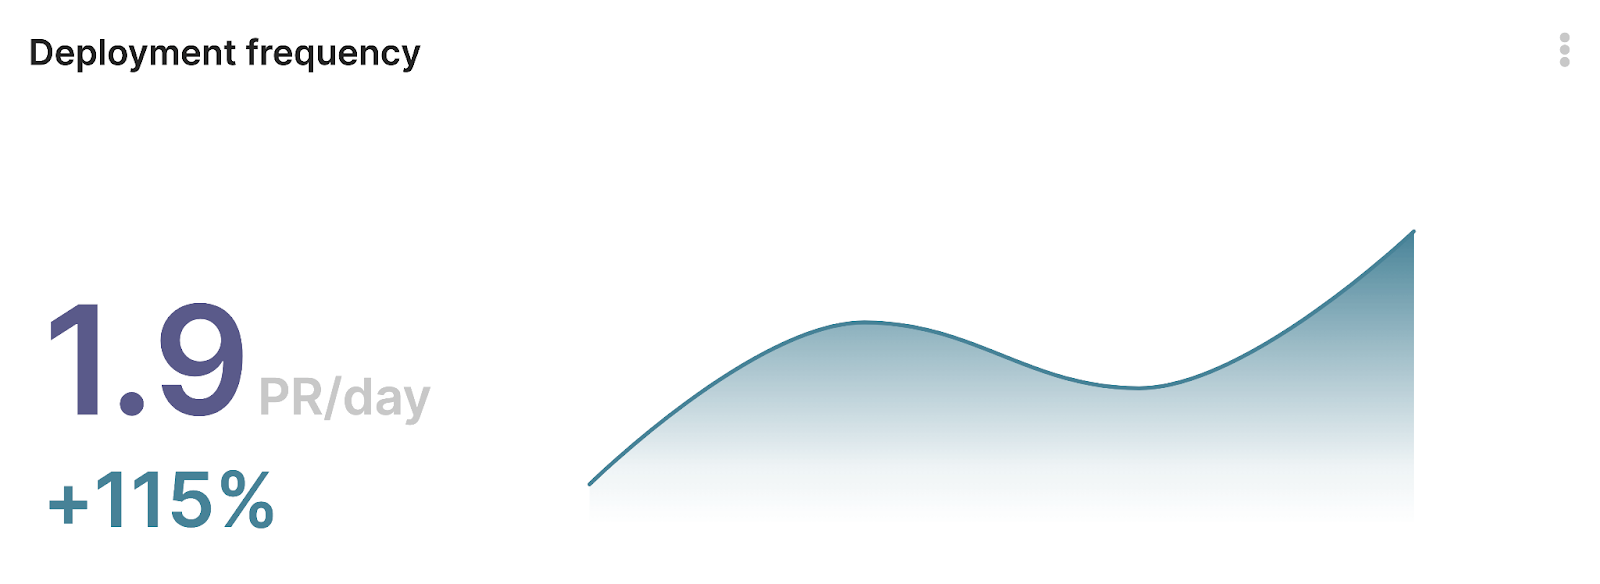
- Deployment Frequency - DORA metrics
The Deployment frequency indicator informs technical leads about the pace of software development. It keeps a record of daily task accomplishments. Low values for this KPI signify bottlenecks in the engineering teams.
Keypup Deployment Frequency template here.
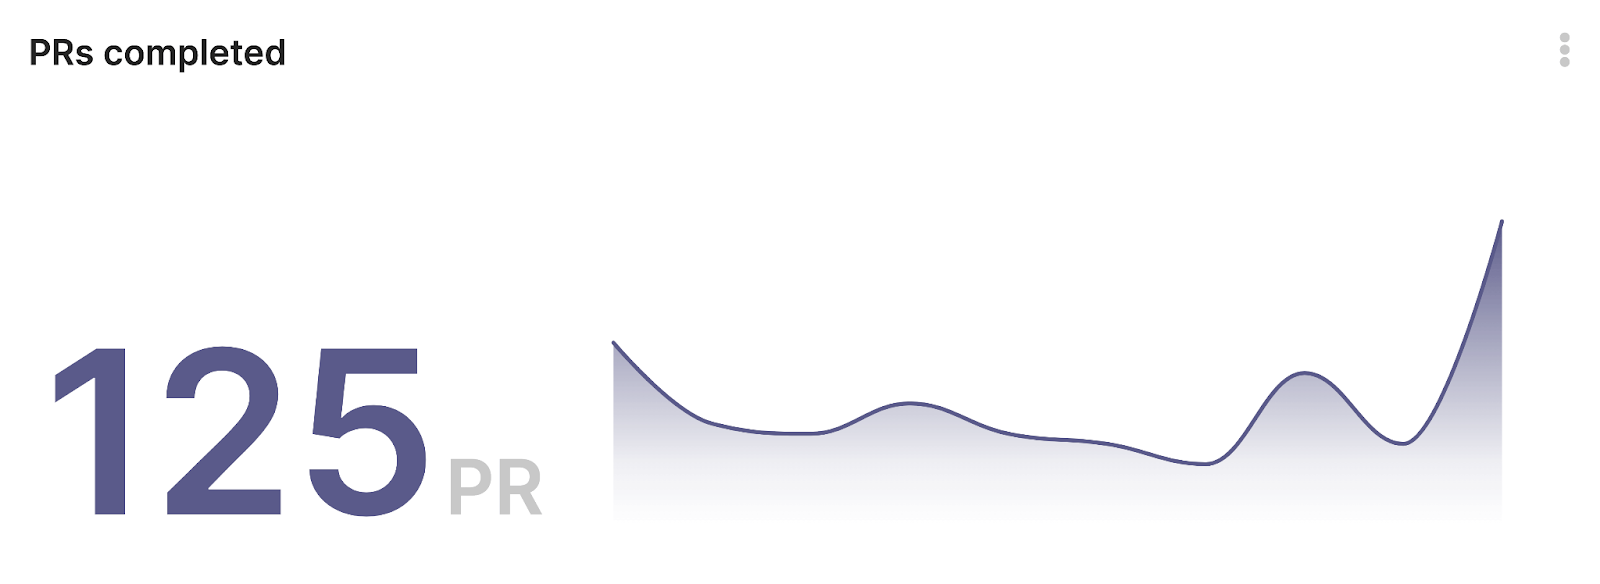
Completed pull requests provide the total number of pull requests that were deployed on production. High values indicate efficient development cycles and elite-performing teams. A drop in the KPI value may indicate underperformance, unforeseen underlying issues and delayed completion of work.
Keypup Completed Pull Requests template here.
- Overdue Pull Requests and Issues
Overdue pull requests and issues display the number of open tasks yet to be delivered past their due date.
Numeric ranges for this KPI indicate different situations.A zero value of the overdue items indicates a timely shipment of all the items due which is symptomatic of an accurately forecasted sprint for instance.
A value close to zero shows that a few items were not shipped on time and may have required extra work or time-consuming investigation, not accounted for in the initial scheduling.
KPI values ranging far from zero are a potential alert signal regarding sprint planning, development cycle workflow or team’s performance.
Keypup Overdue Pull Requests and Issues template here.

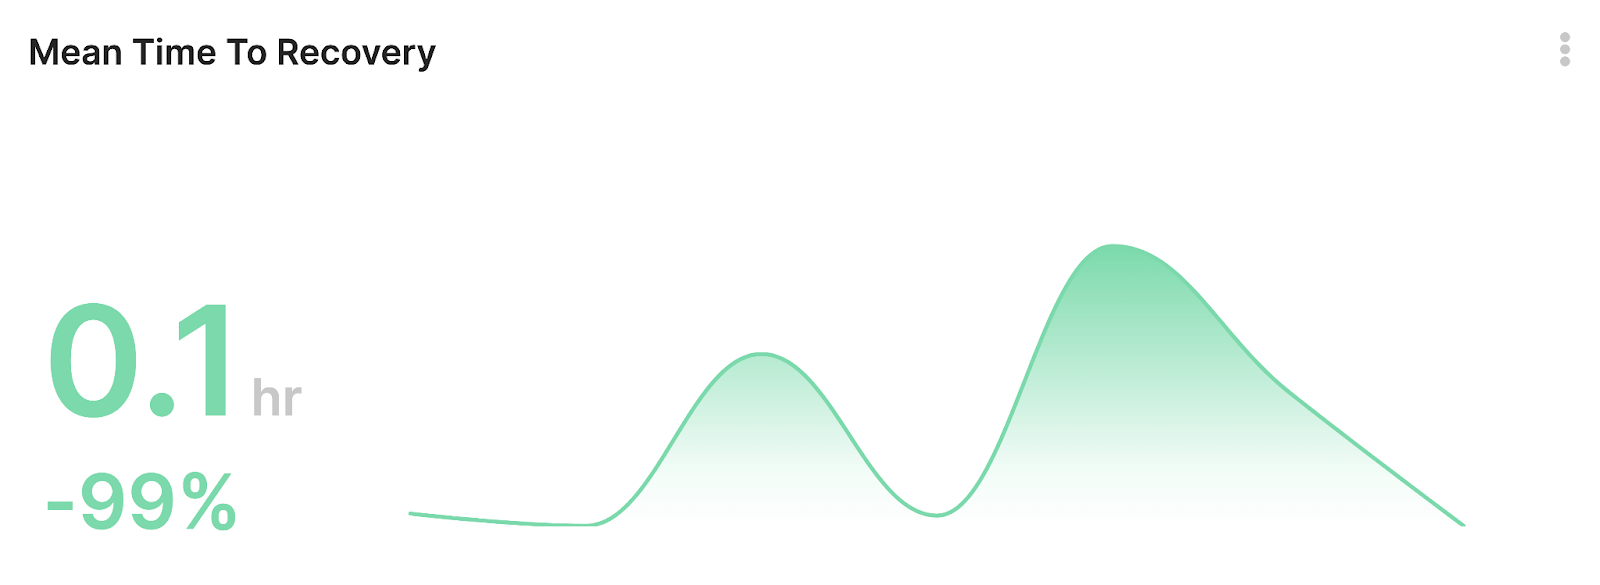
The Mean Time To Recovery insight highlights the capacity of teams to handle incidents and restore services. High-functioning teams keep this KPI value under 24 hours by resolving the issue within a day.
High values can indicate a critical impact on production and users, increased time to raise an incident, and an inefficient incident management flow. A value close to 0 means faster incident recovery, and a potentially efficient incident management flow.
Keypup Mean Time To Recovery template here.
- Pull Requests and Issues In Sprint
Pull Requests and Issues in sprint provide a quick view of the total amount of items in a sprint/unit of time. The number of items can differ between organizations and teams in accordance with resources available, complexity and phase of a given project and the topology adopted to run the project.High values of this engineering KPI can result from poor sprint planning or a project phase where minor fixes take precedence over actual feature development. By opposition, low values show shorter sprints or more significant unitary issues.
Keypup Pull Requests and Issues in sprint template here.

10 Key Software Metrics To Boost Software Planning and Development Cycle
Keypup offers a set of robust software metrics, including DORA metrics, to measure the performance of software development workflows. After analyzing the performance of development teams for years, DORA metrics were formulated by Google's DevOps Research and Assessment group (hence the name “DORA”). Let’s discuss some of Keypup’s vital software metrics, including the DORA metrics below.
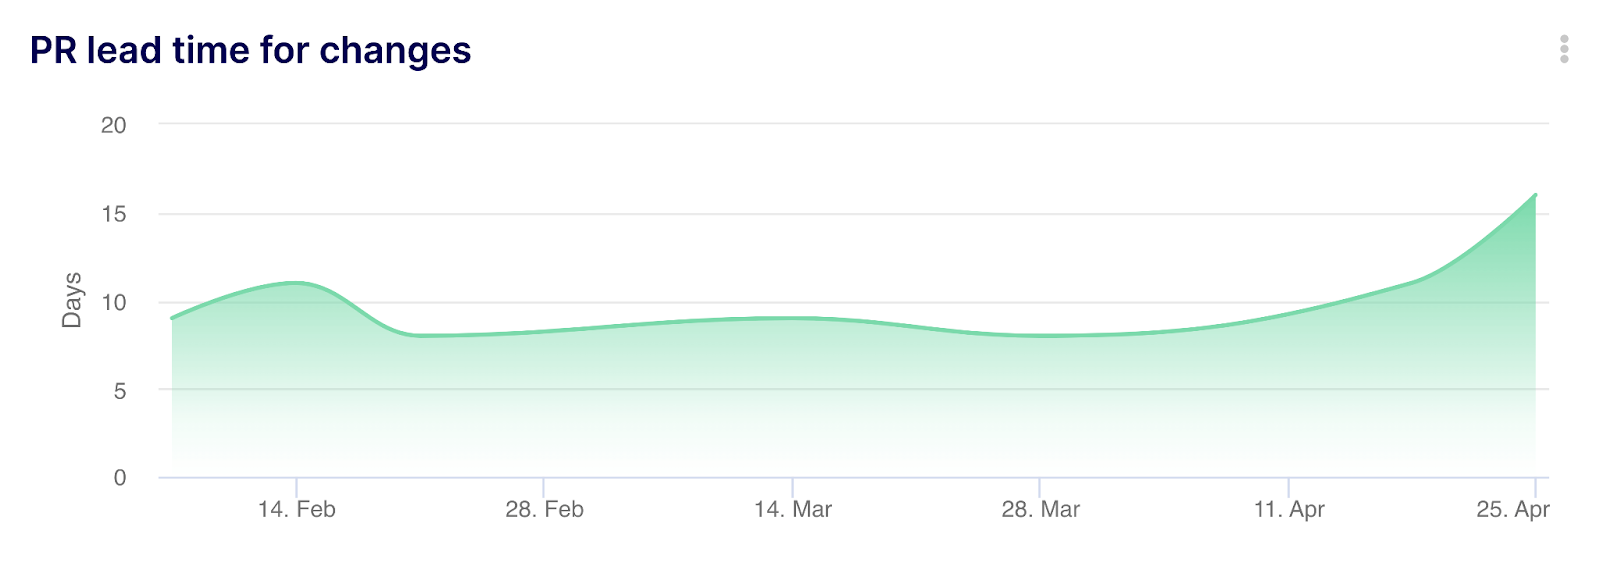
1. Lead Time To Changes (Pull Requests)
Lead Time To Changes (LTTC) is another DORA metric. It measures the duration between commit and release. This velocity metric records time for creating and merging a pull request for developing new features or deploying on production.
Teams that make faster deployments tend to be more successful. Adding a testing phase in the development process eliminates bottlenecks and reduces the LTTC range.
Keypup LTTC template here.
2. Change Failure Rate
Change Failure Rate (CFR) is a DORA metric that provides the percentage of releases that result in downtime or issues. Releasing smaller batches more frequently helps identify and fix the defects easily. Moreover, exposing CFR to developers improves the understanding of bugs and associated patterns resulting in less chances of repeating those issues again.
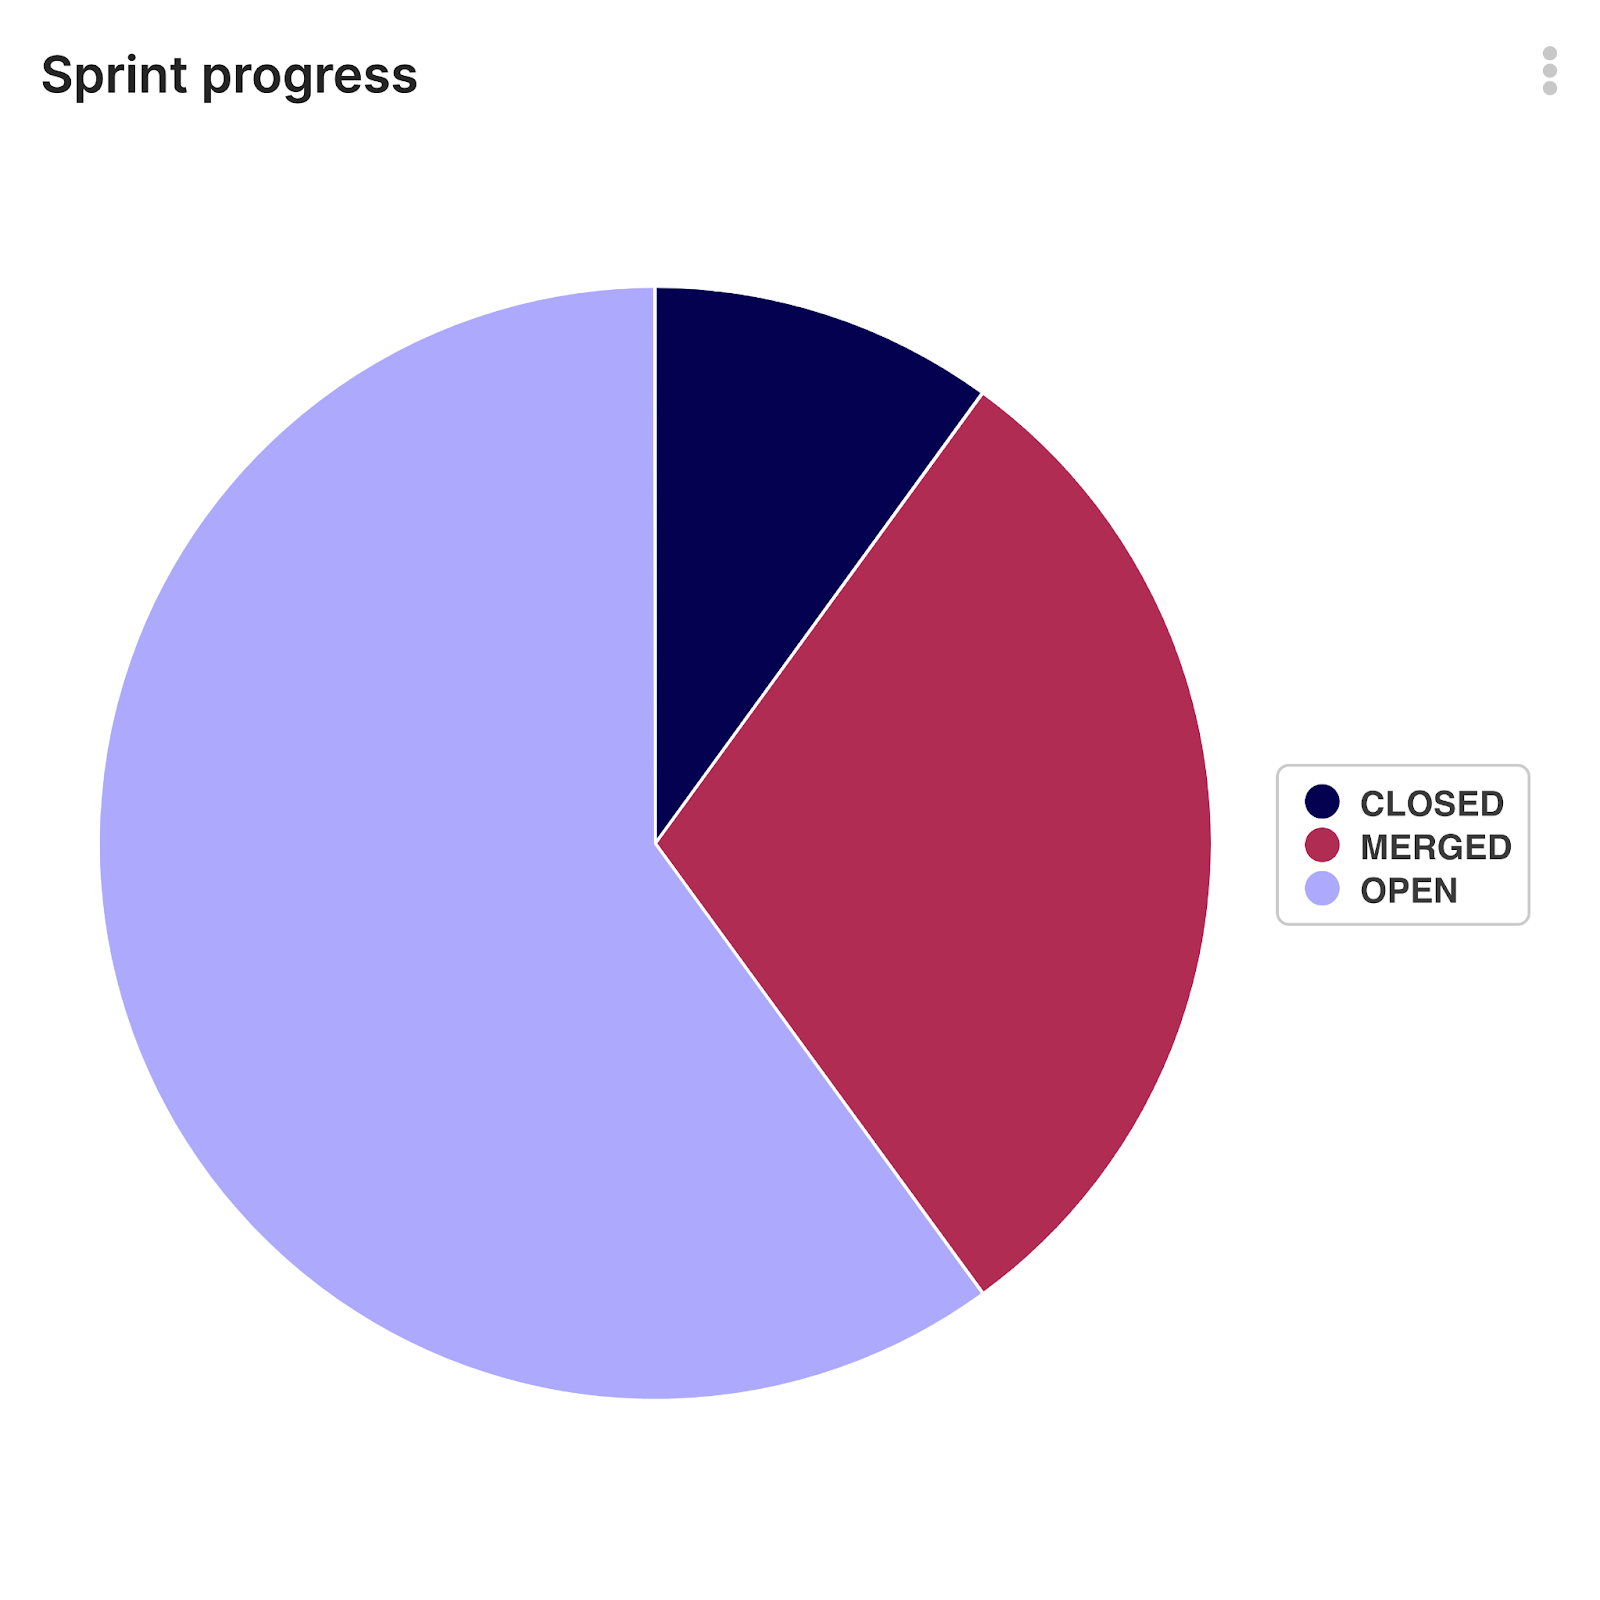
3. Sprint Progress
Sprint progress displays the amount of open and closed issues within a specific period. It also counts all issues whose due date is in a given timeframe.
A greater number of closed issues represents good sprint progress. This software metric helps track issues that need the most attention and records the resolved ones as well.
Keypup Sprint Progress template here.
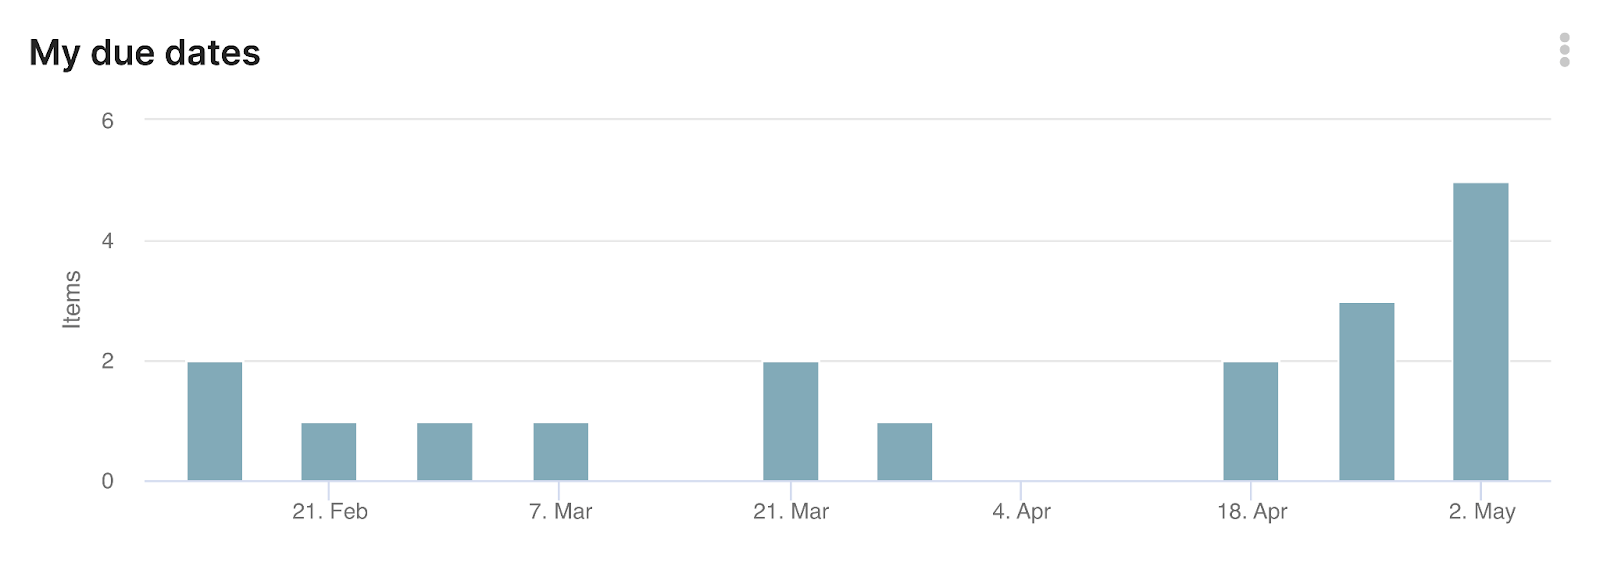
4. Pull Requests and Issues by Due Date
Pull Requests and Issues by Due Date metric help software engineers see all open items organized by due date. This insight helps the development team by reporting useful figures related to the issues and pull requests. Monitoring this software metric can help the members stay on track and the Sprint planners forecast work more accurately in the future, based on past performance.
Keypup Pull Requests and Issues by Due Date work template here.
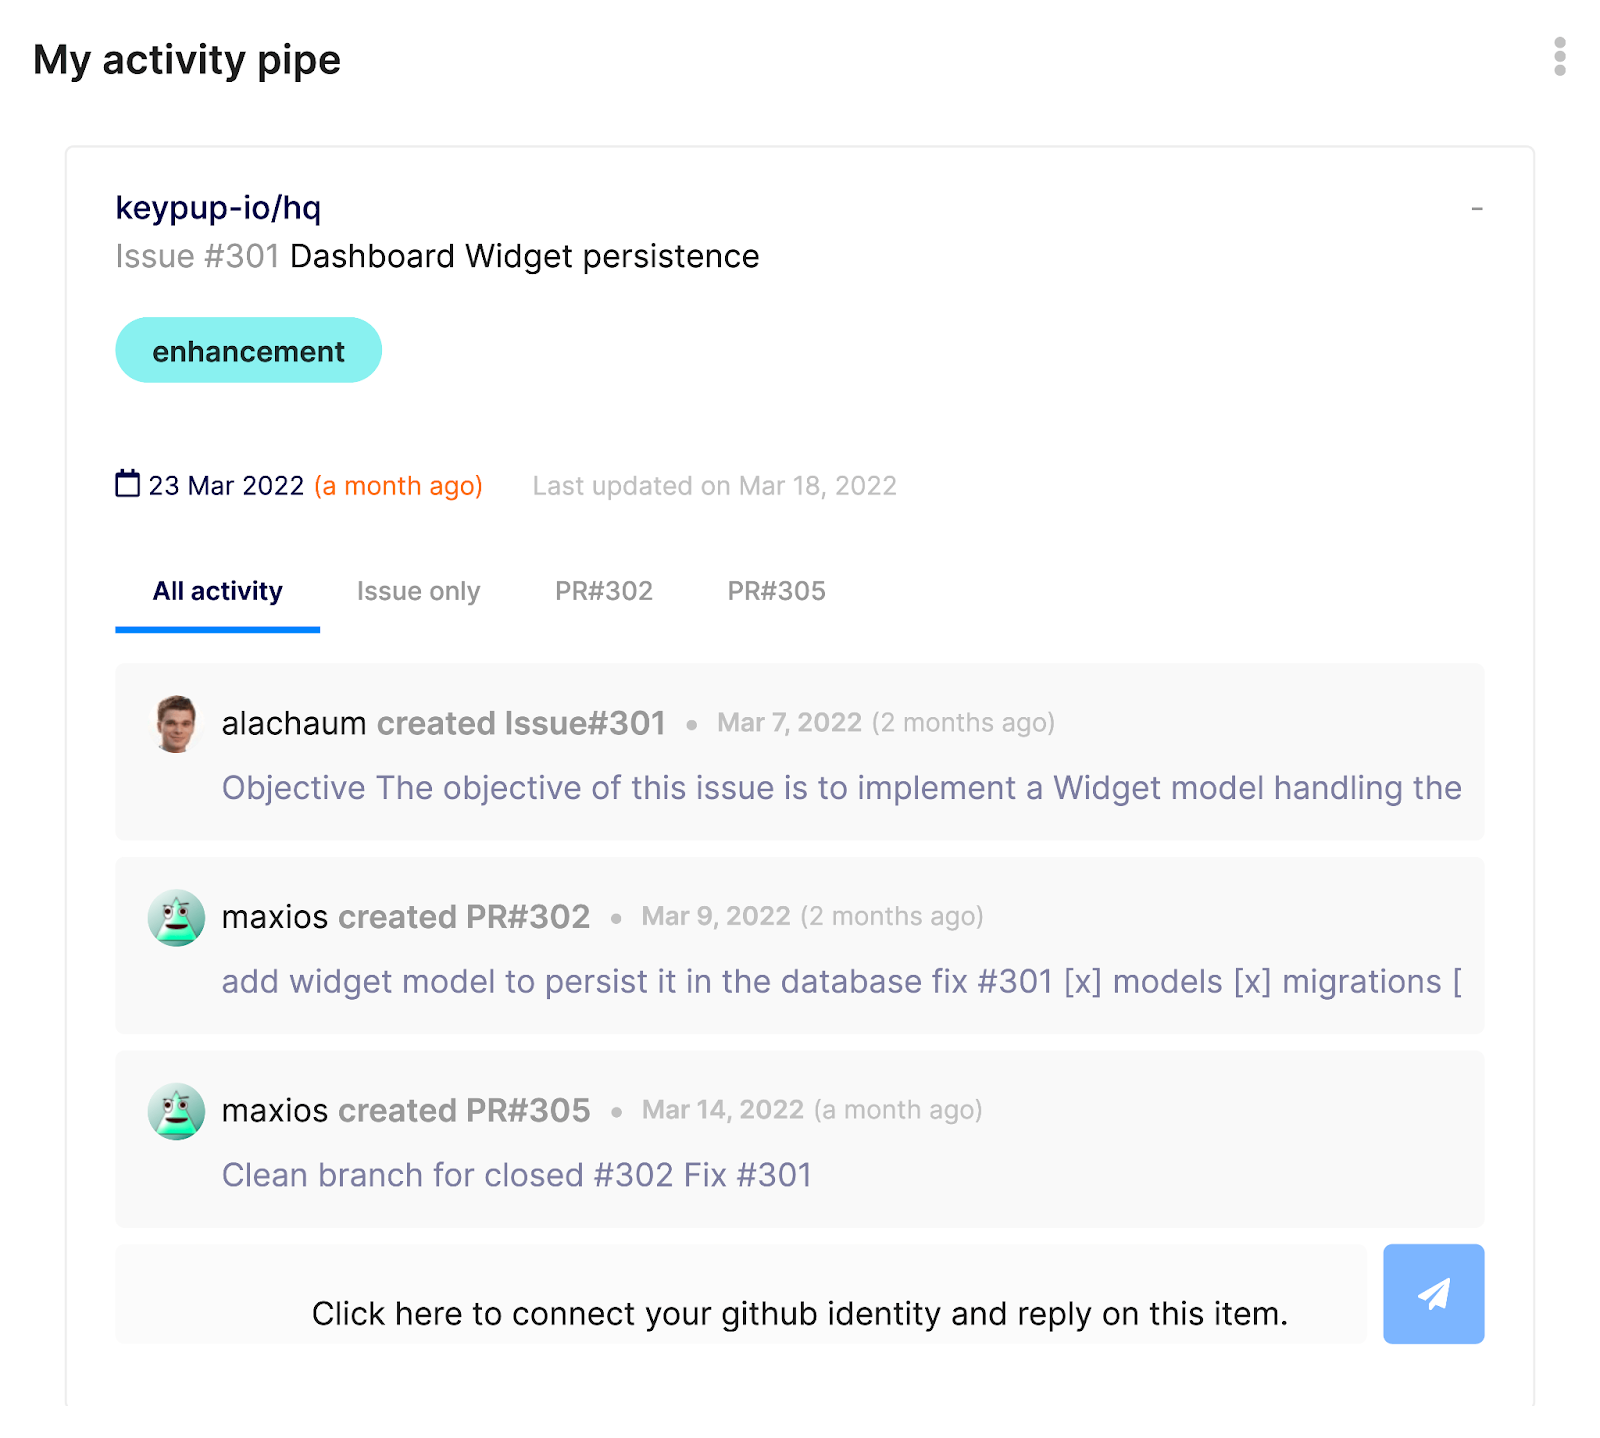
5. Activity Pipe
Keypup’s “Activity” pipe metric displays individual work reports, such as open pull requests.
Such a personal activity card also lists all the open items assigned to a team member, sorted by the due date. This set of metrics helps improve an individual’s clarity on tasks at hand and ultimately performance by providing a detailed activity analysis.
Keypup “My Activity pipe” template here.
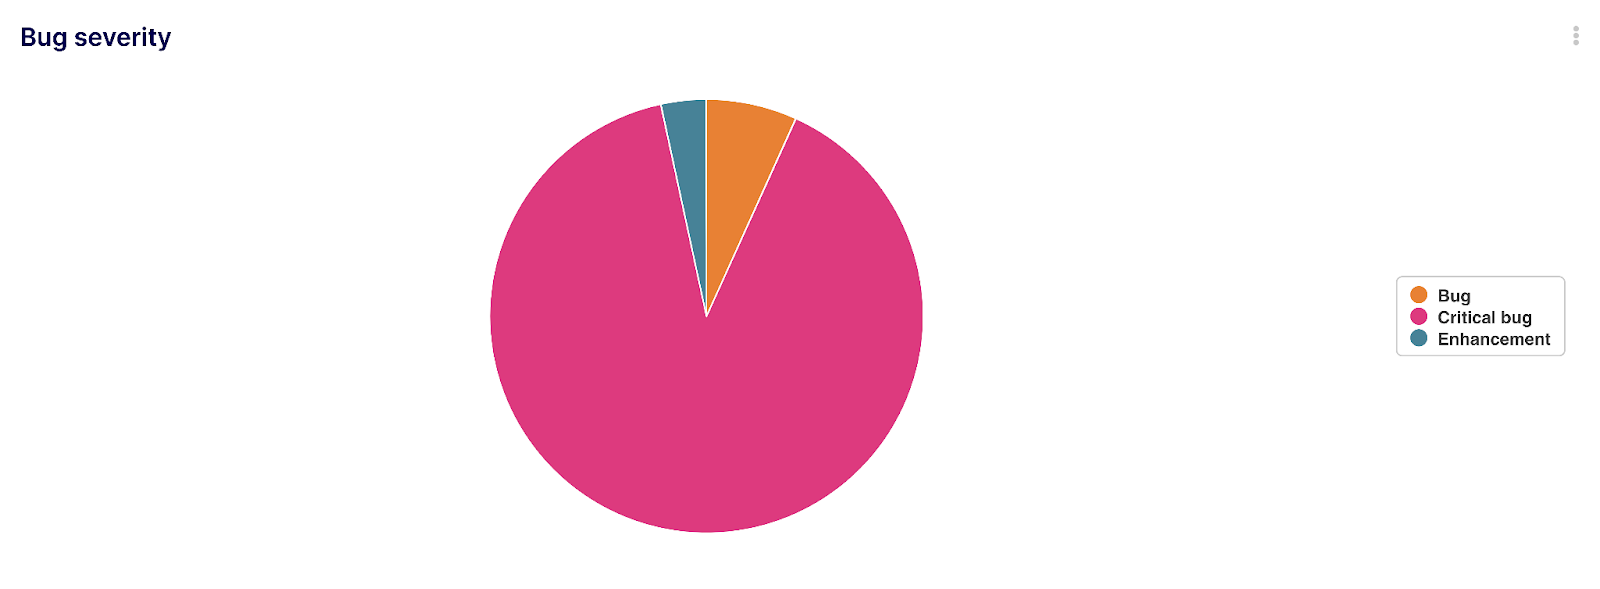
6. Raised Bugs & Bug Severity
Raised Bugs displays the items created over a given timeframe labeled as “bug.” It descriptively displays the number of bugs raised past week to date. Keypup’s Bug Severity metric indicates the severity level of bugs by sorting them into relevant labels, enabling team members to prioritize resolution.
Keypup Raised Bugs template here.
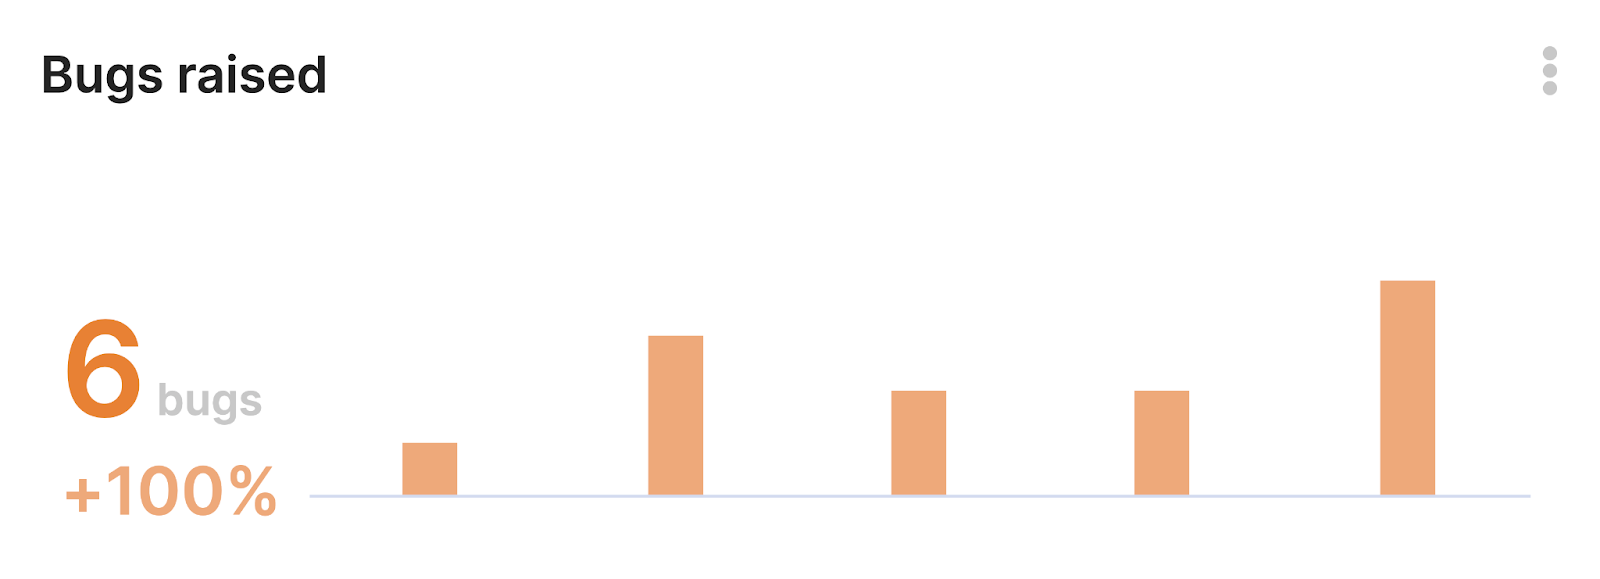
Use Keypup Bug Severity template here
7. Pull Requests Review Ratio
The Pull Requests Review Ratio provides the average number of reviews performed on a given set of pull requests divided by the target reviews number against the same set expressed in percentage. This metric facilitates the evaluation of the review process and highlights potential issues in its application. Adoption of best practices in development processes would enable best performers to hit 100%, expressing the number of targeted reviews that were effectively performed.
Keypup “Performed Review Ratio” template here.

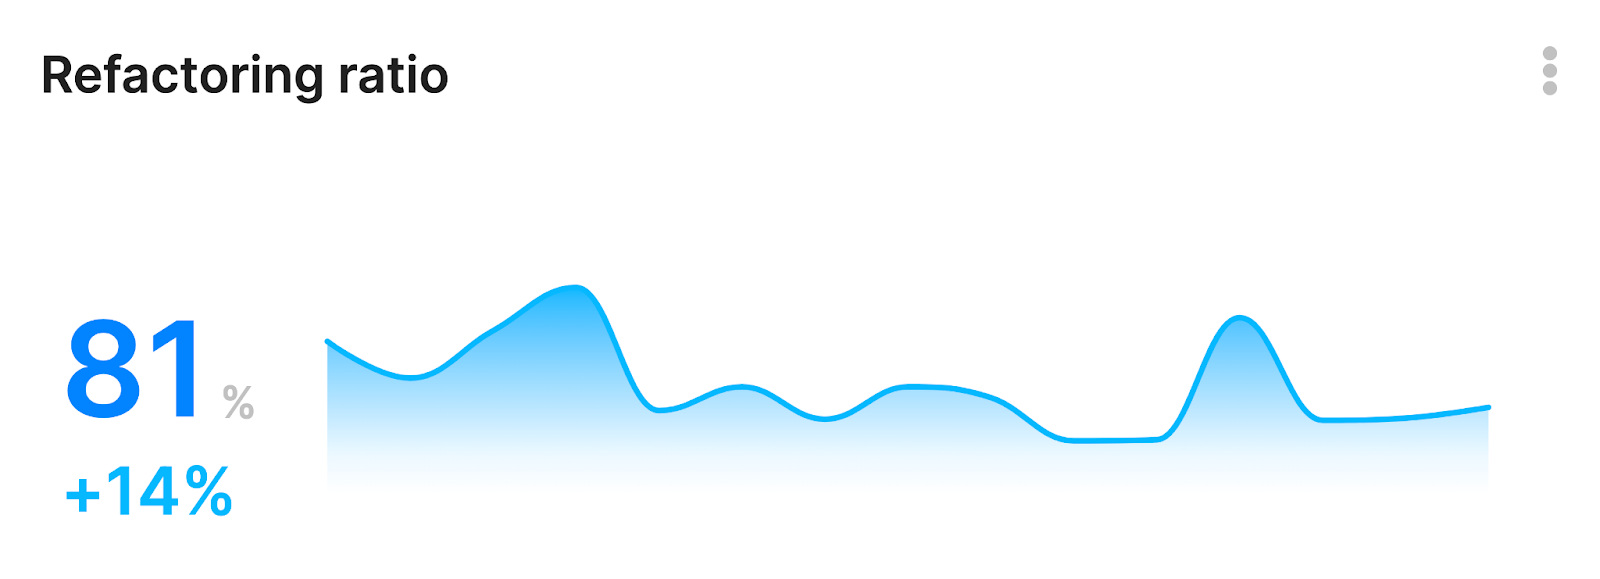
8. Refactoring Ratio
Refactoring Ratio displays the added and deleted lines in merged PRs in a given period. Moreover, the metric also displays how it is trending over time. The refactored metric gives insights into the code and the actions performed to improve its structure.
Keypup “Refactoring Ratio” template here.
Accelerate Software Planning and Development Cycle With Keypup
Keypup comes with comprehensive dashboards, insights, and reports offering convenient features to improve the software development cycle. Keypup engineering KPIs and software metrics accelerate tracking for tech leads, helping them make informed decisions.
Upscale your development progress with Keypup and unlock the numerous features that await your engineering team. Get started today for free.