As a tech leader, you know that data analytics is essential for making informed decisions and driving improvements in your software engineering organization. However, having access to a large amount of data doesn't necessarily mean you have the insights you need to make the right decisions. This is where filtering comes in handy. By applying filters to your data, you can narrow down the metrics to focus on specific areas such as time frames, projects, teams, labels, or individuals. This can help you gain more accurate insights into the development process and identify areas for improvement.
For example, let's say you want to analyze the performance of your development teams. By filtering the metrics to focus only on the developers who worked on a specific project, you can gain a more accurate understanding of how that team is performing. You can identify top performers, areas for improvement, and potential roadblocks that are preventing the team from reaching its full potential.
In this tutorial, we'll show you how to narrow down metrics using Keypup's filters. Keypup provides a variety of engineering metrics, reports, and KPIs to help you get started. These templates are built using default filters that you can easily adjust to best suit your needs. We understand that every software engineering organization is unique, so we haven't hardcoded the provided templates.
Remember, if you have any doubts or if you are not sure which fields are available, you can always use the dropdown menu or use the “help” button located at the bottom right of your screen.
Here are the steps to narrow down metrics using Keypup's filters:
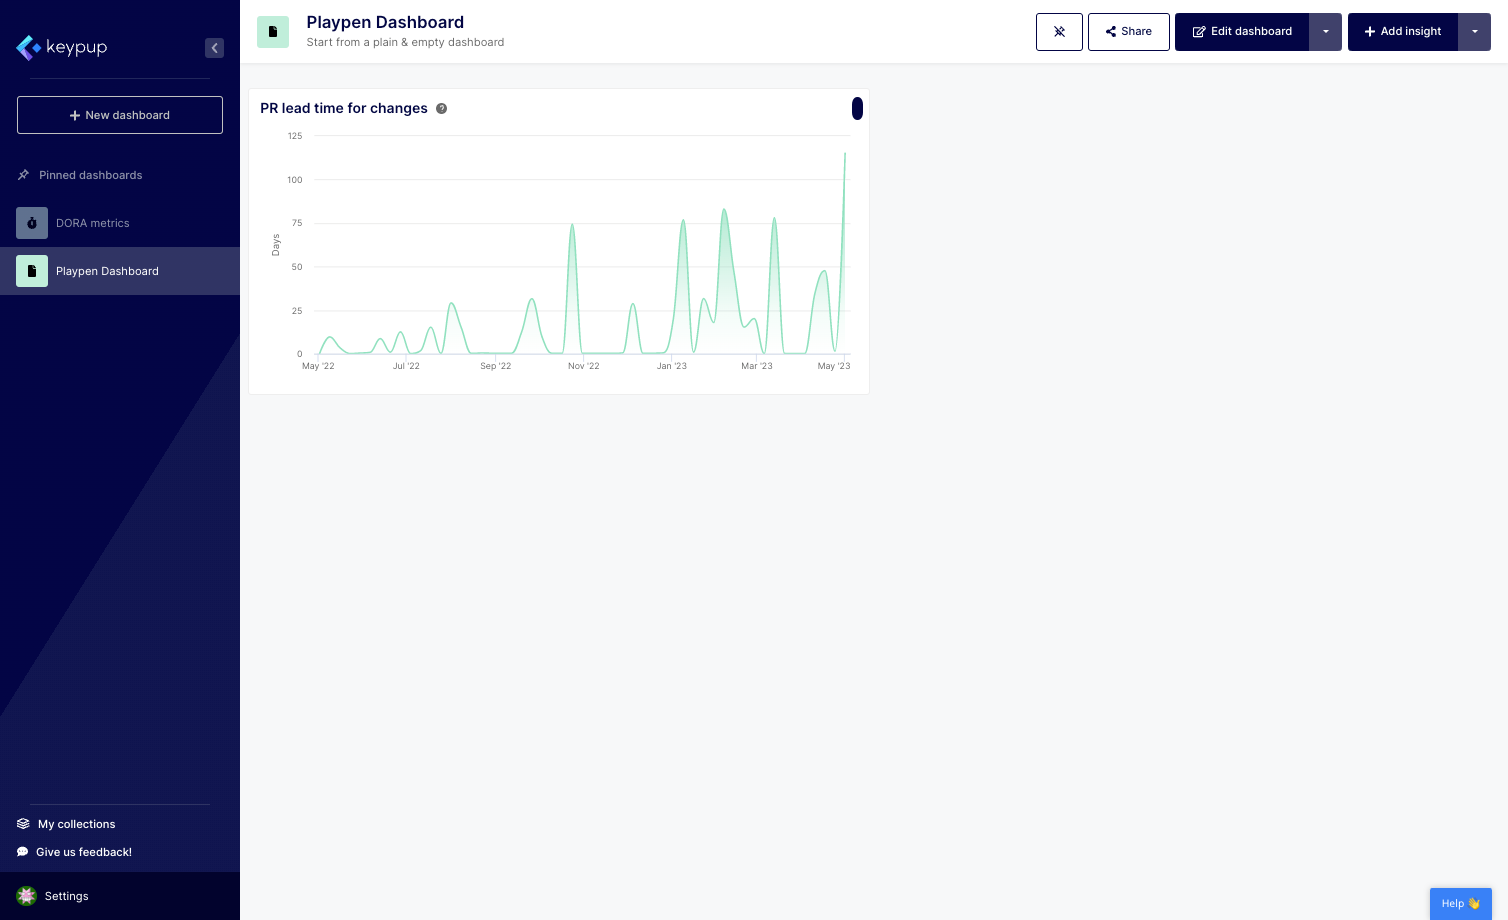
1. Select the insight you want to modify by clicking on the edit button located on the top left of the insight. In this case, we're modifying the PR Lead Time for Changes metric.
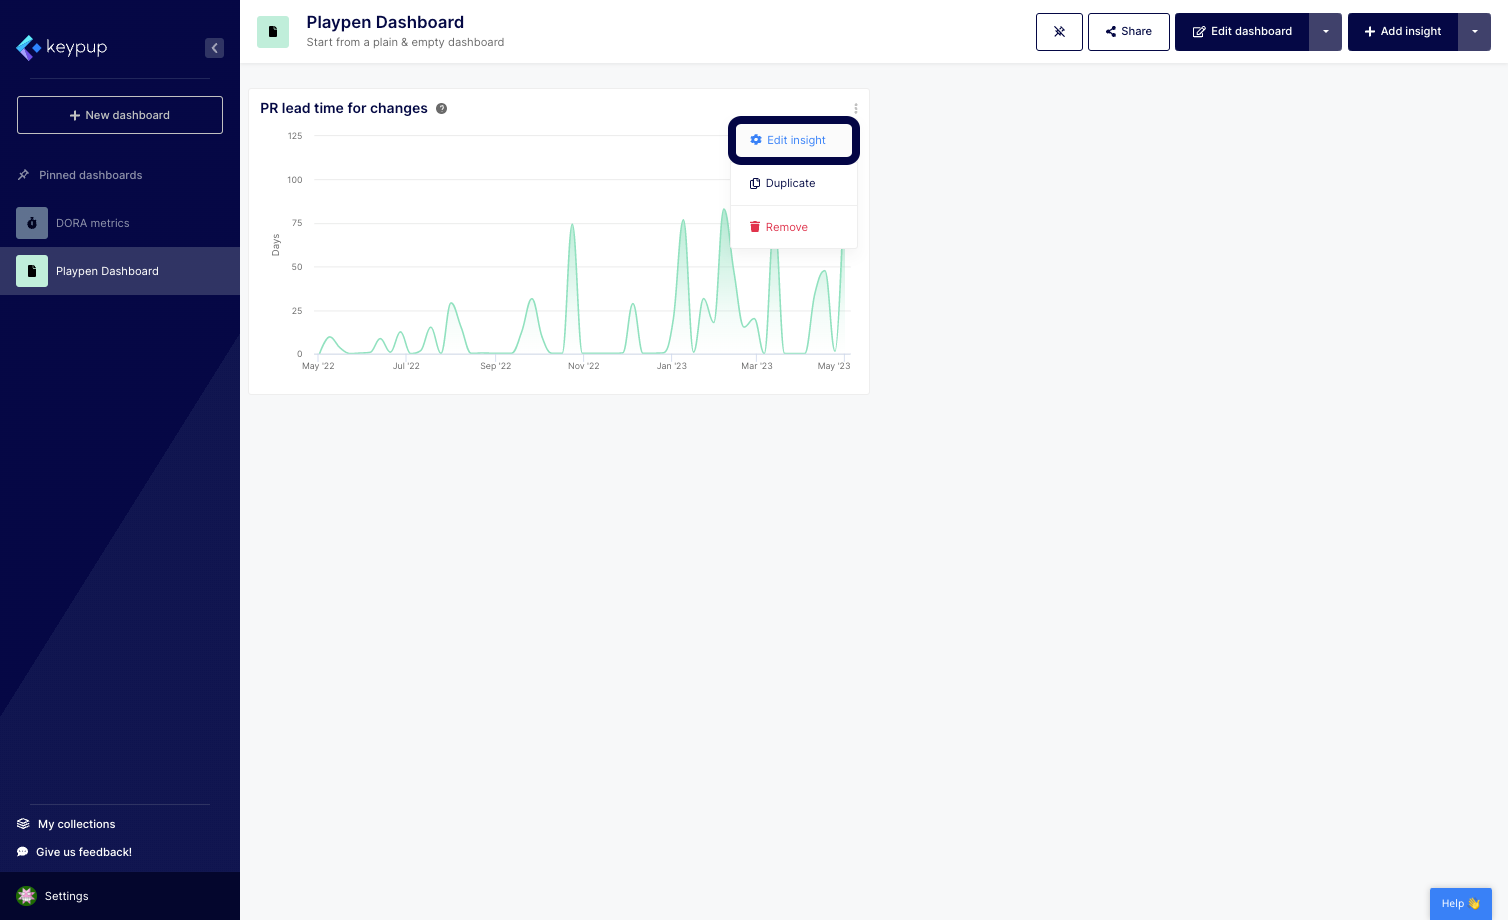
2. Select "Edit insight" from the dropdown menu.
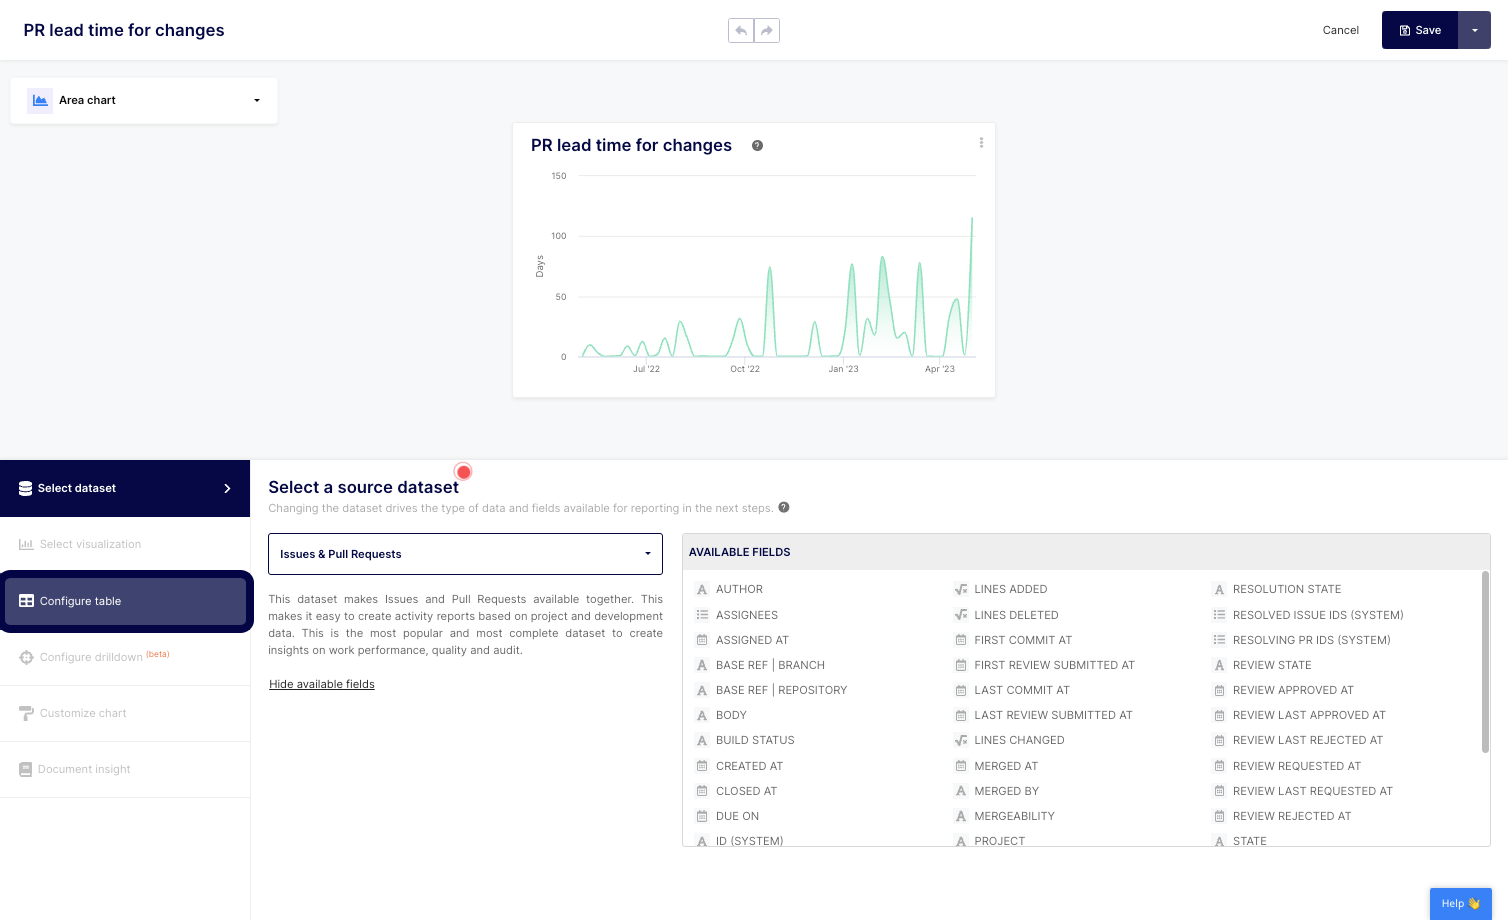
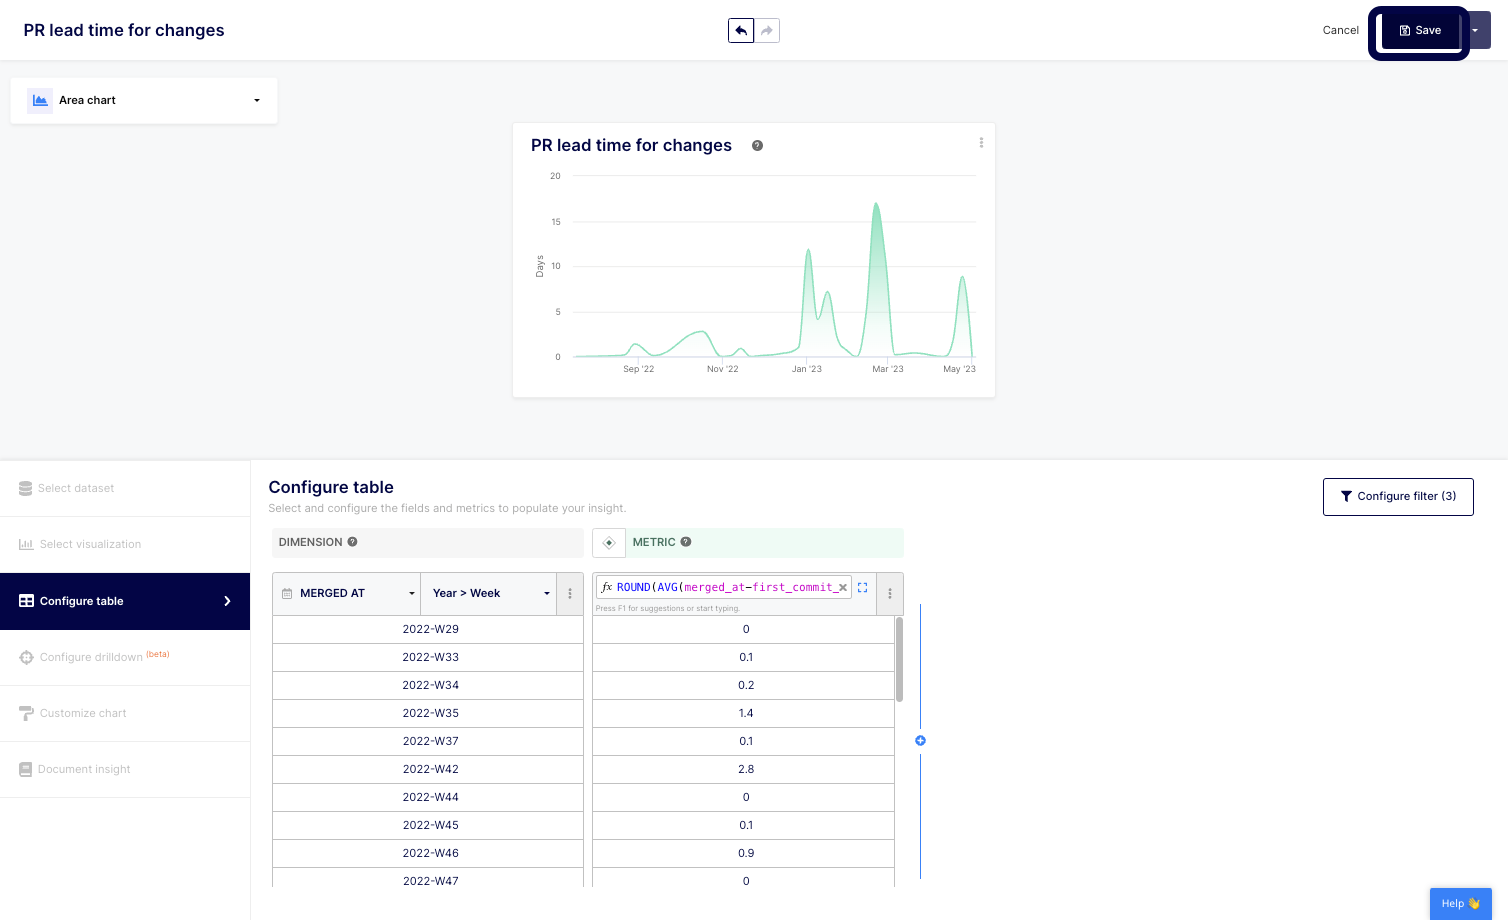
3. On the configuration panel located on the left side of your screen, select the "Configure table" option.
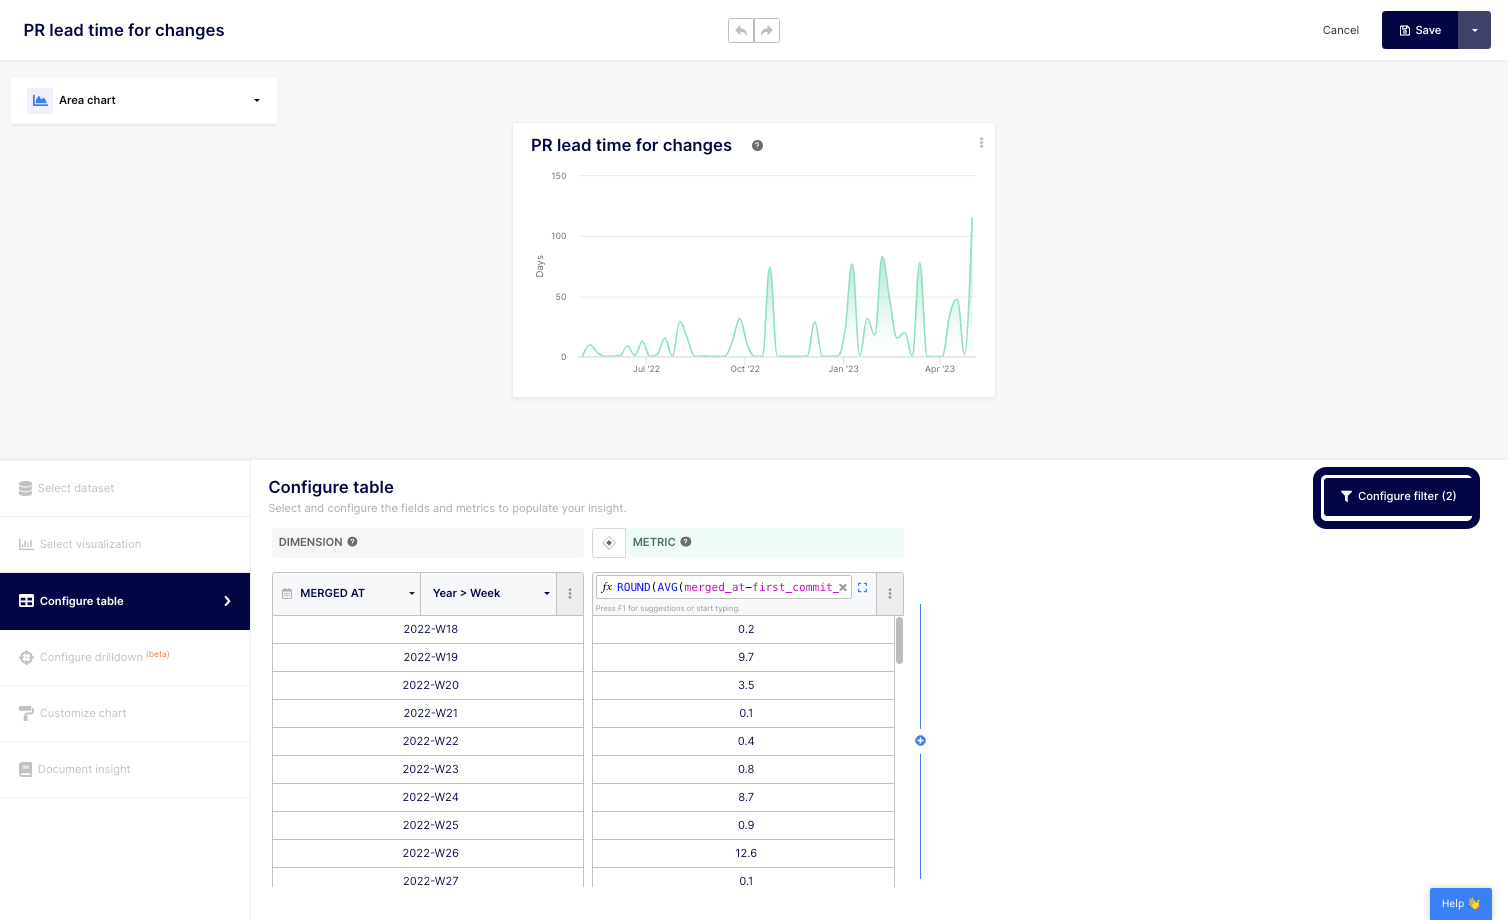
4. Click on the "Configure filter" button located at the top right of the configuration panel.
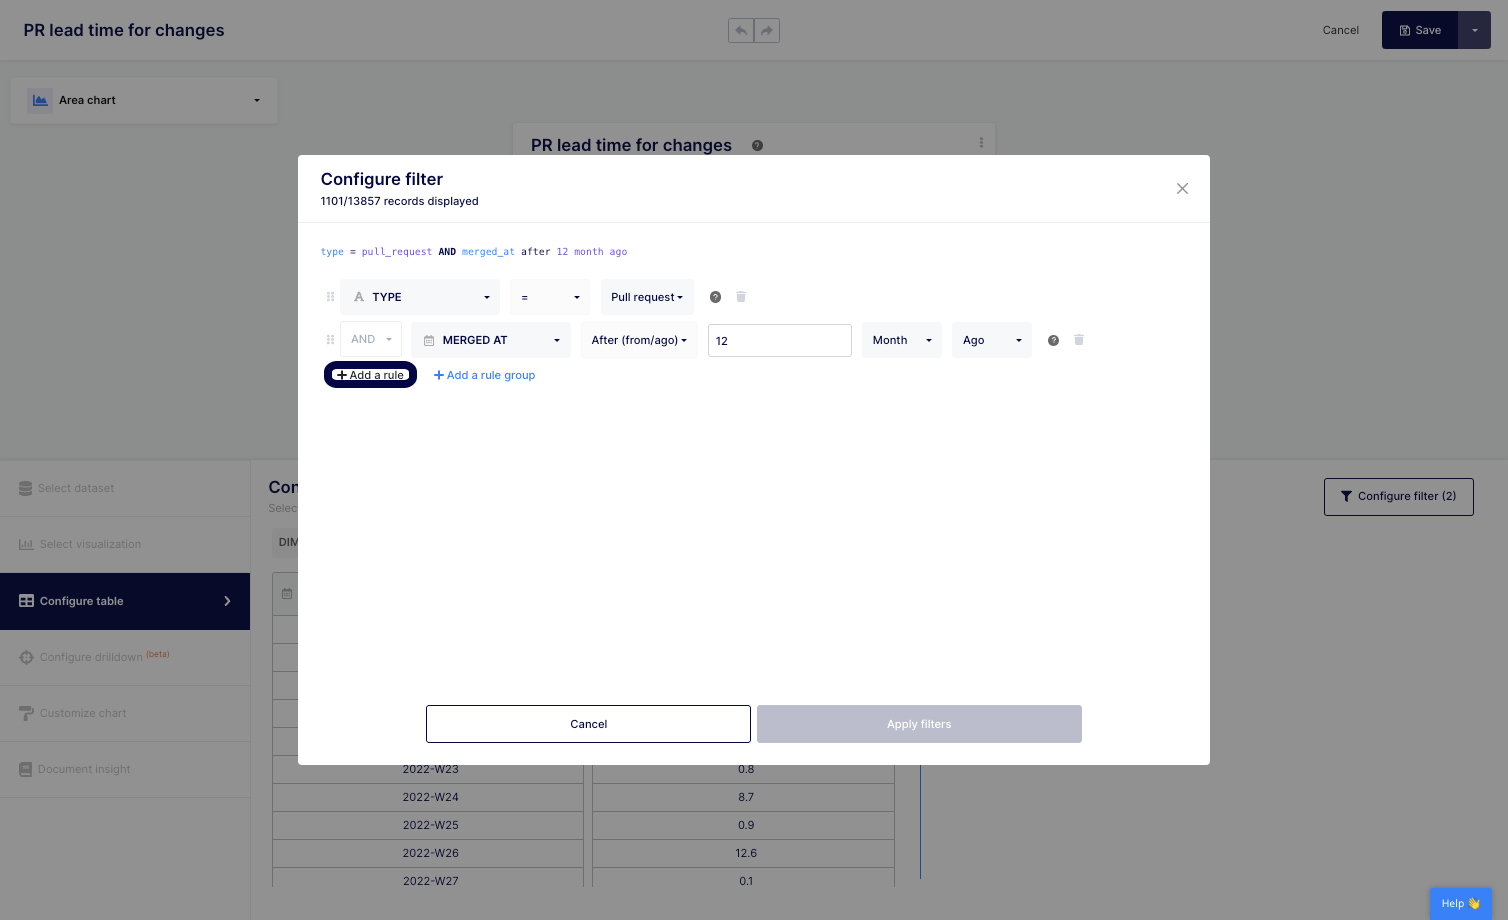
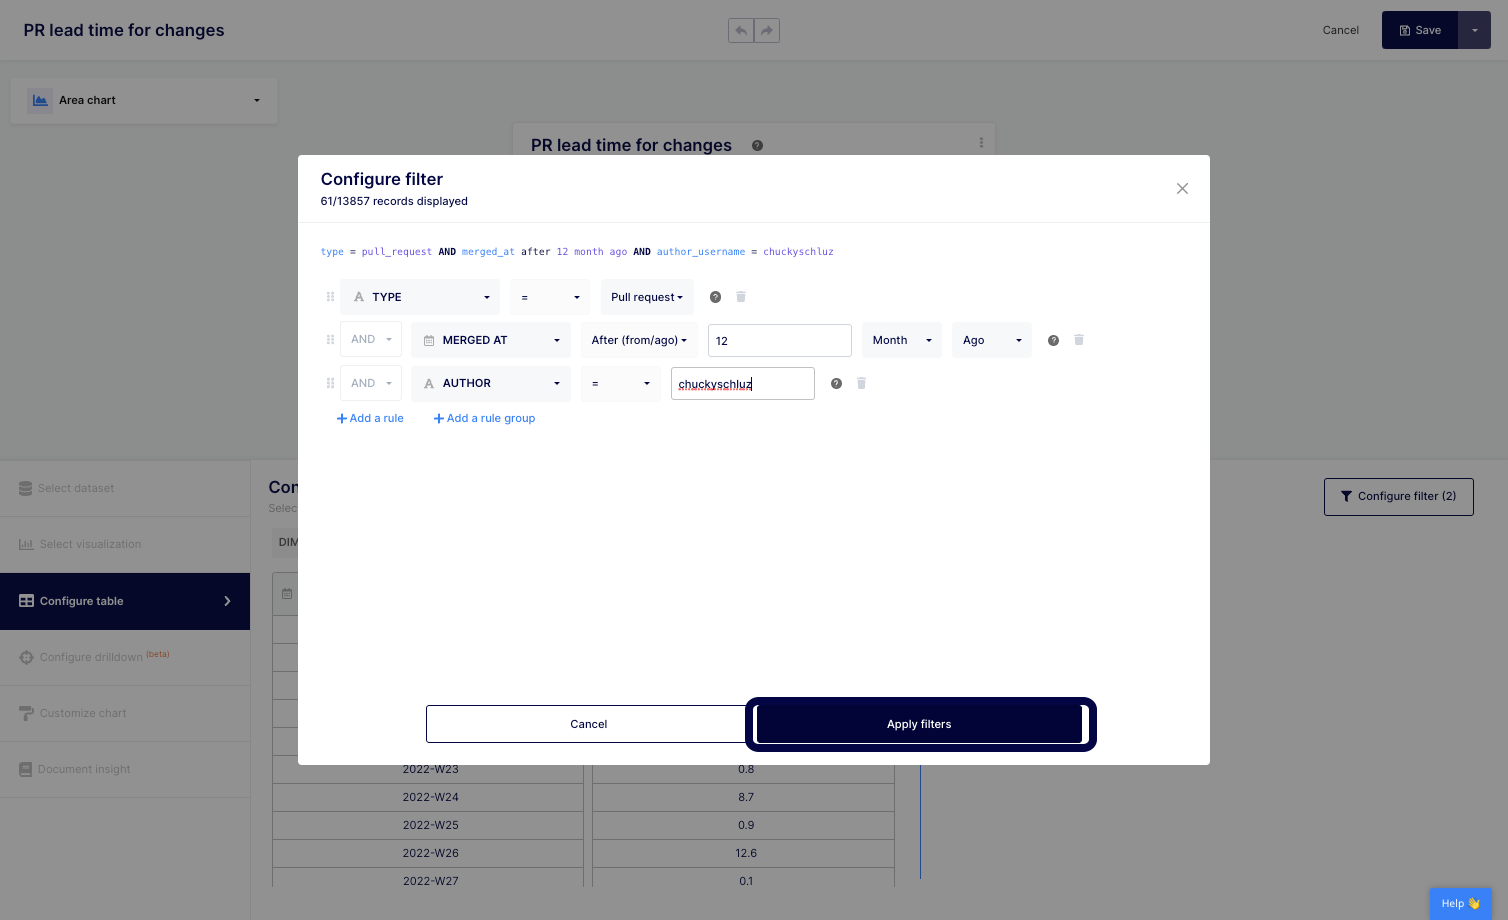
5. This template has two filters applied by default, the item type (Pull request/Issue) and the merge date time frame (past 12 months). These filters can be amended to best suit your needs. For this example, we'll click on the "+ Add rule" option.
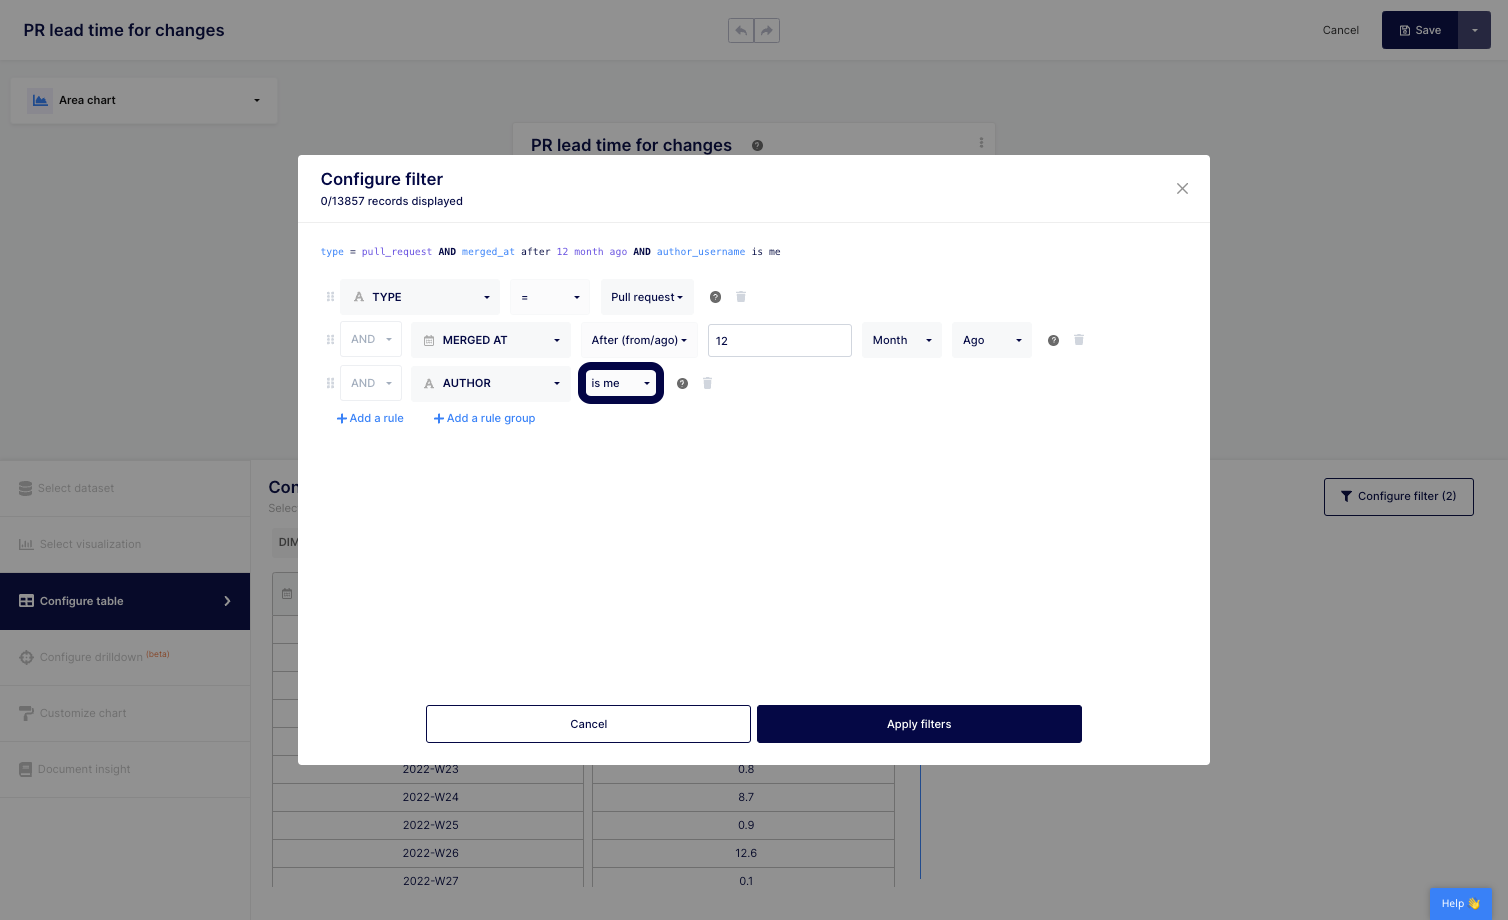
6. We'll narrow down the metric to a specific user by clicking on the dropdown "Is me".
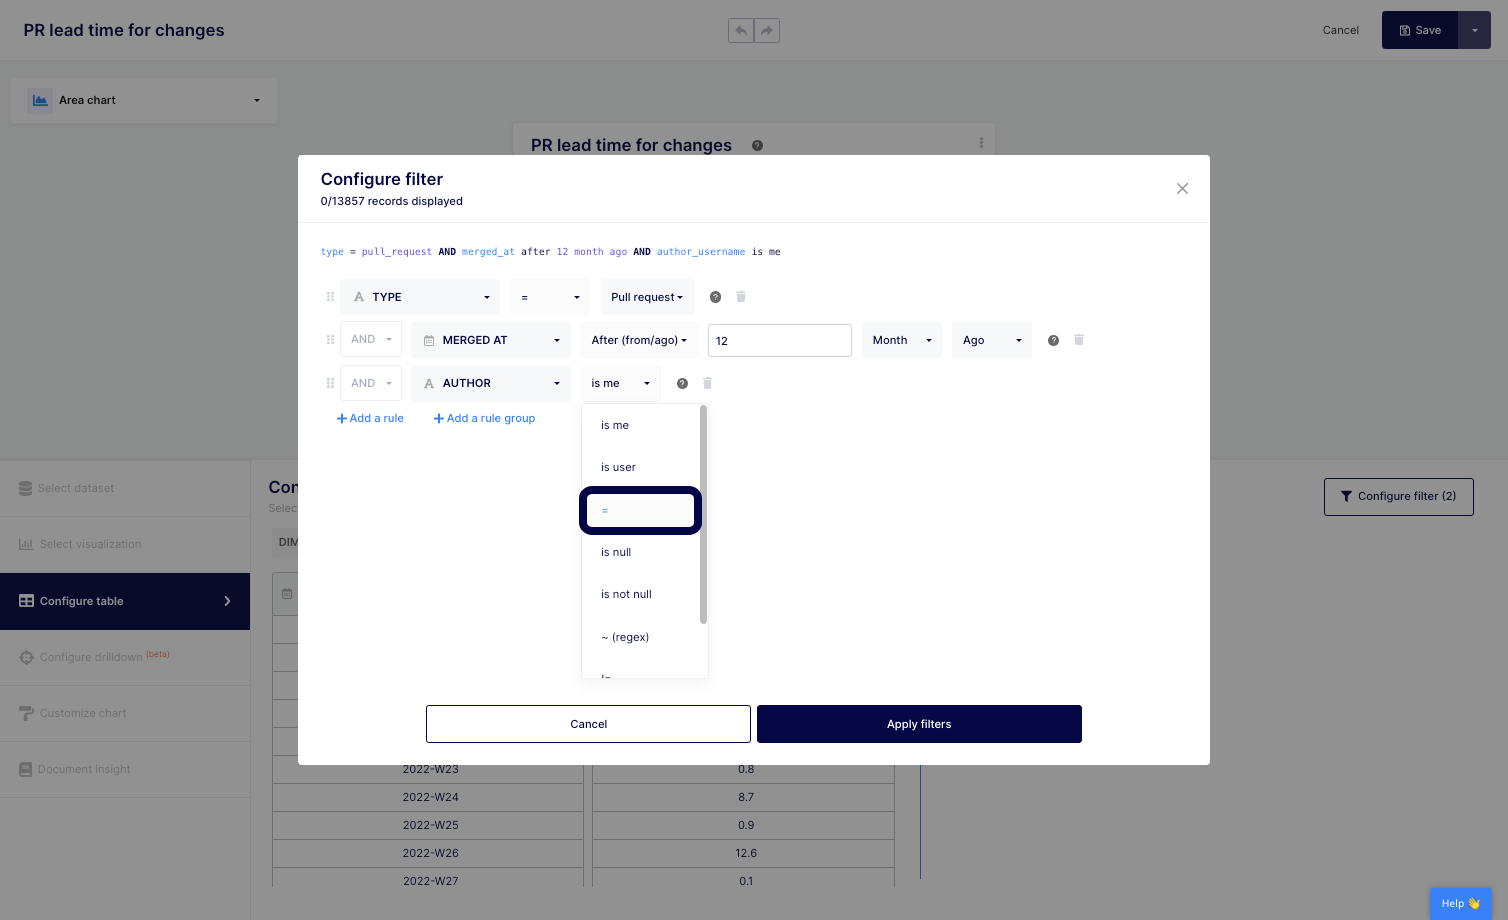
7. You have multiple ways to include or exclude information to best illustrate your use case. In this case, we'll use the sign = as we know which user we want to report on.
8. We can then paste or type in the user name.
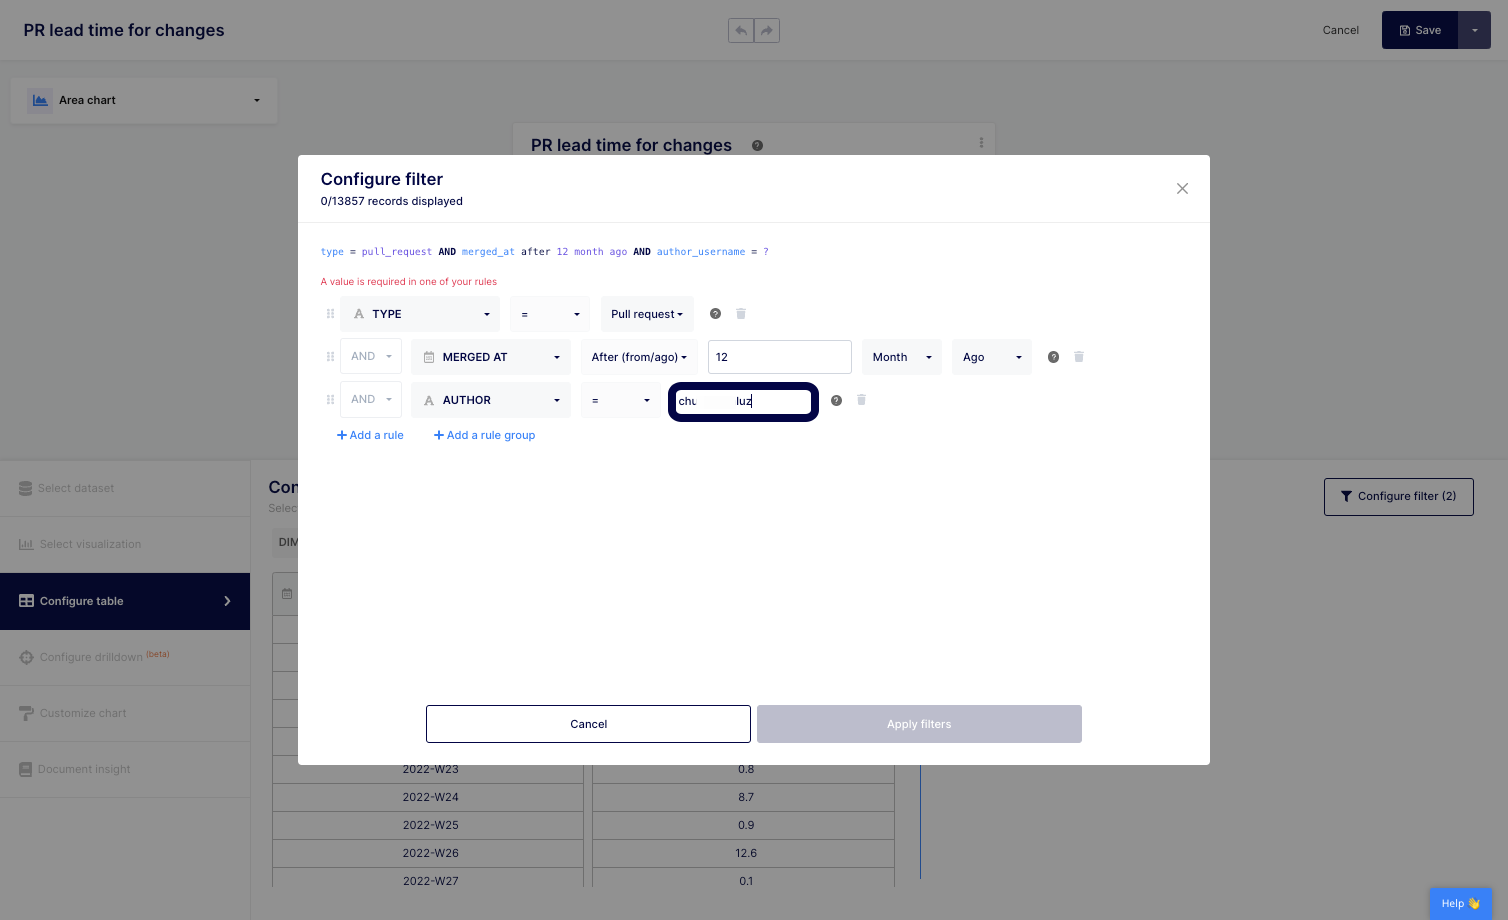
9. Click on the "Apply filters" button to see the narrowed result.
10. Once done, click on the "Save" button located at the top right of your screen.
Filtering is a powerful tool for data analytics in software engineering organizations. By narrowing down metrics to focus on specific segments, you can gain more accurate insights into the development process and identify areas for improvement. Whether you want to analyze the performance of a specific team, identify top performers, or pinpoint potential roadblocks, filtering can help you get the insights you need to make informed decisions and drive success.
With Keypup's platform, you can easily adjust the default filters to fit your unique needs and create custom metrics and reports without having to start from scratch. By leveraging the flexibility and customization of Keypup's filtering feature, you can gain more accurate and meaningful insights into your development process and make data-driven decisions that will help your organization succeed.
Try Keypup's platform today to see how you can benefit from using filters to narrow down your metrics and create custom metrics and reports for your organization.