Every company embraced digital transformation due to the onset of the Covid-19 pandemic. Evidently, most companies today are playing the role of a software company regardless of which industry they belong to. While digital transformation has its advantages, it also requires high maintenance to keep producing consistent results. This is because software's requirements inevitably change with customers' expectations. When this happens, tech leaders need to meet new requirements to provide consistently enhanced and stable services.
One of the most proven ways to ensure a tech team is continuously improving is to adopt DORA metrics. DORA helps accelerate the software development cycle by providing objective insights measuring software delivery and overall project team performance.
What are DORA Metrics?
The DevOps Research and Assessment metrics are part of the Google research group. The primary function of DORA metrics is to measure and understand DevOps practices and their limitations in the IT industry. Tech leaders and DevOps teams use these metrics to measure their overall performance to determine how they can streamline their processes to reach the “elite performers” category.
This methodology enables them to provide reliable insights about the required changes to improve DevOps transformations. DORA metrics have been operating for at least seven years now. During that period, the Google research group closely analyzed the DevOps practices to identify four primary metrics to measure software development and delivery performance. These four metrics are
Lead Time for Changes (LTC)
Deployment Frequency (DF)
Mean Time to Recovery (MTTR)
Change Failure Rate (CFR)
DORA metrics are currently one of the most reliable ways to measure the software development team’s efficiency. Moreover, they are also quite effective for identifying areas for further growth and improvement. The four components of DORA metrics are critical to growing and scaling a modern engineering organization.
Let’s take a closer look.
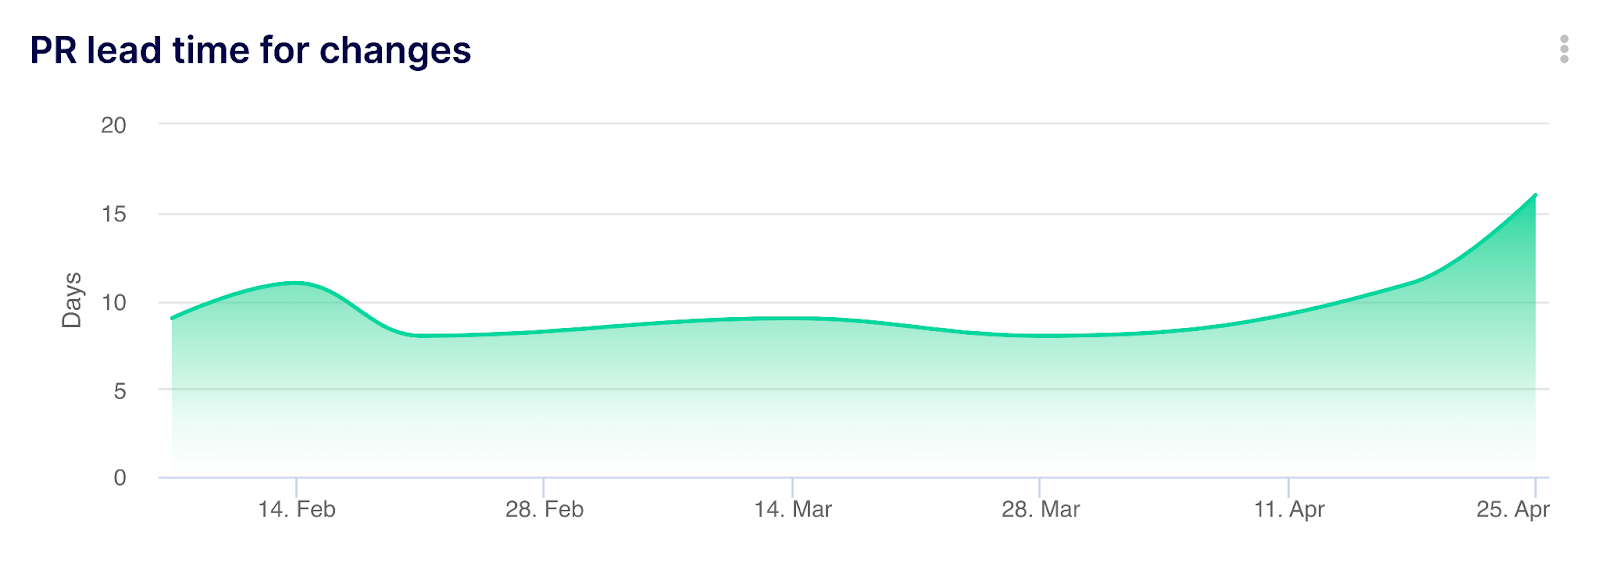
Lead Time for Changes
Lead time for changes (LTC) is the time frame between commitment and production. It represents the time-lapse from initiating a feature request to the future deliveries to the customer. Therefore, LTC's primary goal is to measure the operating speed of the tech team. The timeframe shows the team's response time and ability to adapt and make the necessary changes.
Additionally, it gives insights into the software team's preparation to cater for the new and evolving demands that arise from the constant change of the user's needs. The DORA metrics team has a benchmark to determine the performance level of teams. This benchmark shows whether you are a low , medium, high or elite performer.
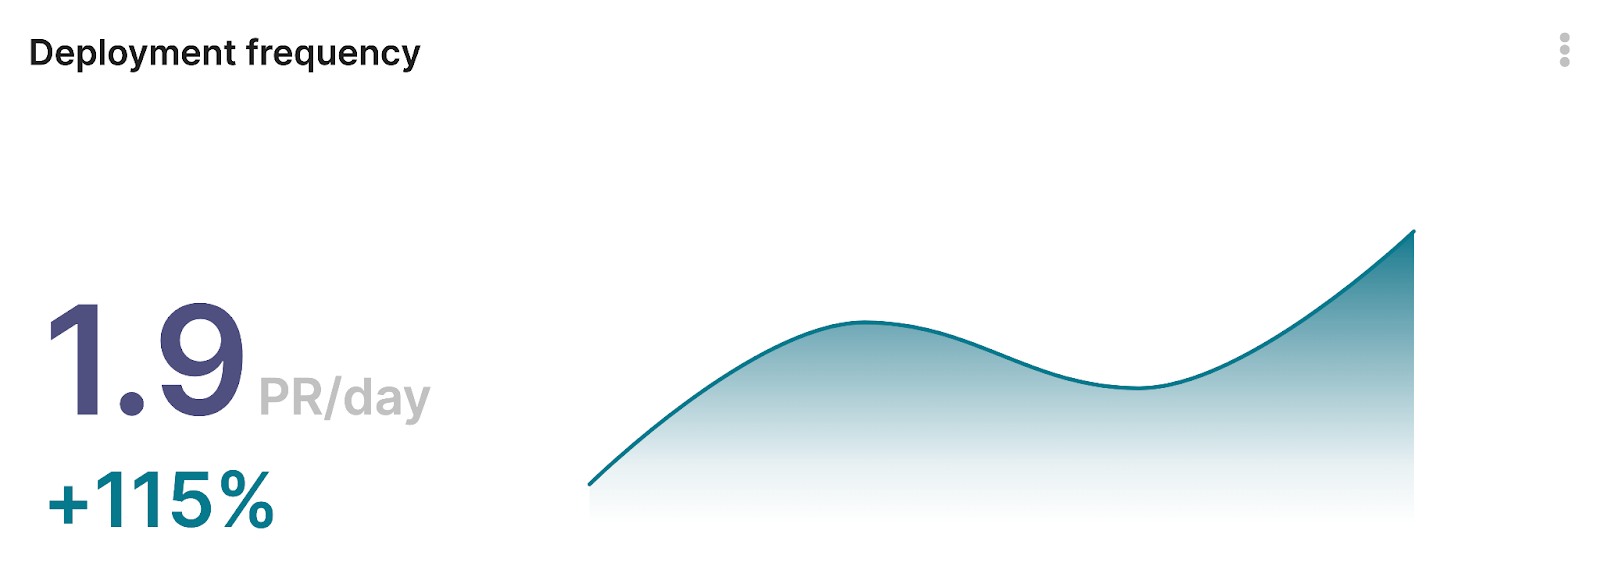
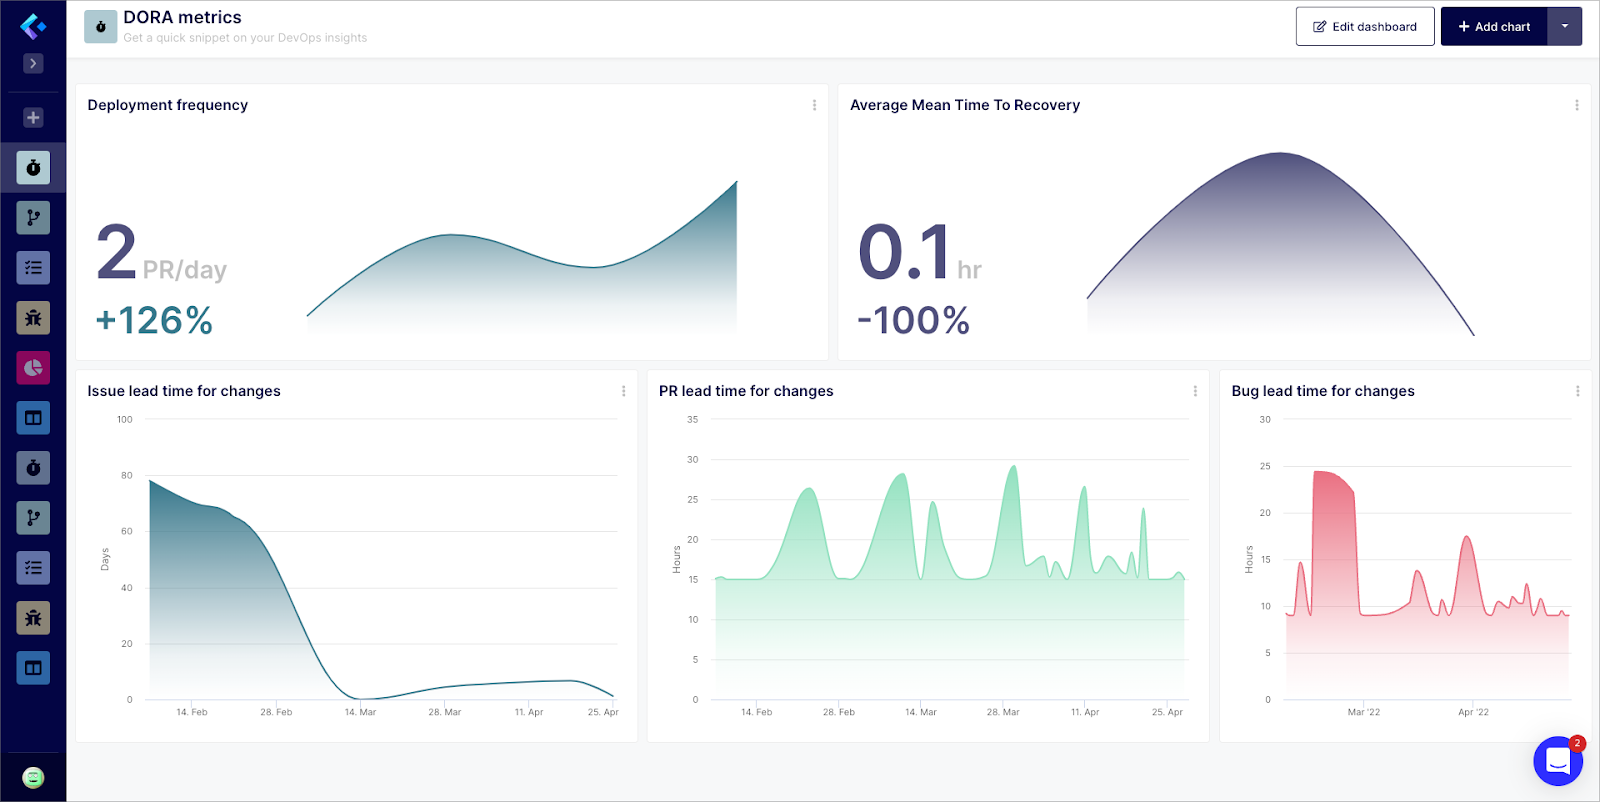
Deployment Frequency (DF)
Deployment frequency (DF) shows the organizations' stability in deploying codes and delivering services or applications. The frequency metric helps anticipate whether the team is achieving its goals and objectives of reliable delivery.
Deployment frequency primarily stems from the lean manufacturing concepts. It further moves toward the ability to control the batch size, its inventory, and timely delivery. A high or elite-performing organization deals with small batches but has more frequent deployments.
The recommended way to enhance an organization's DF is by starting with minor changes. It is better to have fewer complex projects if you have a high deployment frequency. Inability to control that can result in bottlenecks in the development process and growing backlogs as a consequence. In addition, the team has a higher chance of perfecting their coding and performance. It also facilitates quicker issues identification for them to remedy it.
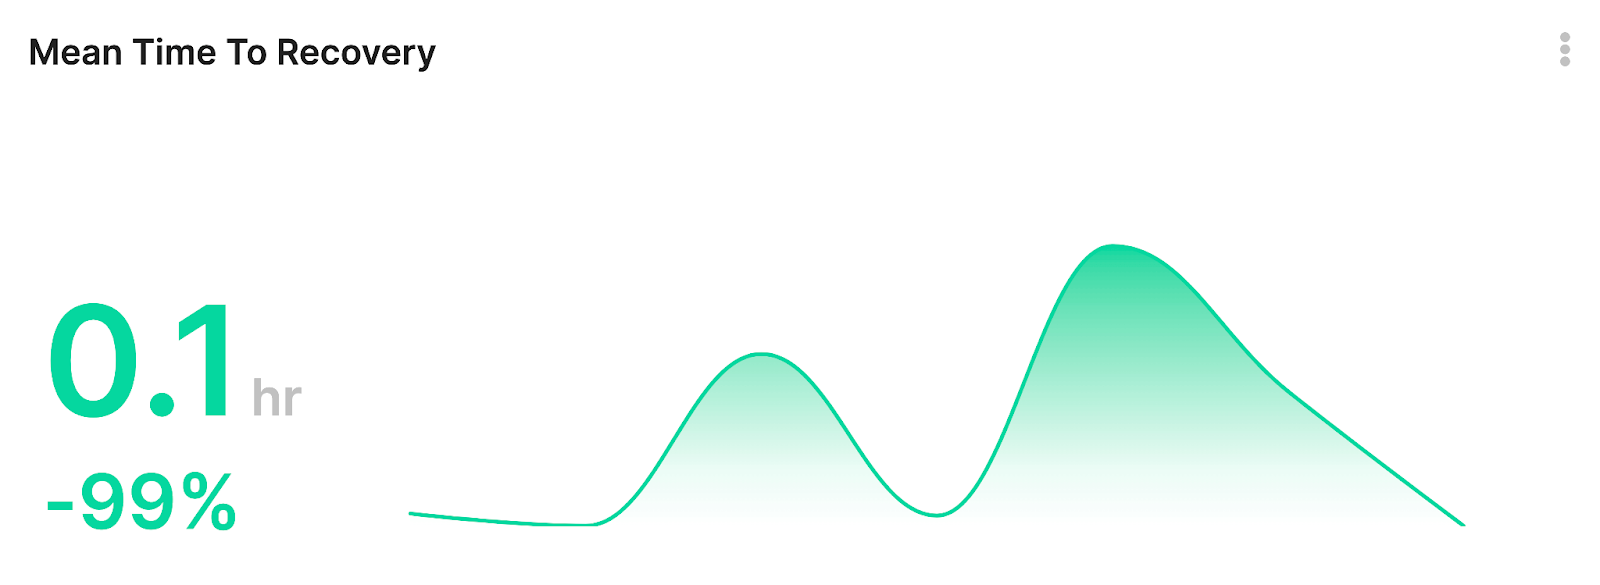
Mean Time to Recovery (MTTR)
Mean time to recovery (MTTR) is the average time a team requires to restore the system's function in case of a disruption or an outage. This metric provides information about the stability of the organization's strategy and the team's resilience when working on a challenging problem.
As a tech leader, you should decrease the system downtime as much as possible to lessen the degrading impact on your value system. If the average MTTR time is more than a day, you probably need to use flags through KPIs (Key Performance Indicators).
Although MTTR is different from the mean time of discovery, locating the issue and its origin is the first step in resolving it. Moreover, instead of looking for a quick solution in sprint planning, ensure it is durable and comprehensive. You should also keep track of MTTR to check whether your team is steadily improving in identifying and resolving system issues. You can use our MTTR template for this.
Change Failure Rate (CFR)
Change failure rate (CFR) is the average system change resulting in downtime, low service level, or rollbacks. This metric informs how effective a team is at implementing new changes. By keeping a close eye on CFR through Development Stack Analytics, you can identify your team's weak coding points resulting in the constant failure of recent changes.
When you are well-acquainted with the weaknesses, you can improve those areas and your team's performance. But this metric is highly dependent on the frequency of changes and their implementation. An organisation introducing fewer or no changes will have a low CFR. However, this doesn't mean that the organization is more successful in deploying changes. That is why there is a minimal distinction between CFR performance benchmarks.
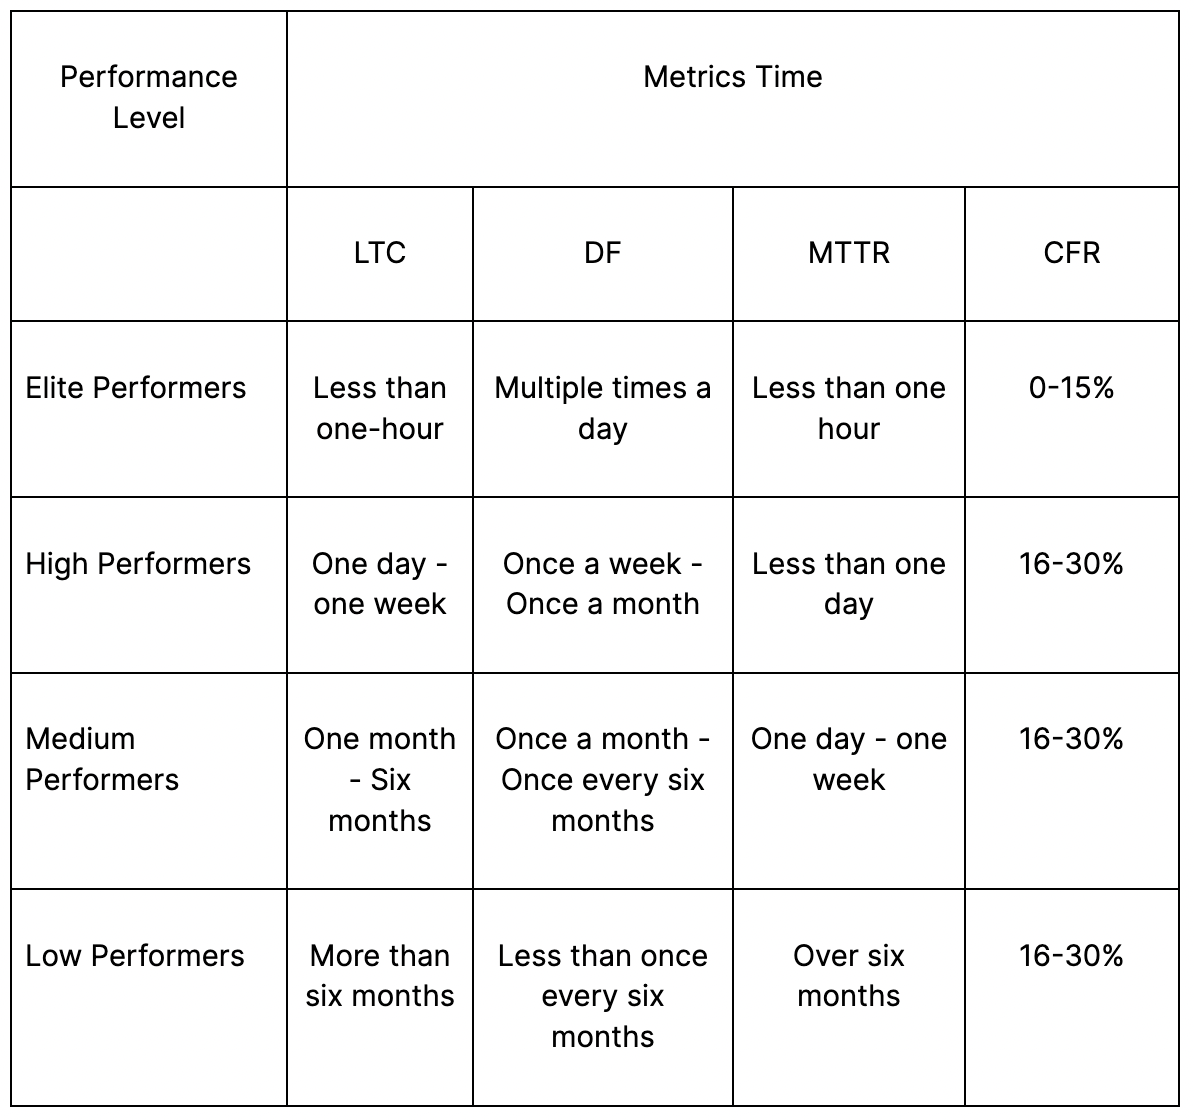
The DORA Metrics Benchmarks
All four metrics have different benchmarks to show whether an organisation is an elite performer or a low performer. You can review the table and determine your position. You can automate this metrics calculation by connecting your stack to Keypup and using the DORA template here.
Conclusion
DORA metrics help you scale and improve your engineering organisation. You can accelerate your software development cycle and upgrade your deliveries by closely monitoring these metrics. Want to make high-value business development decisions? Join Keypup to streamline your software development processes and get real-time insights from your stack. Start improving today.
References
https://www.leanix.net/en/wiki/vsm/dora-metrics
https://harness.io/blog/continuous-delivery/dora-metrics/
https://rollbar.com/blog/accelerating-code-quality-with-dora-metrics/
https://devops.com/how-dora-metrics-can-measure-and-improve-performance/