In the dynamic and ever-evolving landscape of software project management, the emergence of intelligent tools has been a game-changer for technology leaders and teams. Keypup stands out as a pivotal platform in this revolution. At its core, Keypup is an innovative software development analytics tool that seamlessly integrates data aggregation and analysis from code collaboration and project management tools to streamline the complexities of software development and team coordination.
Keypup distinguishes itself by offering a sophisticated suite of metrics aggregators, functions, and diverse datasets, designed to optimize workflow, enhance decision-making, and provide insightful metrics tailored to the unique needs of tech leaders and development teams. These tools are not just about data collection; they represent a deeper understanding and management of the software development life cycle, from initial issue tracking to the final stages of pull requests (PRs) and code reviews.
The purpose of this article is to delve into the intricacies of Keypup's offerings. We will explore the range of metrics aggregators available on the platform, each designed to provide specific insights into software project performance and team efficiency. Additionally, we will examine the variety of functions within Keypup, which allow for customized data manipulation and analysis, catering to the diverse needs of project managers and CTOs. Lastly, we will shed light on the different datasets that Keypup provides, highlighting how each dataset can be leveraged to gain a comprehensive understanding of project dynamics.
By the end of this article, tech leaders and project managers will have a deeper understanding of how Keypup's aggregators, functions, and datasets can be utilized to transform their project management approach, leading to more efficient, data-driven decision-making and a streamlined workflow.
Keypup's Metrics Aggregators: The Key to Advanced Git Data and Insights
In the realm of project management, particularly in a data-rich environment like Keypup, metrics aggregators are indispensable tools. They serve the critical function of consolidating and interpreting diverse data points, thereby empowering tech leaders with actionable insights. Each aggregator in Keypup has a unique purpose, transforming raw data into meaningful information tailored to specific software project management needs. Aggregators are also the only way to get a quantitative measurement (i.e., a number) associated with one or several dimensions.
- AVG (Average): Computes the average of a numerical dataset. It's crucial for understanding average times, like the average duration to close issues, providing a benchmark for performance assessment.
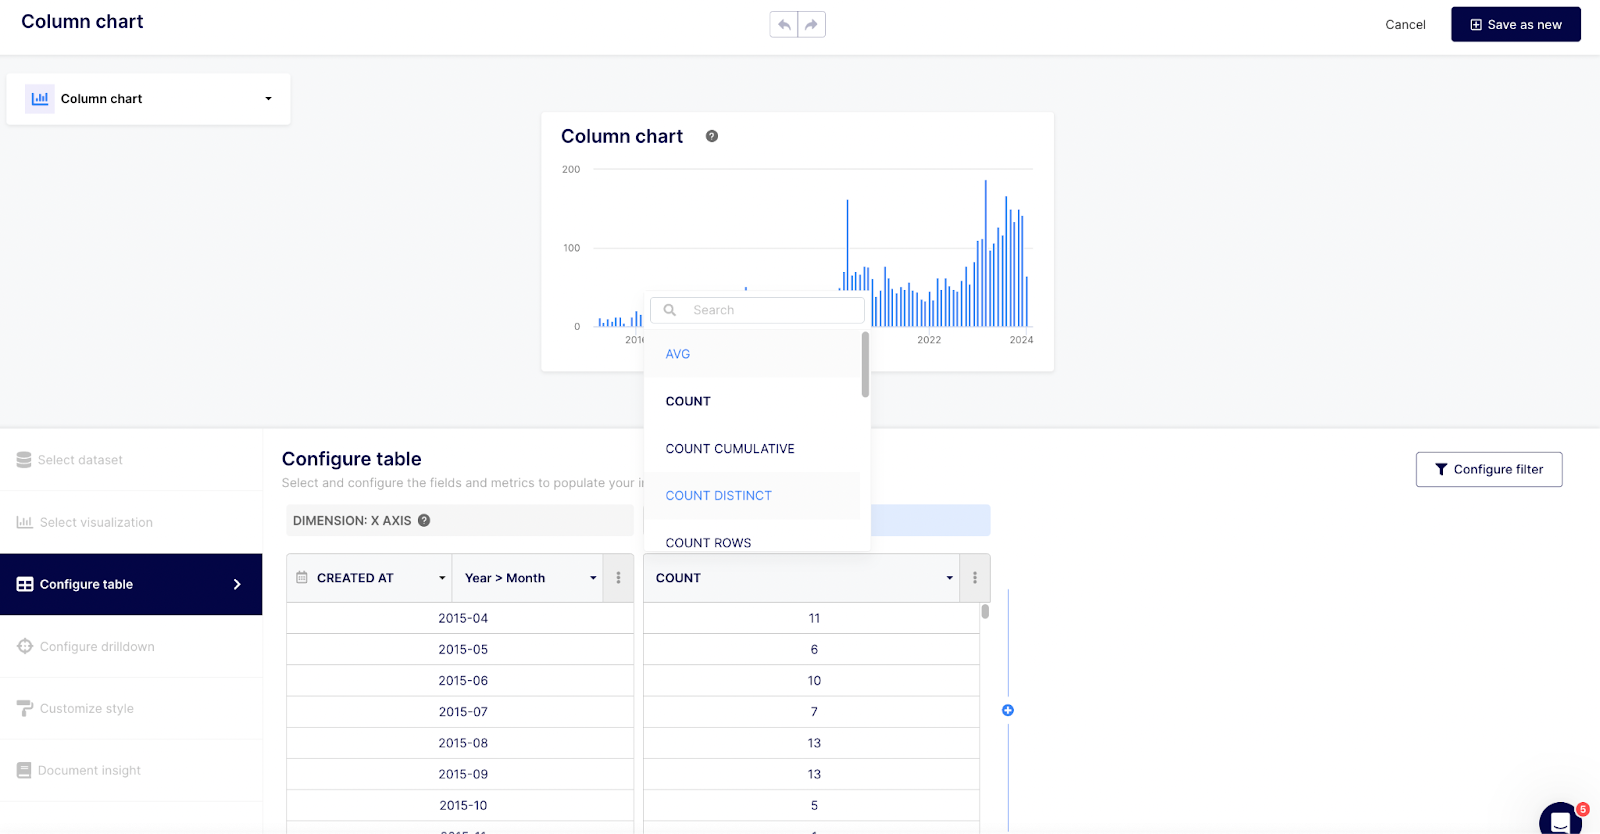
- COUNT: Tallies the number of items in a dataset. It’s used to count occurrences, such as the number of open issues, giving a straightforward overview of workload or project scope.
- COUNT_CUMULATIVE: Accumulates counts over a period of time. Ideal for tracking the growth of issues or tasks over time, offering insights into project progression or escalation.
- COUNT_DISTINCT: Counts unique items in a dataset. This is useful for understanding the diversity in data, like the number of distinct contributors to a project.
- COUNT_IF: Counts items that meet a specific condition. It can be applied to count issues with certain labels or statuses, aiding in focused analysis.
- COUNT_ROWS: Tallies the number of rows in a dataset, providing a basic quantitative measure of the dataset’s size.
- COUNT_TOTAL: Provides the total count of items across multiple datasets or categories, giving a cumulative perspective.
- MAX (Maximum): Identifies the maximum value in a dataset. Useful for identifying outliers or peak values, such as the maximum time taken to resolve an issue.
- MEDIAN: Finds the middle value in a dataset, offering a more balanced measure than averages in skewed datasets.
- MIN (Minimum): Determines the minimum value in a dataset. This can highlight best-case scenarios or efficiencies, like the minimum response time to an issue.
- STDDEV (Standard Deviation): Measures the amount of variation or dispersion in a dataset. Essential for assessing the consistency of data, such as the variability in review time.
- SUM: Adds up numerical values, crucial for aggregating totals like the total hours spent on tasks.
- SUM_CUMULATIVE: Calculates a running total over time. It’s useful for ongoing tallying, such as total effort expended in a project phase.
- SUM_IF: Sums values that meet a certain condition, enabling targeted summation, like summing up the time spent on high-priority issues.
- SUM_TOTAL: Provides the total sum across different categories, giving a holistic view of combined metrics.
- VARIANCE: Measures how far a set of numbers are spread out from their average value. This can be instrumental in risk assessment and quality control.
- PERCENTILE: Determines the value below which a given percentage of observations in a dataset fall, useful for understanding distribution in data, such as identifying the 90th percentile of issue resolution times.
- PERCENTILE_CONT: A continuous percentile calculation that interpolates between values, offering a more precise percentile measurement in datasets.
Each of these aggregators can be strategically employed to extract specific insights from software project data. By understanding and utilizing these tools, tech leaders and project managers can gain a deeper understanding of their project dynamics, enabling them to make data-driven decisions and optimize their project management strategies. These aggregators, ranging from basic counting to more complex statistical analyses, provide a comprehensive toolkit for dissecting project performance, identifying trends, and foreseeing potential issues. Whether it's measuring team productivity, assessing project timelines, or analyzing the quality of work, these aggregators serve as the backbone of effective project management in the Keypup platform.
Mastering Data Analysis with Keypup: A Comprehensive Guide to Utilizing Powerful Functions
Functions in Keypup serve as the building blocks for manipulating and interpreting data, allowing users to perform complex analyses and tailor their data to meet specific project requirements. Each function offers unique capabilities for transforming, comparing, or calculating data, enabling users to derive precise insights.
Here's a detailed overview of the functions available in Keypup and their applications:** **
- ARRAY_FIND: Searches for an element within an array. Useful for finding specific items in a list, such as a particular label or keyword in an issue.
- AT_INDEX: Retrieves the element at a specified index in an array. It can be used to pinpoint specific data points within a list.
- BEGINNING_OF_DAY: Sets the timestamp to the start of the day. This is helpful for aligning data entries to daily boundaries, essential in daily reporting.
- BEGINNING_OF_HOUR: Adjusts the timestamp to the beginning of an hour. Useful for hourly data aggregation and analysis.
- BEGINNING_OF_MONTH: Sets the date to the first day of the month. It’s ideal for monthly performance reviews or trend analysis.
- BEGINNING_OF_QUARTER: Resets the date to the start of a quarter. Key for quarterly assessments and planning.
- BEGINNING_OF_WEEK: Aligns the date to the beginning of a week. This function aids in weekly reporting and tracking.
- BEGINNING_OF_YEAR: Sets the date to the start of the year, crucial for annual evaluations and comparisons.
- BETWEEN: Checks if a value falls within a specified range. This can be used to filter data that meets certain criteria, such as issues or PRs created within a specific time frame.
- CONCAT: Combines multiple text fields into one. Ideal for creating comprehensive descriptions or titles.
- CONTAINS: Determines if a text field contains a specified substring. Useful for text searches within datasets.
- CONTAINS_ALL: Checks if a text field contains all specified substrings. This can be used to ensure that multiple conditions are met within a text field.
- CONTAINS_EXACTLY: Verifies if a text field exactly contains a specified substring, allowing for precise text matching.
- DATE: Extracts the date component from a timestamp. It’s used for isolating the date from datetime fields.
- DAY: Retrieves the day component from a date. Useful in daily trend analysis and reporting.
- DAY_OF_WEEK: Extracts the day of the week from a date. This can aid in understanding weekly patterns or trends.
- DAY_OF_YEAR: Gets the day of the year from a date. Useful for year-long trend analysis and comparisons.
- END_OF_DAY: Sets the timestamp to the end of the day, aiding in daily data aggregation and cutoffs.
- END_OF_HOUR: Adjusts the timestamp to the end of an hour, useful for hourly data analysis.
- END_OF_MONTH: Sets the date to the last day of the month, important for monthly closing and reporting.
- END_OF_QUARTER: Changes the date to the end of a quarter, aiding in quarterly reviews and analyses.
- END_OF_WEEK: Aligns the date to the end of the week, crucial for weekly summaries and reporting.
- END_OF_YEAR: Sets the date to the end of the year, key for annual reporting and assessment.
- EXP: Calculates the exponential of a given number, useful in certain mathematical and statistical analyses.
- FLATTEN: Converts a nested array structure into a single level array. This is particularly useful for simplifying complex data structures for easier analysis.
- GREATEST: Identifies the largest value among the given arguments. Ideal for comparing and finding the highest values in datasets, such as the highest number of comments on an issue.
- HOUR: Extracts the hour component from a timestamp. Useful for time-based data analysis, especially in understanding hourly work patterns.
- IF: Applies conditional logic, executing different actions based on specified conditions. This function is key in creating dynamic datasets based on conditional criteria.
- IF_NULL: Checks if a field is null and allows for a default value if true. It helps in maintaining data integrity by providing fallback values.
- IF_MATCH: Applies a condition and provides an output if the condition is met. This is critical for filtering data based on specific criteria.
- IF_ZERO: Checks if a number is zero and allows for an alternative value to be used. It’s useful in avoiding division by zero errors or in data normalization.
- IN: Checks if a value exists within a given set or array. This is used for inclusion checks, like verifying if an issue label is within a set of predefined labels.
- IS_NULL: Determines if a field is null. Essential for data quality checks and handling missing values.
- IS_NOT_NULL: Checks if a field is not null, confirming the presence of data.
- LEAST: Finds the smallest value among the given arguments. Useful in identifying the lowest values in datasets, like the least time taken for issue resolution.
- LEFT: Extracts a specified number of characters from the left side of a text field. This can be used for creating standardized text formats or extracting specific data from strings.
- LENGTH: Determines the length of a text field. This function is helpful in text analysis, such as measuring the length of comments or descriptions.
- LN: Calculates the natural logarithm of a number, useful in certain mathematical calculations and complex data analysis scenarios.
- LOG: Computes the logarithm of a number to a specified base, another tool for detailed mathematical analyses.
- MATCH: Checks if a text field matches a specified pattern, often used in data validation and filtering.
- MOD: Calculates the remainder of a division operation, useful for creating intervals or cycles in data analysis.
- MONTH: Retrieves the month component from a date, essential for monthly data segmentation and analysis.
- NOT: Reverses the truth value of a condition. This is crucial for creating inverse conditions, such as filtering out certain data points.
- NOT_CONTAINS: Checks if a text field does not contain a specified substring, useful for excluding certain data based on text content.
- NOT_MATCH: Determines if a text field does not match a specified pattern, aiding in filtering out data that does not meet certain criteria.
- NOW: Returns the current date and time, essential for timestamping and real-time data operations.
- POWER: Raises a number to the power of another number, a key function for exponential calculations in data analysis.
- RIGHT: Extracts a specified number of characters from the right side of a text field, useful for text manipulation and standardization.
- ROUND: Rounds a number to the nearest integer or specified decimal place. This function is key in standardizing numerical data for readability and consistency.
- ROUNDDOWN: Always rounds a number down to the nearest integer, crucial for conservative estimates in calculations.
- ROUNDUP: Rounds a number up to the nearest integer, used for liberal estimates in data analysis.
- TO_FLOAT: Converts a value to a floating-point number, essential for ensuring numerical data is in the correct format for calculations.
- TO_INT: Transforms a value into an integer, useful for data types that require whole numbers.
- TO_STR: Converts a value to a string, key in scenarios where numerical data needs to be presented as text.
- WEEK: Extracts the week number from a date, aiding in weekly data tracking and analysis.
- YEAR: Retrieves the year component from a date, crucial for annual data segmentation and review.
- YEAR_MONTH: Provides a combined year and month value from a date, useful for detailed time-based data analysis and reporting.
- YEAR_MONTH_DAY: Combines year, month, and day into a single value, offering a precise date format for data operations.
- YEAR_WEEK: Generates a year and week number from a date, aiding in data organization and analysis on a weekly basis throughout the year.
Each of these functions offers a unique way to manipulate and interpret data within the Keypup platform. By skillfully applying these functions, project managers and technology leaders can tailor their data analysis to meet specific project objectives, leading to more informed decision-making and effective project management.
Harnessing Keypup's Datasets for Comprehensive Management and Analytical Insights
In the Keypup platform, datasets form the backbone of project analytics and management. They are comprehensive collections of data points, meticulously organized to provide detailed insights into various aspects of project management. Each dataset in Keypup is tailored to address specific areas of project tracking and management, offering a wealth of information to tech leaders and project managers. By understanding and utilizing these datasets effectively, one can enhance project oversight, improve decision-making, and streamline workflows.
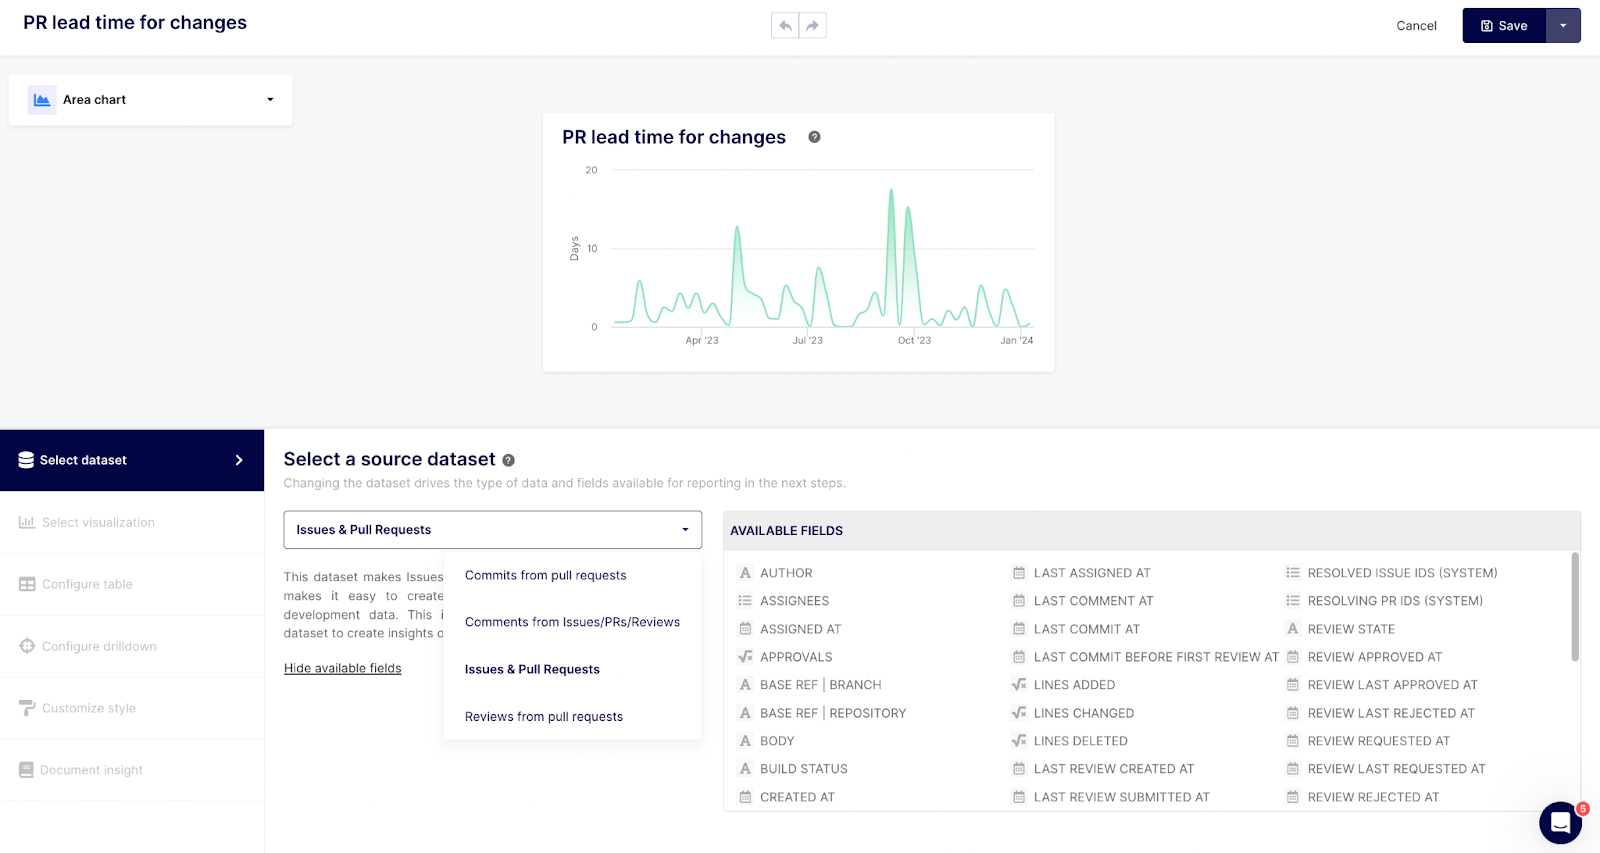
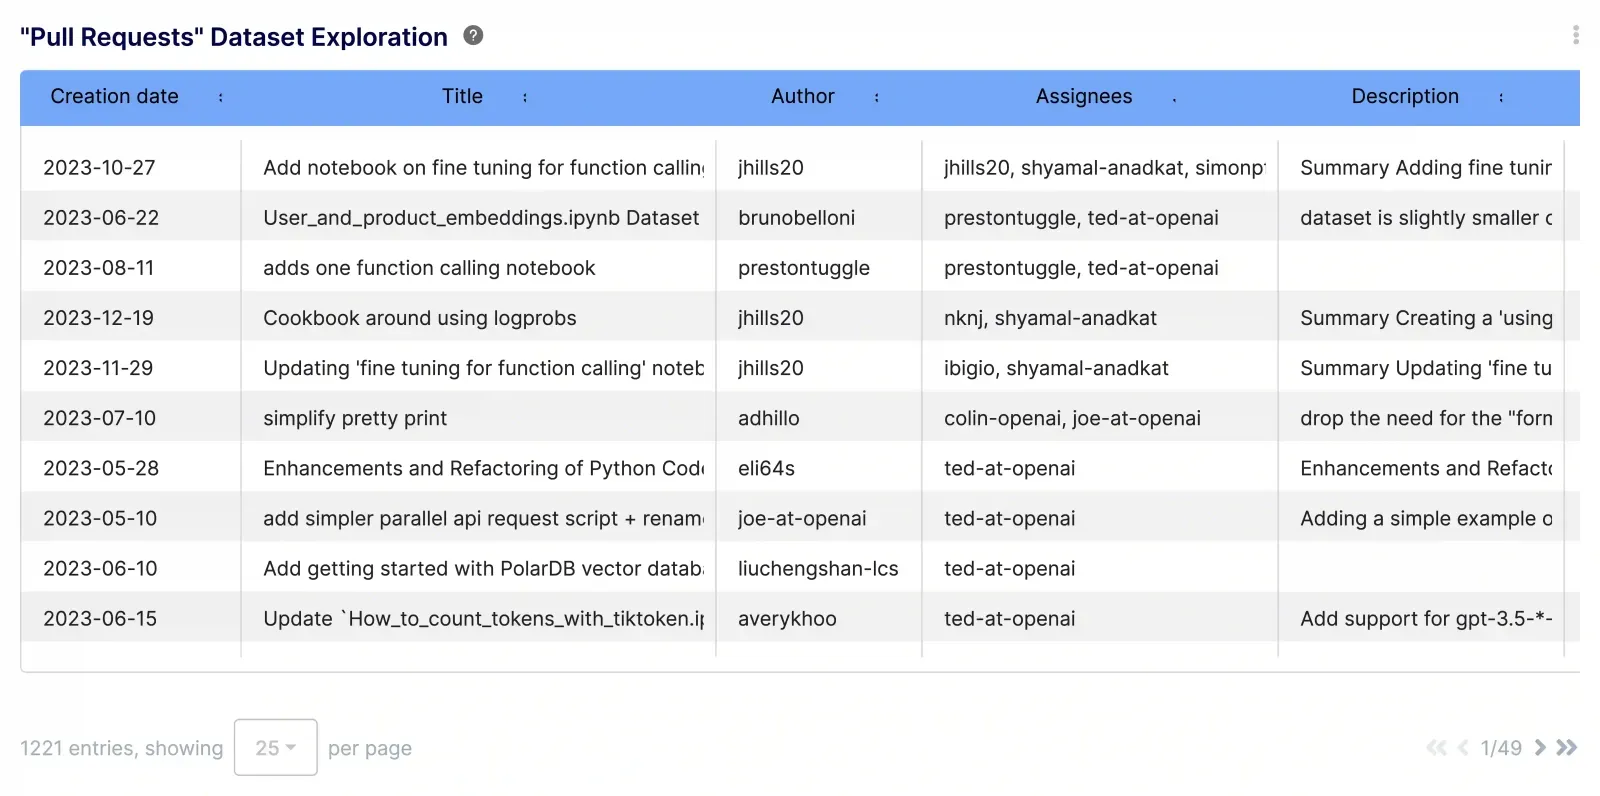
Issues & PRs Dataset
- Overview: This dataset offers a rich collection of data related to issues and PRs, including details like approvals, assignees, creation and closure times, comments, commits, approval statuses, and more.
- Usage: It's invaluable for tracking the life cycle of issues and PRs, from creation to resolution. Project managers can use this dataset to monitor project progress, identify bottlenecks, and assess team performance.
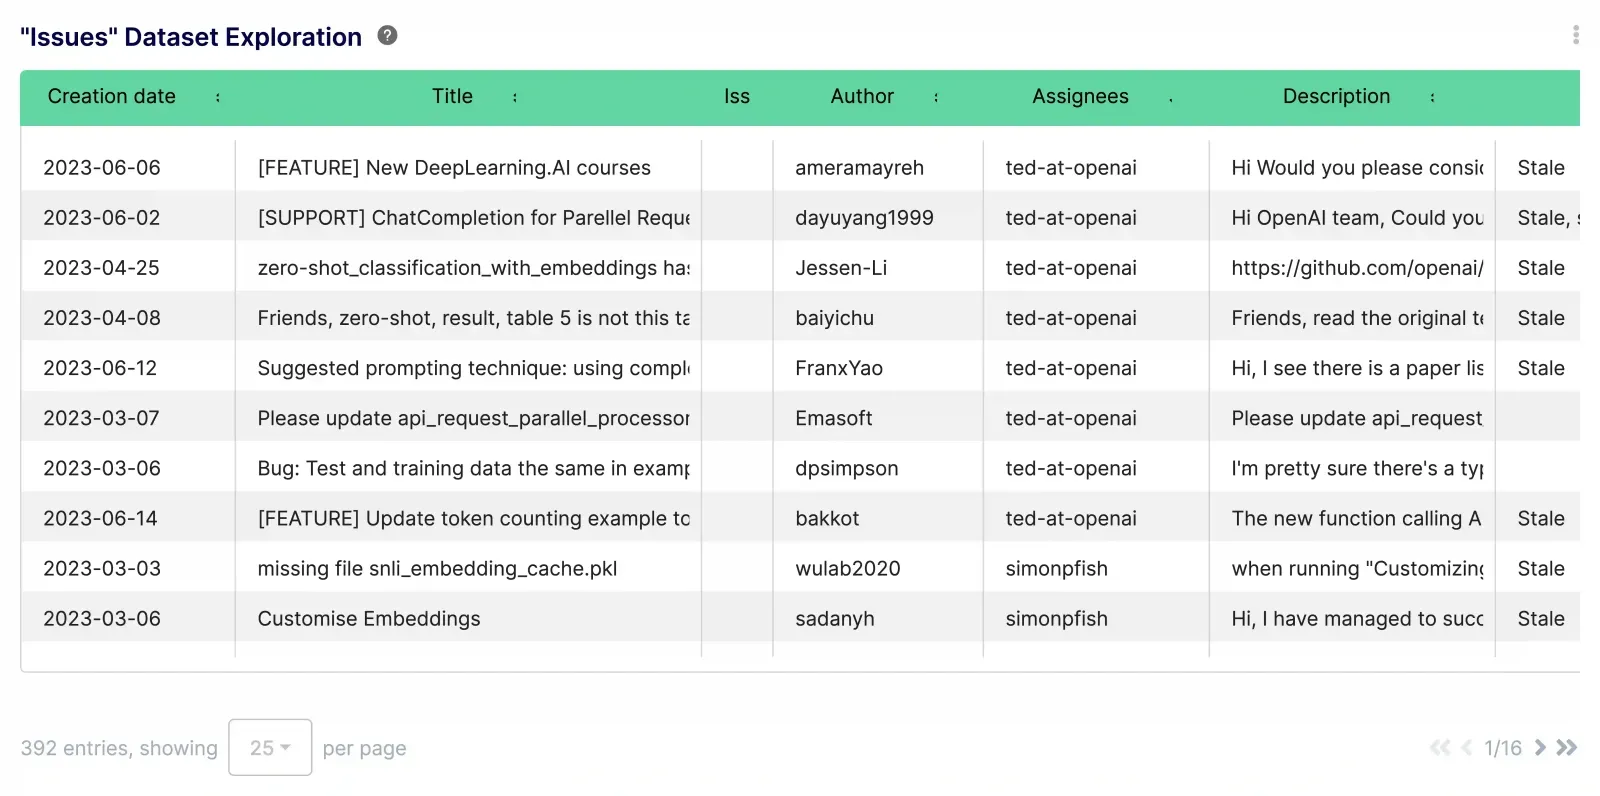
Discover the Issue Dataset Report
Explore the PRs Dataset Report
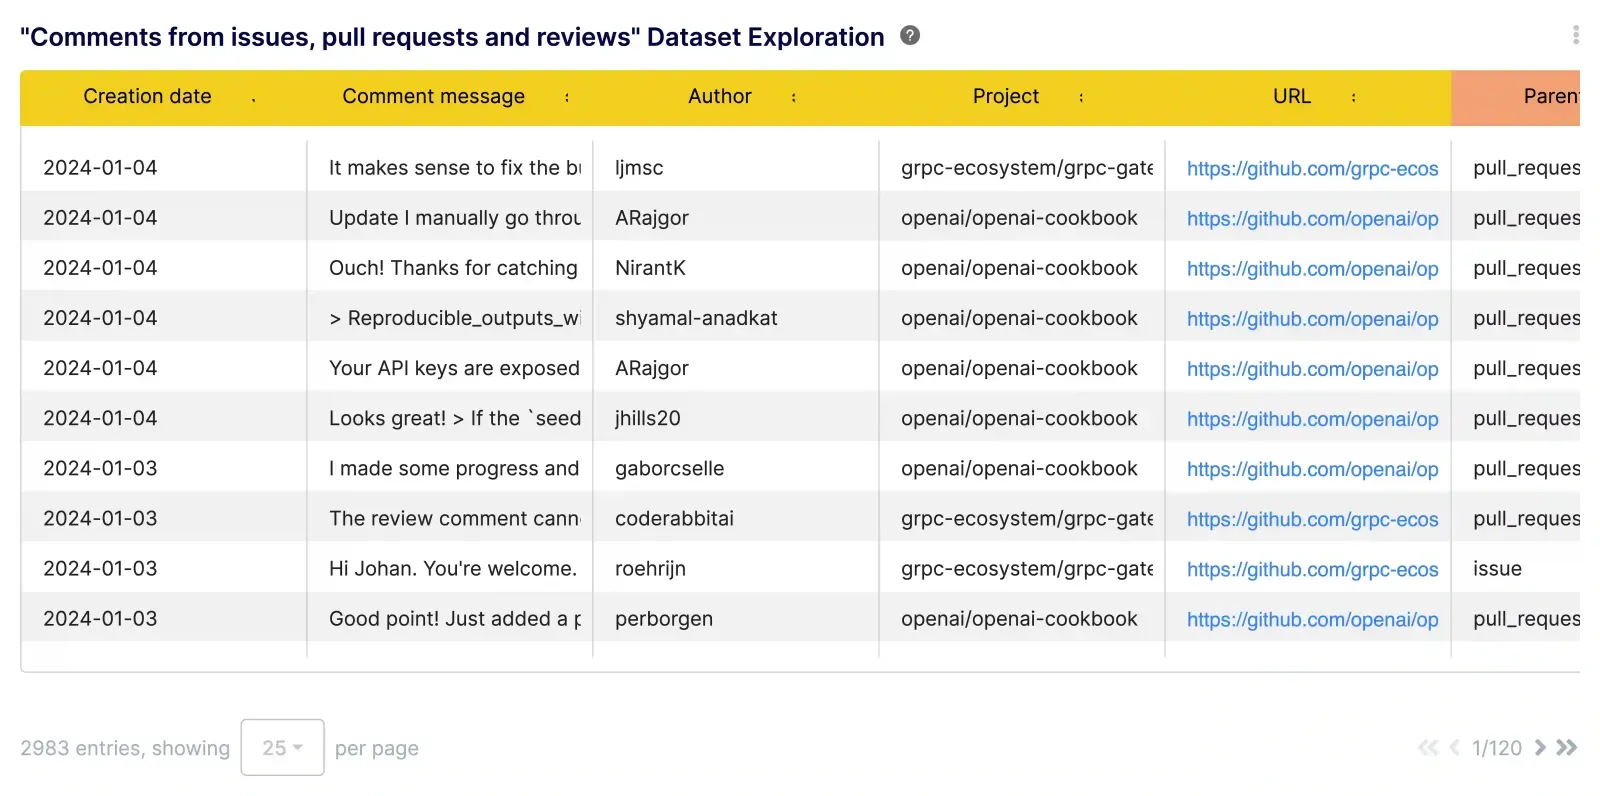
- Overview: This dataset captures information related to comments across projects, including author, content, timestamps, and associated URLs.
- Usage: This dataset is pivotal in tracking communication and collaboration within teams. Analyzing this data can reveal patterns in team interactions, highlight areas requiring attention, and help maintain project engagement and responsiveness.
Explore the Comments Dataset
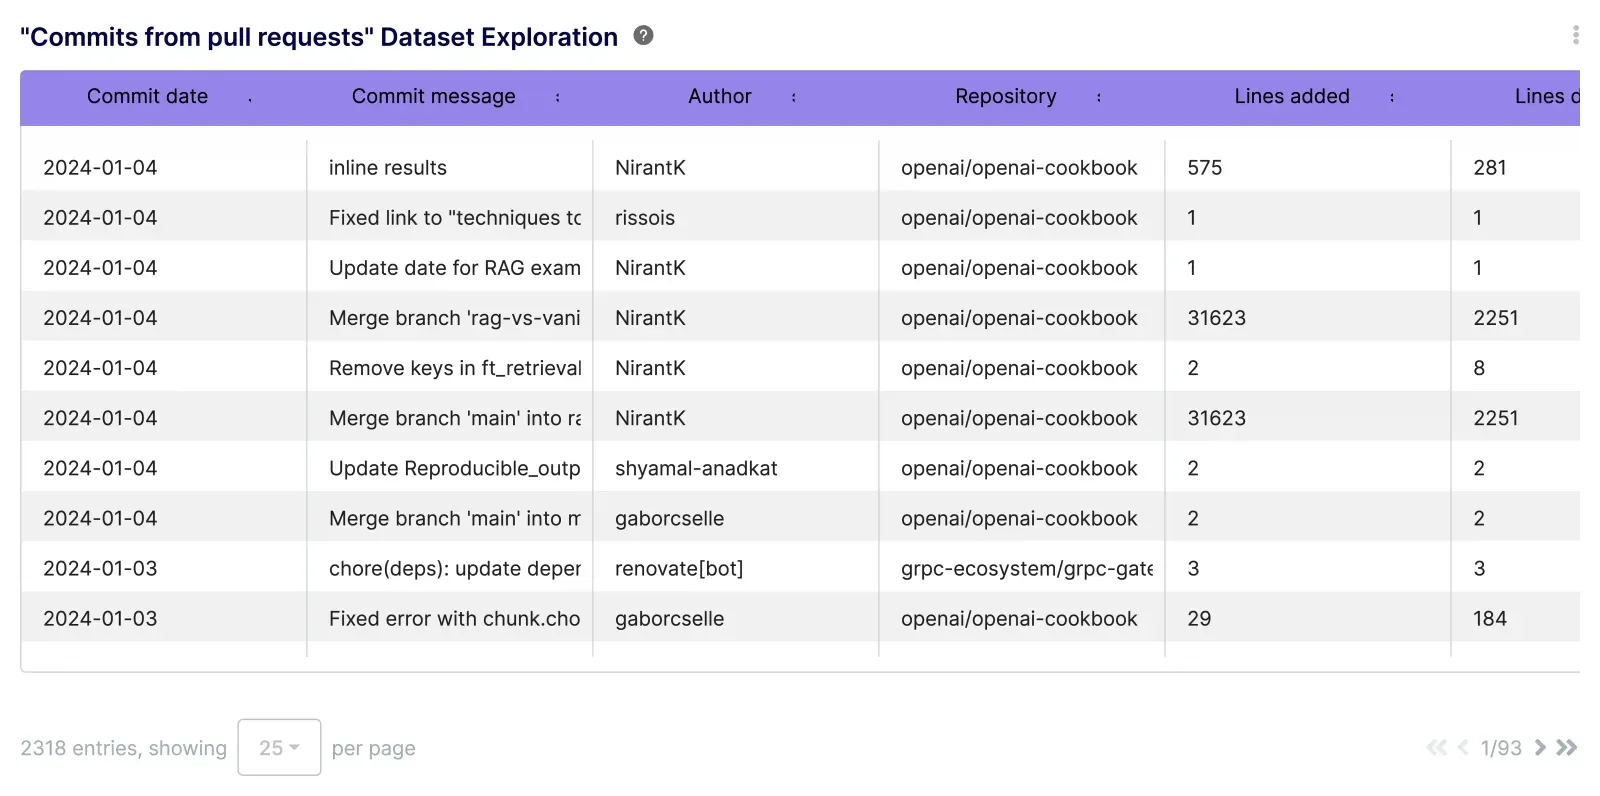
Commits from PRs Dataset
- Overview: This dataset focuses on commits associated with PRs, detailing authorship, commit messages, the number of lines added or deleted, and other relevant data.
- Usage: It's crucial for understanding the code changes involved in PRs. By analyzing this data, tech leaders can gauge development progress, code quality, and the impact of specific changes on the project.
Check Out the Commits Dataset
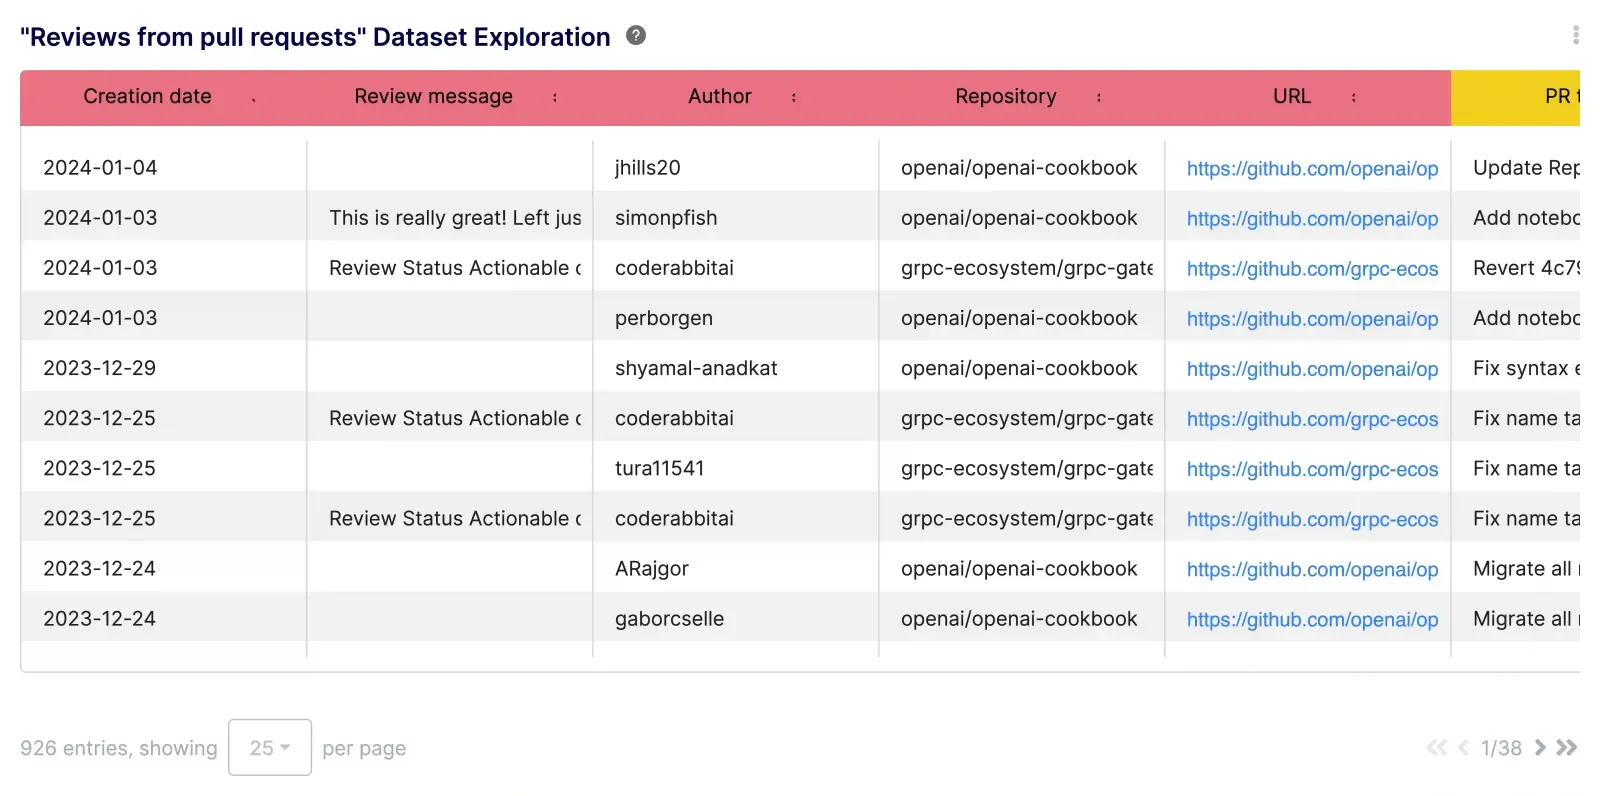
Reviews from PRs Dataset
- Overview: This dataset includes data on reviews associated with PRs, encompassing aspects like author, review comment, state of the review, creation times and submission times (for GitHub).
- Usage: This dataset plays a significant role in quality assurance and code review processes. Analyzing reviews can help to maintain coding standards, ensure code quality, and foster effective peer review practices.
Discover the Reviews Dataset Report
Each of these datasets provides a different lens through which to view and manage the project. By leveraging these datasets, tech leaders can gain a holistic understanding of their projects, from the micro-level details of code commits to the macro-level overview of project progress and team interactions. This comprehensive approach enables efficient and data-driven project management, ensuring that projects are completed on time, within scope, and to the desired quality standards.
Enhancing Project Mastery with Keypup: Integrating Aggregators, Functions, and Datasets for Strategic Insights
The real power of Keypup's platform lies in the synergistic use of its metrics aggregators, functions, and datasets. By combining these tools, tech leaders and project managers can derive nuanced insights, optimize workflows, and enhance project oversight. Let's explore some practical scenarios where these elements come together to facilitate effective project management and data analysis:
Software Project Progress Tracking
- Scenario: A project manager wants to track the progress of a current sprint.
- Application: Utilizing the “Issues & PRs Dataset,” they can apply the COUNT function on the 'State' field to tally the number of open and closed issues. By using the BETWEEN function on the 'due_on' field, they can focus on issues relevant to the sprint's timeframe (Jira specific). The SUM function on the 'Time spent' field (GitLab, Jira, and ClickUp) can provide insights into the effort invested. Labels can also be used to target specific sprints.
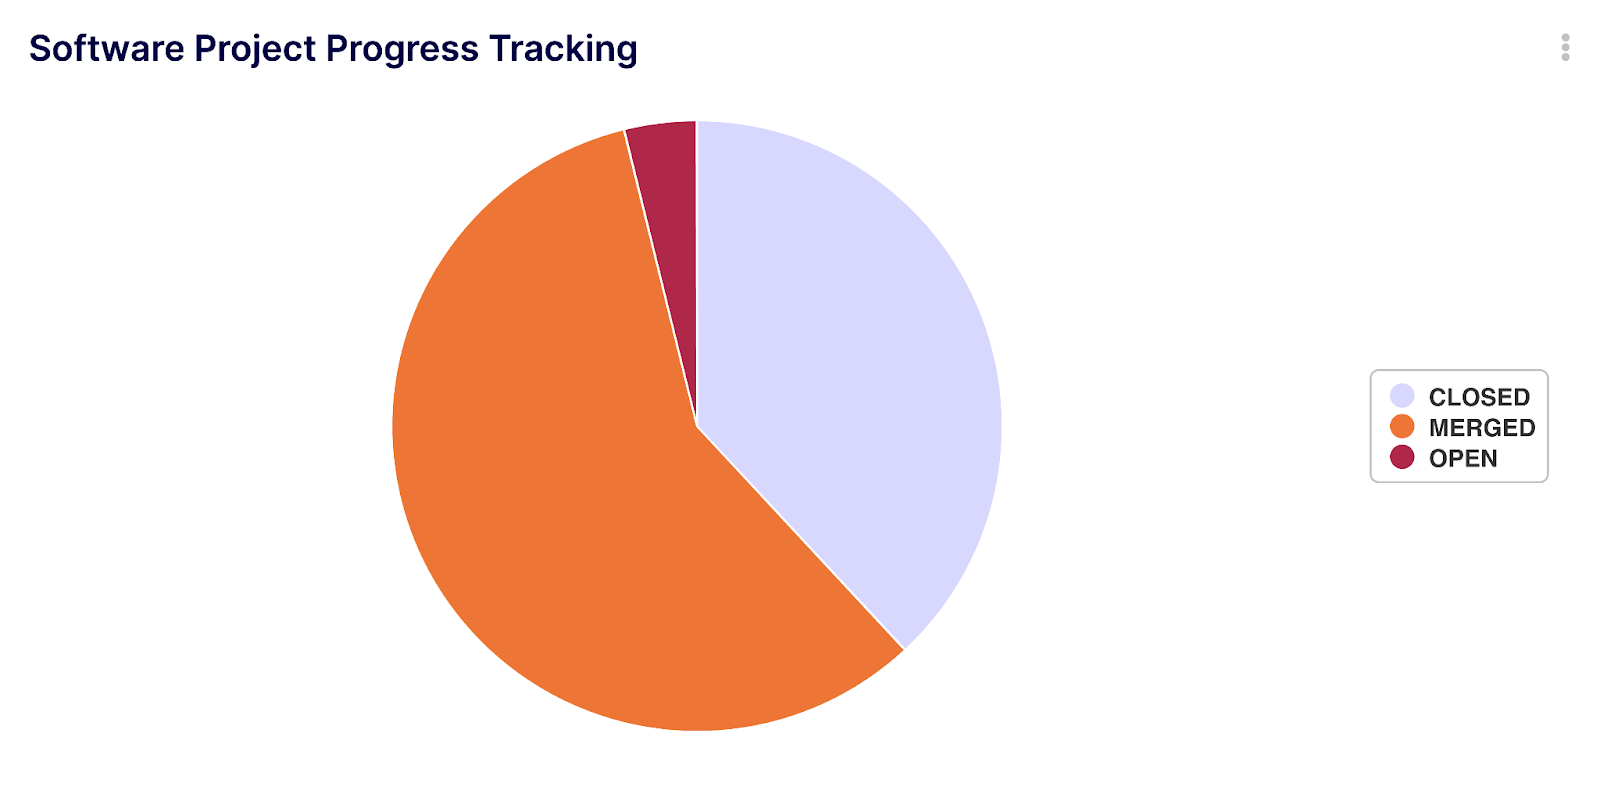
Try Software Project Progress Tracking (note: you need to create an account first to add this insight to your environment).
Resource Allocation Analysis
- Scenario: A team leader needs to analyze team workload for balanced resource allocation.
- Application: The COUNT function can be used on the 'Assignees' field in the “Issues & PRs Dataset” to determine the number of tasks assigned to each team member. By applying AVG on the 'Time estimate' field, the average time expected per task can be calculated, aiding in equitable distribution of upcoming tasks.
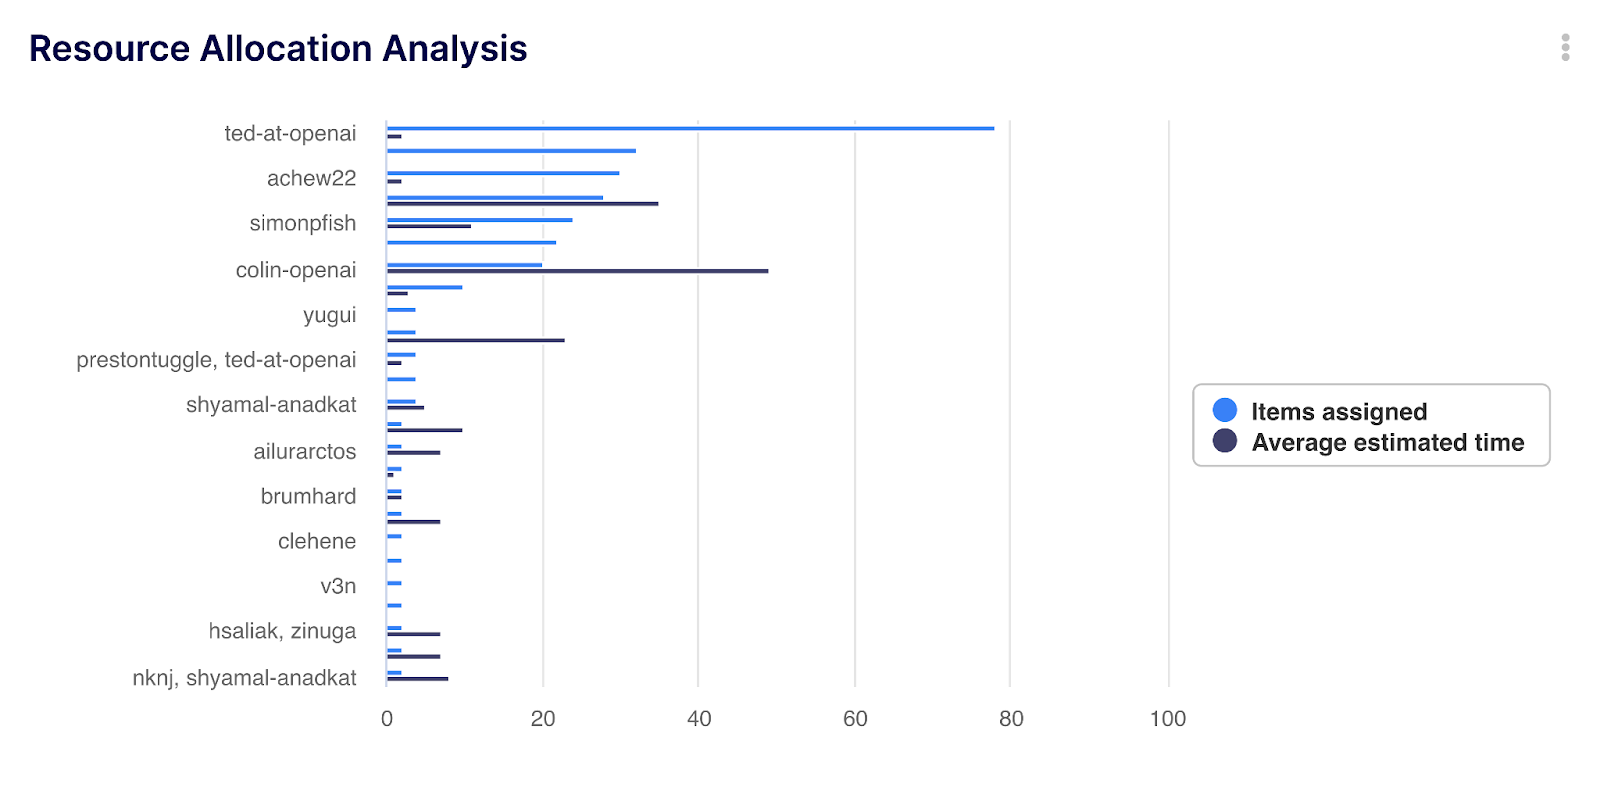
Try Issue Resource Allocation Analysis (note: you need to create an account first to add this insight to your environment).
Code Review Efficiency
- Scenario: A CTO wants to assess the efficiency of the code review process.
- Application: The “Reviews from PRs Dataset” can be utilized with the AVG aggregator on the 'Submitted at' and 'Created at' fields (Git specific) to calculate the average time taken for reviews. The COUNT_DISTINCT function on 'Author' can indicate the diversity of review participation.
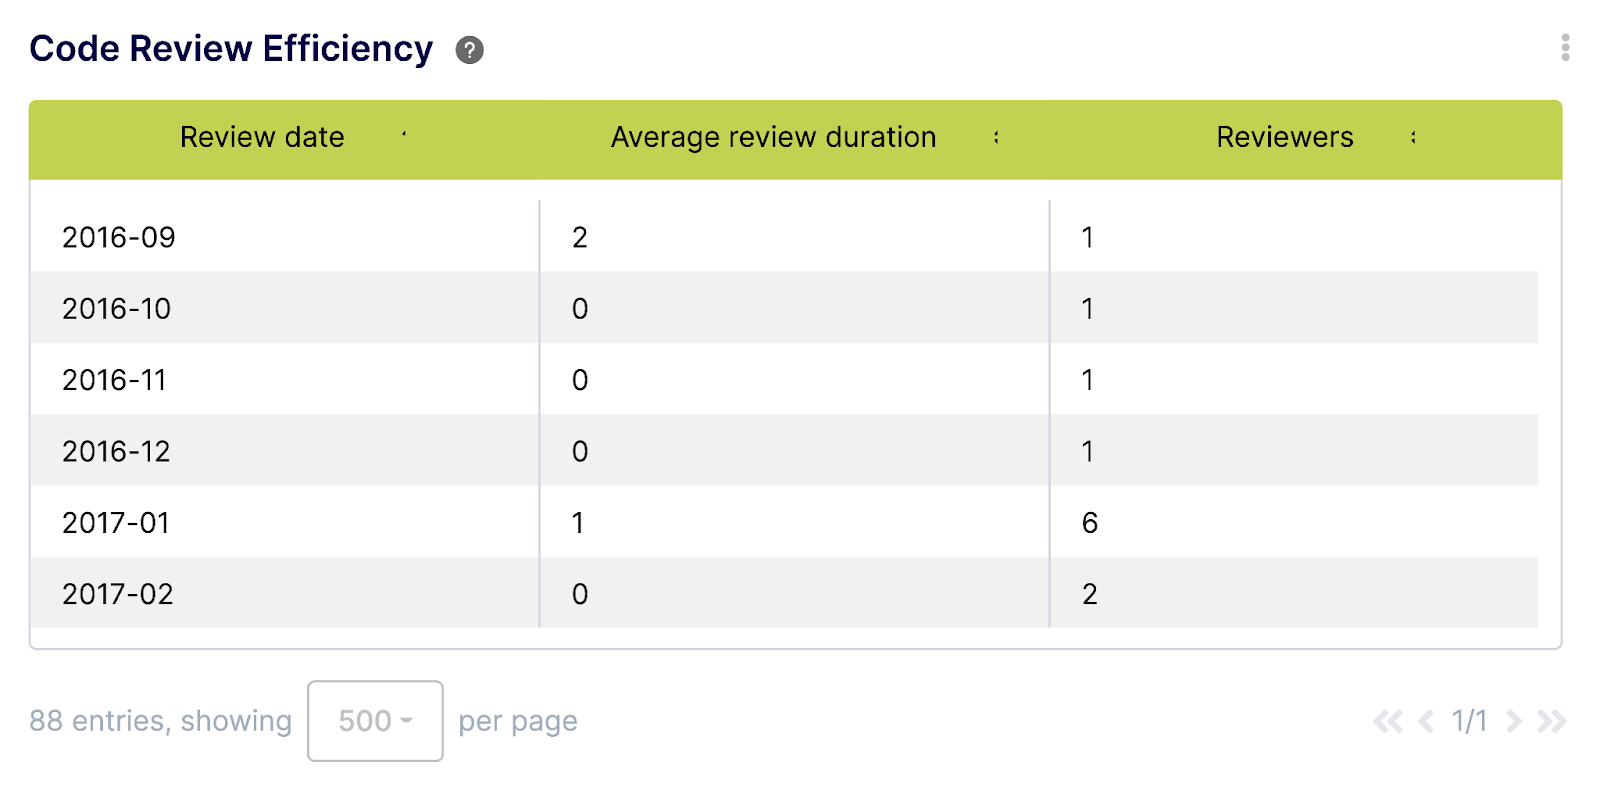
Try Code Review Efficiency (note: you need to create an account first to add this insight to your environment).
Communication Analysis
- Scenario: Understanding team collaboration patterns in project discussions.
- Application: By employing the “Comments Dataset,” the COUNT_DISTINCT function on ‘Parent Author' field, segmented by the ‘Comments Author’ field, can reveal who interacted with whom by showing collaboration patterns between project members.
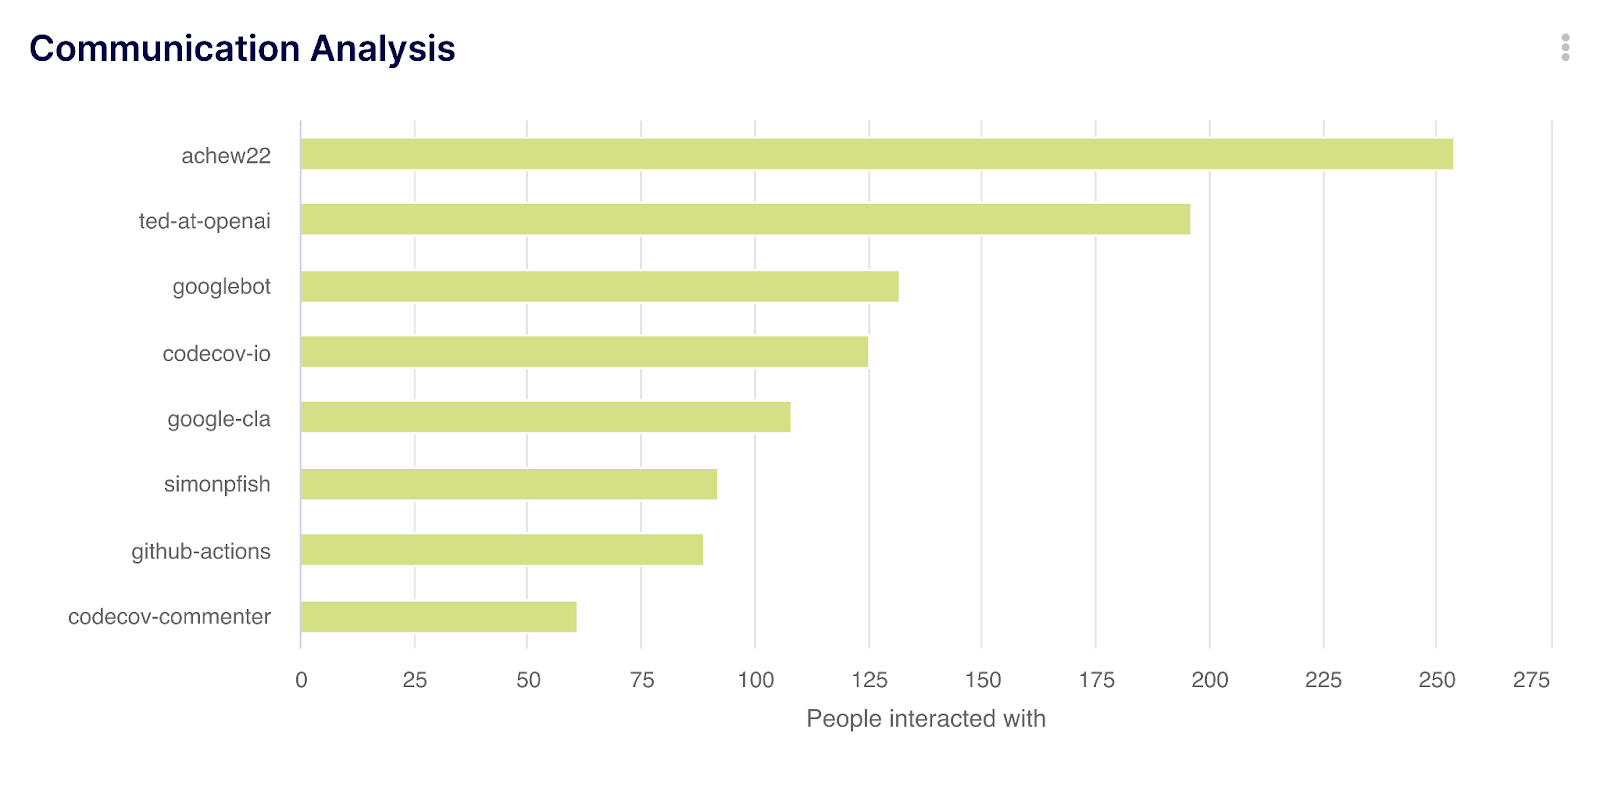
Try Communication Analysis (note: you need to create an account first to add this insight to your environment).
Code Contribution Overview
- Scenario: Evaluating individual contributions to the codebase.
- Application: In the “Commits from PRs Dataset,” the COUNT function can be applied to the 'Author' field to count commits per developer. The SUM function on 'Lines changed' provides a quantitative measure of each developer's contributions.
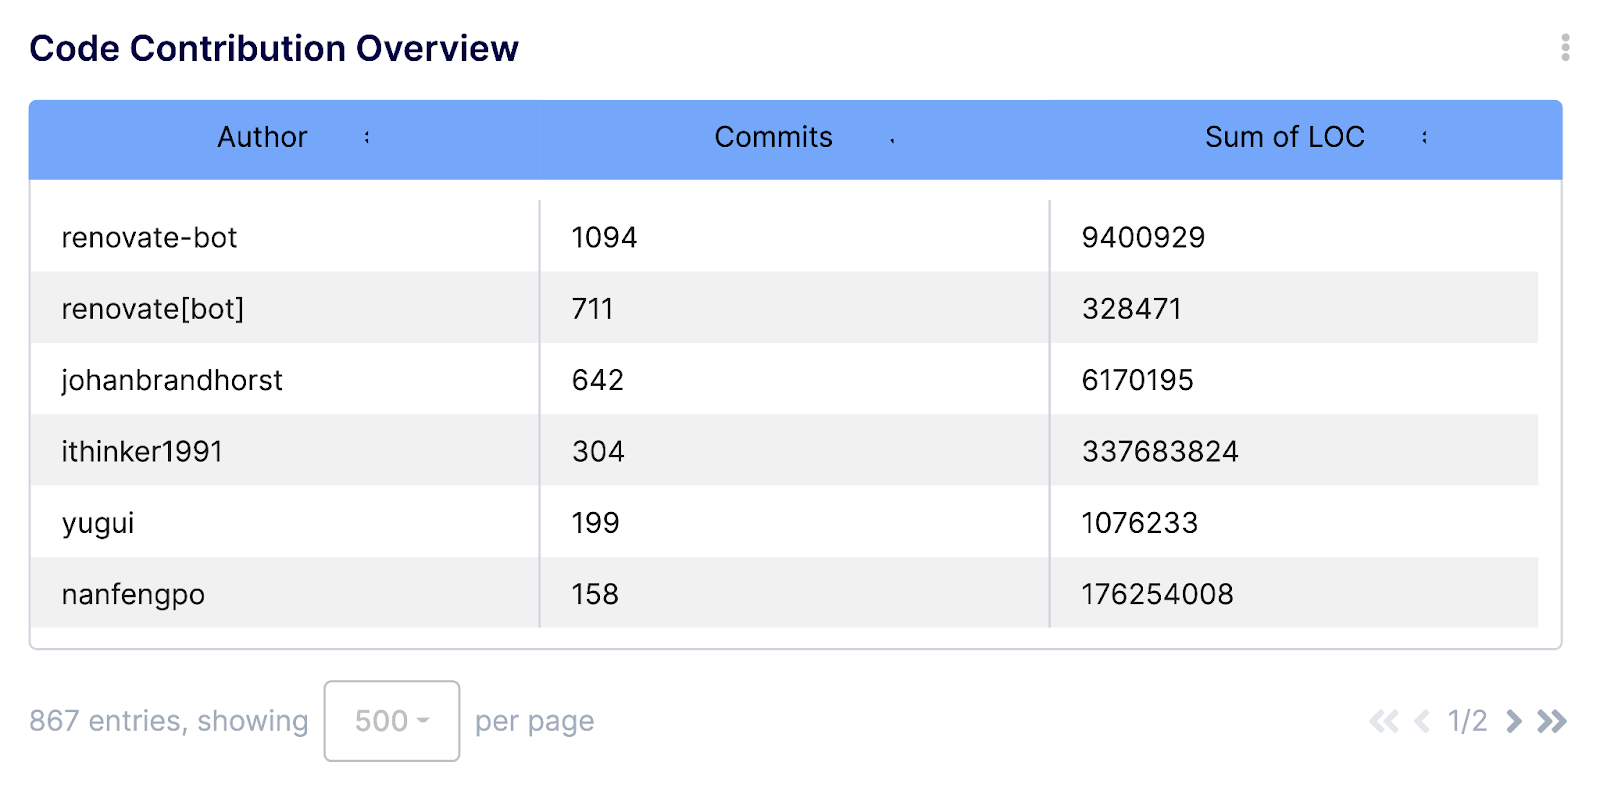
Try Code Contribution Overview (note: you need to create an account first to add this insight to your environment).
Issue Resolution Time Analysis
- Scenario: Analyzing the time taken to resolve issues.
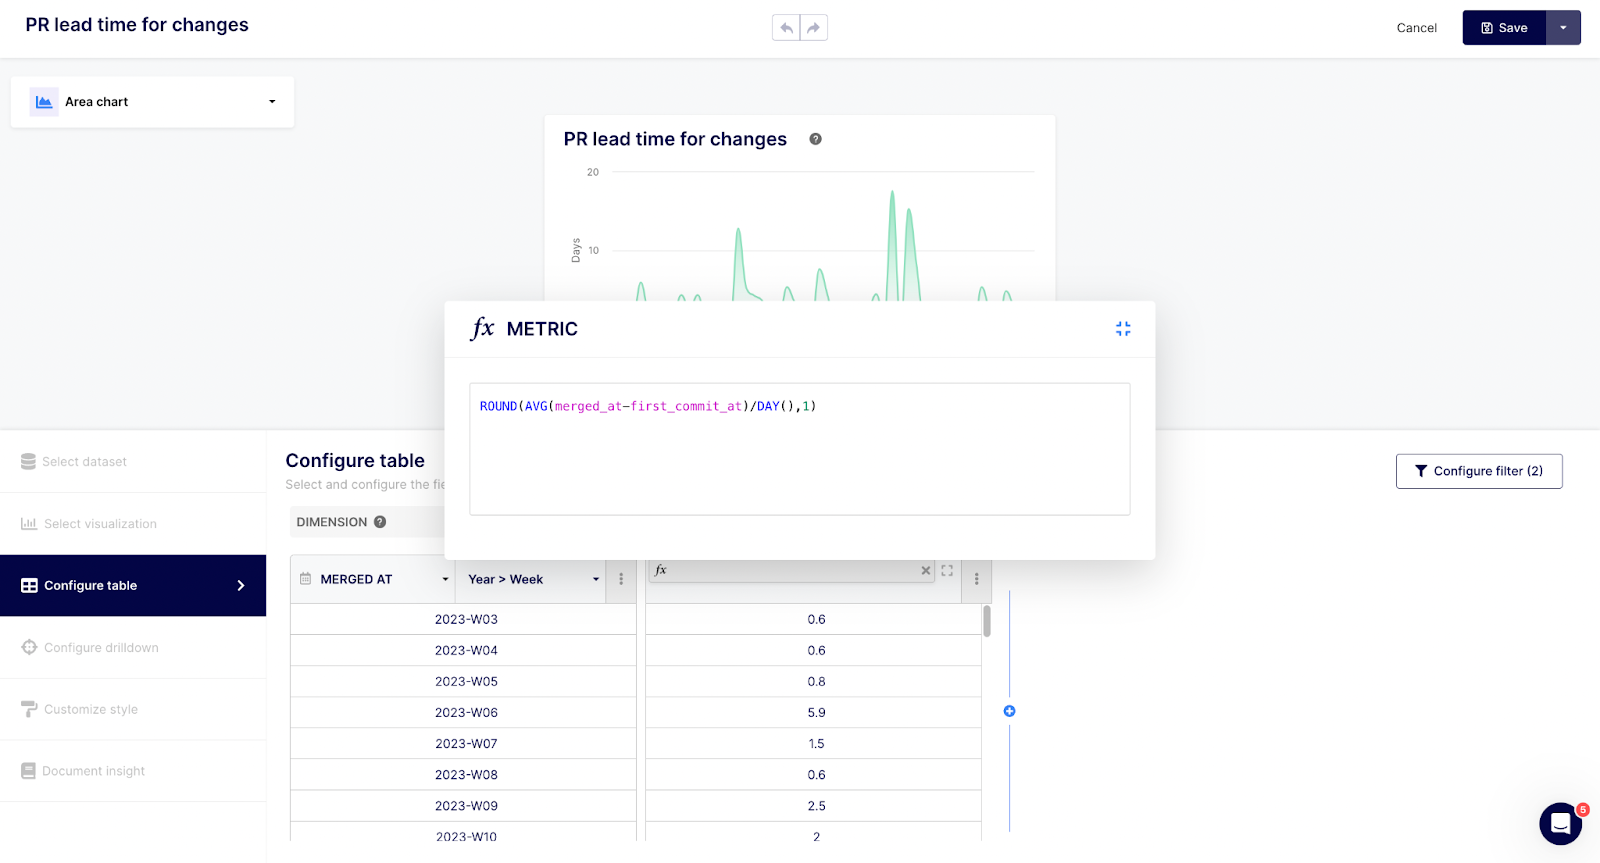
- Application: Using the “Issues & PRs Dataset,” the AVG function on the difference between 'Closed at' and 'Created at' (using the HOUR() function to convert seconds into hours) gives the average resolution time. The MEDIAN and PERCENTILE functions can be applied to this calculation to remove outliers and handle skewed distributions.
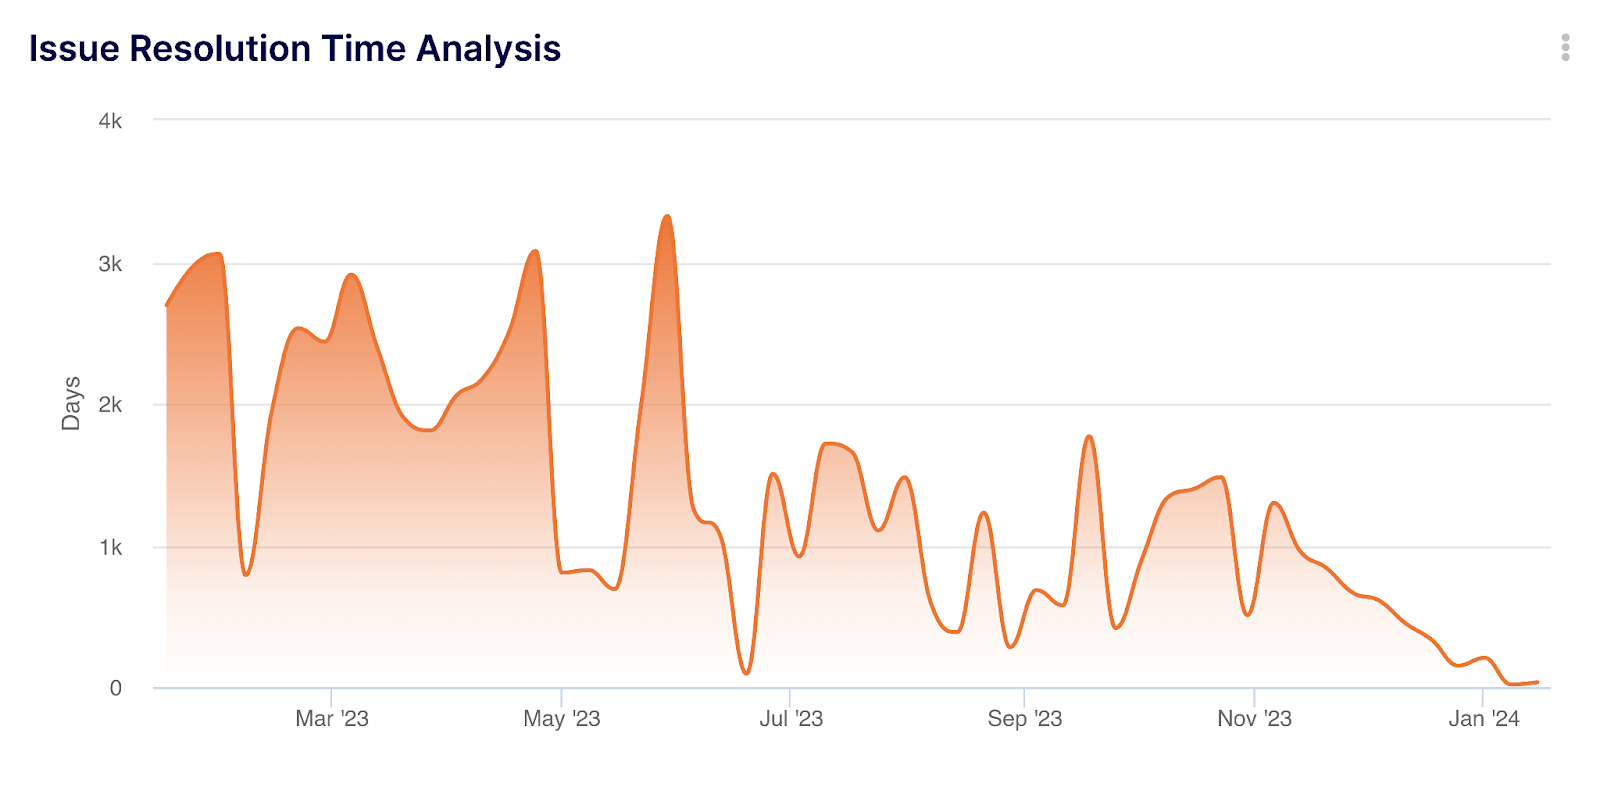
Try Issue Resolution Time Analysis (note: you need to create an account first to add this insight to your environment).
These examples demonstrate how Keypup's tools can be strategically employed to extract actionable insights. Whether it’s for tracking project progress, analyzing team dynamics, or assessing code quality, the combination of aggregators, functions, and datasets provides a comprehensive toolkit for effective project management and advanced data analysis. This approach not only enhances the understanding of current project states but also aids in predicting future trends and potential challenges, enabling proactive management and decision-making.
Unlocking Software Development Analytics Mastery
Throughout this article, we have explored the depth and versatility of Keypup's platform, showcasing how its metrics aggregators, functions, and datasets coalesce to form a powerful toolkit for project management and data analysis.
We began by delving into the metrics aggregators, which serve as the fundamental tools for data synthesis and interpretation, transforming raw data into actionable insights. From basic counting to advanced statistical analyses, these aggregators offer a lens through which project health and team performance can be gauged with precision.
Following this, we examined the functions dictionary in Keypup. These functions allow for intricate manipulation of data, enabling users to tailor their analysis to specific project needs. From simple data transformation to complex conditional logic, these functions are instrumental in refining data for more insightful interpretations.
We also navigated through the various datasets offered by Keypup. Each dataset provides a unique perspective on different aspects of project management, whether it's tracking the life cycle of issues and PRs, analyzing code changes, understanding team communications, or reviewing code quality.
The practical applications section brought these elements to life, demonstrating through concrete examples how aggregators, functions, and datasets can be combined for effective project management and data analysis. These scenarios highlighted Keypup’s ability to provide nuanced insights into project progress, resource allocation, communication patterns, code contributions, and issue resolution efficiency.
In conclusion, Keypup emerges as a robust and indispensable tool for tech leaders and project managers. Its capabilities in data aggregation, manipulation, and analysis offer a comprehensive solution for managing complex projects in the fast-paced tech environment. By leveraging Keypup's functionalities, tech leaders can streamline their workflow, enhance data management, and drive their projects toward successful outcomes with greater efficiency and accuracy. This platform is not just about managing data; it's about empowering decision-makers with the right information at the right time, fostering a culture of data-driven decision-making and strategic software project management.

What is Keypup?
Keypup is an innovative software development analytics tool designed to integrate data aggregation and analysis. It aims to streamline the complexities of software development and enhance team coordination.
How does Keypup help tech leaders and development teams?
Keypup offers metrics aggregators, functions, and diverse datasets, optimizing workflow, enhancing decision-making, and providing insightful metrics tailored to the unique needs of tech leaders and development teams.
What are metrics aggregators in Keypup?
Metrics aggregators in Keypup are tools for consolidating and interpreting diverse data points, transforming raw data into actionable insights tailored to specific software project management needs.
Can you give examples of metrics aggregators available in Keypup?
Examples include AVG (Average), COUNT, COUNT_CUMULATIVE, MIN (Minimum), MAX (Maximum), STDDEV (Standard Deviation), and SUM. Each serves a specific purpose in data analysis and software project management.
What role do functions play in Keypup?
Functions in Keypup are building blocks for data manipulation and interpretation, allowing complex analyses and data tailoring to meet specific software project requirements.
Can you describe some of the functions available in Keypup?
Functions include ARRAY_FIND, BEGINNING_OF_DAY, BETWEEN, CONCAT, IF, ROUND, TO_FLOAT, and YEAR_MONTH_DAY, each offering unique capabilities for transforming, comparing, or calculating data.
What are datasets in Keypup, and why are they important?
Datasets in Keypup are collections of data points organized to provide detailed insights into various aspects of software project management, like issues and PRs, comments, commits from PRs, and reviews from PRs.
How can Keypup's tools be utilized in practical software project management scenarios?
They can be used for tracking project progress, analyzing team workload, assessing code review efficiency, understanding team communication patterns, evaluating code contributions, and analyzing issue resolution times.
What benefits do tech leaders gain by using Keypup?
Tech leaders gain a deeper understanding of project dynamics, streamlined workflow, and enhanced data-driven decision-making abilities.
How does Keypup enhance software project management?
By providing tools for advanced data aggregation, manipulation, and analysis, Keypup enables nuanced insights, optimized workflows, and proactive management, leading to more efficient and successful software project outcomes.