What Is the Lines of Code Metric?
Lines of Code refers to the total number of lines written in the source code of a software program. This metric has been a long-standing cornerstone in software engineering, often used as a rudimentary gauge for software size, complexity, and even developer productivity.
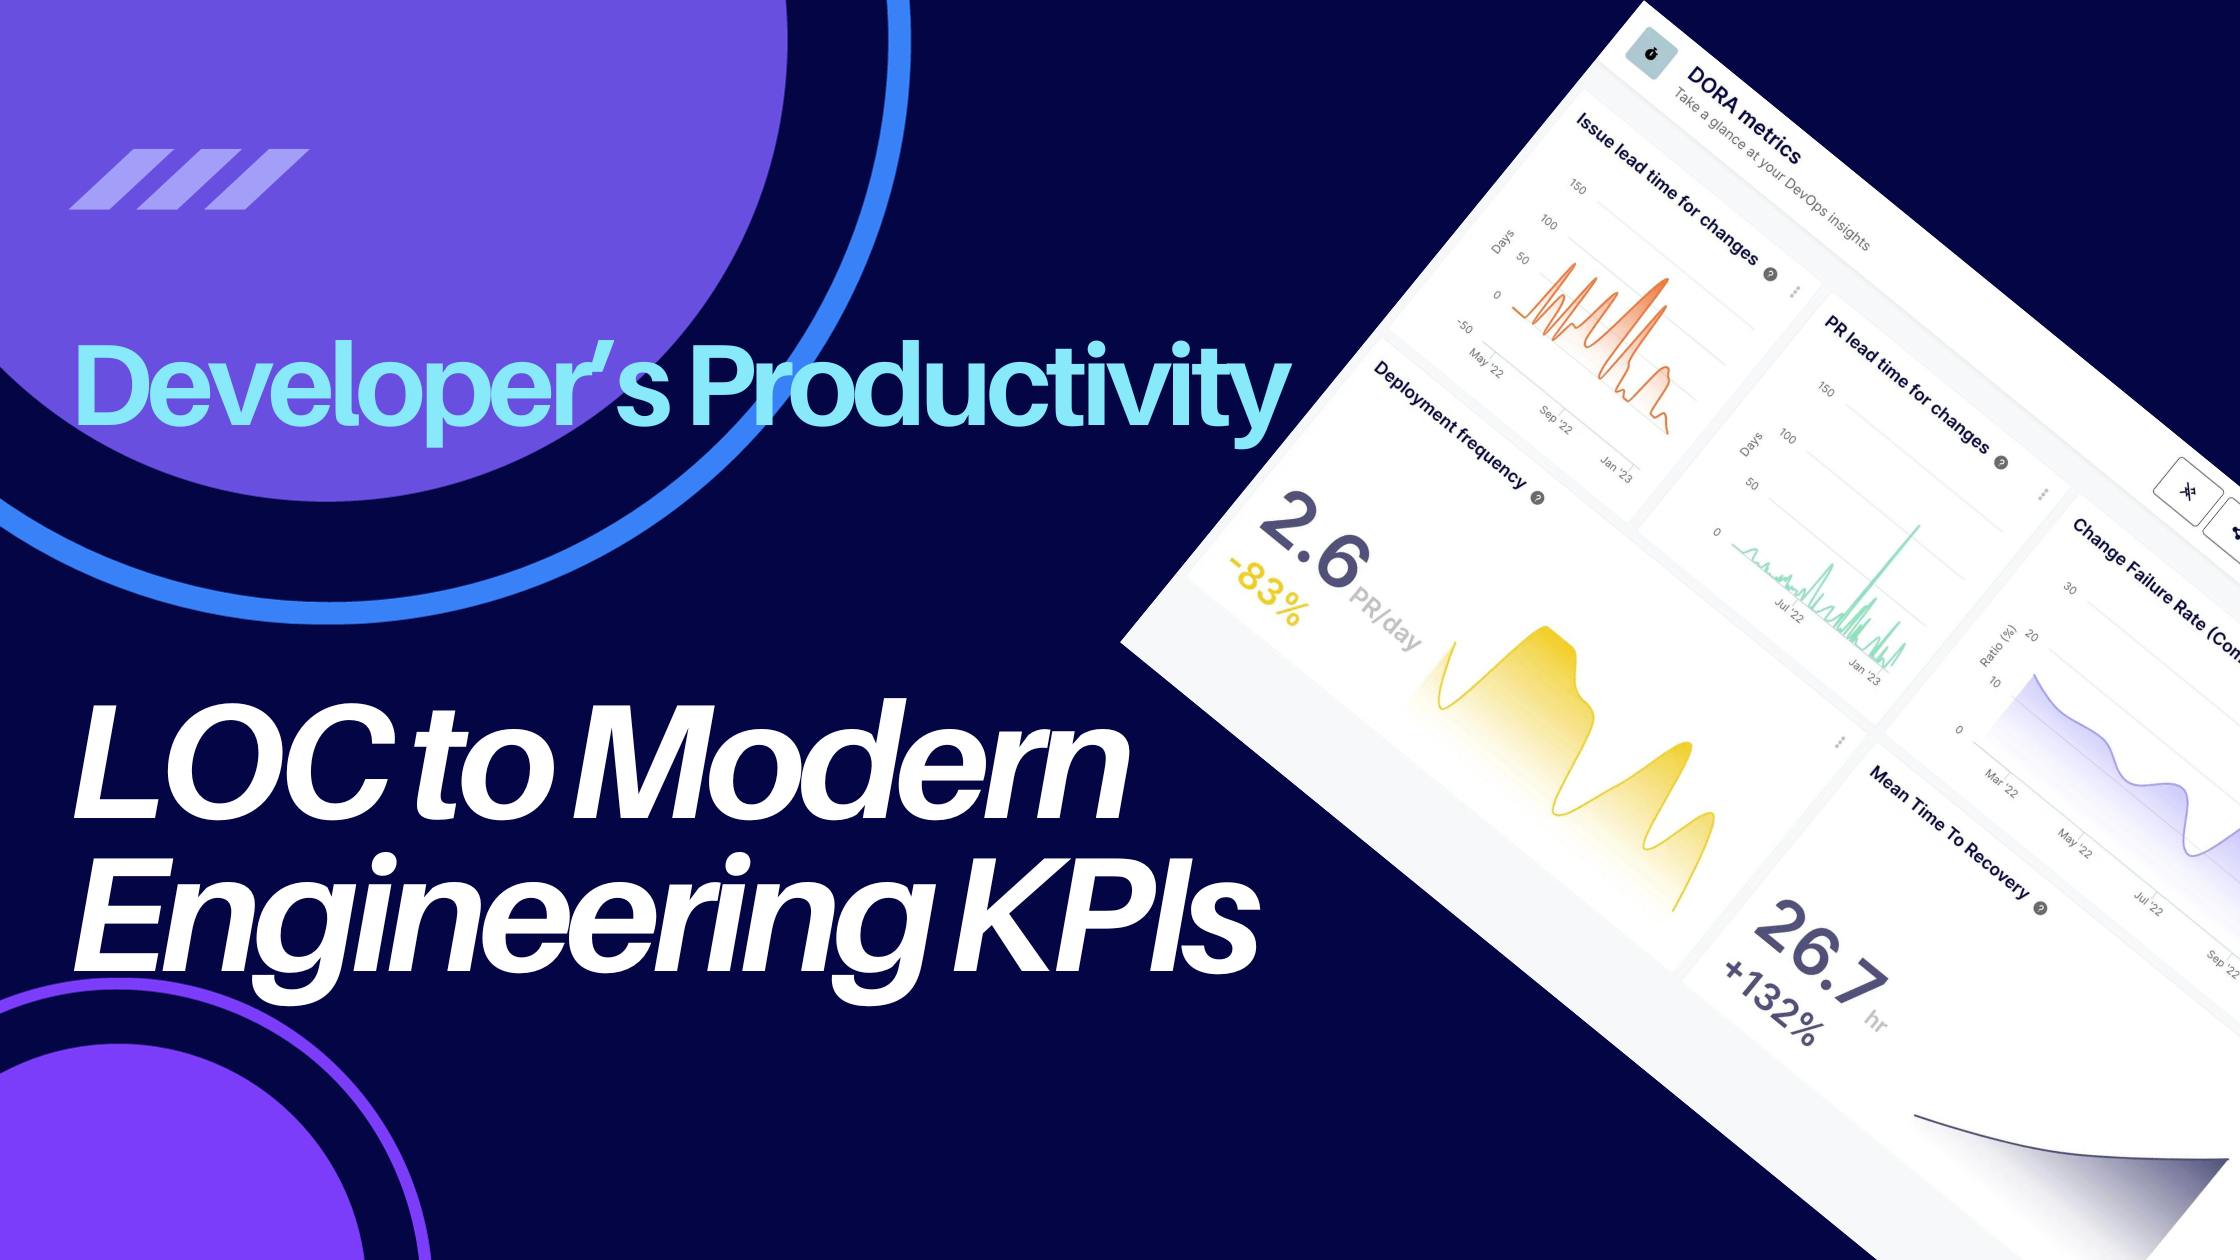
In the ever-evolving realm of software development, the traditional metric of Lines of Code has been overshadowed by more comprehensive KPIs that reflect the complexities of modern engineering practices. This article charts the journey from the historical significance of Lines of Code to the rise of modern engineering KPIs, emphasizing the importance of a holistic approach to measuring developer productivity in today's dynamic technological landscape.
Historical Lines of Code Context
The concept of using Lines of Code as a measurement metric can be traced back to the early days of computer programming. In the era of punch card programming, the physical count of cards was a tangible measure of a program's size. As programming shifted away from punch cards and toward textual source code, the natural transition was to count the lines of that source code.
During the 1970s, as software engineering began to establish itself as a discipline, there was a desire for metrics to measure and manage software development. Many researchers and practitioners looked toward Lines of Code as a primary metric. In his seminal work, "The Mythical Man-Month," Fred Brooks discussed the limitations and challenges of software engineering, acknowledging the use of Lines of Code as a common metric of the time.

1980s – Lines of Code Controversies and Criticisms
By the 1980s, the use of Lines of Code as a metric for productivity and software quality became contentious. Critics pointed out that Lines of Code varies significantly between languages, can be easily manipulated, and doesn't always correlate with functionality or quality. Bill Gates famously said, "Measuring software productivity by lines of code is like measuring progress on an airplane by how much it weighs."
1990s – The Rise of Function Points
Given the criticisms of Lines of Code, the 1990s saw the rise of alternative metrics. One notable alternative was the Function Point Analysis (FPA), introduced by Allan Albrecht in the early 1980s and popularized in the 1990s. FPA aimed to measure software size by functionality provided, rather than lines written.
2000s Onwards – Modern Metrics
With the advent of agile methodologies and DevOps in the 2000s and 2010s, there was a shift toward metrics that provide more actionable insights, like cycle time, lead time, and PR size. While Lines of Code is still used in various contexts, it's often combined with or supplanted by other metrics that offer a more comprehensive view of software development.
When and Why Did Lines of Code Matter?
In the early days of software engineering, projects were often less complex, and the landscape less varied. The size of a project, measured by its Lines of Code, was a straightforward way to estimate effort, cost, and even potential maintenance needs. It provided managers with a tangible figure to anchor their expectations and resource allocations.
The Shortcomings of Lines of Code as a Metric
Over time, as software development methodologies evolved and projects grew in complexity, the cracks in using Lines of Code as a primary metric began to show.
Lines of Code Ambiguity in Measurement
- Variability in coding styles: Different developers have varied coding styles. Some prefer compact, concise code, while others might opt for a more verbose approach for clarity.
- Language differences: The programming language used can greatly affect the Lines of Code. For instance, what might take 10 lines in Java could perhaps be achieved in three lines in Python. Thus, comparing projects or components written in different languages based solely on Lines of Code can be misleading.
Lines of Code Doesn't Reflect Quality
More lines don't inherently mean better functionality. Sometimes, fewer lines indicate more efficient, optimized code.
Lines of Code Leads to Misaligned Incentives
Focusing heavily on Lines of Code could inadvertently push developers toward writing longer code, not necessarily better or efficient code.
Lines of Code Doesn’t Equal Business Value
Two features might have similar Lines of Code but vastly different impacts on users. Lines of Code doesn’t differentiate between code that adds significant user value and code that doesn’t.
Lines of Code Doesn't Account for Modern Development Practices
With the rise of frameworks and libraries, a lot can be achieved with minimal code. Using Lines of Code as a measure fails to account for the flexibility that existing tools provide developers.
The Rise of Average PR Size and Its Importance
In the quest for better metrics, forward-thinking organizations began to look at more granular data, like the variations of pull requests (PRs).

Why Average PR Size Matters
The Average PR Size metric represents the average number of lines added and deleted in pull requests, offering a window into the actual changes being made.
Emphasizes Quality Over Quantity
This metric values both additions and deletions, highlighting refactoring and optimization efforts. It recognizes that sometimes, removing code can be as valuable as adding it.
In line with agile and scrum methodologies, smaller, frequent releases are encouraged. Smaller PRs align with this strategy, promoting iterative development and faster feedback loops.
Enhances Code Review Efficiency
Larger PRs can be daunting to review and can often lead to oversight. Smaller PRs ensure that reviews are thorough and constructive.
Reduces Integration Issues
Smaller PRs mean smaller chunks of code are integrated at a time, reducing the potential for integration conflicts and issues.
Beyond Average PR Size: Comprehensive Metrics for Holistic Developer Productivity Assessment
While the Average PR Size metric offers a glimpse into the development process, truly understanding the intricacies of developer productivity demands a more comprehensive suite of metrics. Here's a deeper dive into some crucial metrics that provide a holistic view of your engineering team's performance.
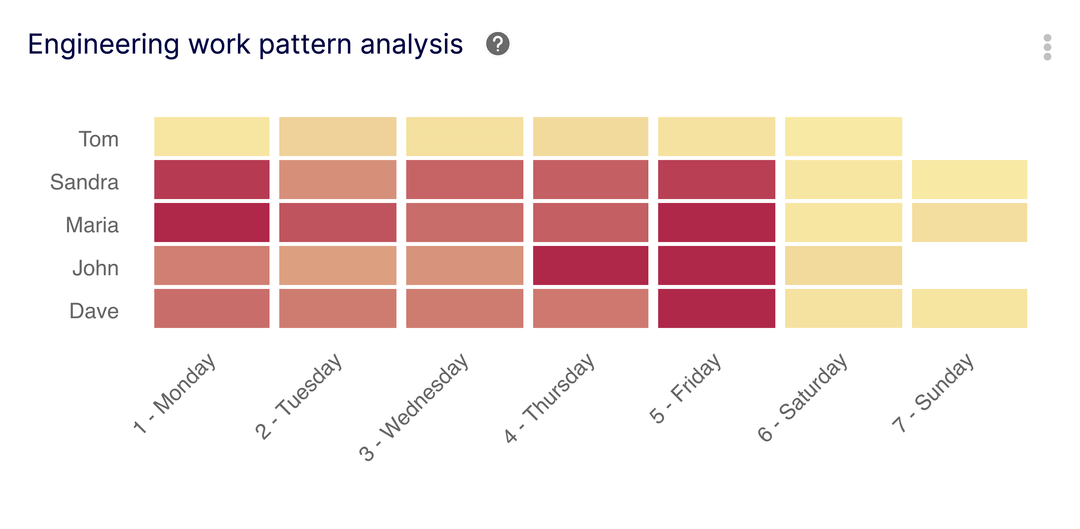
1. Engineering Work Pattern Analysis
Overview: The Engineering Work Pattern Analysis metric illuminates the number of commits handled by each team member daily. This metric, when viewed at a team level, offers invaluable insights into the health and rhythm of the development process.
Benefits of analyzing work patterns:
- Optimizing team performance: Recognizing and rectifying unhealthy work patterns, such as excessive workloads or last-minute crunches, can lead to better project outcomes.
- Promoting work-life balance: A balanced distribution of tasks ensures that no individual or team faces burnout. By spotting irregularities in work patterns, managers can make informed decisions to redistribute tasks.
- Data-driven decision-making: By analyzing these patterns over time, managers can identify trends, anticipate challenges, and make strategic decisions to avoid potential pitfalls.
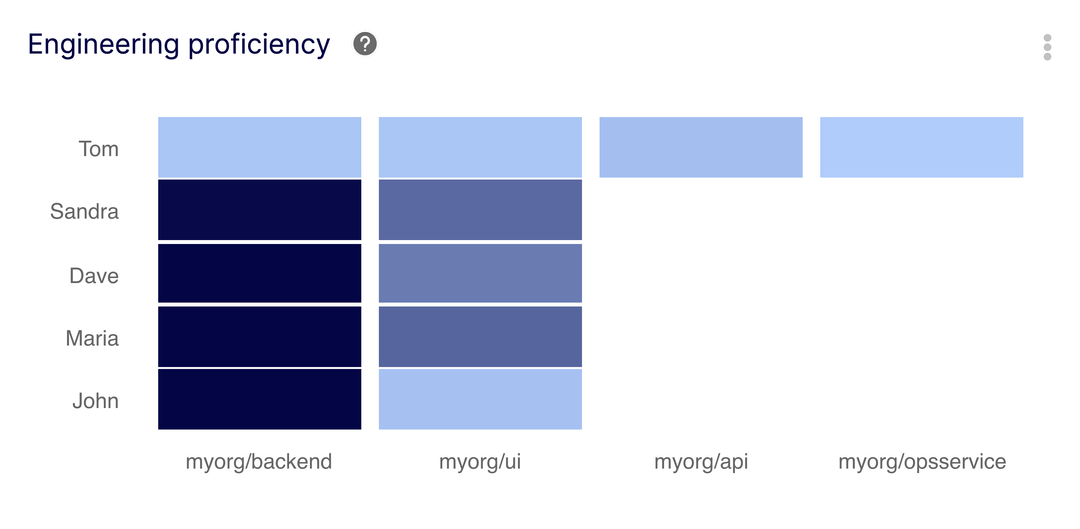
2. Value Stream Engineering Proficiency
Overview: The Value Stream Engineering Proficiency metric delves into an engineer’s experience and expertise. By assessing proficiency levels, managers can make informed decisions on work assignments and identify areas that need upskilling.
Enhancing value stream management:
- Optimized assignments: Assigning engineers based on their proficiency ensures efficient utilization, leading to improved productivity and better project outcomes.
- Balanced work distribution: Encouraging engineers to diversify their project exposure ensures that the team retains a balanced skill set, minimizing bottlenecks due to skill gaps.
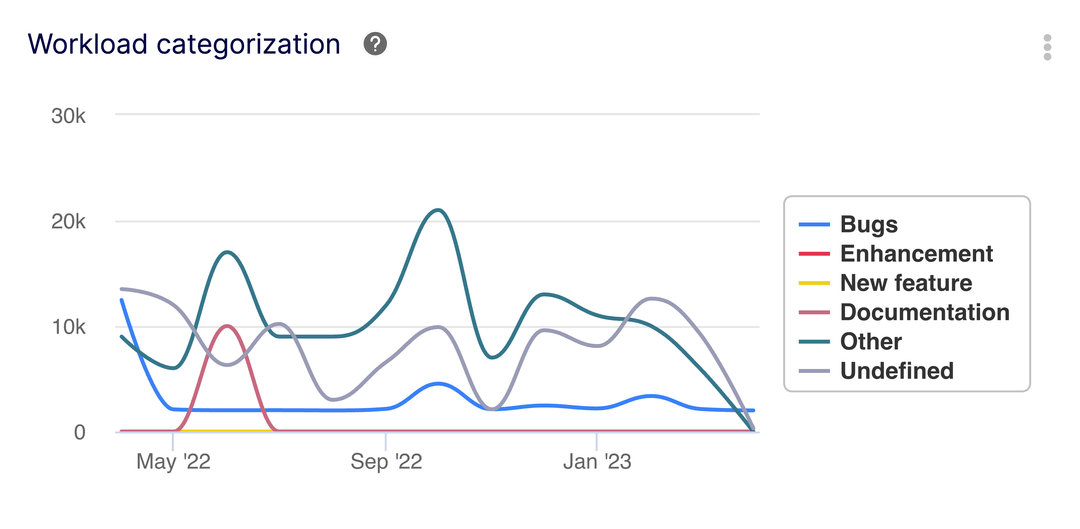
3. Value Stream Workload Categorization
Overview: The Value Stream Workload Categorization metric categorizes tasks based on pull request labels, providing a clear picture of how the workload is distributed among different types of tasks.
Benefits:
- Balanced workload: By categorizing tasks, managers can ensure that no individual or team is inundated with a specific type of task.
- Strategic task prioritization: A clear understanding of task distribution allows managers to prioritize tasks that are aligned with business objectives.
4. Deployment Frequency
Overview: Deployment Frequency measures the average number of pull requests deployed daily, providing insights into the team's capability to deliver features or fixes.
Optimizing deployment:
- Limit PR size: Smaller PRs expedite reviews, testing, and releases.
- Automate testing: Automated end-to-end testing allows QA teams to focus on progressive testing over regression checks.
- Streamline peer review: Address bottlenecks in the review process to ensure timely deployments.

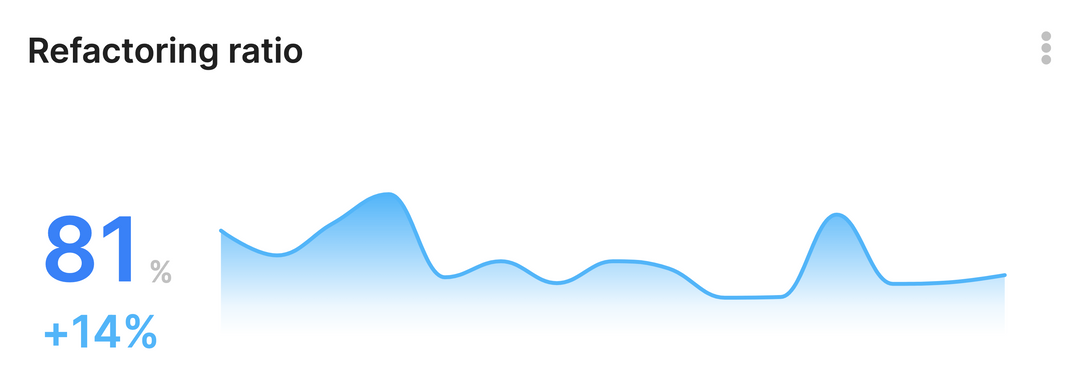
5. Code Refactoring Ratio
Overview: The Code Refactoring Ratio metric calculates the ratio of lines added and deleted among all merged pull requests over a set period, providing insights into the team's code maintenance habits.
Benefits:
- Continuous code maintenance: Elite-performing companies continuously refactor code, ensuring a clean and efficient codebase.
- Detecting unhealthy patterns: Anomalies in the refactoring ratio can indicate rushed feature shipments or last-minute cleanup activities.
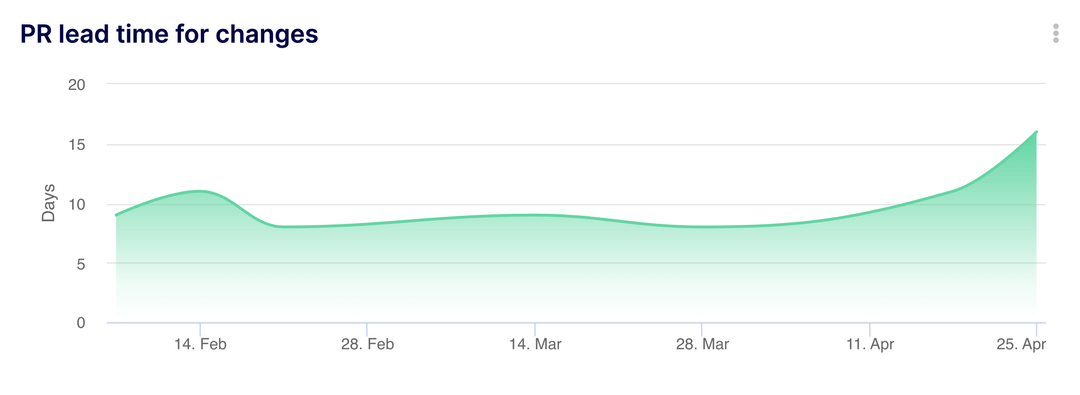
6. Lead Time for Change (LTC) – Pull Requests
Overview: LTC offers insights into the average time it takes for a pull request to be merged, providing a measure of the efficiency of the development to deployment pipeline.
Optimizing LTC:
- Consistent issue sizing: Uniformly sized issues enable easier PR comparisons.
- Clear issue scoping: Detailed instructions help engineers approach solutions more efficiently.
- Immediate PR feedback: Automated tools like linters can provide instant feedback, shortening the feedback loop.
Team-Level Over Individual Metrics
Focusing on team-level metrics over individual metrics has several advantages:
- Promotes collaboration: Measuring at a team level fosters a sense of collective ownership and collaboration among team members.
- Reduces unhealthy competition: Focusing on individual metrics can inadvertently instigate unhealthy competition, which might be counterproductive in the long run.
- Holistic view: Team metrics provide a more comprehensive picture of the project's health, whereas individual metrics might miss broader trends or patterns.
- Minimizes pressure: Individual metrics can place undue pressure on developers, potentially leading to burnout or subpar code quality.
- Encourages collective problem-solving: When challenges arise, team metrics ensure that the entire team comes together to devise solutions rather than placing the onus on a single individual.
Incorporating these metrics into your management toolkit ensures that you have a comprehensive, 360-degree view of your engineering team's performance. By focusing on team-level metrics, you promote a culture of collaboration, collective growth, and shared success.

Redefining Engineering Productivity Metrics: Navigating the Future of Software Development
In the dynamic landscape of software development, measuring productivity and efficiency has undergone a significant evolution. From the traditional Lines of Code metric, which served as a rudimentary gauge in the early days, we've transitioned to a more nuanced approach that encapsulates the multifaceted nature of modern engineering practices. The shift toward metrics like Average PR Size and a suite of comprehensive KPIs underscores the industry's recognition that quality, collaboration, and adaptability are paramount.
As organizations strive to achieve excellence, it's imperative to employ metrics that reflect the true essence of the development process. Focusing on team-level metrics, in particular, promotes a collaborative spirit, ensuring that the entire team thrives together. It's not just about counting lines or commits anymore; it's about understanding work patterns, optimizing proficiency, and ensuring that every piece of code aligns with business objectives.
In this age of rapid technological advancement, having a finger on the pulse of developer productivity requires a holistic approach. By embracing modern KPIs and fostering a culture of collective growth, organizations can navigate the challenges of the digital era with agility, ensuring that their engineering teams are not only productive but also innovative, motivated, and aligned with the broader vision.
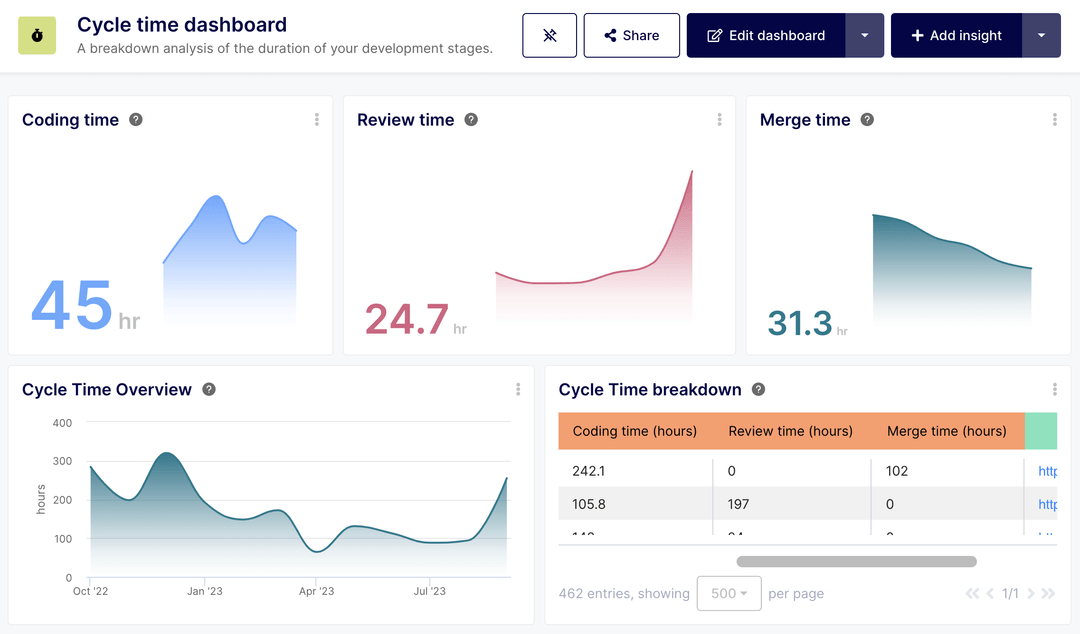
Ready to dive deeper into your team's productivity? Experience the power of insights firsthand by trying out Keypup’s Cycle Time Dashboard. Make data-driven decisions and optimize your software development journey.
FAQ
Q: What is the Lines of Code (LOC) metric?
A: Lines of Code refers to the total number of lines written in the source code of a software program. It was historically used as a gauge for software size, complexity, and developer productivity.
Q: Why did the Lines of Code metric matter historically?
A: In the early days of software engineering, projects were simpler and less varied. The size of a project, measured by its Lines of Code, was a straightforward way to estimate effort, cost, and potential maintenance needs.
Q: What are the main criticisms of the Lines of Code metric?
A: The Lines of Code metric has several shortcomings:
- It varies significantly between programming languages.
- It doesn't inherently reflect the quality or functionality of the code.
- It can lead to misaligned incentives, pushing developers to write longer but not necessarily better code.
- It doesn't account for modern development practices that leverage frameworks and libraries.
Q: How has measuring developer productivity evolved over the years?
A: As software development methodologies evolved, there was a shift toward more actionable metrics. While LOC is still used in some contexts, modern approaches often combine or replace it with metrics like cycle time, lead time, and Average PR Size.
Q: Why is Average PR Size considered a valuable metric?
A: Average PR Size offers a window into the actual changes being made in the codebase. It emphasizes quality over quantity, promotes manageable work units, enhances code review efficiency, and reduces integration issues.
Q: What other modern metrics provide insights into developer productivity?
A: Some key metrics include:
- Engineering Work Pattern Analysis: Offers insights into the health and rhythm of the development process.
- Value Stream Engineering Proficiency: Assesses engineers’ experience and expertise.
- Deployment Frequency: Measures the average number of pull requests deployed daily.
- Code Refactoring Ratio: Provides insights into the team's code maintenance habits.
- Lead Time for Change (LTC): Measures the efficiency of the development to deployment pipeline.
Q: Why is it recommended to focus on team-level metrics over individual metrics?
A: Focusing on team-level metrics has several advantages:
- It promotes collaboration and collective ownership.
- It reduces the potential for unhealthy competition.
- It provides a holistic view of the project's health.
- It minimizes undue pressure on individual developers.
- It encourages collective problem-solving.
Q: How can organizations promote a culture of collaboration and collective growth?
A: By incorporating a comprehensive suite of metrics into their management approach, organizations can ensure a holistic view of their engineering team's performance. Prioritizing team-level metrics fosters a culture of collaboration, collective growth, and shared success.