To be successful in today's business world, engineering organizations must design an effective reporting and analytics framework that allows end users to efficiently consume integrated development data. This strategy allows developing proactive decision-making skills through the use of the right set of information. Reports are used to obtain a more detailed view to drill-down into details. Before designing charts, cards or KPIs, reports allow the users to understand granular information while charts, cards or KPIs focus on some areas only.
Here's how you can create a custom report with Keypup in 3 easy steps:
Add a report to a dashboard
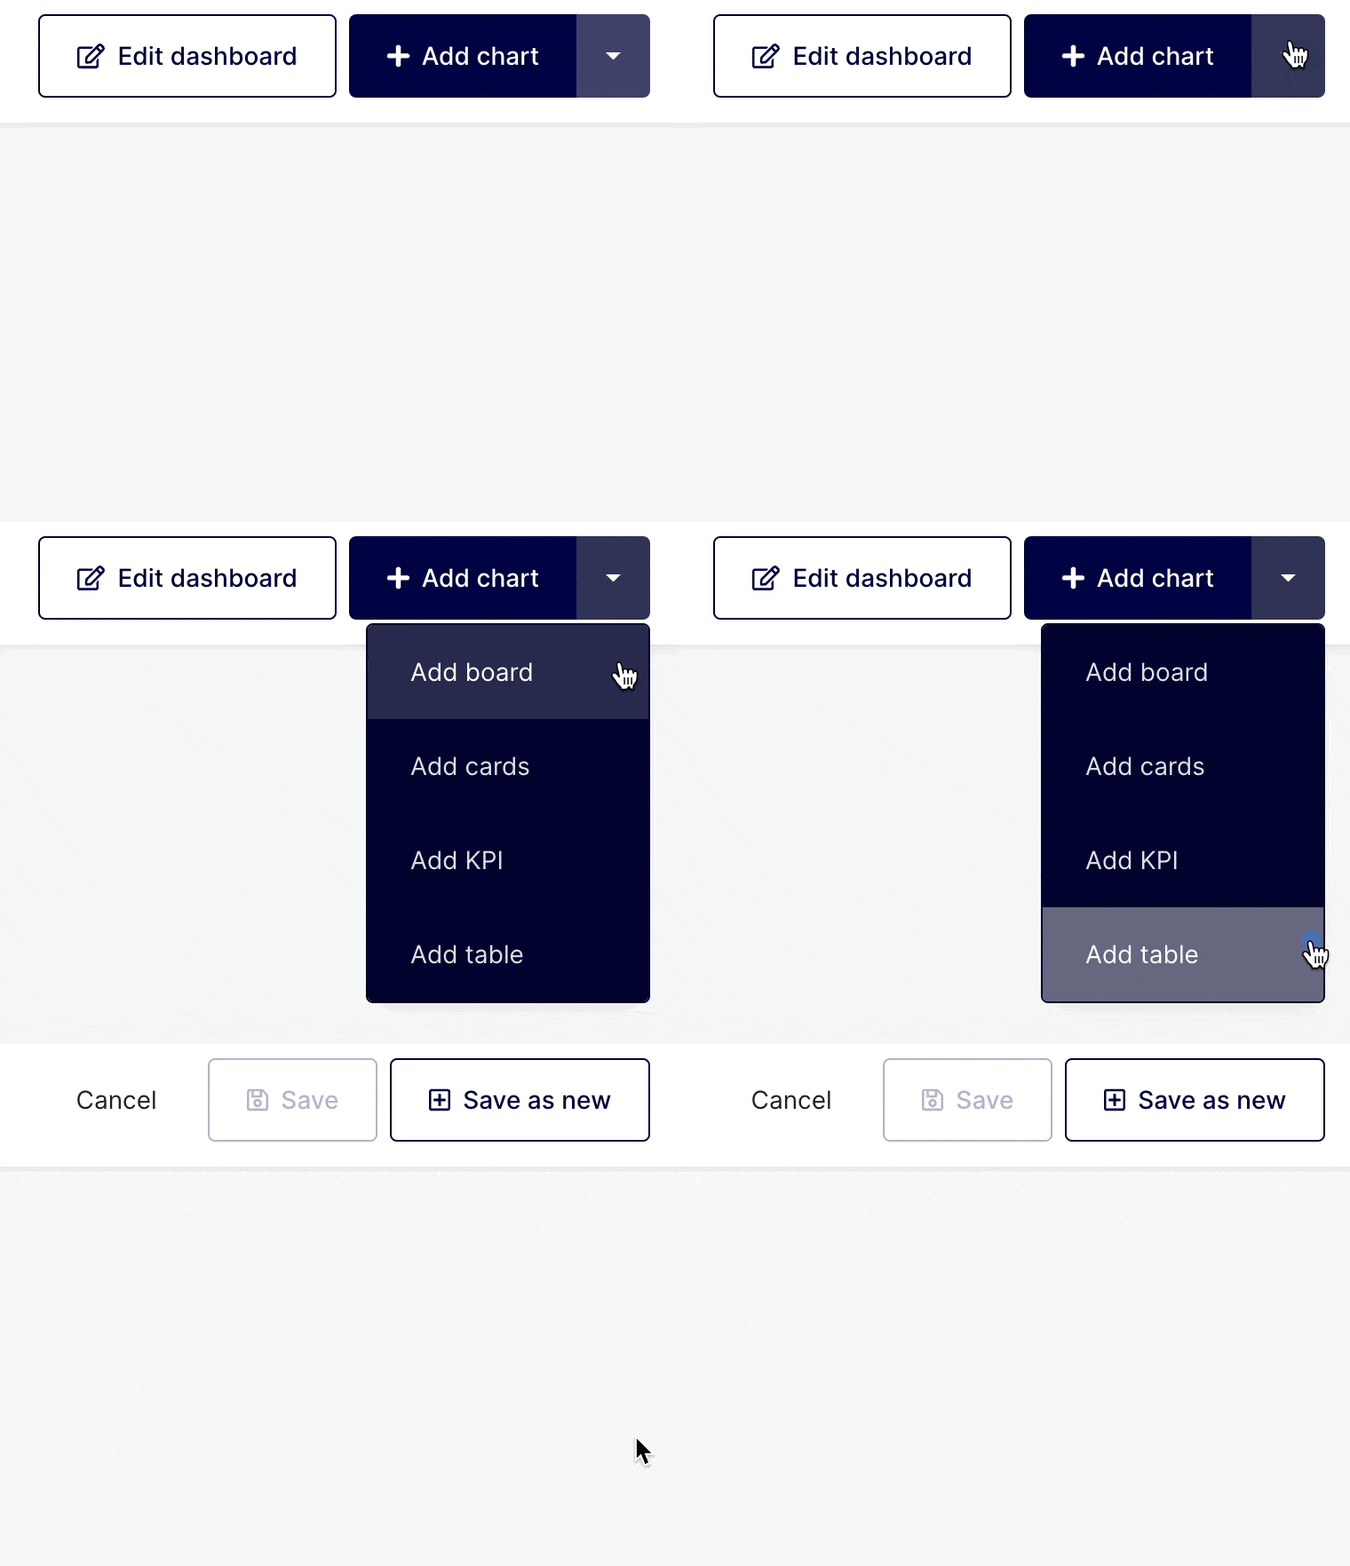
Click on the arrow on the top right corner of any dashboard and select the “Add Table” option.
Select data source
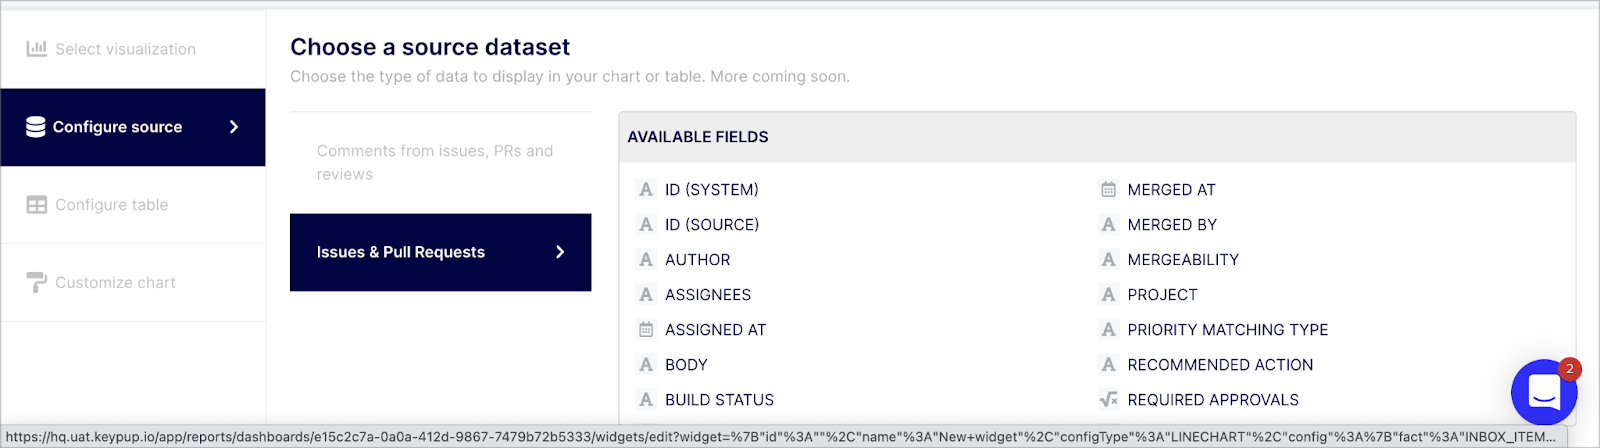
Select the "Configure source" tab from the navigation menu on the left side of the screen. Keypup fetches various datasets based on the connected applications, such as "Issues & Pull Requests" for example. You can see the various fields you can query on each dataset on the table titled "AVAILABLE FIELDS" on the right side of the screen as you select a dataset. Select the dataset containing the fields you wish to use in your report.
Query your selected dataset
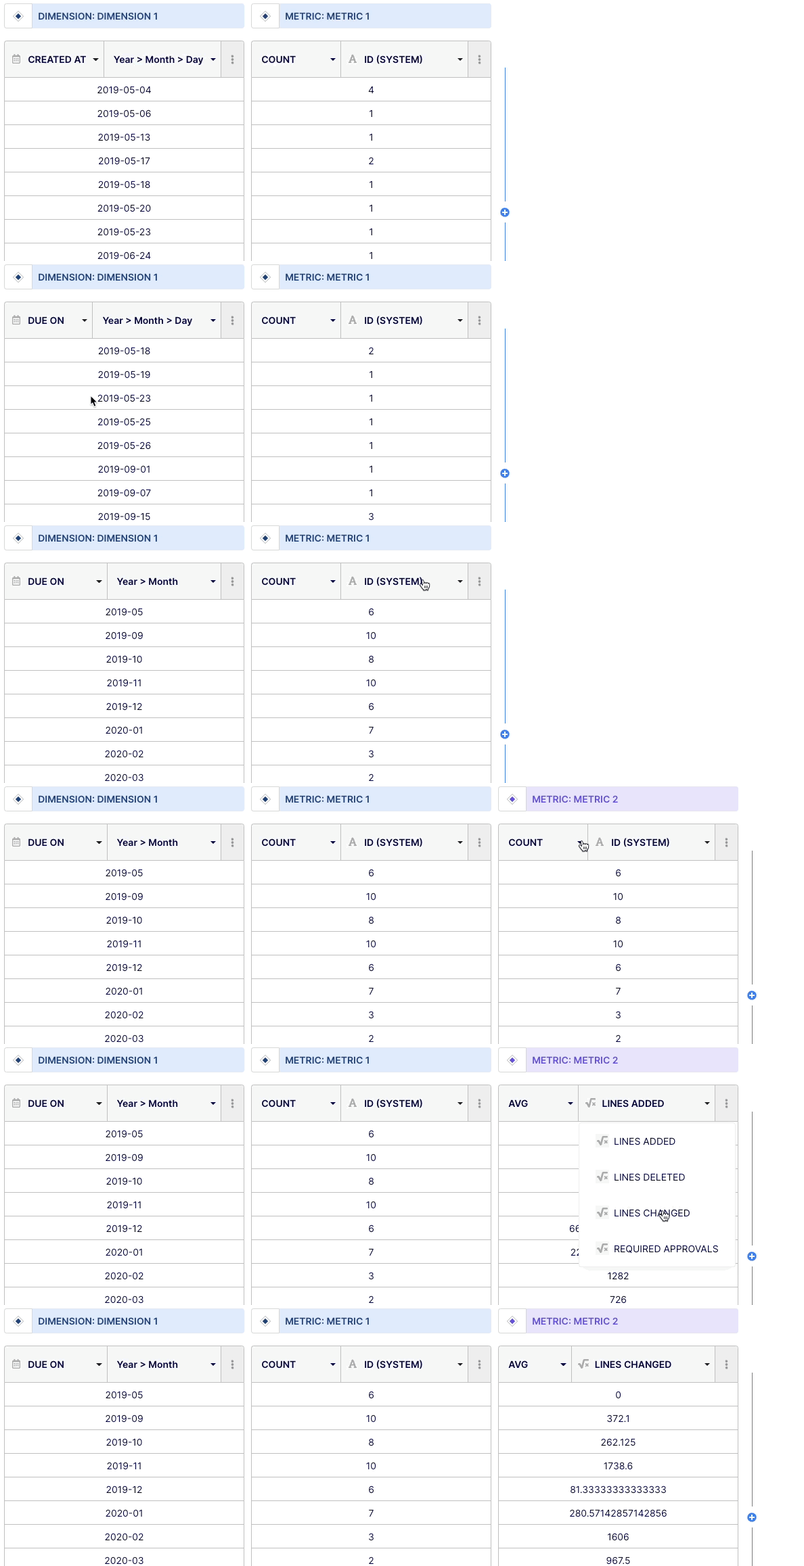
Once you have selected your visualization type (table) and data source, you can begin building your insight by querying your dataset. From the navigation menu on the left, select the "Configure table" tab. The table will include two columns by default: Dimensions and Metrics.
“Dimensions” are field attributes of your datasets.. It could be, for instance, a date of merging, an author or a label.
“Metrics” are numerical values derived from a function applied to a particular field ( Dimension).
In a table, you can add multiple dimensions and metrics. To add them, simply click on the (+) sign button on the right side of the column and select “dimension” or “metric”. To delete dimensions and/or metrics columns, click on the expand (...) button and select the "delete" option.
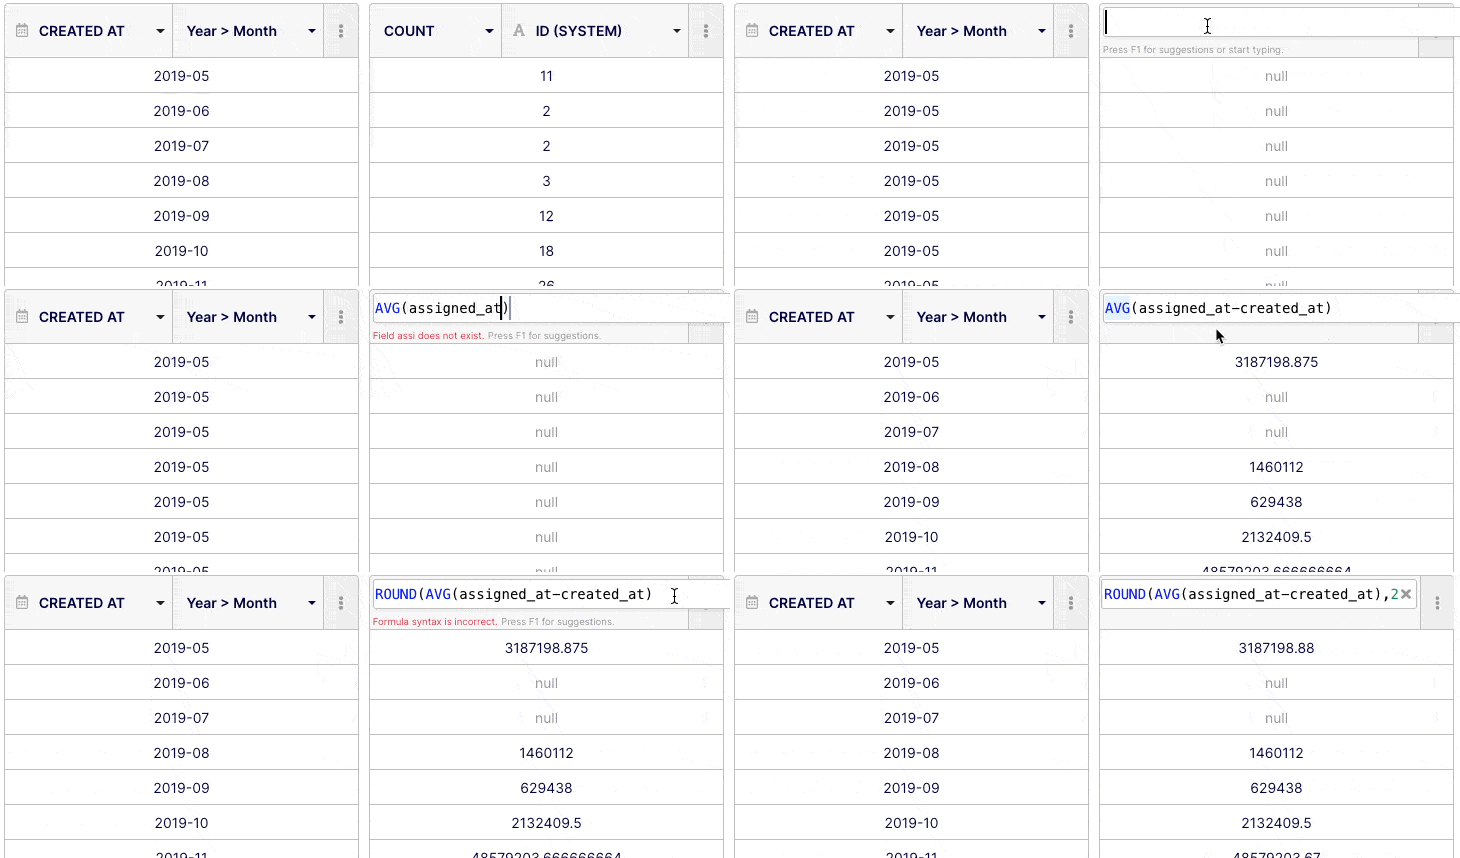
You can perform basic or advanced queries depending on how familiar you are with query construction. Select the field(s) you want to query from the drop-down menu at the top of the "Dimension" column or choose "custom formula". From the drop-down menu at the top of the "Metric" column, choose operator, aggregator, or "custom formula".
To go further
Apply a filter (optional)
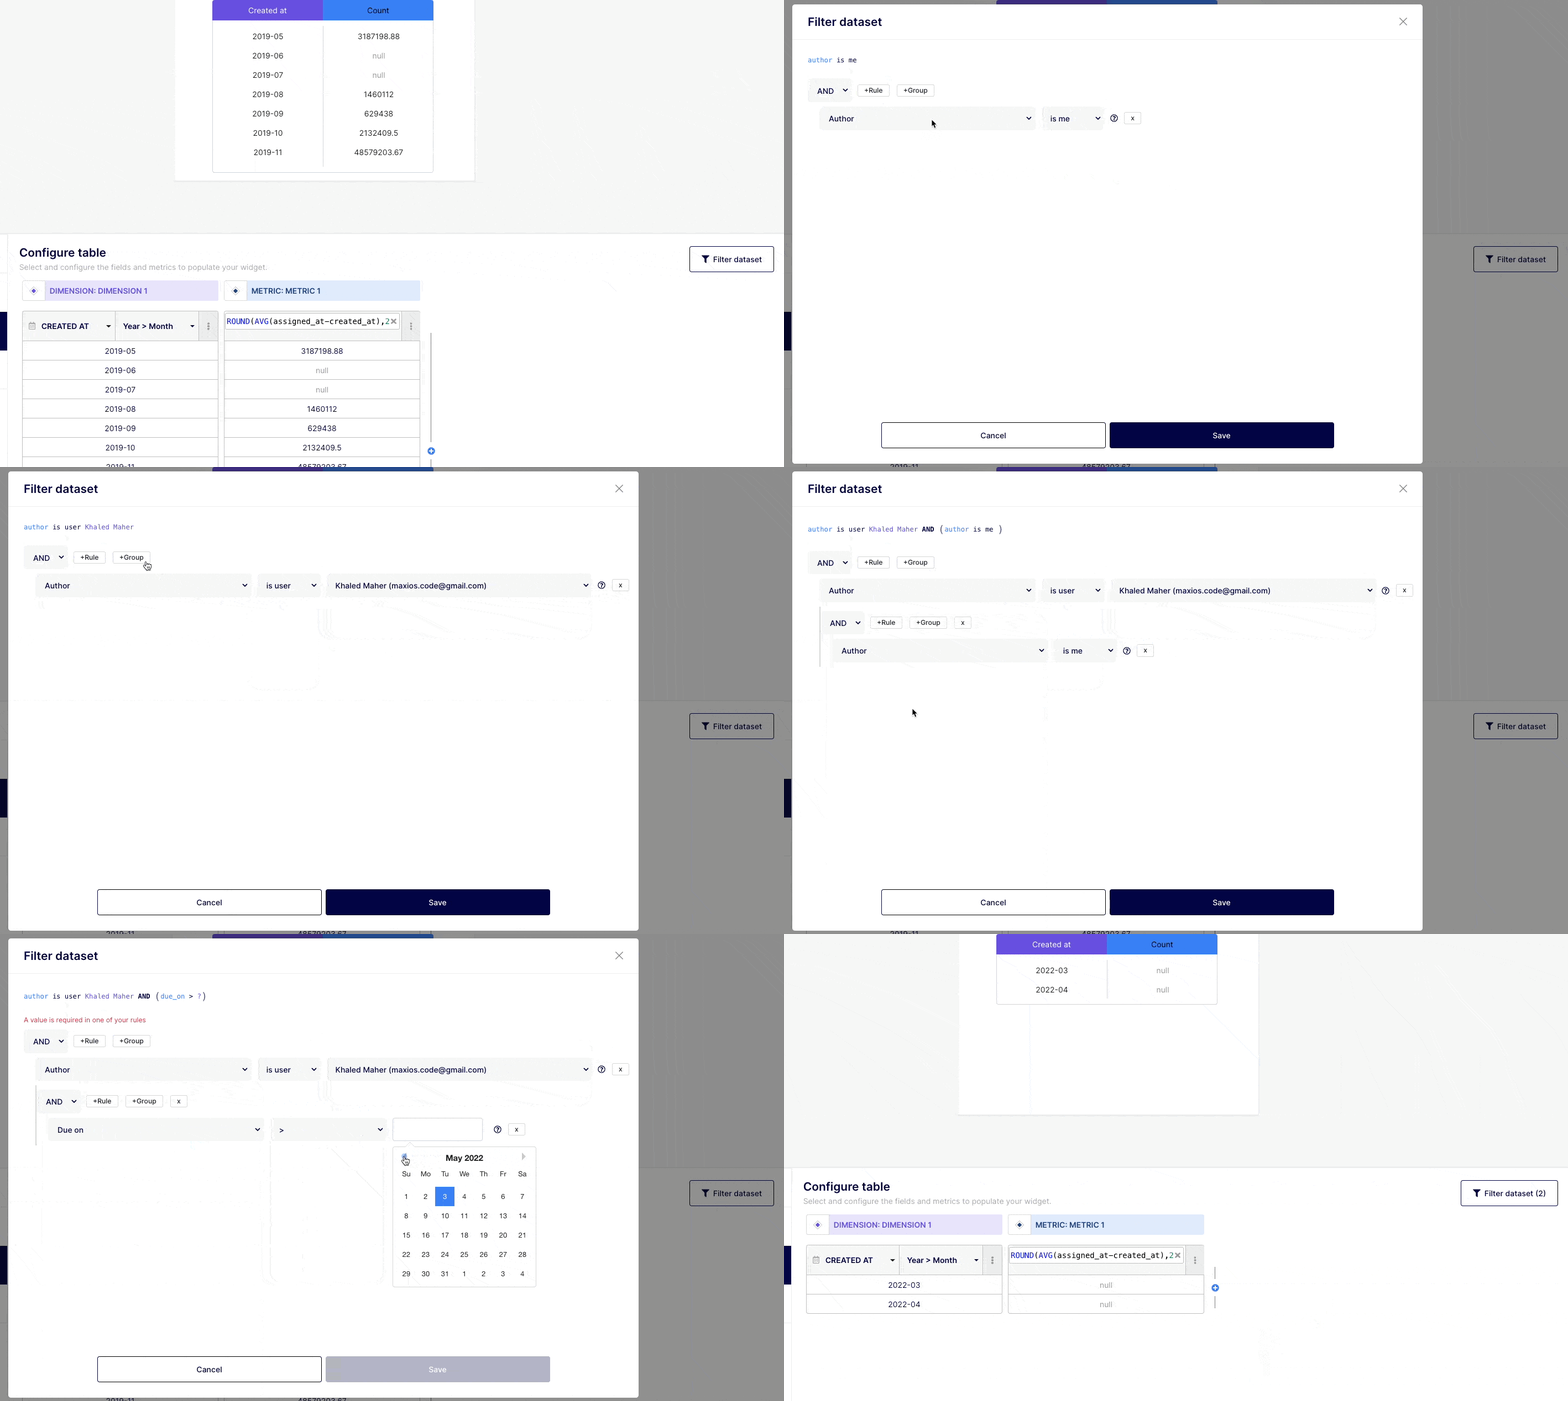
Based on the fields that you built your report on, you can apply a filter using "AND" & "OR" operators if you need to narrow down your insight. You can do this by clicking on the "Filter dataset" button at the top right corner of your insight builder interface.
Customize your chart “look & feel” (optional)
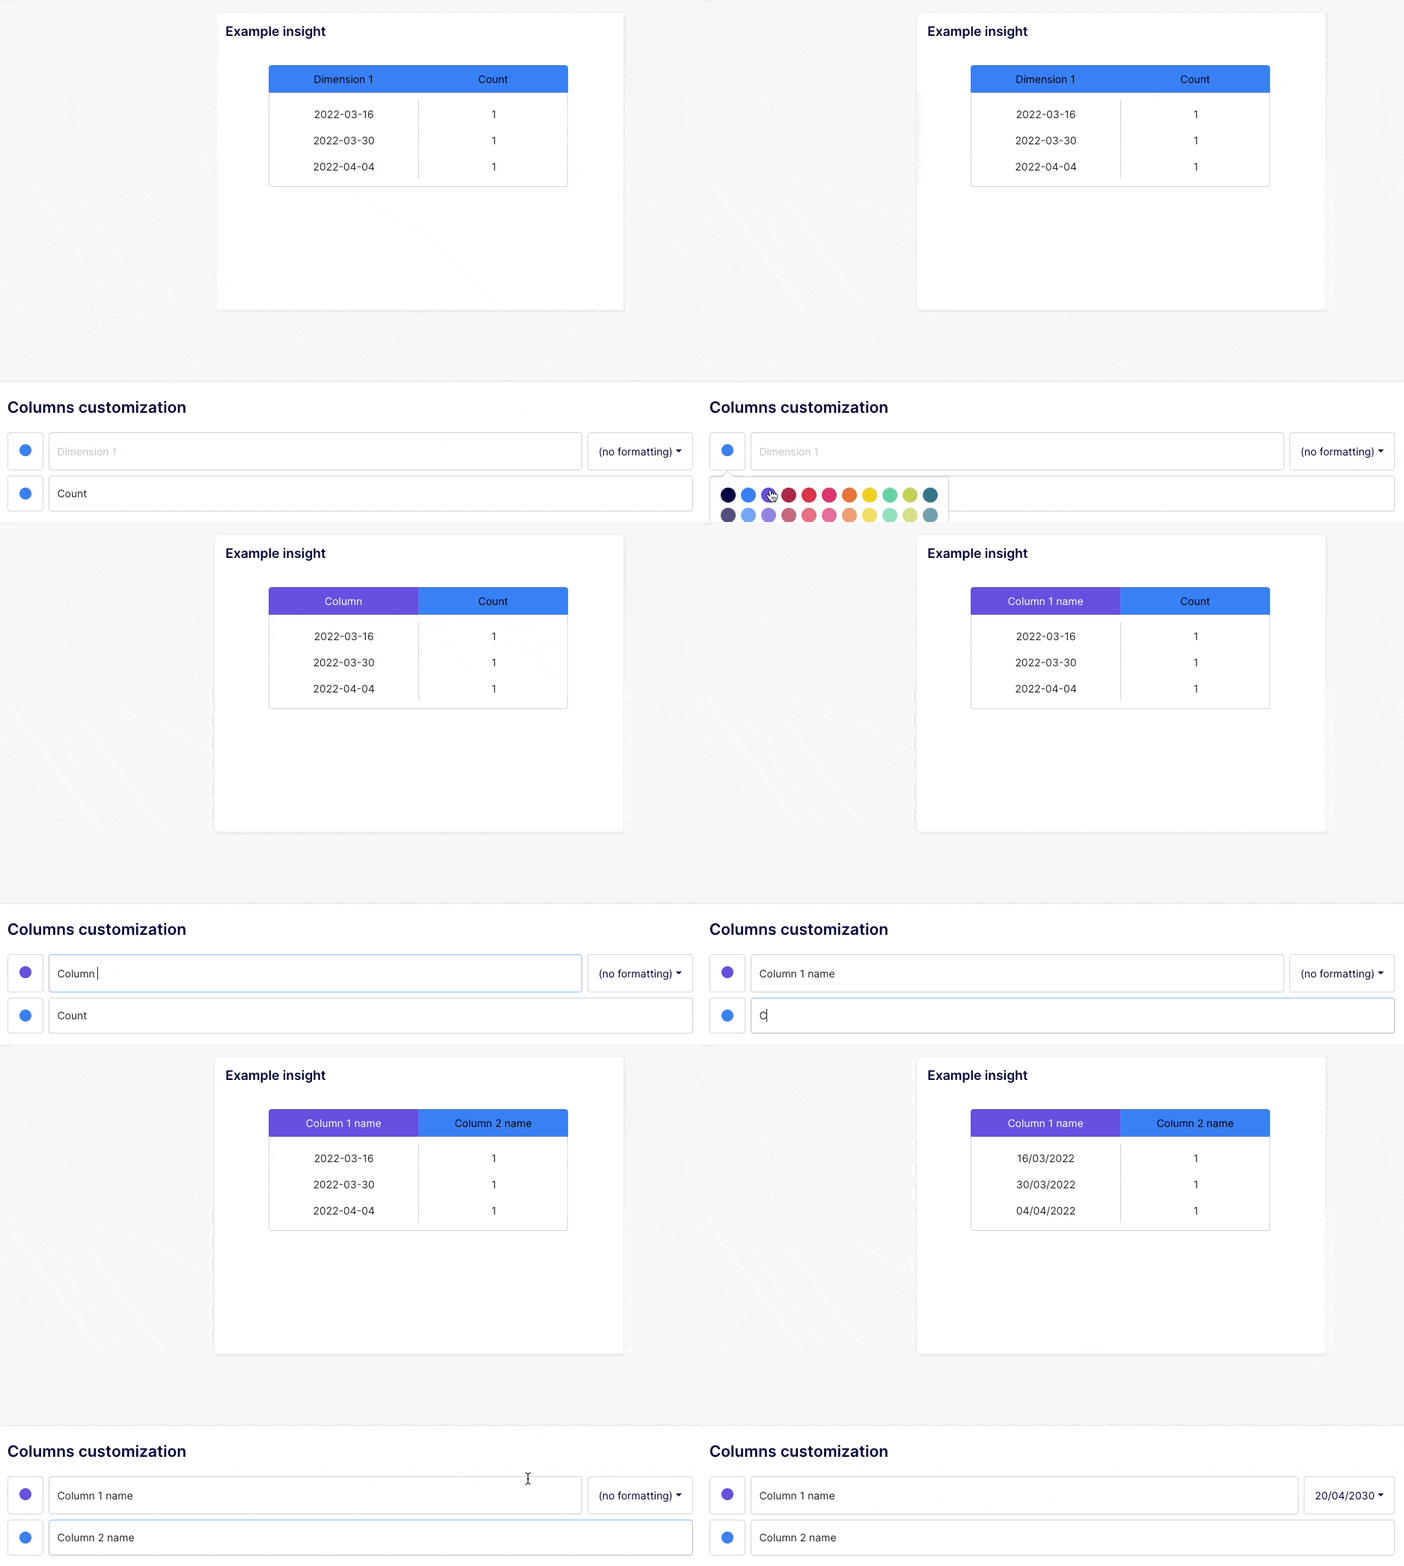
Based on your selected visualization, cosmetic customization is automatically suggested. It's possible to further customize reports for readability by tweaking the colors, as well as by updating the title, columns, and legend.
Any questions or tips you would like to share? You can contact us directly in the chat from your Keypup interface or use this contact form.