TL;DR; Make sure to properly monitor your Cloud Task queues and job durations so as to detect abnormal loads or jobs doing doing much at once. Using a combination of GCP monitoring and custom GCP log-based metrics can give you a lot of needed insights.
Monitoring is an essential part of maintaining production systems. Ensuring you have the right metrics available in a dashboard will allow you to be more proactive should an issue or unexpected load arise.
This is particularly applicable for background jobs where issues are usually more subtle than with direct server errors. Background job issues tend to slowly creep until you discover that your queues are saturated with retries or timed out jobs.
You can get quick insights using the out-of-the-box metrics provided by GCP and dig deeper using Logs-based metrics.
In this article I'll cover how to put monitoring metrics in place for Cloud Tasks and Cloudtasker.
Below is a list of standard metrics I like to track when it comes to background jobs.
Cloud Tasks queue size
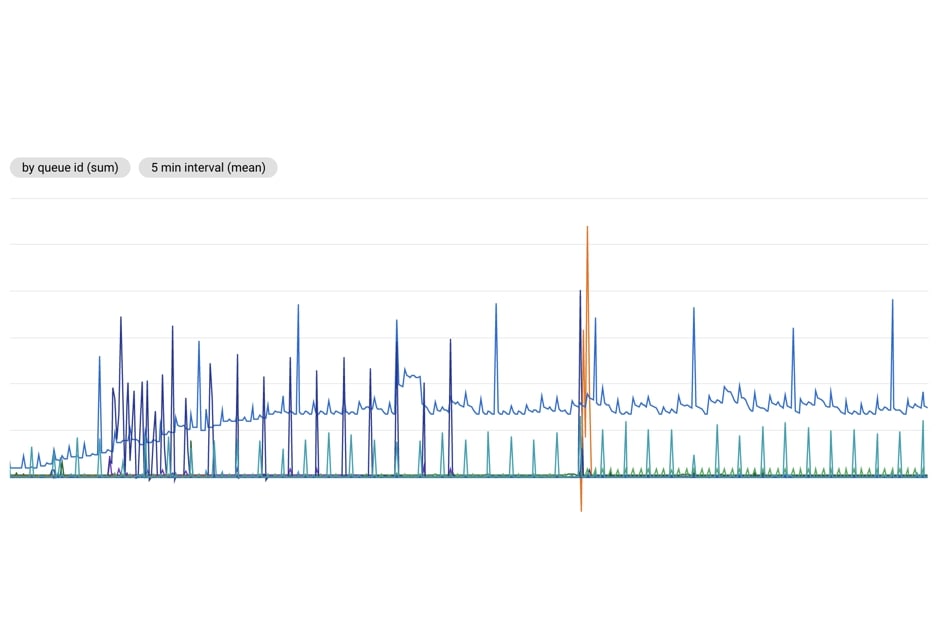
The first metric to monitor is the queue size. If your queues are going off control, it means you either need to crank up your backend capacity or something is wrong with your jobs and they keep getting re-enqueued.
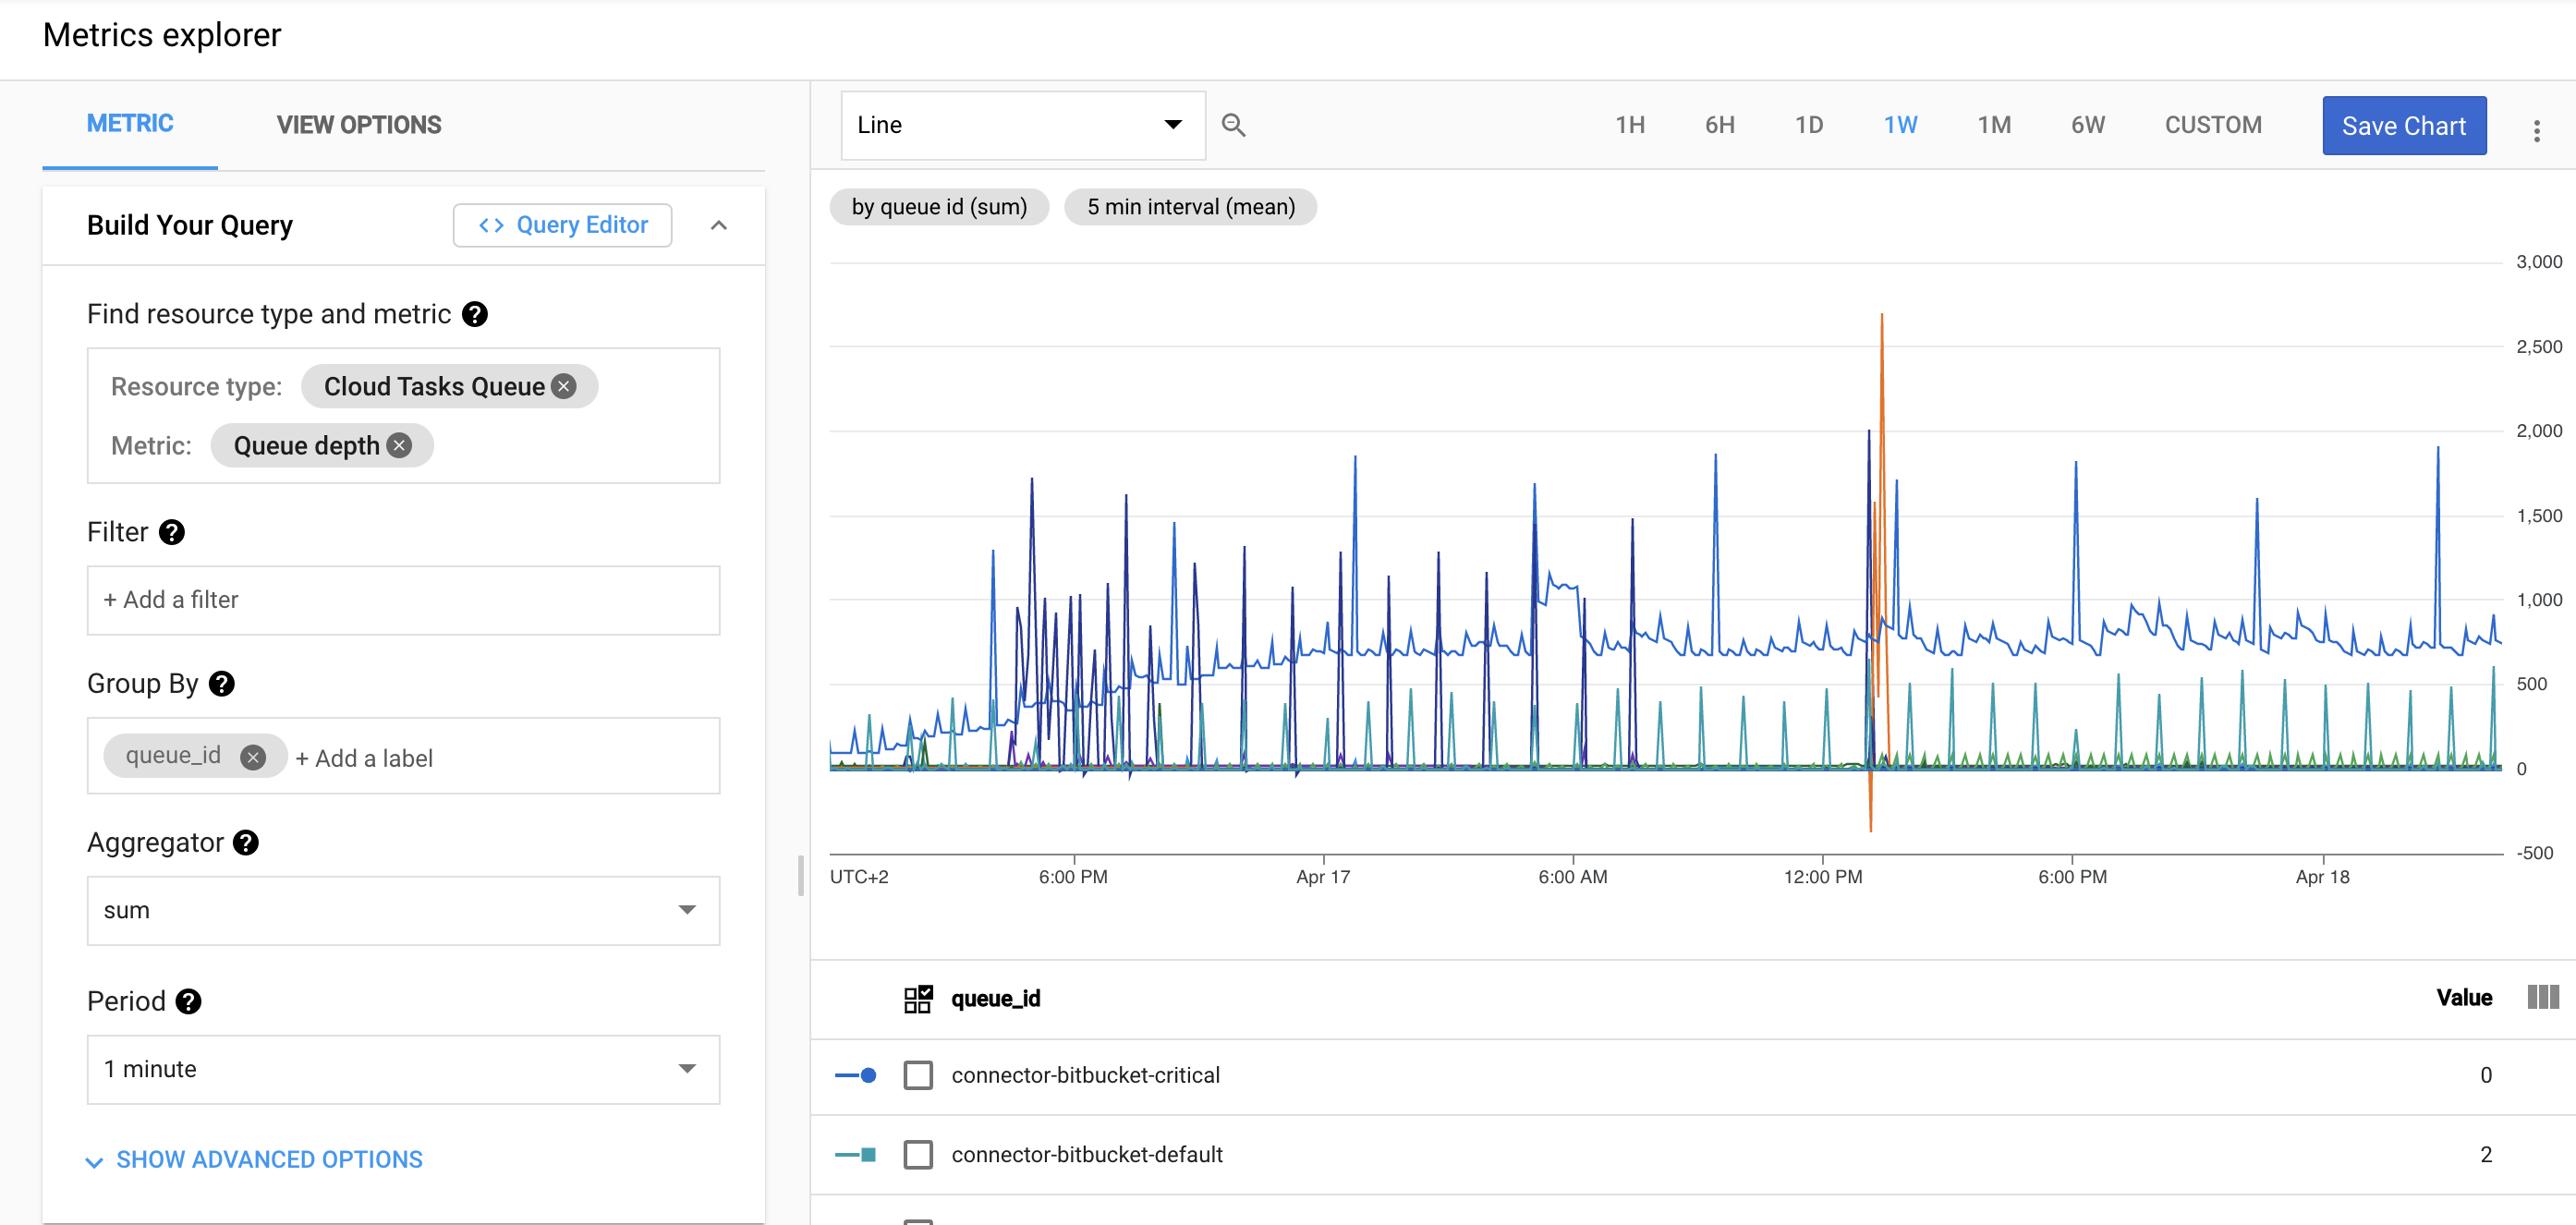
Use the metrics explorer with the following configuration:
- Metric: cloudtasks.googleapis.com/queue/depth
- Group by: Queue Id
- Aggregator: Sum
- Period: 1 minute
This will generate the following chart:
You can also click here to build this chart automatically.
Cloud Run billable runtime
For backend services essentially running jobs, monitoring the amount of containers being billed can give you good insights on how (1) how your services are performing under heavy job load and (2) how jobs impact your overall bill at the end of the month.
It's a good metric to have independently of background job monitoring.
Use the metrics explorer with the following configuration:
- Metric: run.googleapis.com/container/billable_instance_time
- Group by: configuration_name
- Aggregator: Sum
- Period: 1 minute
This will generate the following chart:
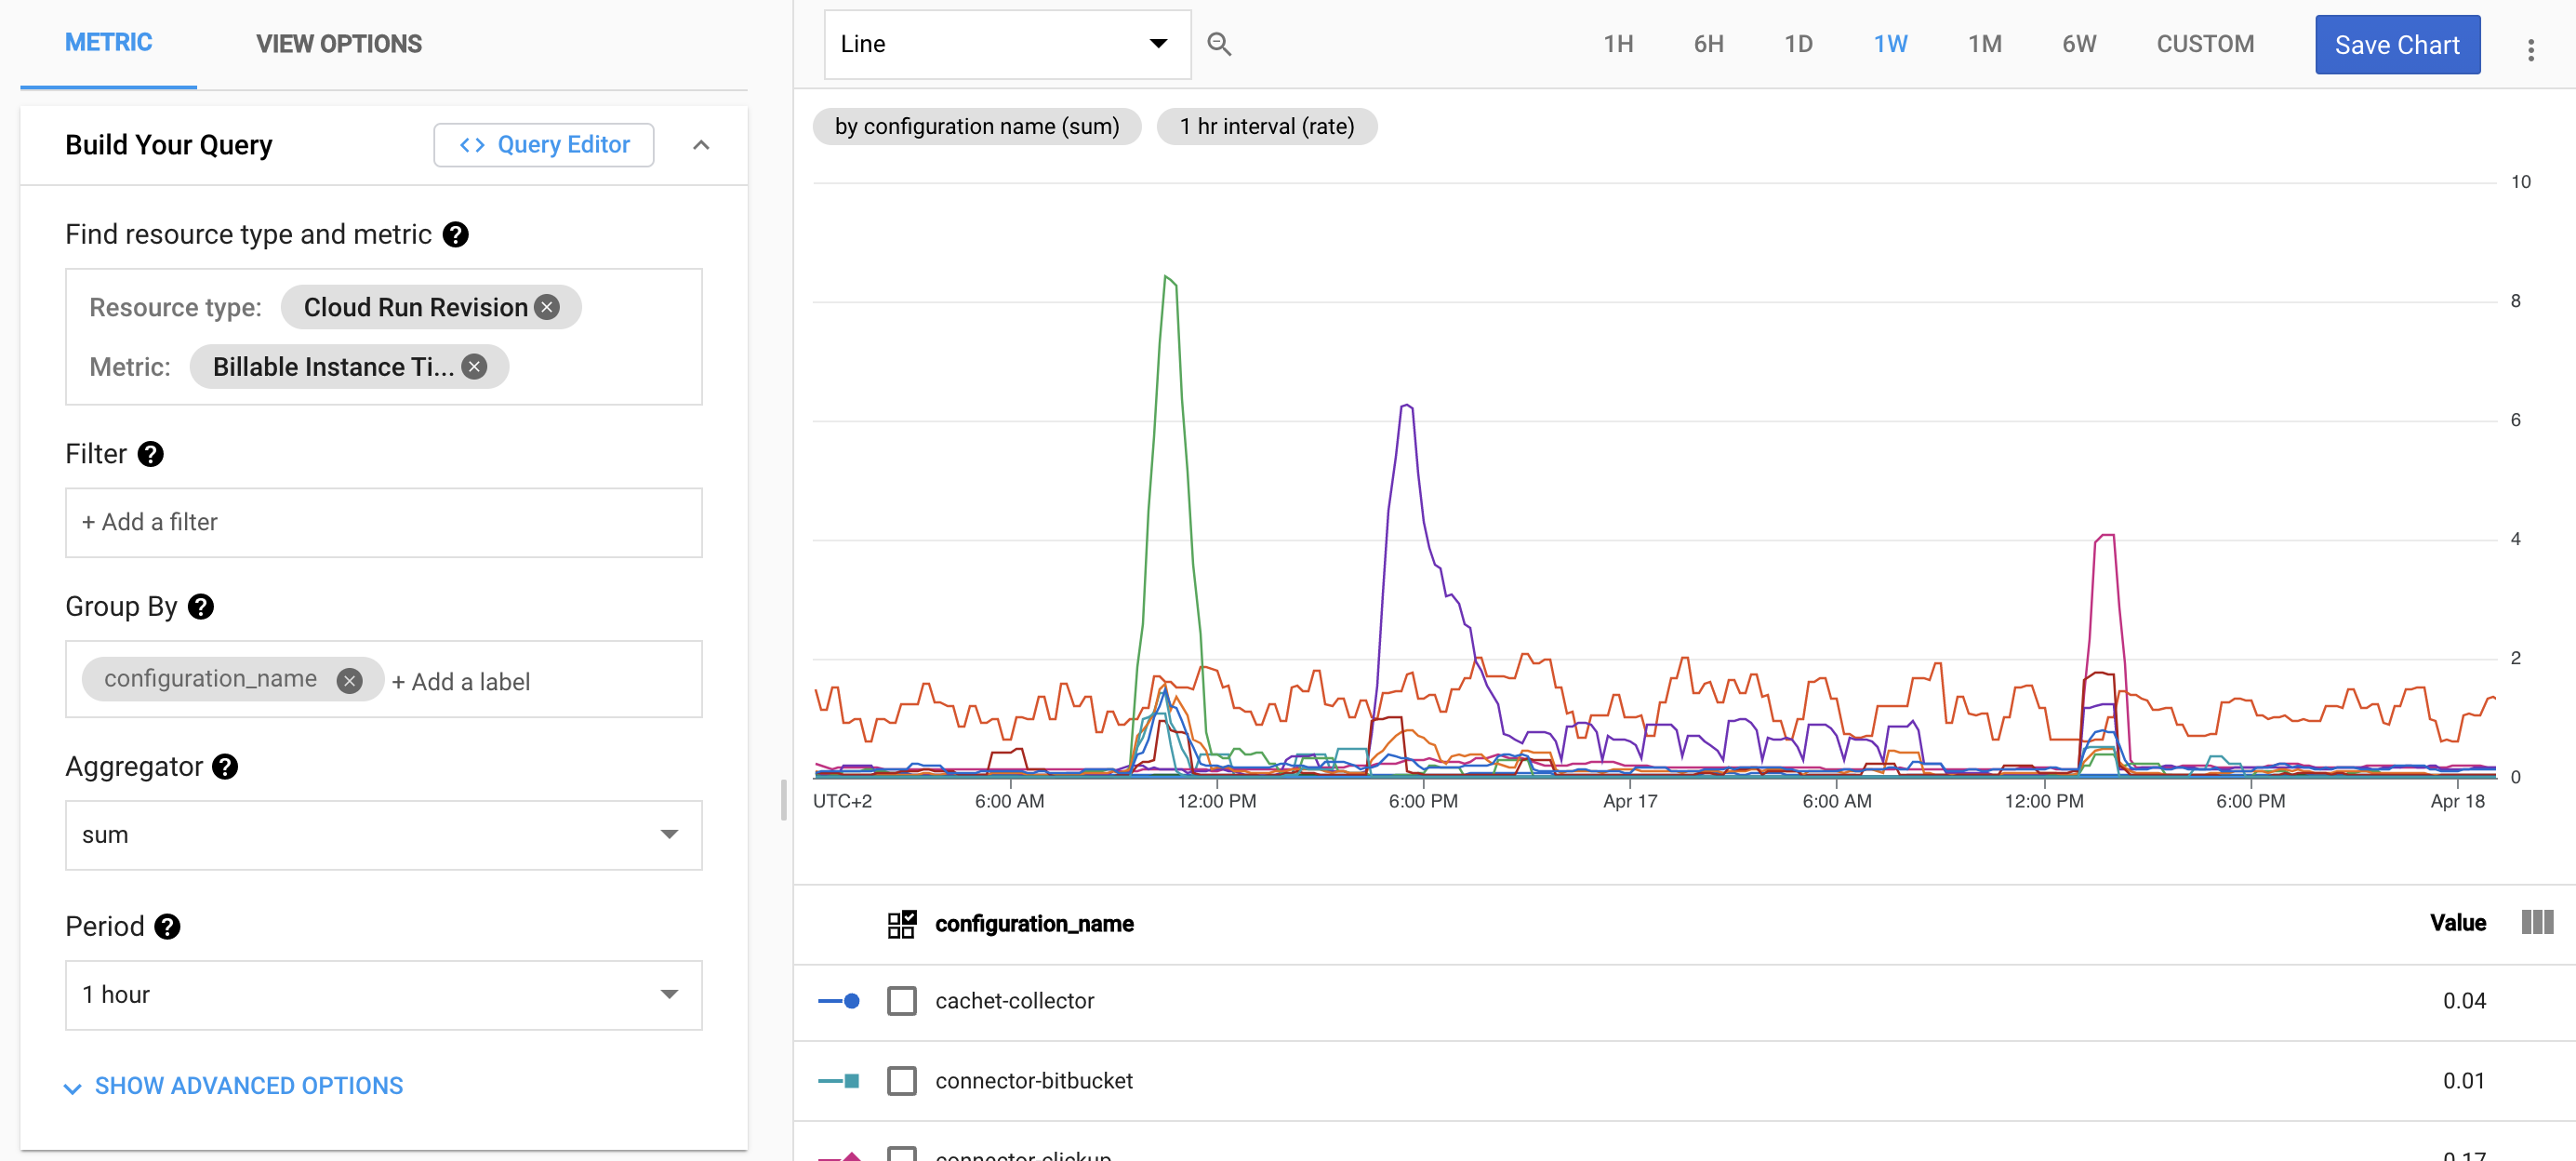
You can also click here to build this chart automatically.
This chart shows the number of instance ms billed per second. If you see 500ms/s it means your service is actively running 50% of the time. If you see 8s/s it means you have 8 containers actively running.
Cloud Run may have additional containers provisioned on top of the actively running containers (idle containers) but these are only kept to avoid cold starts and are not billed to you.
Job duration (Cloudtasker-specific)
Measuring job duration is essential to know if you need to break down your jobs and to detect issues with slow downstream services (database, cache store, third-party API).
Cloud Task job duration is not a native GCP metric. You need to create this metric using log-based data.
The Cloudtasker gem automatically adds a duration field on each "Job done" log entry. This value can be used to create a metric on job duration.
First create a new GCP Log-based metric from GCP Logging > Logs-based metric.
Select Distribution as the metric type, name it cloudtasker/job_duration and enter "s" (seconds) for the unit.
For the filter use the following query:
Finally enter jsonPayload.payload.duration for the field name and save your metric.
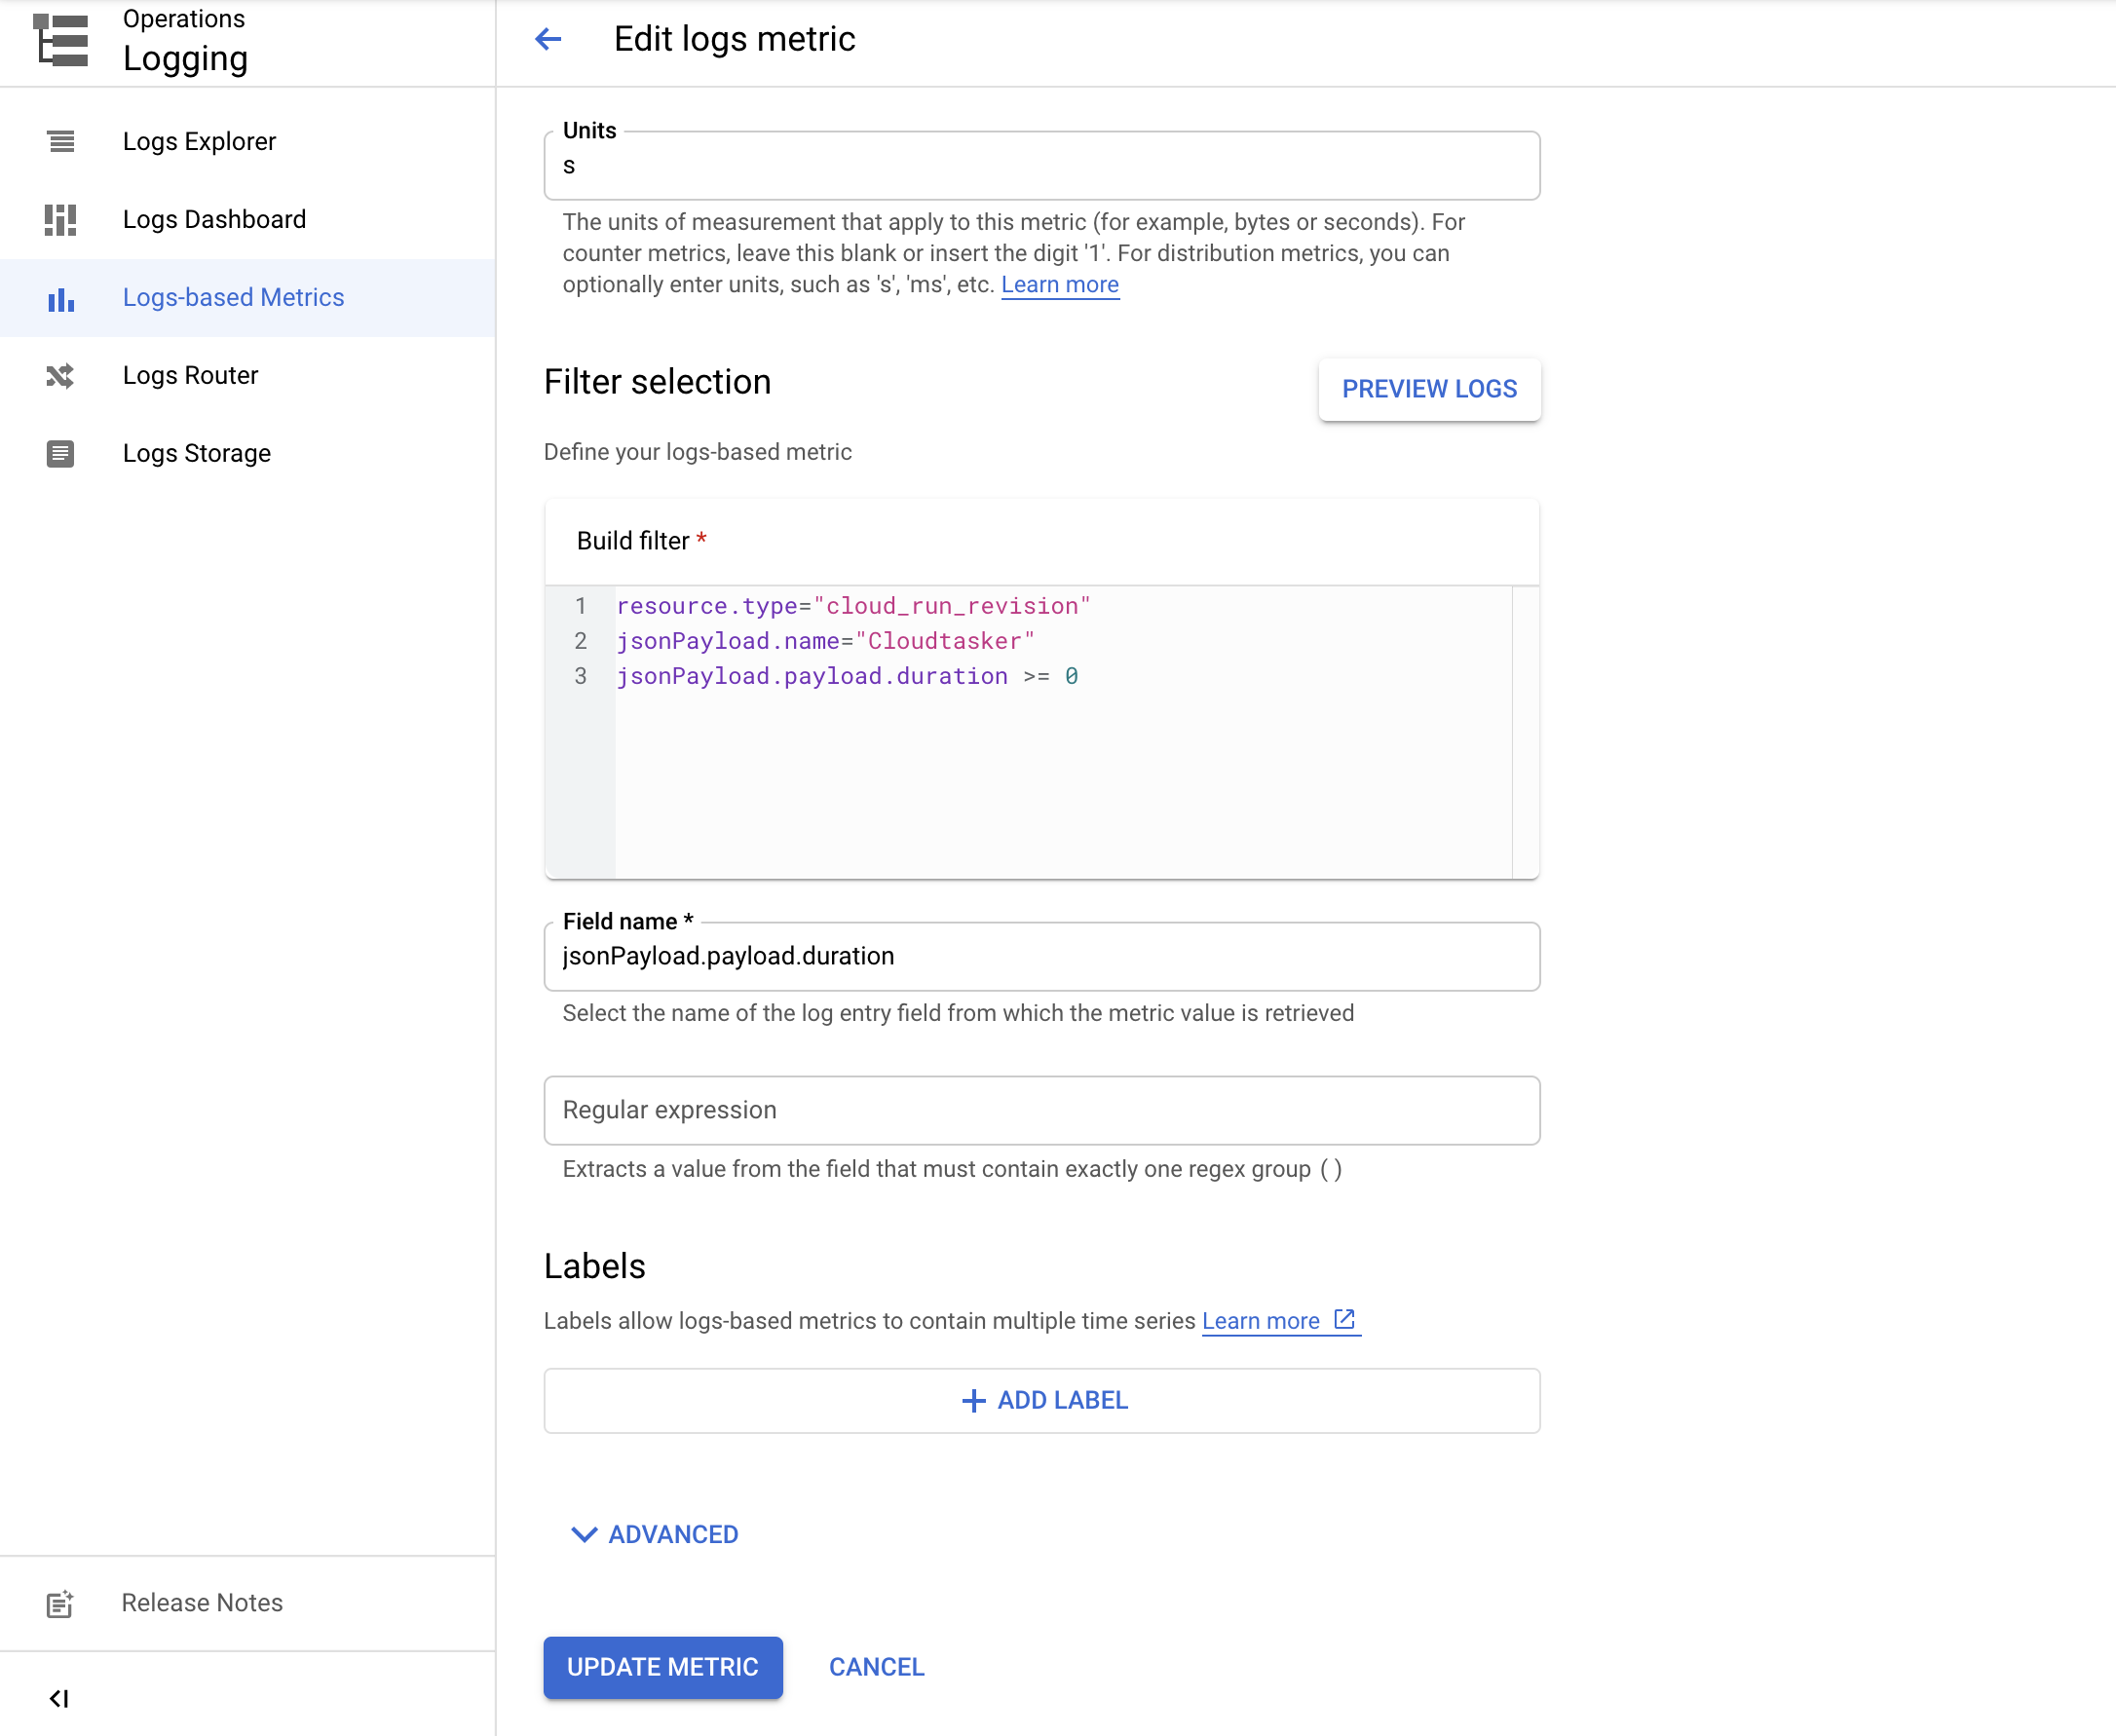
The metric is not retroactive and you will need to wait a few minutes before data become available (depending on your job volume).
Now that you have this custom metric in place, let's create a chart displaying the log duration per service.
Use the metrics explorer with the following configuration:
- Metric: logging.googleapis.com/user/cloudtasker/job_duration
- Group by: service_name
- Aggregator: 99th percentile
- Period: 1 minute
This will generate the following chart:
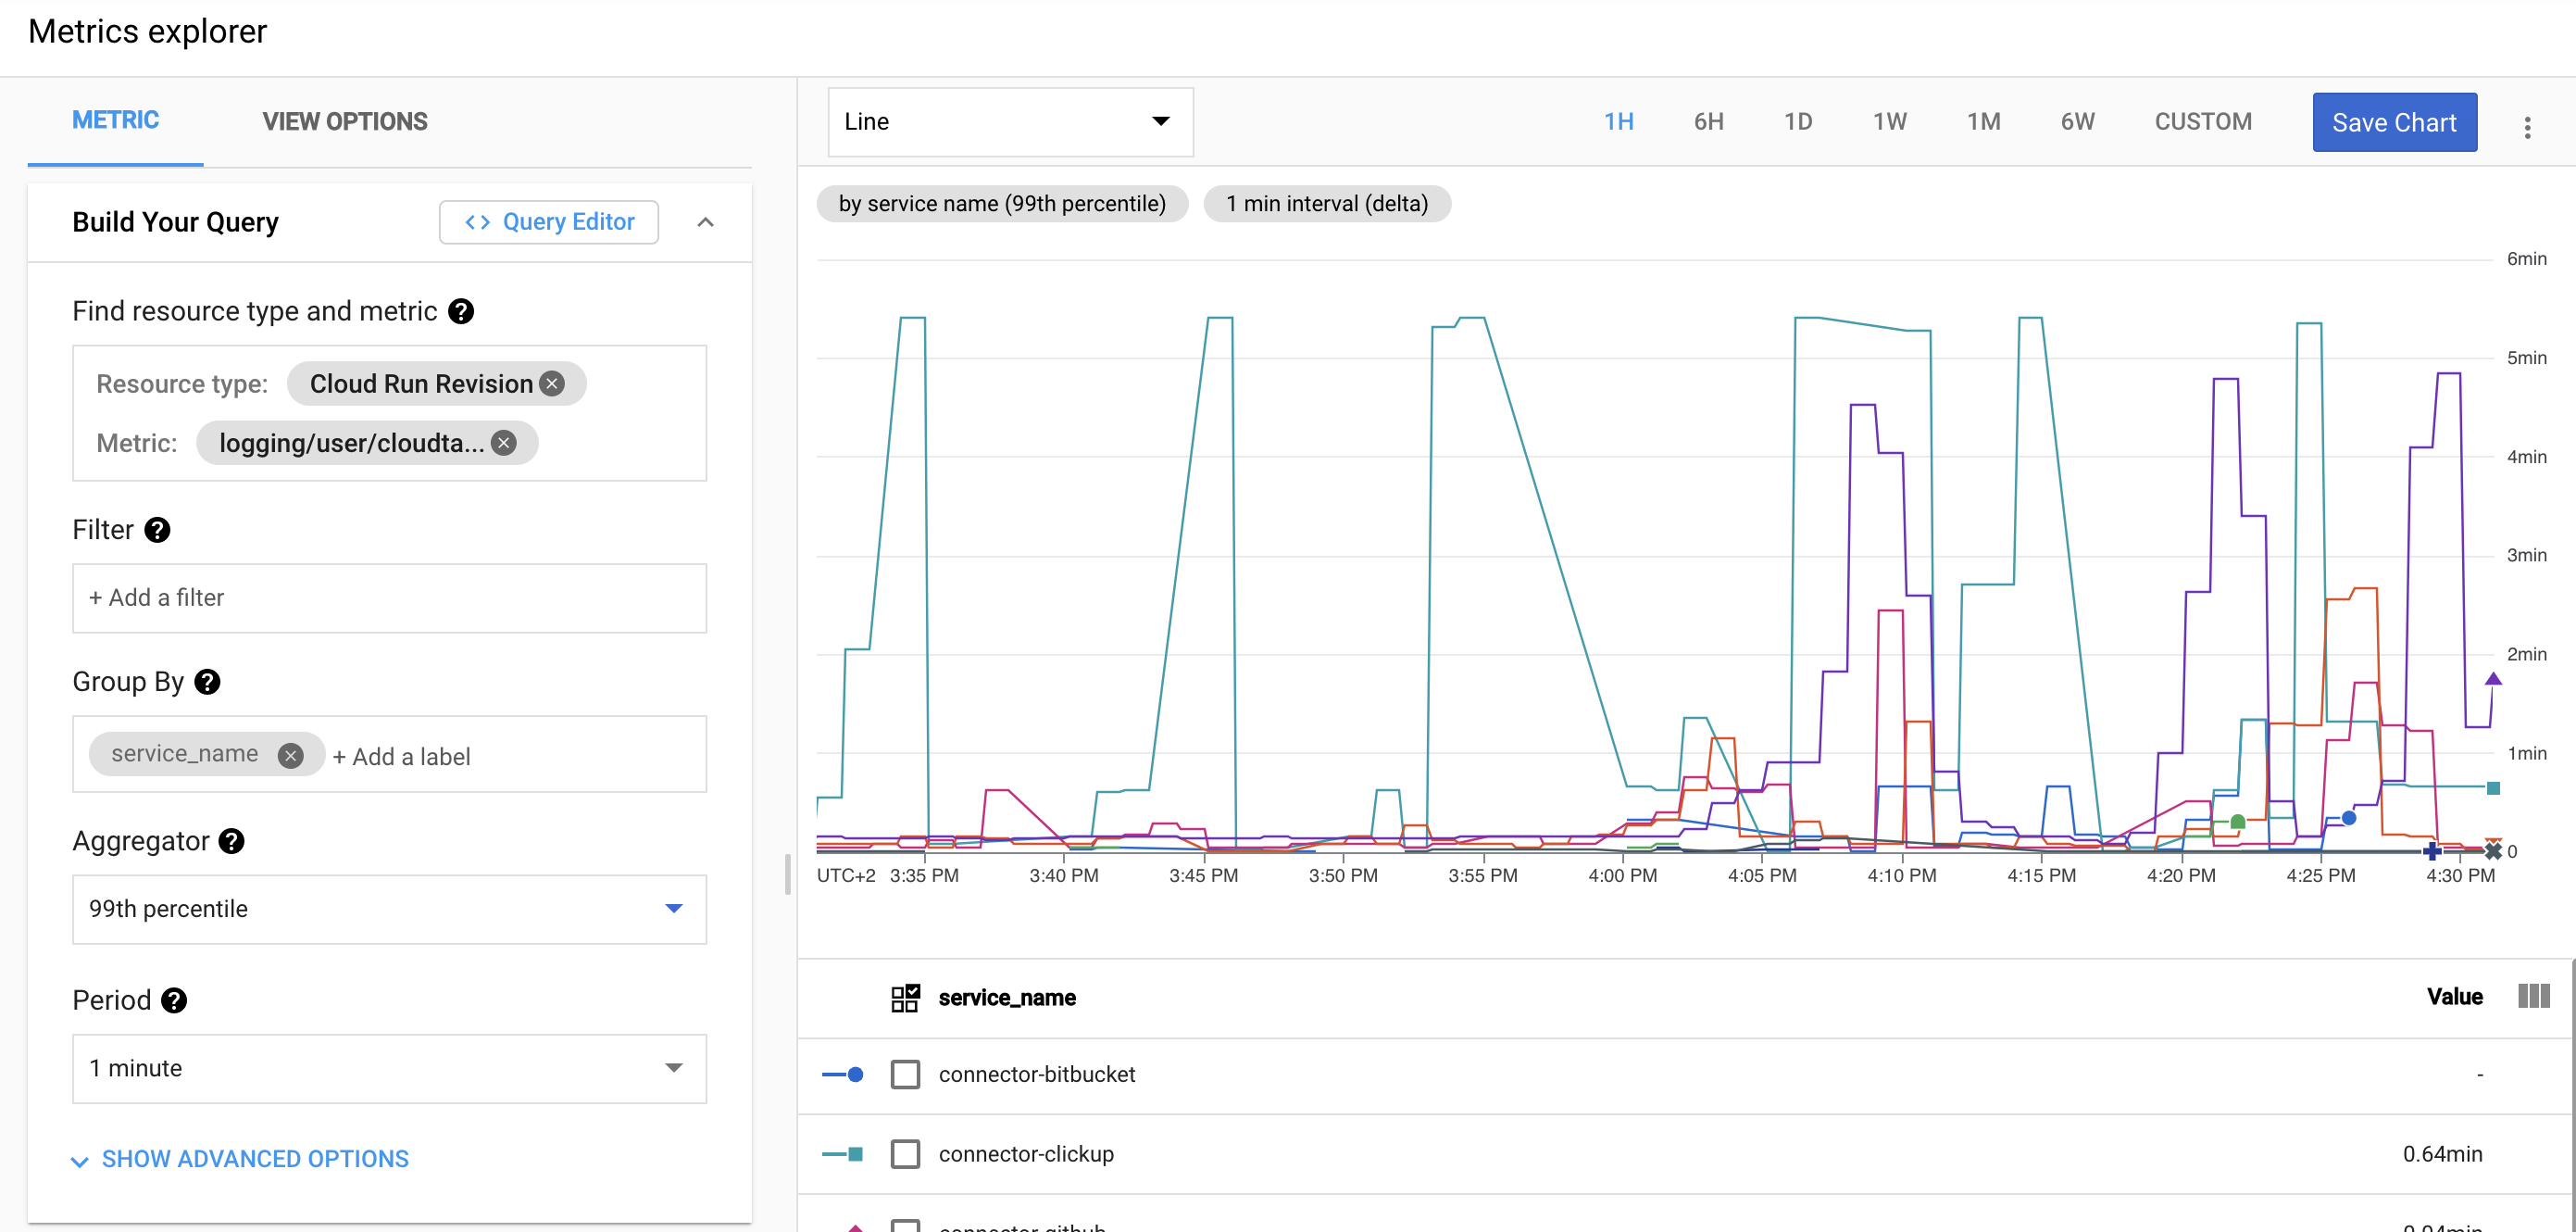
You can also click here to build this chart automatically.
Redis memory (Cloudtasker-specific)
If you use Cloudtasker Batch or payload storage in Redis then you better monitor your Redis memory usage.
Reaching your maximum memory on Redis means you'll have jobs failing due to lack of memory OR because keys will have been evicted automatically (depending on your maxmemory-policy on Redis).
Use the metrics explorer with the following configuration:
- Metric: redis.googleapis.com/stats/memory/usage
- Aggregator: None
- Period: 1 minute
This will generate the following chart:
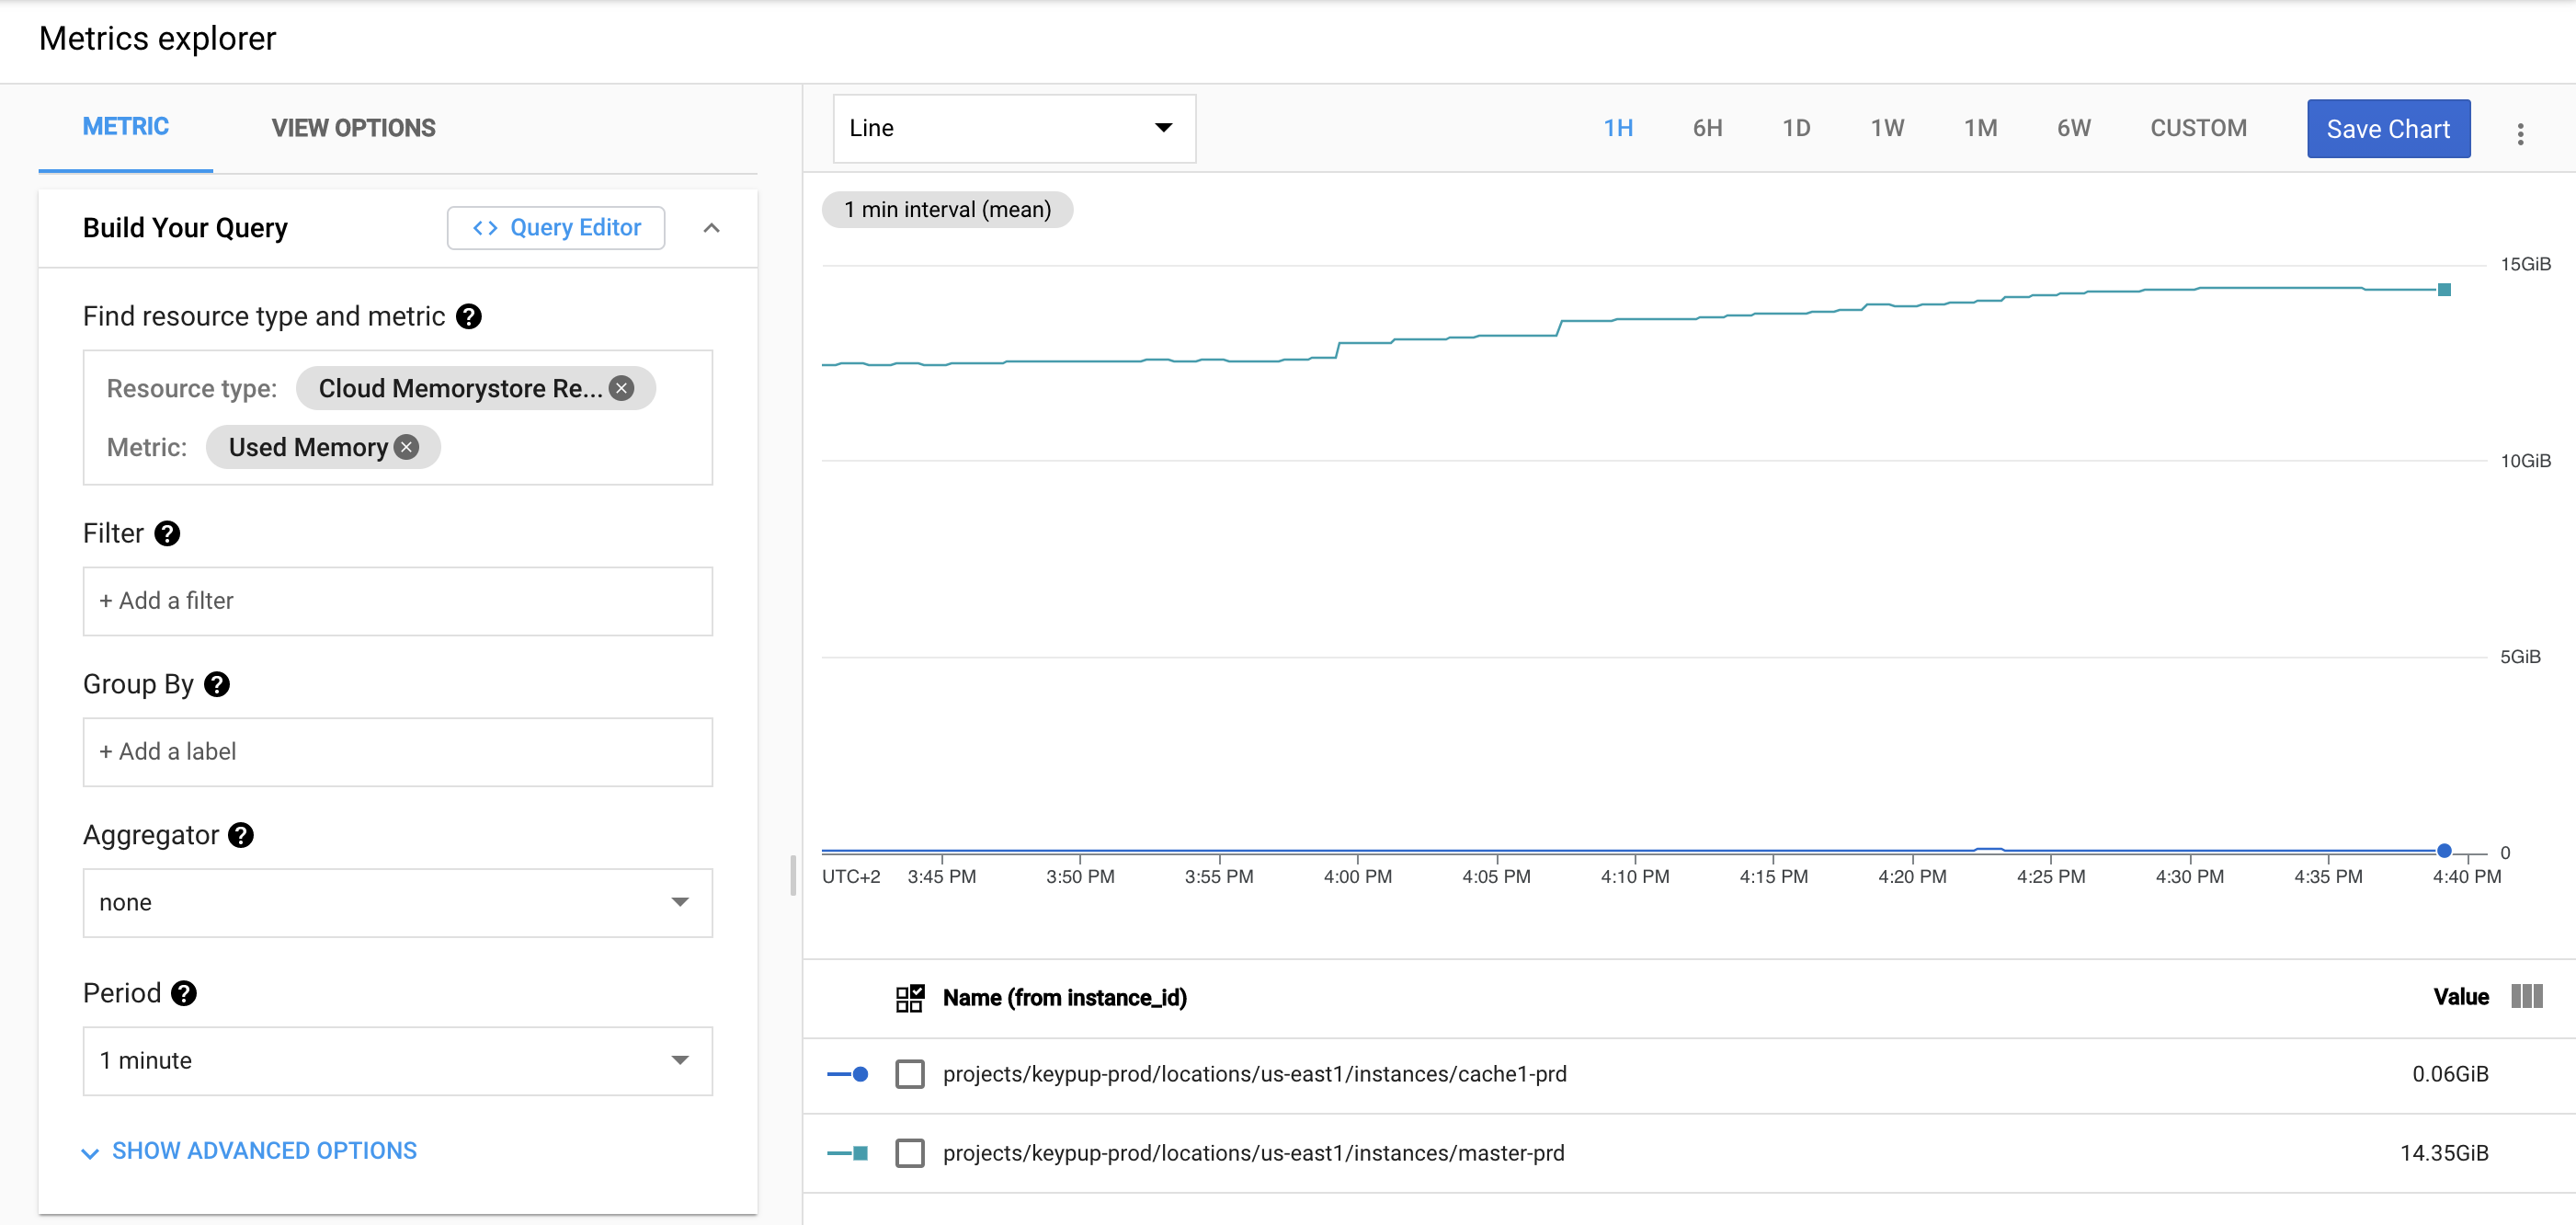
You can also click here to build this chart automatically.
Note that it is usually good practice to separate your Rails cache Redis instance from your Cloudtasker Redis instance.
General caching with Rails is usually non-critical and can generally be repopulated at runtime.
On the other side Cloudtasker uses Redis as a persistent store for Batch jobs and payload storage - storage is therefore critical and letting Redis evict Cloudtasker keys will lead to failed jobs.
Wrapping up
The four metrics above should give you a nice overview of how your job processing load is being handled by your platform.
If you need more fine-tuned metrics you should create new Logs-based metrics to extract and aggregate specific log values, the same way we did for the "Job duration" metric.
You could even go as far as logging specific values using the Cloudtasker logger (e.g. API call response time) and then capturing these values in custom log-based metrics on GCP. Possibilities are endless from there!
About us
Keypup's SaaS solution allows engineering teams and all software development stakeholders to gain a better understanding of their engineering efforts by combining real-time insights from their development and project management platforms. The solution integrates multiple data sources into a unified database along with a user-friendly dashboard and insights builder interface. Keypup users can customize tried-and-true templates or create their own reports, insights and dashboards to get a full picture of their development operations at a glance, tailored to their specific needs.
Code snippets hosted with ❤ by GitHub