TL;DR; Using Cloud Run? Connect to your database instances using a Serverless VPC Connector instead of going through the native Cloud SQL connection. This will ensure you never hit the Cloud SQL Admin connect API quota as your services scale up during peak time.
So you've just released your application on Cloud Run and used the native Cloud SQL connection to connect to your database. Great! So far so good.
Suddenly your application traffic spikes up. You think it's alright because Cloud Run automatically scales up your containers...but instead you start seeing a bunch of Cloud SQL connection failed errors in your logs that look like:
Well this is a common pitfall when using the native Cloud SQL connection from Cloud Run.
The native connection leverages the Cloud SQL Auth proxy which in turns makes requests to the Cloud SQL Admin API. This API - like all GCP APIs - has throttling quotas which will prevent containers from starting once reached.
The throttling quota refreshes every minute. This means your service may be prevented to scale up for one minute - or more if you have a lot of traffic and you keep reaching the quota every minute.
You could of course request a quota increase, but that's not a scalable approach. A better way is to connect to Cloud SQL using a Serverless VPC Connector. Here is how.
Creating a VPC Connector
A VPC connector allows you to access your private network from Cloud Run and Cloud Functions. It acts as a secure bridge to your private instances such as Memorystore, Cloud SQL, private VMs etc.
To create a connector, go to VPC network > Serverless VPC:
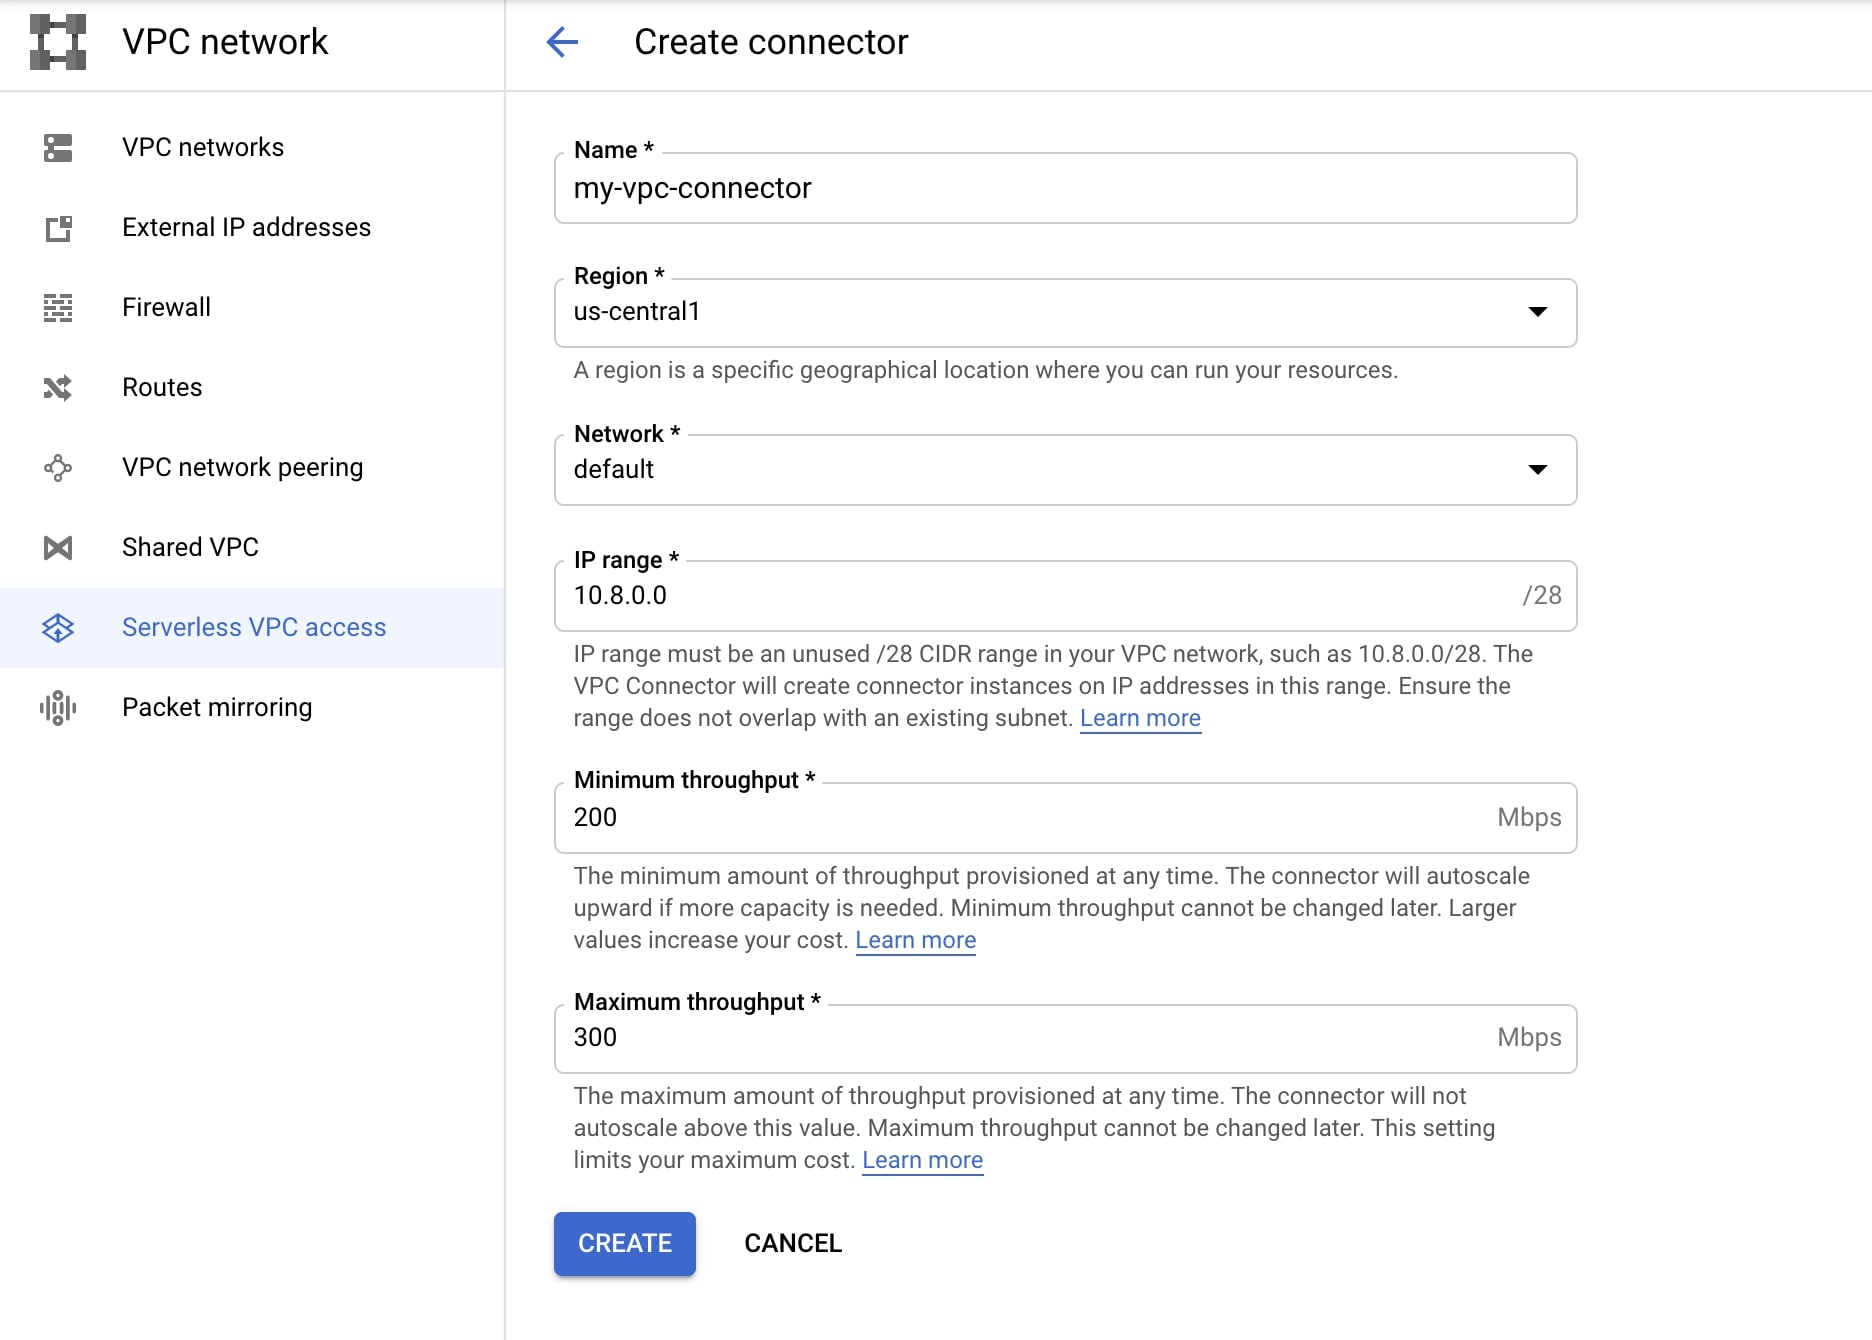
Choose a name, then select the region and network where your private resources are located. If you have never created a custom network then you can simply choose the 'default' network - that's probably where your resources are.
Finally choose an IP range for the connector (the default 10.8.0.0/28 is fine).
Just wait for the VPC connector to be provisioned and you're done. Now let's configure our application to connect to Cloud SQL via this VPC connector.
Linking Cloud Run services to your database
First, take note of the private IP address of your database. You need to use this IP in the database configuration file of your application.
Here is an example for Rails:
Don't re-deploy just yet. We need to link our Cloud Run service to the VPC Connector. There are two options to do so.
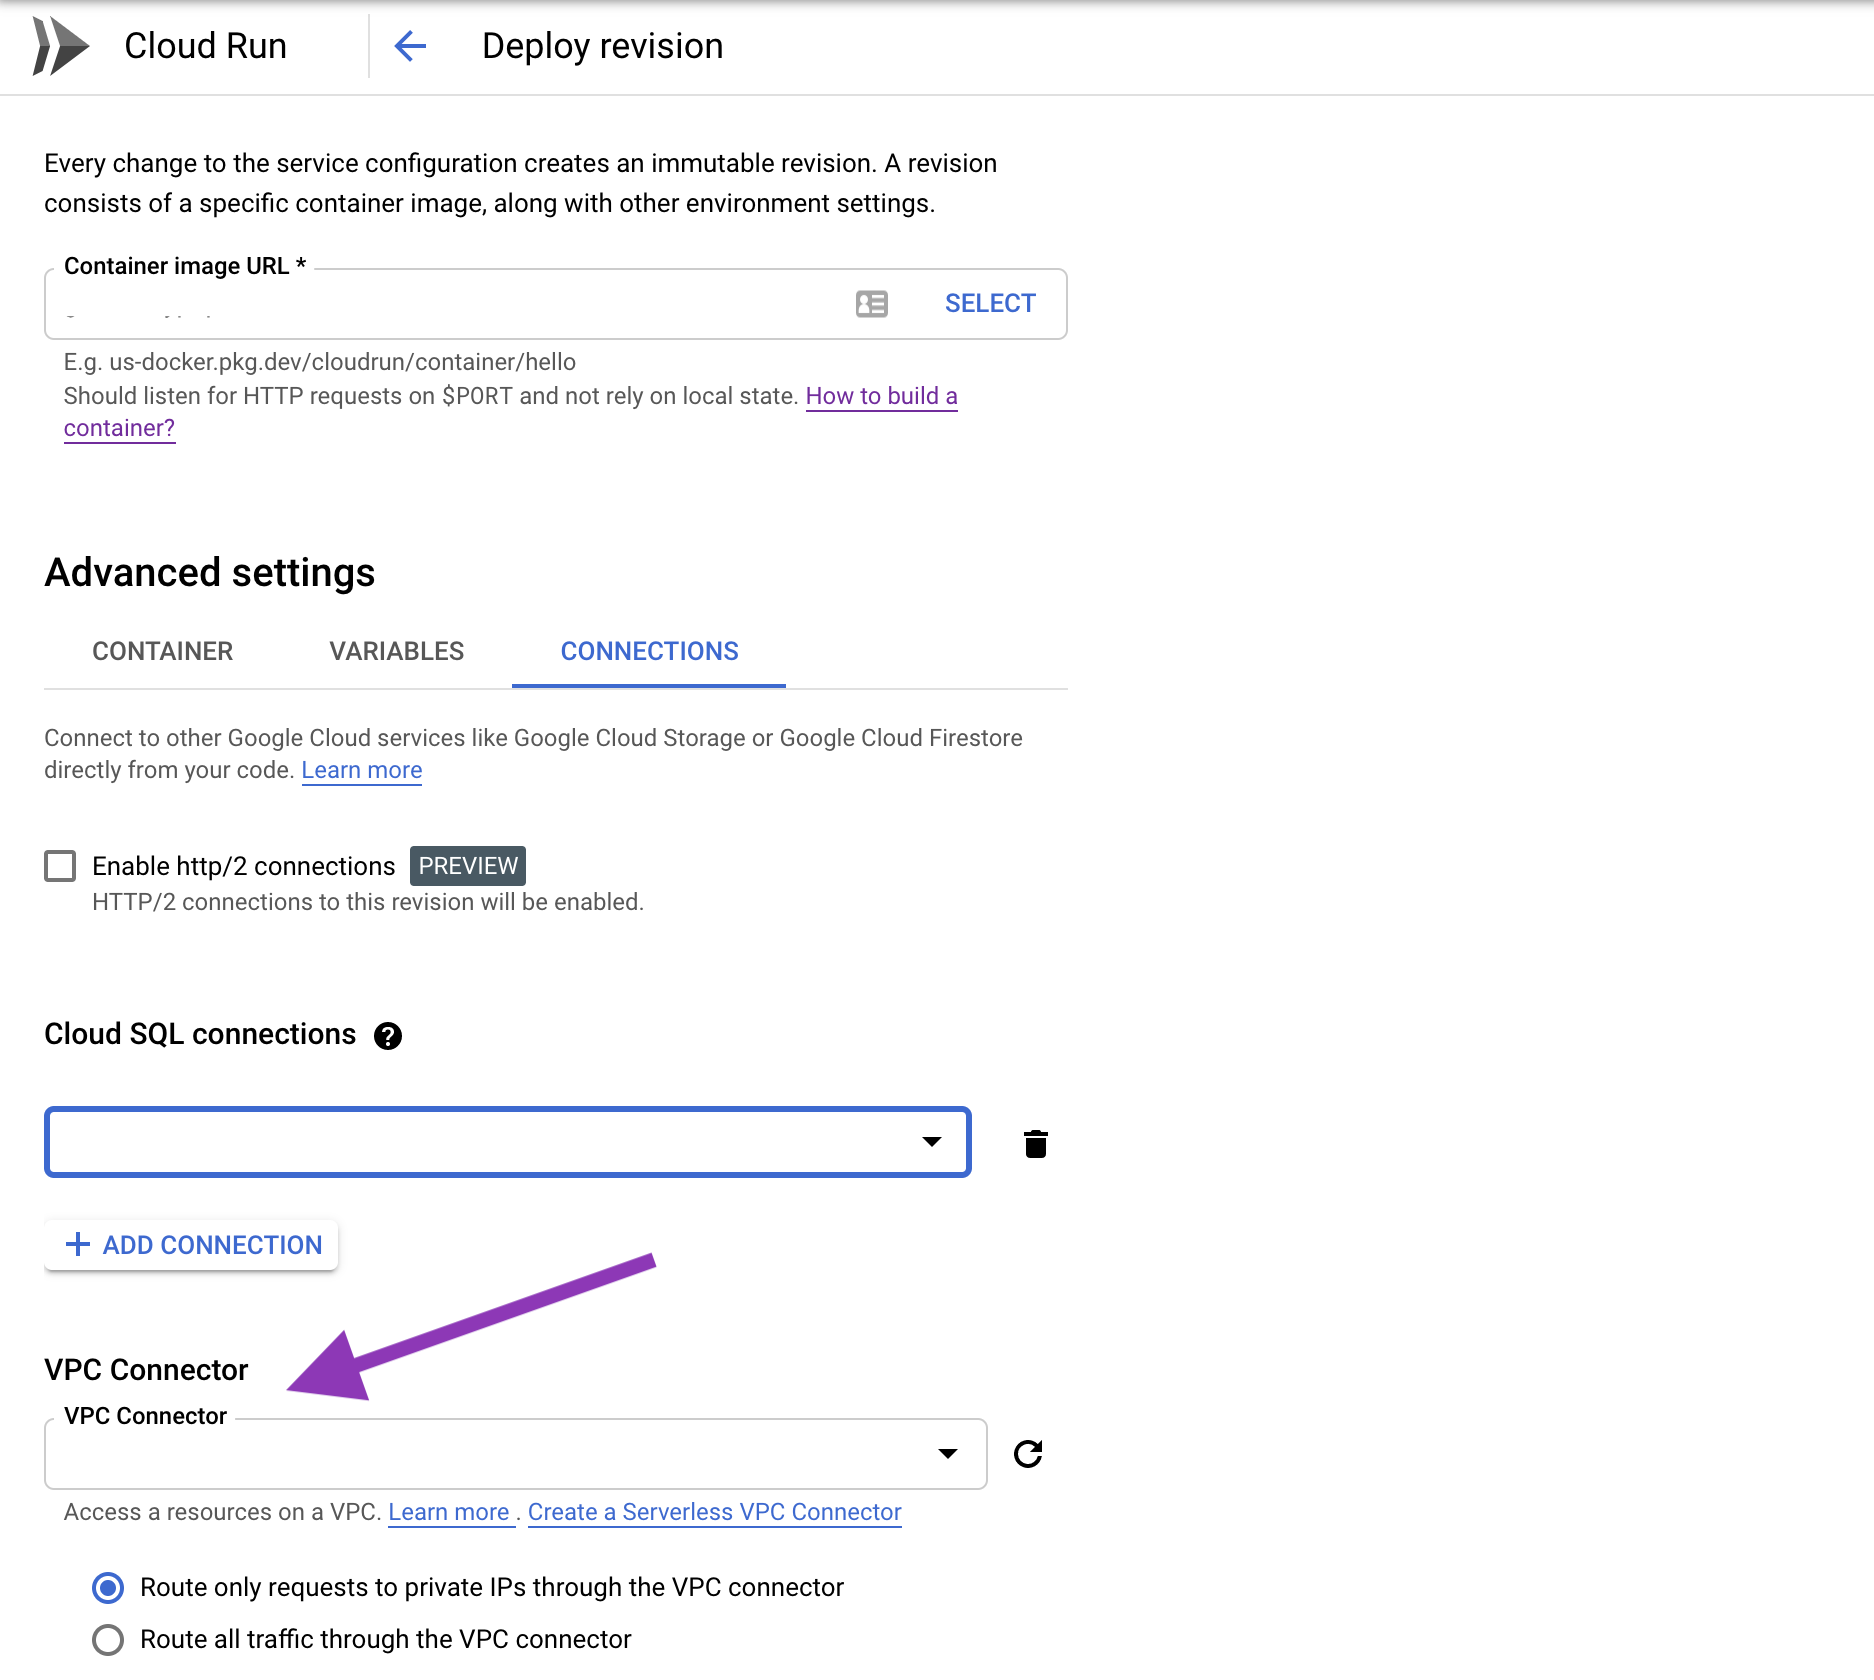
Option 1: go to the Cloud Run Console, click on Edit Revision and link your service to your newly created connector:
Option 2: use the gcloud CLI to re-deploy your application and add the --vpc-connector parameter to the deploy command.
Once done with the above, you can safely re-deploy your application to include the new database configuration file. Keep an eye on your logs for any database connection error just in case of misconfiguration.
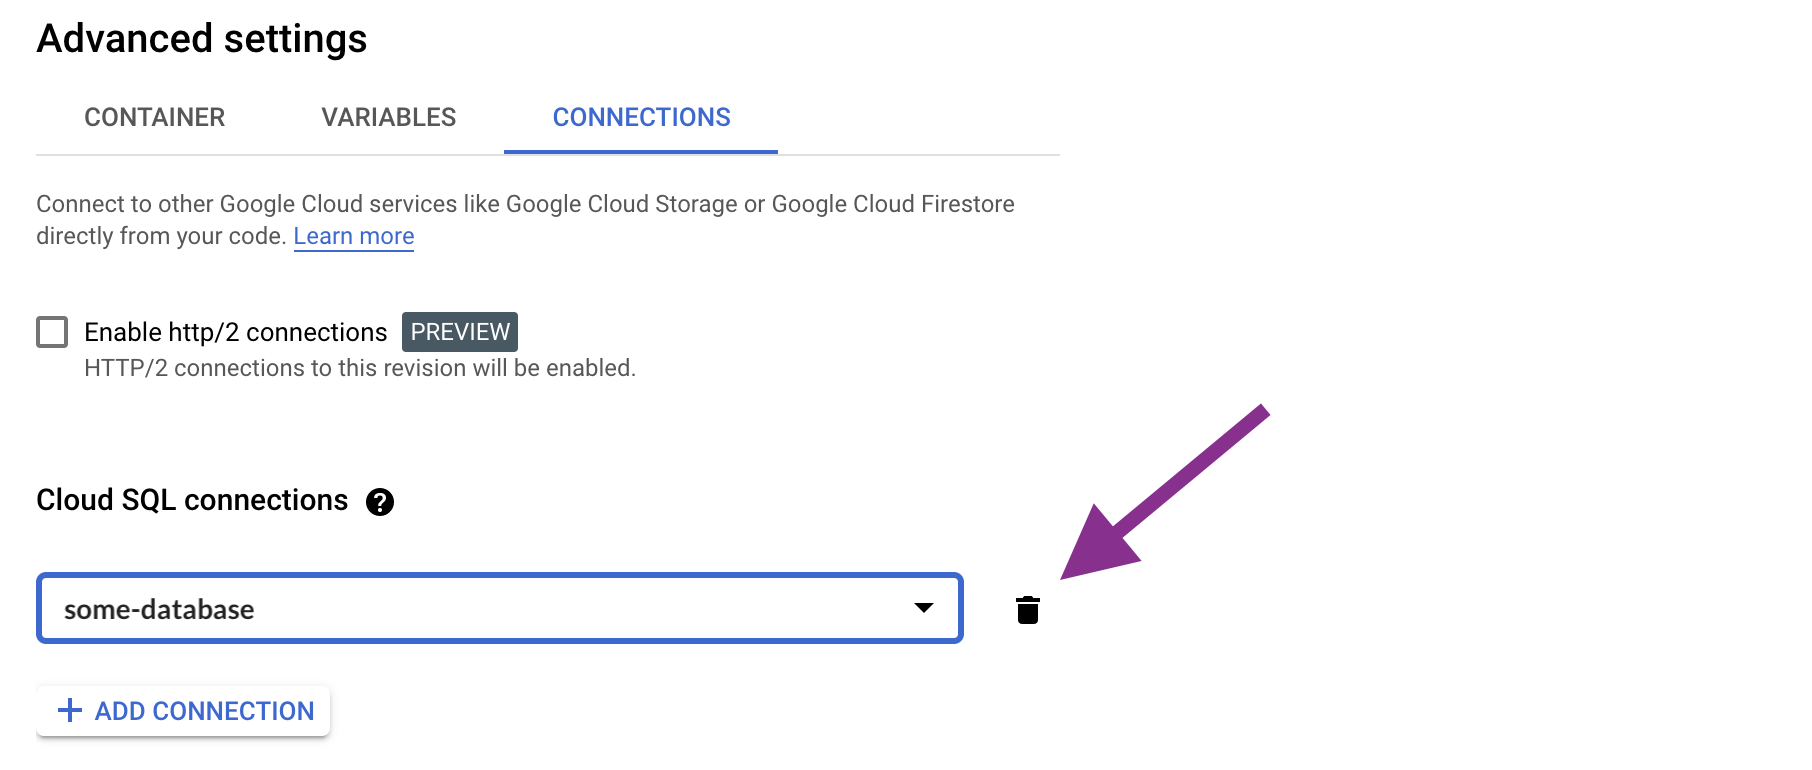
If you were previously using the native Cloud SQL connection on your Cloud Run service you should now remove it to avoid quota issues.
That's it. We're done with our migration here. Welcome to a sql-connection-quota-free world!
Now I don't like introducing new resources on my infrastructure without proper monitoring. Let's see how we can keep an eye on this new VPC connector.
Monitoring the VPC Connector
The VPC connector - like any other resource - has limits. In this case, bandwidth limit. It seems high at first but may eventually get overwhelmed as your infrastructure grows.
Knowing when you're about to hit the bandwidth limit so as to upgrade/deploy more VPC connectors will save you the pain of investigating why traffic to your internal infrastructure is becoming slow or throttled.
Let's head to Monitoring > Metric Explorer.
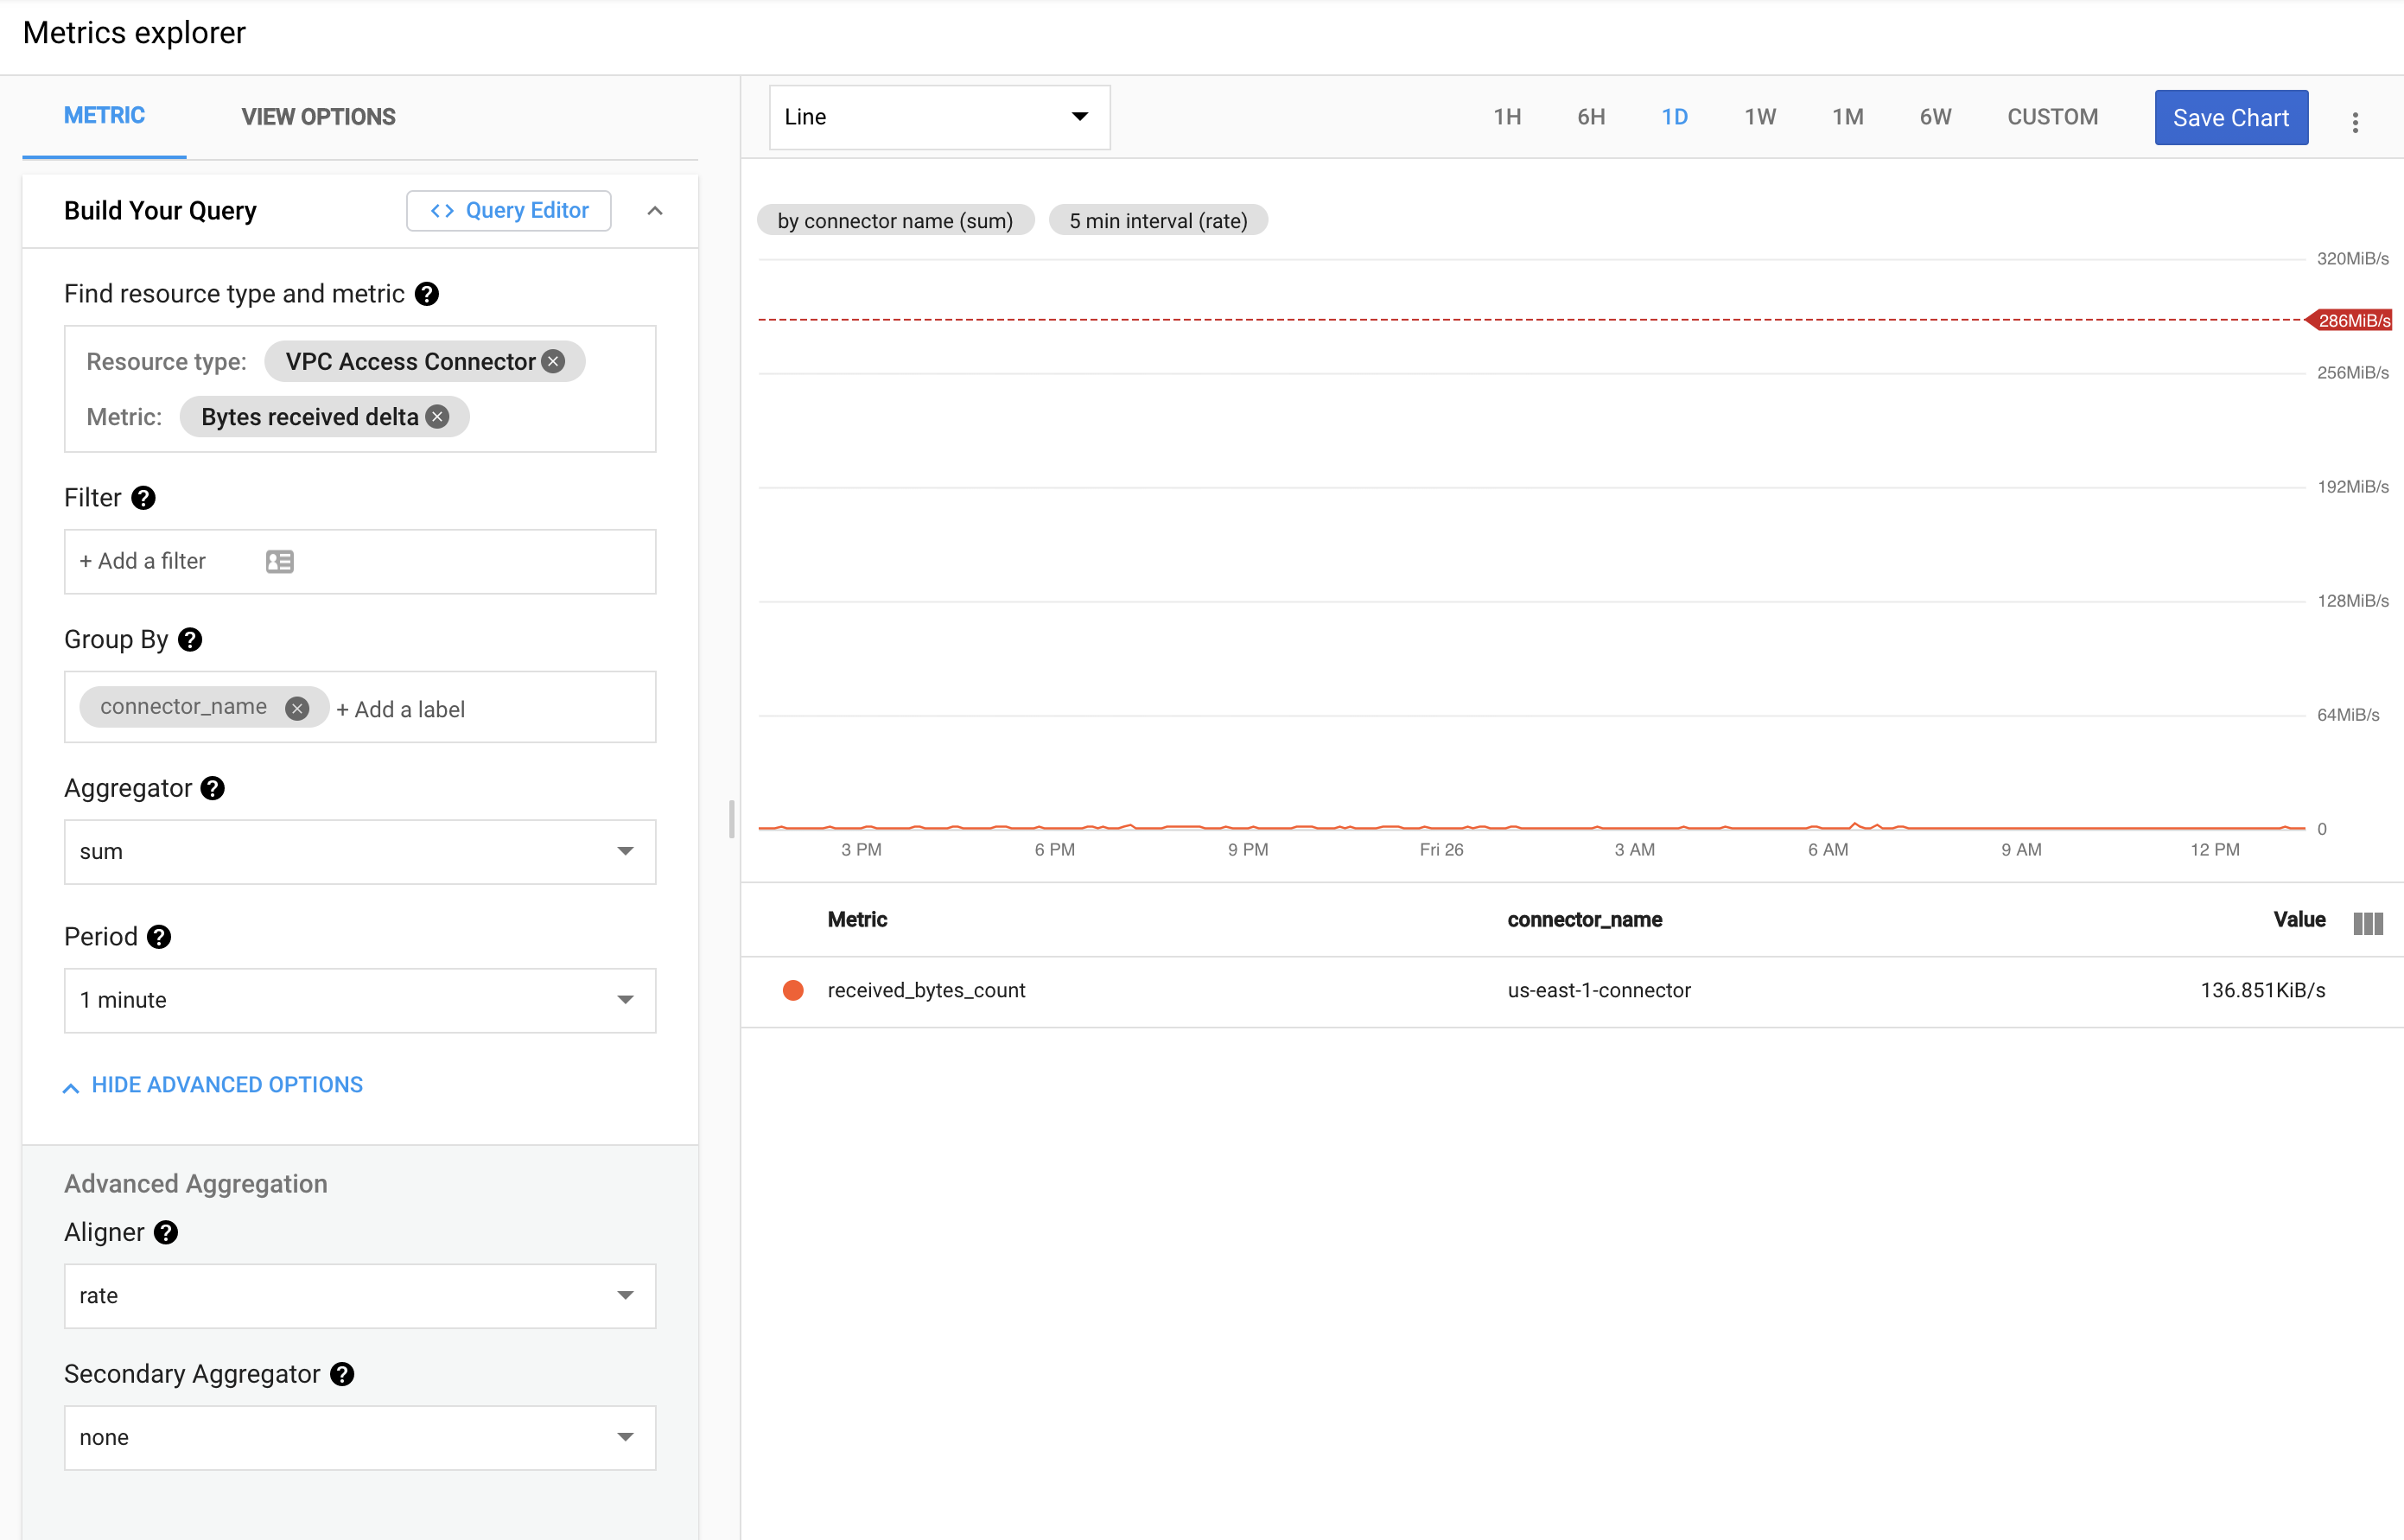
Choose a standard line chart. Then select VPC Access Connector for the resource type and Bytes received delta as the metric. I also recommend you you group by connector_name.
Finally go to view options and set a threshold corresponding to the max throughput of your VPC connector. The default max throughput is 300Mbps so you can use this value (= 300000000B for the threshold value) if you didn't edit the scalability settings of your connector.
The end result will look like this:
Alternatively, click on this metrics explorer link to see a live version of this chart in your console. The last thing you need to do is add this chart to your favourite monitoring dashboard.
Now you're all set with your VPC connector!
About us
Keypup's SaaS solution allows engineering teams and all software development stakeholders to gain a better understanding of their engineering efforts by combining real-time insights from their development and project management platforms. The solution integrates multiple data sources into a unified database along with a user-friendly dashboard and insights builder interface. Keypup users can customize tried-and-true templates or create their own reports, insights and dashboards to get a full picture of their development operations at a glance, tailored to their specific needs.
Code snippets hosted with ❤ by GitHub