The Ramp-Up Tax: Why Nobody Can Measure How Long New Engineers Take to Become Productive
Enterprises hire hundreds of engineers a year, but almost none can say how long it takes them to ship at full speed, where they get stuck, or whether onboarding is improving. Learn what engineering leaders on Reddit say about the onboarding ramp-up tax, and how Keypup MCP uses pull request, review and Jira data to measure time to first merge, ramp-up curves, review friction and onboarding load.
TL;DR: Large engineering organizations onboard hundreds of engineers a year, and every one of them takes months to reach full speed. Almost nobody measures how many months, where new joiners get stuck, or whether onboarding changes actually help — so the cost of slow onboarding never shows up anywhere. This is the ramp-up tax. The Keypup MCP Server reads every pull request's author, creation and merge dates, review requests, reviews and change requests, size and repository, plus the Jira issues it resolves. Your AI assistant can then find each author's first pull request, measure time to first merge, plot ramp-up curves by cohort, compare what new and tenured engineers' pull requests go through, show which repositories are hardest to onboard into, and reveal which reviewers carry the onboarding load.
Every headcount plan contains the same quiet assumption: a new engineer joins on Monday and starts delivering soon after. Finance budgets the salary from day one. The roadmap counts the capacity from the first sprint. And six months later, someone asks why the team that grew by 30% isn't shipping 30% more.
The Friction: Onboarding Nobody Measures
Every engineering leader knows onboarding takes time. What almost none of them know is how much time, where it goes, and whether it's getting better. In large organizations the ramp-up stays invisible for structural reasons:
Onboarding ends on paper after week one. The laptop works, the accounts are created, the HR checklist is ticked. The real ramp-up — learning the codebase, the review culture and the unwritten rules — happens afterwards, and nobody tracks it.
"Productive" has no definition. Managers judge ramp-up by feel. One says "she's up to speed after a month", another says "it takes a year in this codebase". Neither can show data.
New joiners are spread everywhere. In an organization hiring 300 engineers a year, there are new joiners in nearly every team at any time. Their slower start is diluted into team averages and disappears.
The cost lands on someone else. Every new engineer's pull requests need reviews, explanations and rework from senior colleagues. That time is real, but it's never attributed to onboarding.
The result: onboarding is treated as an HR process, not as an engineering system with throughput, bottlenecks and a measurable cost.
Why This Matters: The Real Cost of an Unmeasured Ramp-Up
The Capacity Problem
If new engineers take six months to reach full throughput, a team that adds four people this quarter gains roughly two engineers' worth of delivery this half — not four. Plans built on headcount instead of ramp-up overcommit every time the organization grows.
The Retention Problem
Engineers who spend weeks waiting for their first pull request to be merged don't feel productive, and the first months are when people decide whether to stay. A slow, frustrating first merge is an early warning sign that's never surfaced.
The Senior Engineer Problem
Onboarding runs on the time of a few experienced reviewers. When that load isn't visible, it's not planned, and the same people end up both mentoring every new joiner and being the bottleneck on roadmap work.
The Enterprise Discussion: What Engineering Leaders Are Actually Saying
Onboarding and time-to-productivity come up constantly wherever engineering managers, directors and staff engineers at large organizations compare notes. The quotes below are representative of recurring threads on r/EngineeringManagers, r/ExperiencedDevs, r/cto and r/softwareengineering.
Director of Engineering, Enterprise SaaS (r/EngineeringManagers)
"We hired 120 engineers last year. Finance asked me how long it takes them to become productive and I said 'about three months'. Honestly, I made that number up. I have no idea, and I have no idea whether it's different in each org."
"My first PR at this company sat for nine days. Nobody was assigned, the CODEOWNERS file pointed at people who'd left, and when someone finally looked, they asked me to split it into four. I almost quit in month two."
Staff Engineer, Global Retail Platform (r/cto)
"I'm the go-to reviewer for every new hire in my area. It's probably a third of my week. It doesn't show up in any plan, and when I'm on holiday, onboarding in my part of the codebase basically stops."
The pattern holds: everyone agrees onboarding is slow and expensive, but nobody can show how slow, where it's slowest, or who is paying for it — because the evidence is scattered across thousands of pull requests and reviews.
How Keypup MCP Measures the Ramp-Up Tax
The Keypup Model Context Protocol (MCP) Server gives your AI assistant structured access to the pull requests and reviews Keypup imports from GitHub, GitLab, Bitbucket and Azure DevOps, and the issues it imports from Jira. For every pull request, that includes its author, repository, creation and merge dates, review request date, first review date, whether changes were requested, its reviewers, its lines changed, and the labels of the Jira issues it resolves when the pull request references the issue key. Every individual review is also available, with its reviewer, state and submission date.
Keypup doesn't import HR data, so it doesn't know anyone's start date. In the prompts below, a new author is someone whose first pull request in your connected repositories was opened in the period, and tenured authors are those who have been opening pull requests for more than 12 months. Engineers transferring from another part of the organization count as new authors if they've never contributed to the connected repositories before.
1. Sizing the Ramp-Up Tax
The first question is the one finance always asks: how long does it take?
MCP Prompt:
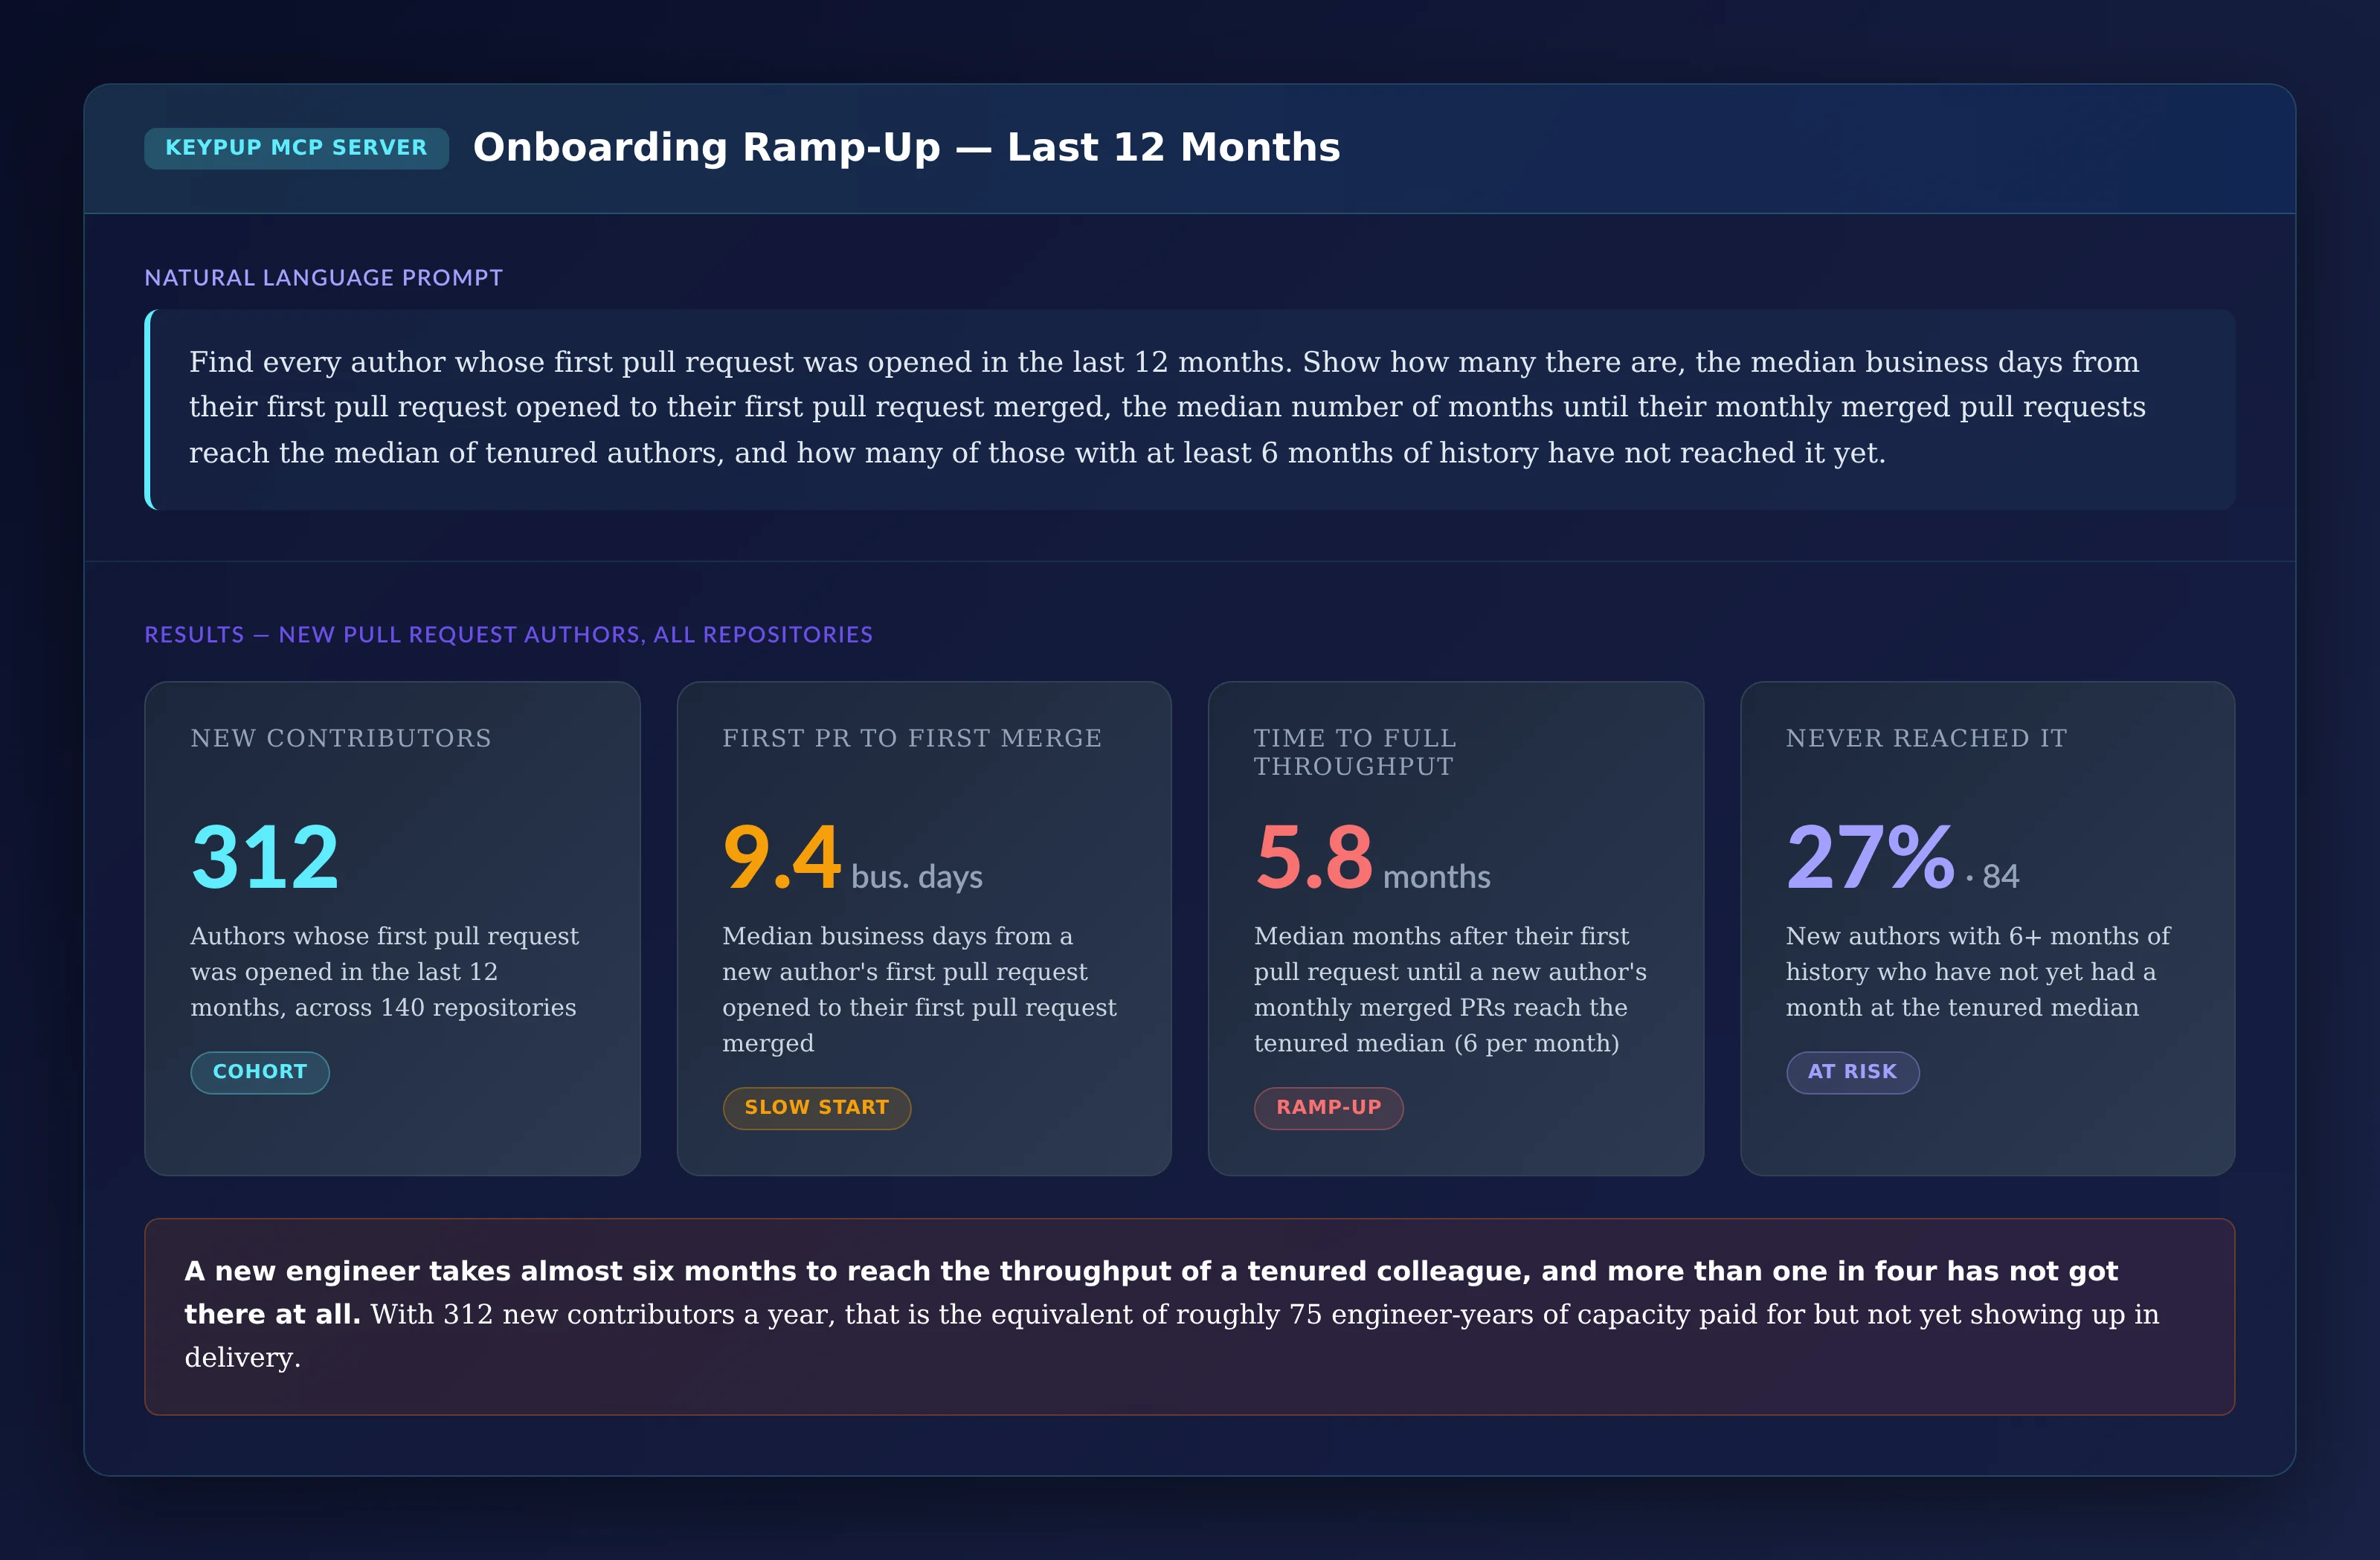
Find every author whose first pull request was opened in the
last 12 months. Show how many there are, the median business
days from their first pull request opened to their first pull
request merged, the median number of months until their
monthly merged pull requests reach the median of tenured
authors, and how many of those with at least 6 months of
history have not reached it yet.
Output: Onboarding Ramp-Up — Last 12 Months
Key Insight: It takes almost two weeks to merge a first pull request and almost six months to reach the throughput of a tenured colleague — and more than one new author in four hasn't reached it at all. With 312 new contributors a year, that's the equivalent of around 75 engineer-years of capacity paid for but not yet showing up in delivery.
2. Plotting the Ramp-Up Curve by Cohort
A single number sets the baseline. Comparing cohorts tells you whether onboarding is improving.
MCP Prompt:
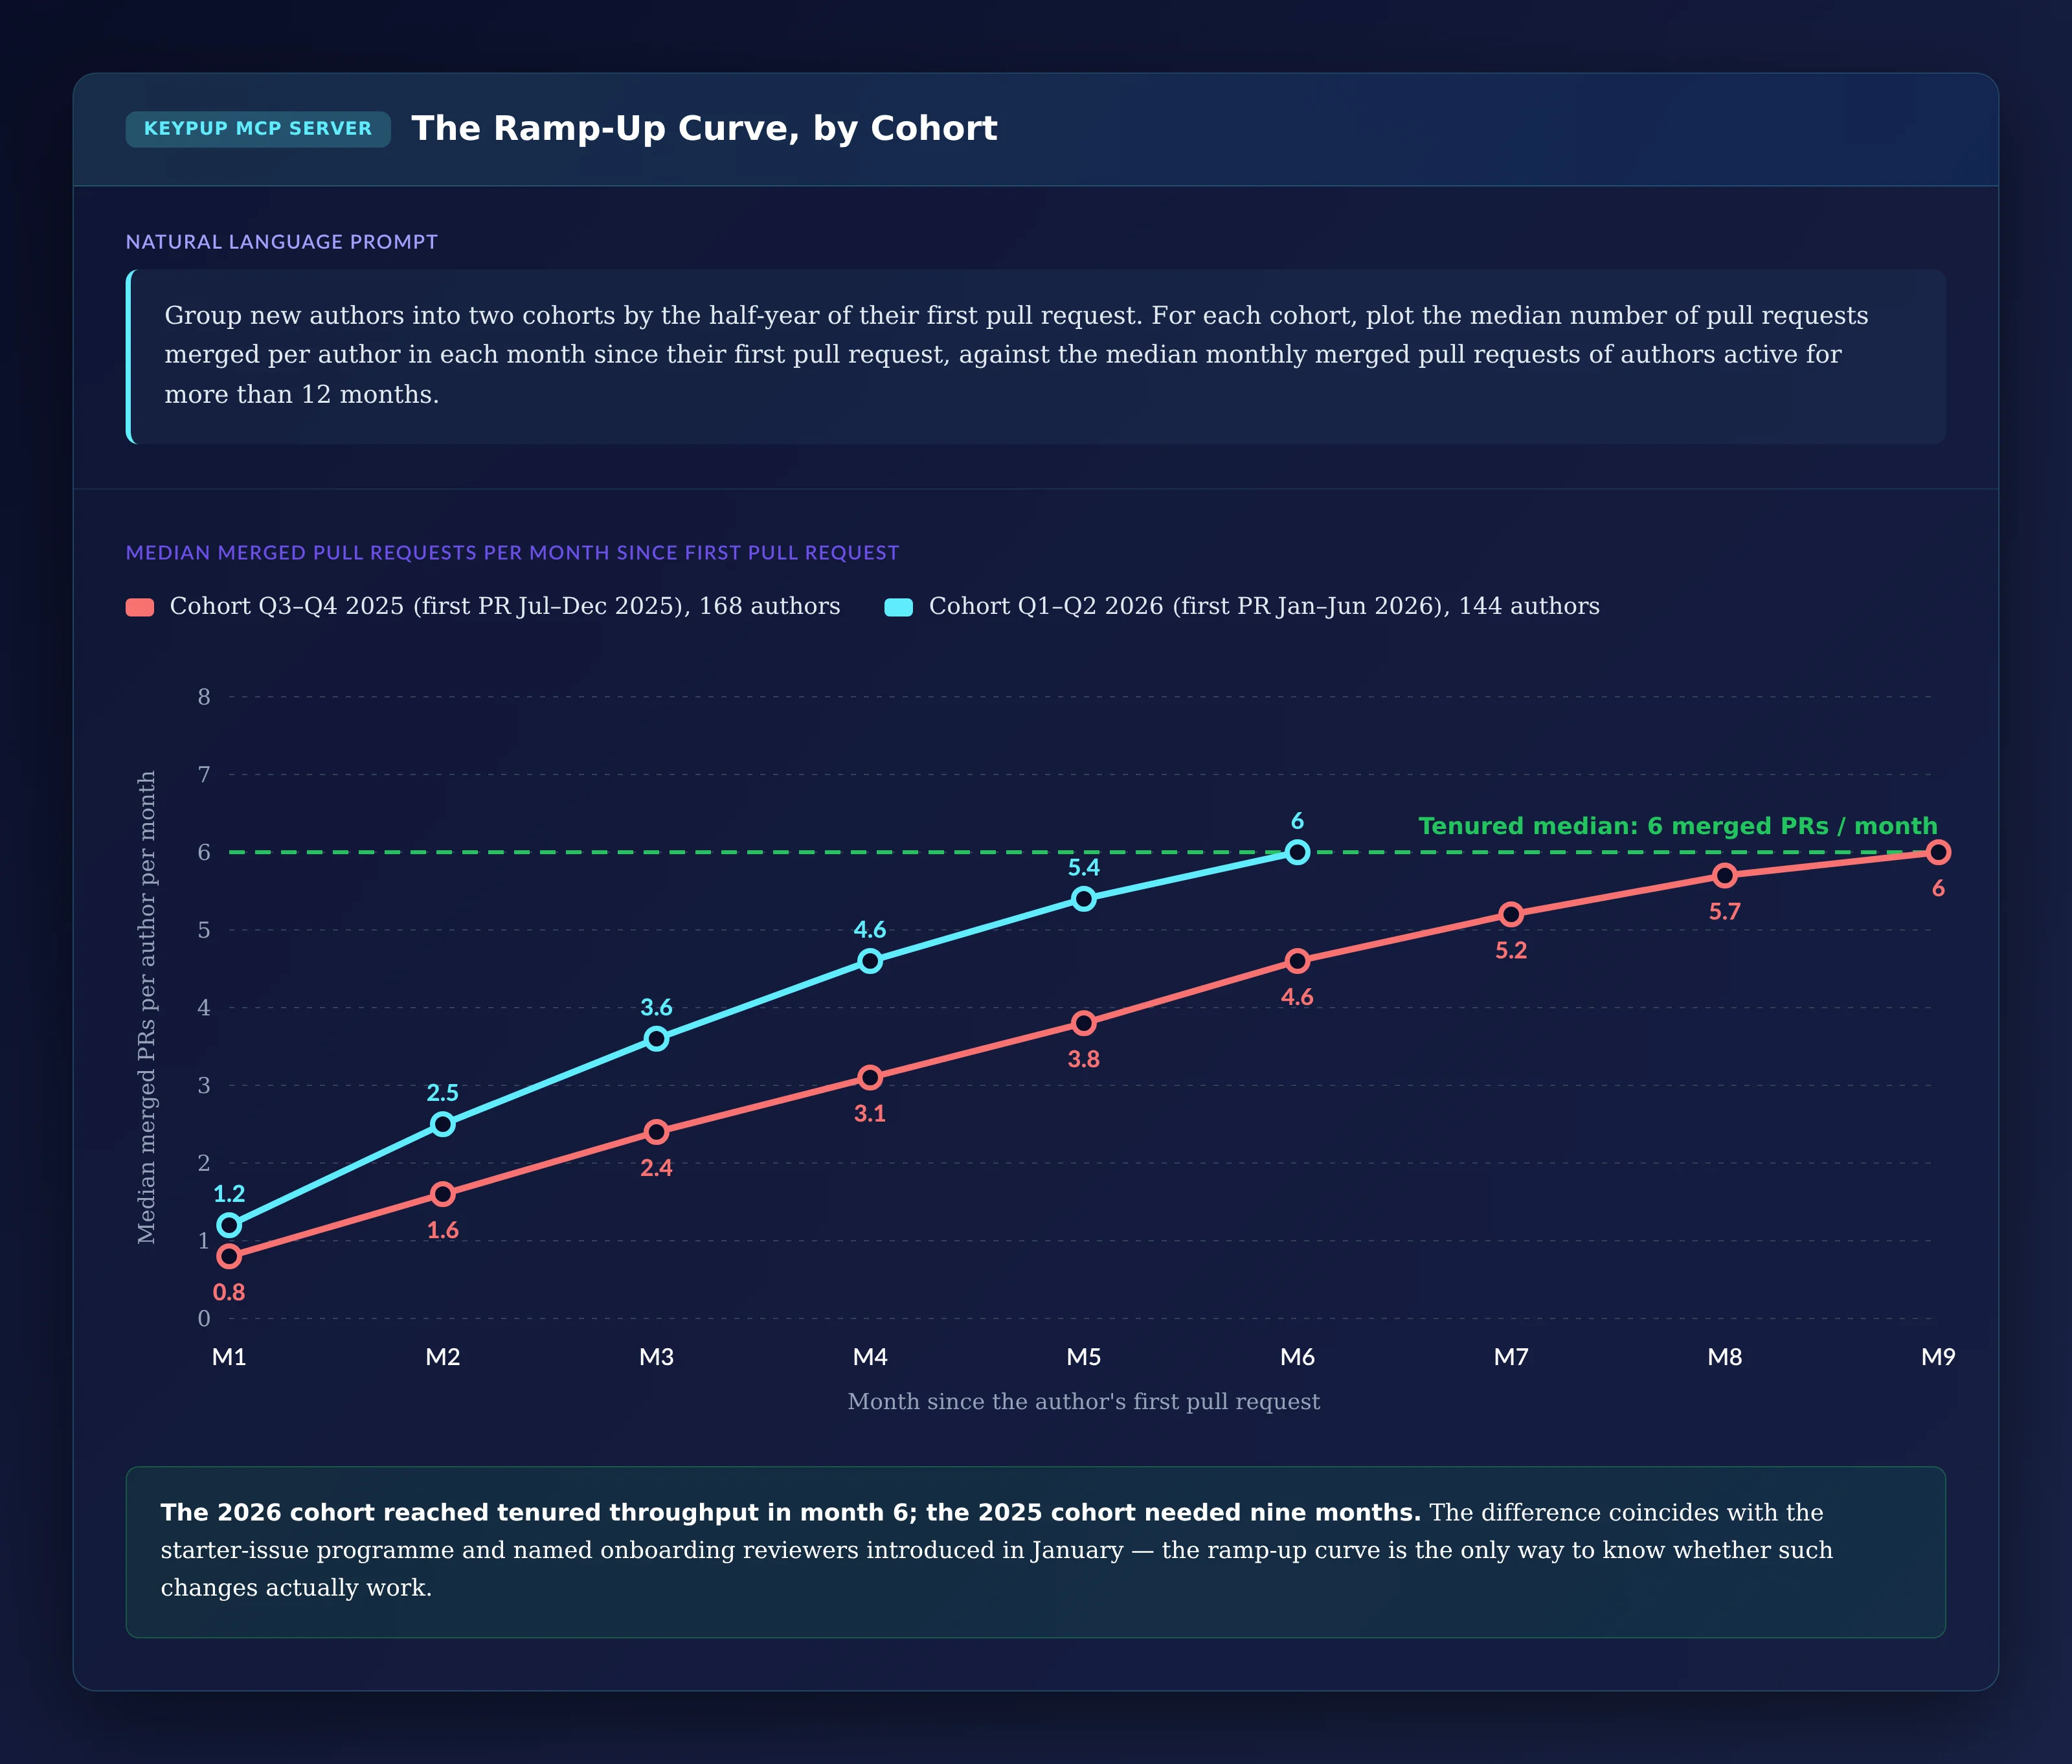
Group new authors into two cohorts by the half-year of their
first pull request. For each cohort, plot the median number of
pull requests merged per author in each month since their
first pull request, against the median monthly merged pull
requests of authors active for more than 12 months.
Output: The Ramp-Up Curve, by Cohort
Key Insight: The 2026 cohort reached tenured throughput three months earlier than the 2025 cohort. In this example, that coincides with a starter-issue programme and named onboarding reviewers introduced in January. Without the curve, the improvement would have been invisible — and so would a regression.
3. Comparing What New and Tenured Engineers' Pull Requests Go Through
Ramp-up is slow for a reason. Comparing the review experience shows where the time goes.
MCP Prompt:
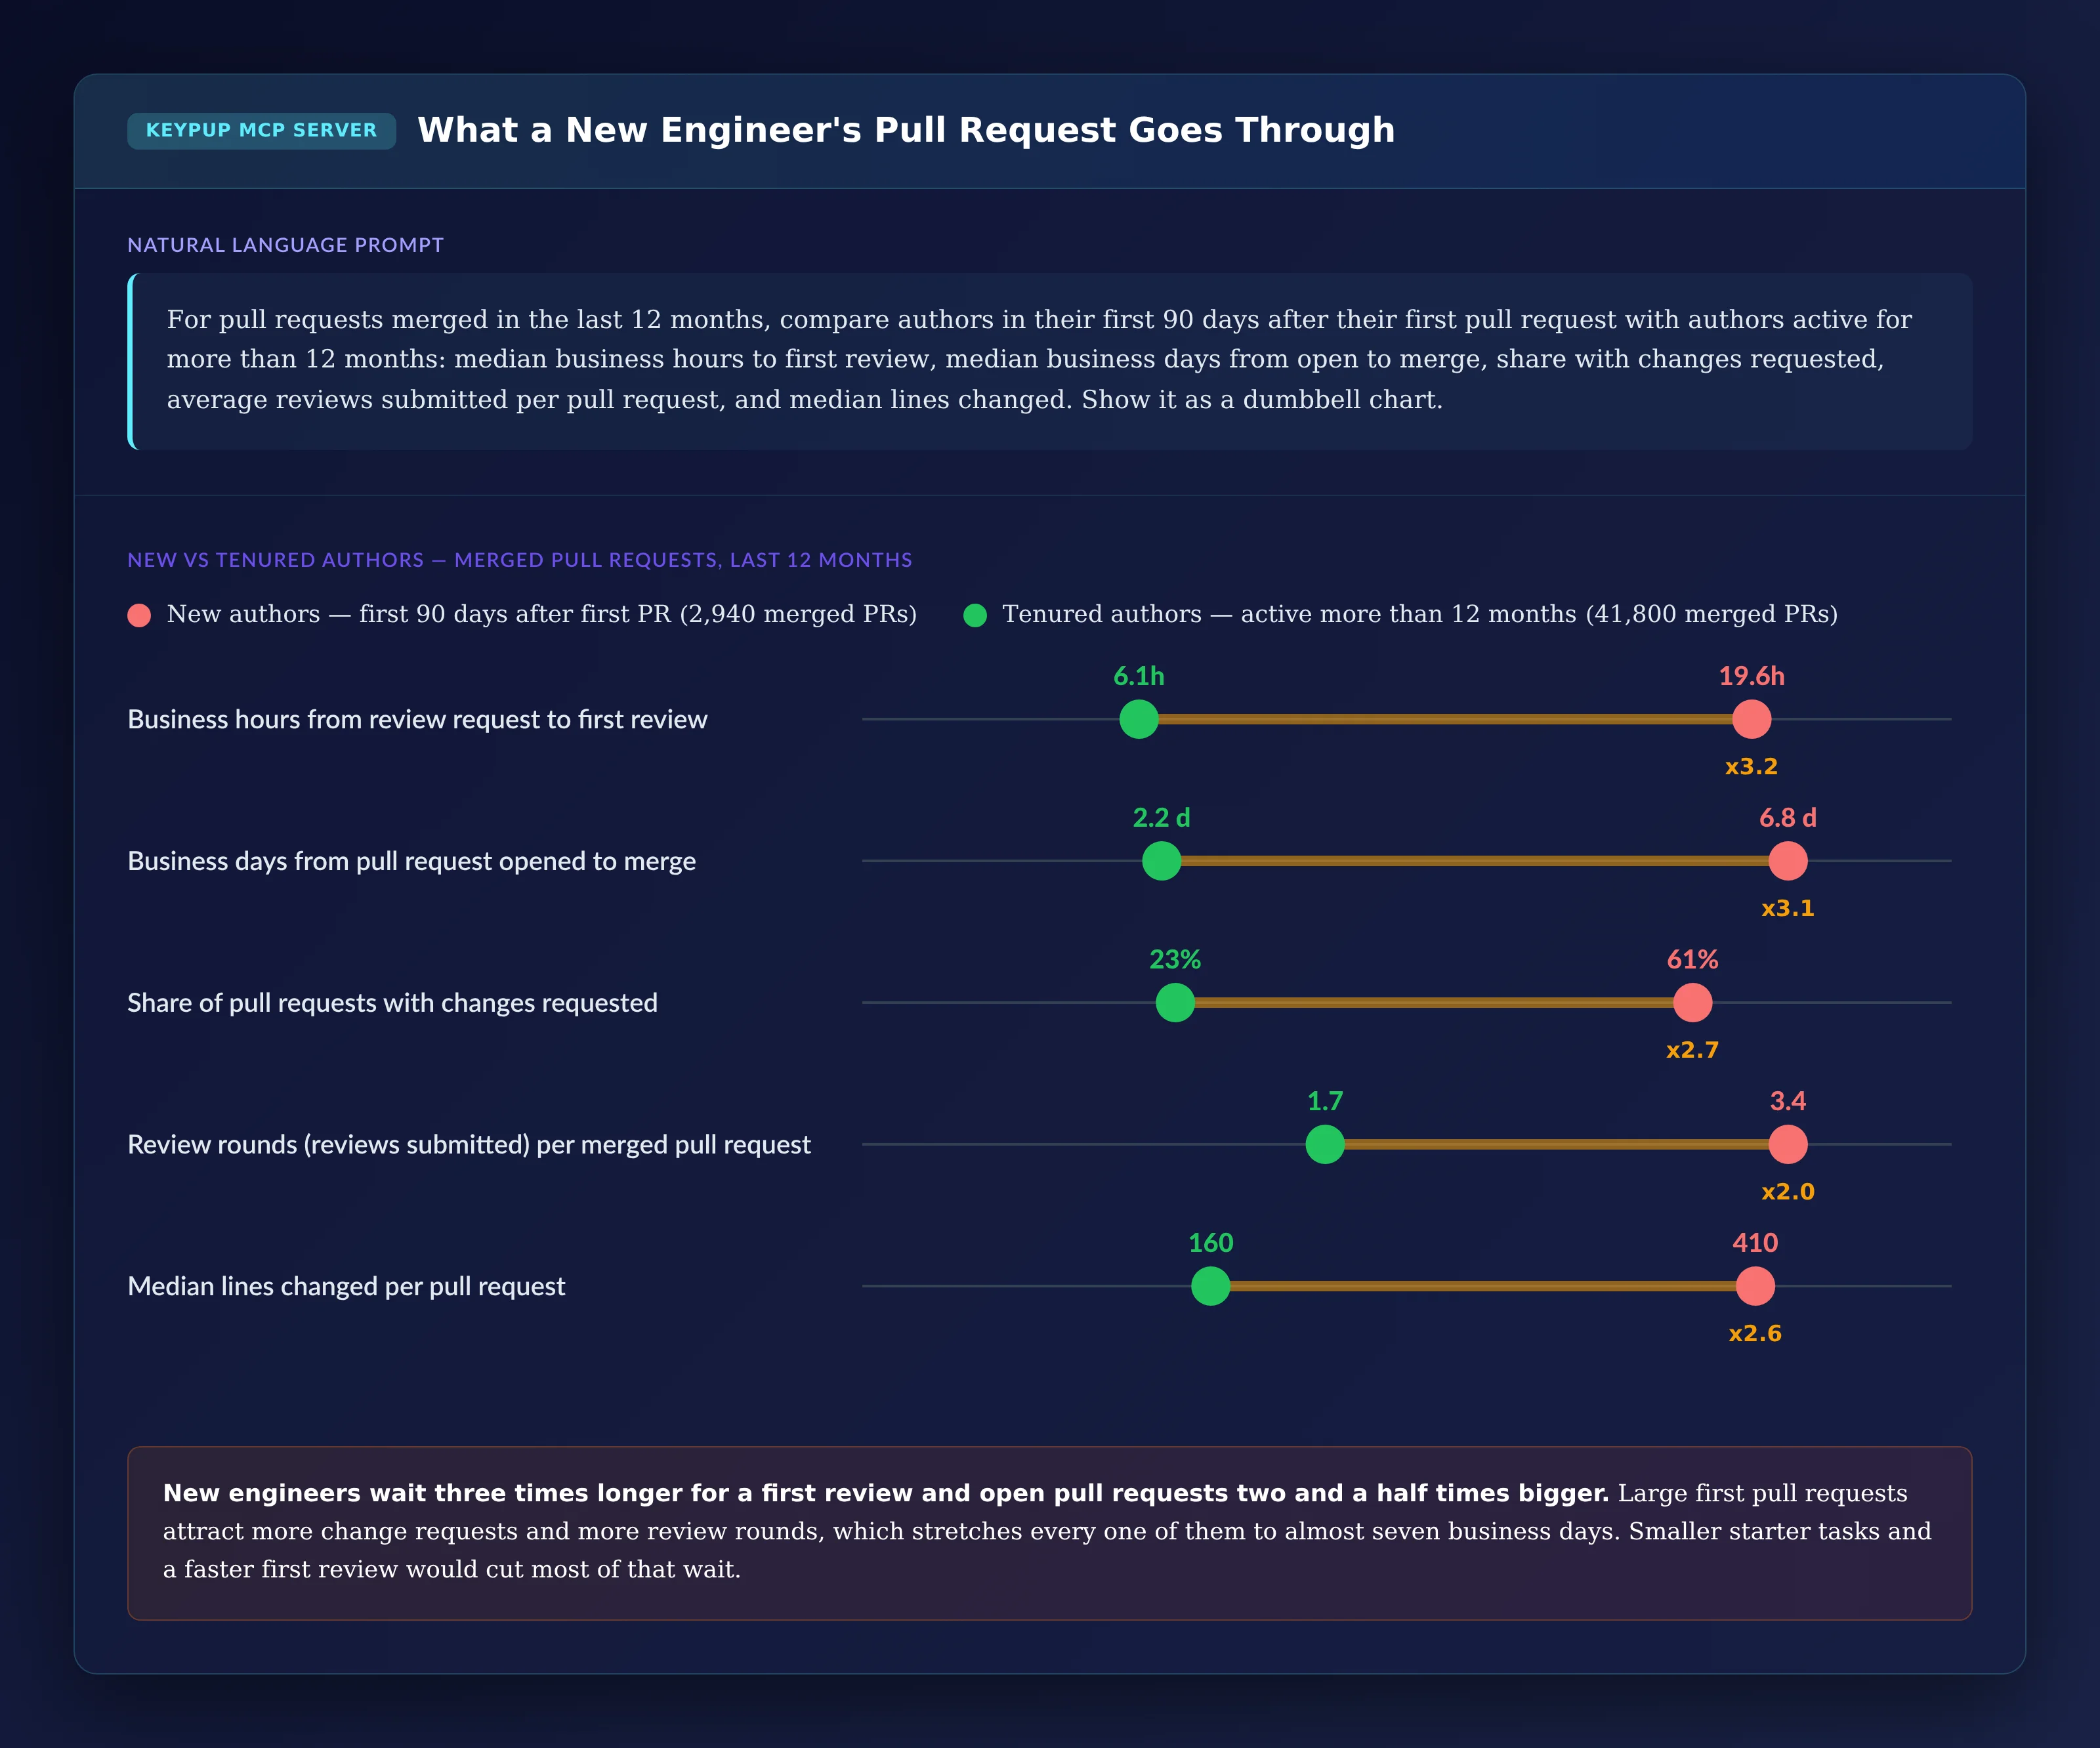
For pull requests merged in the last 12 months, compare
authors in their first 90 days after their first pull request
with authors active for more than 12 months: median business
hours to first review, median business days from open to
merge, share with changes requested, average reviews
submitted per pull request, and median lines changed. Show it
as a dumbbell chart.
Output: What a New Engineer's Pull Request Goes Through
Key Insight: New engineers wait three times longer for a first review and open pull requests two and a half times bigger. Bigger pull requests get more change requests and more review rounds, so each one takes almost seven business days to merge. Smaller starter tasks and a faster first review would remove most of that wait.
4. Finding Where New Engineers Get Stuck
Some parts of the codebase are much harder to onboard into than others. A heatmap shows where, and whether it's improving.
MCP Prompt:
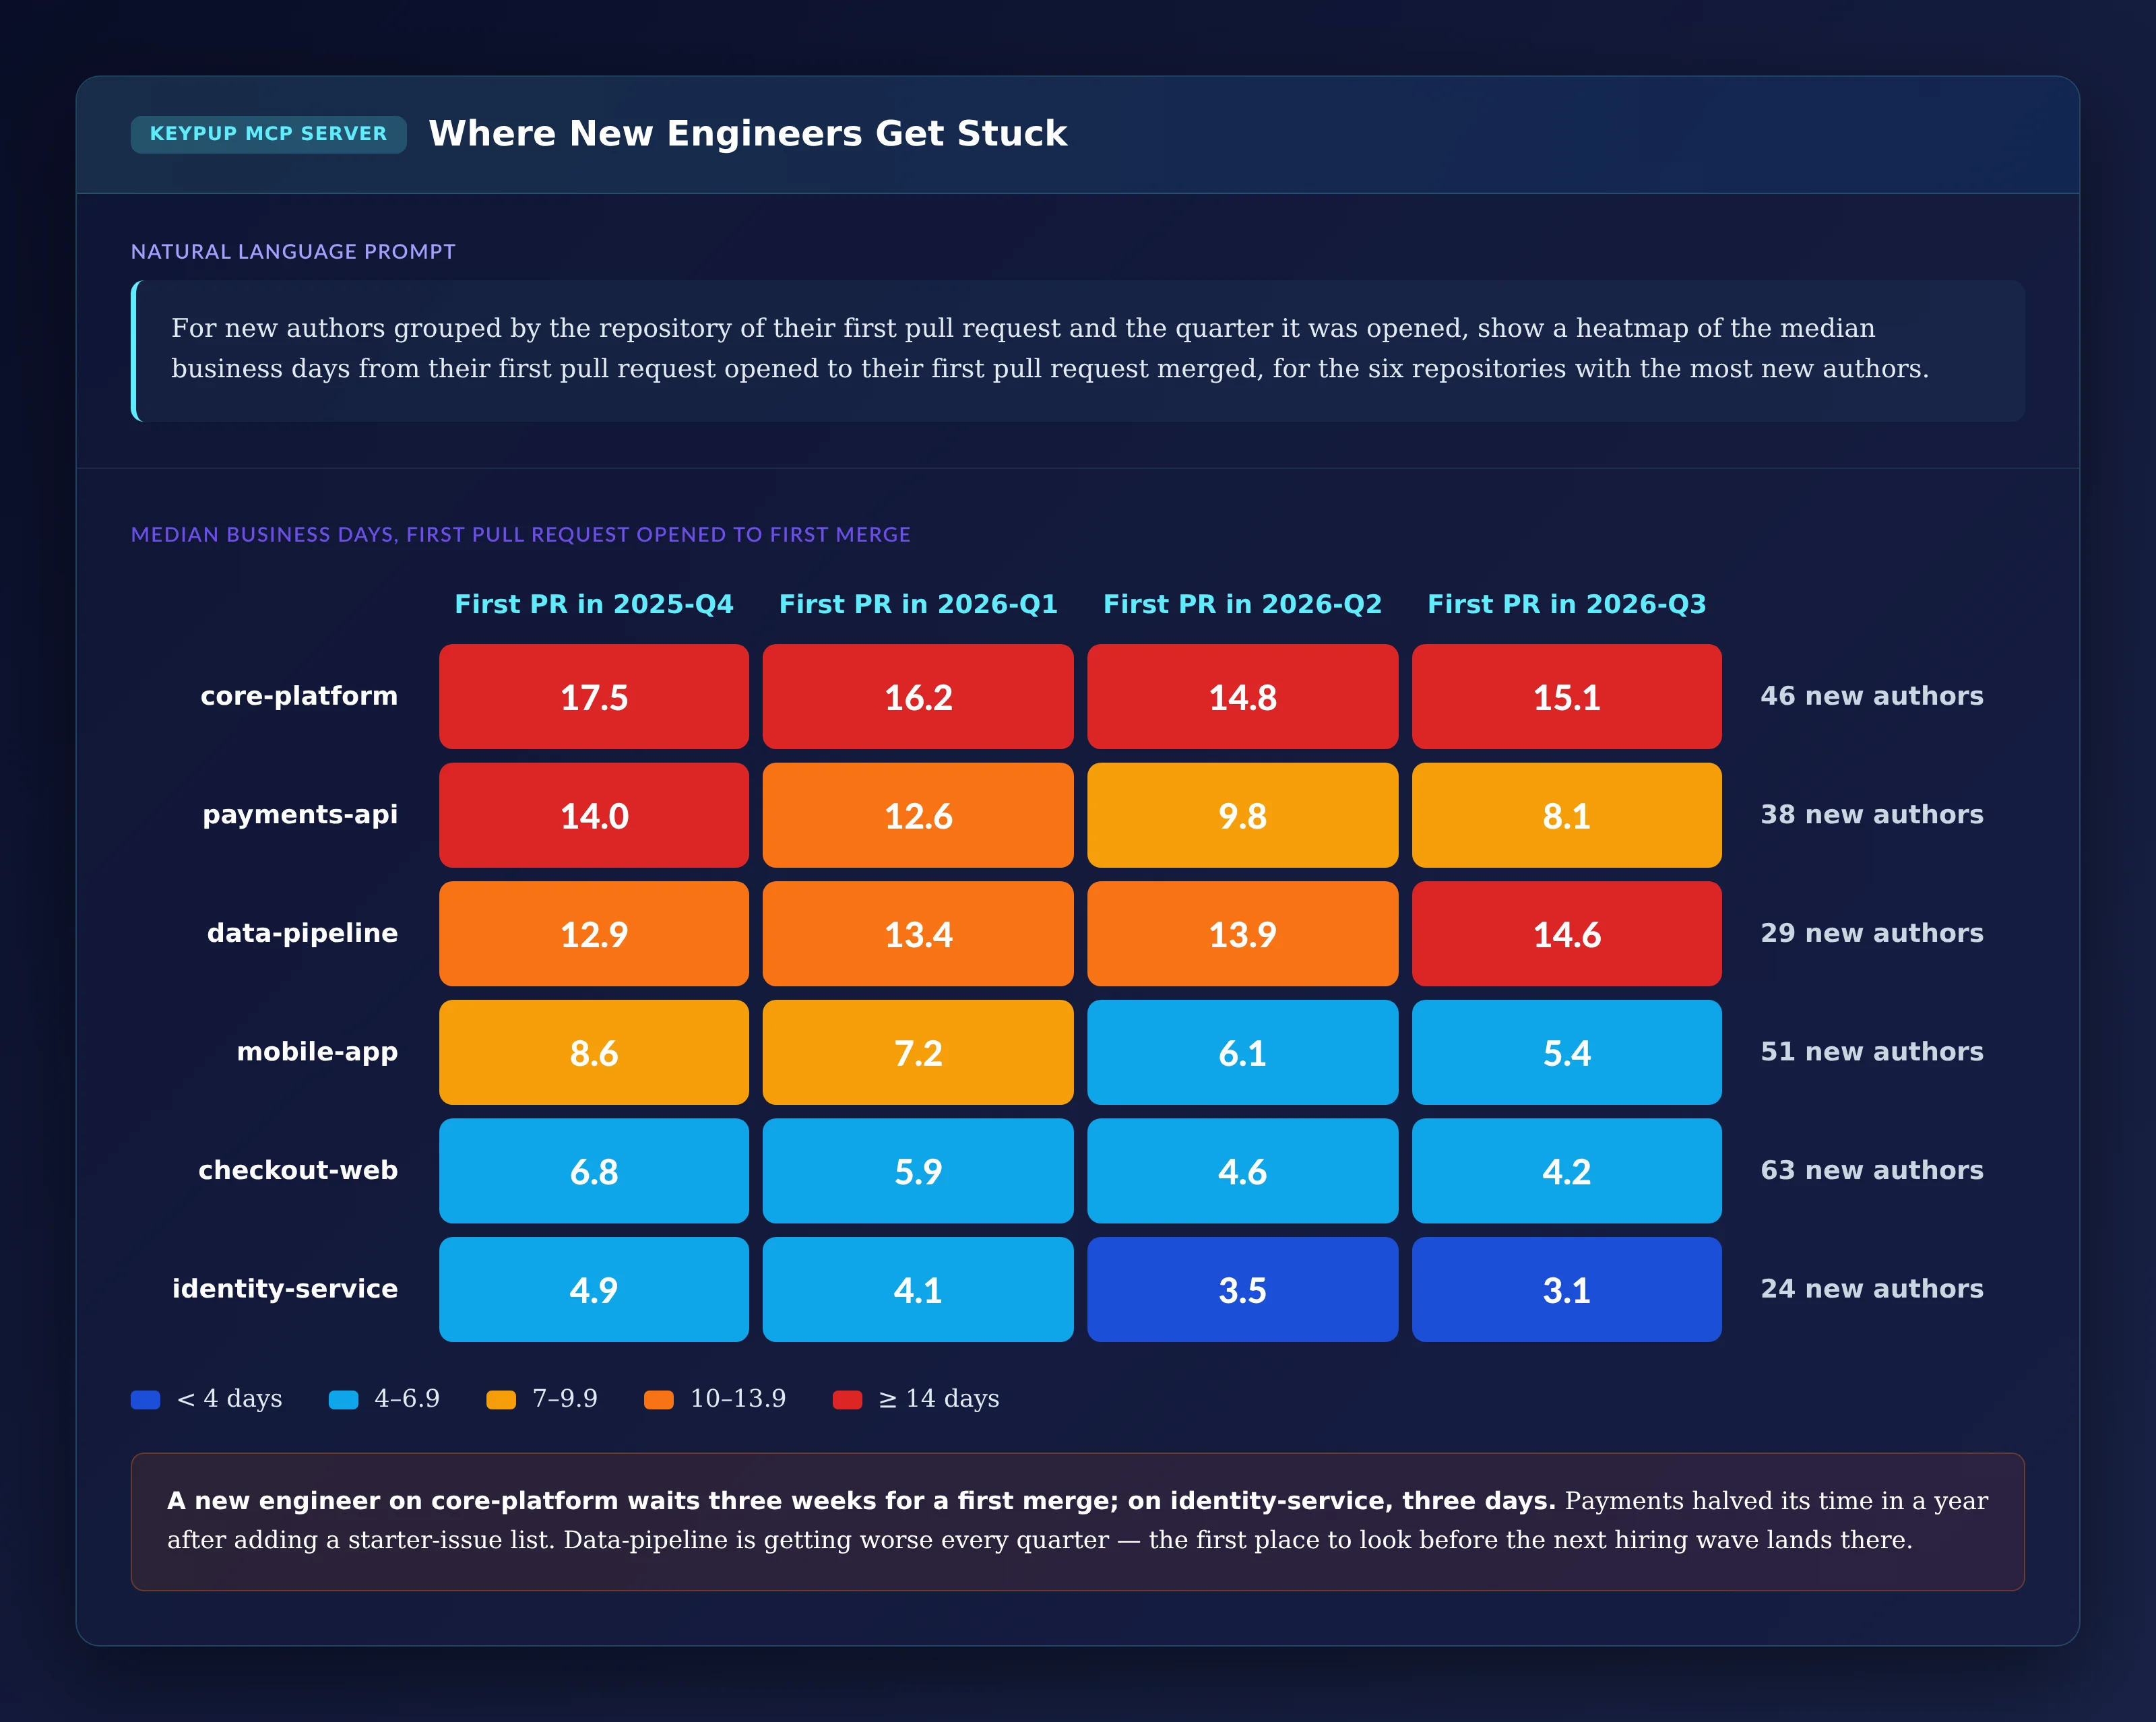
For new authors grouped by the repository of their first pull
request and the quarter it was opened, show a heatmap of the
median business days from their first pull request opened to
their first pull request merged, for the six repositories
with the most new authors.
Output: Where New Engineers Get Stuck
Key Insight: A new engineer on core-platform waits three weeks for a first merge; on identity-service, three days. Payments-api almost halved its time in a year, while data-pipeline gets worse every quarter — the first place to fix before the next hiring wave lands there.
5. Seeing Who Carries the Onboarding Load
Every new engineer's pull request needs a reviewer. This chart shows who those reviewers are.
MCP Prompt:
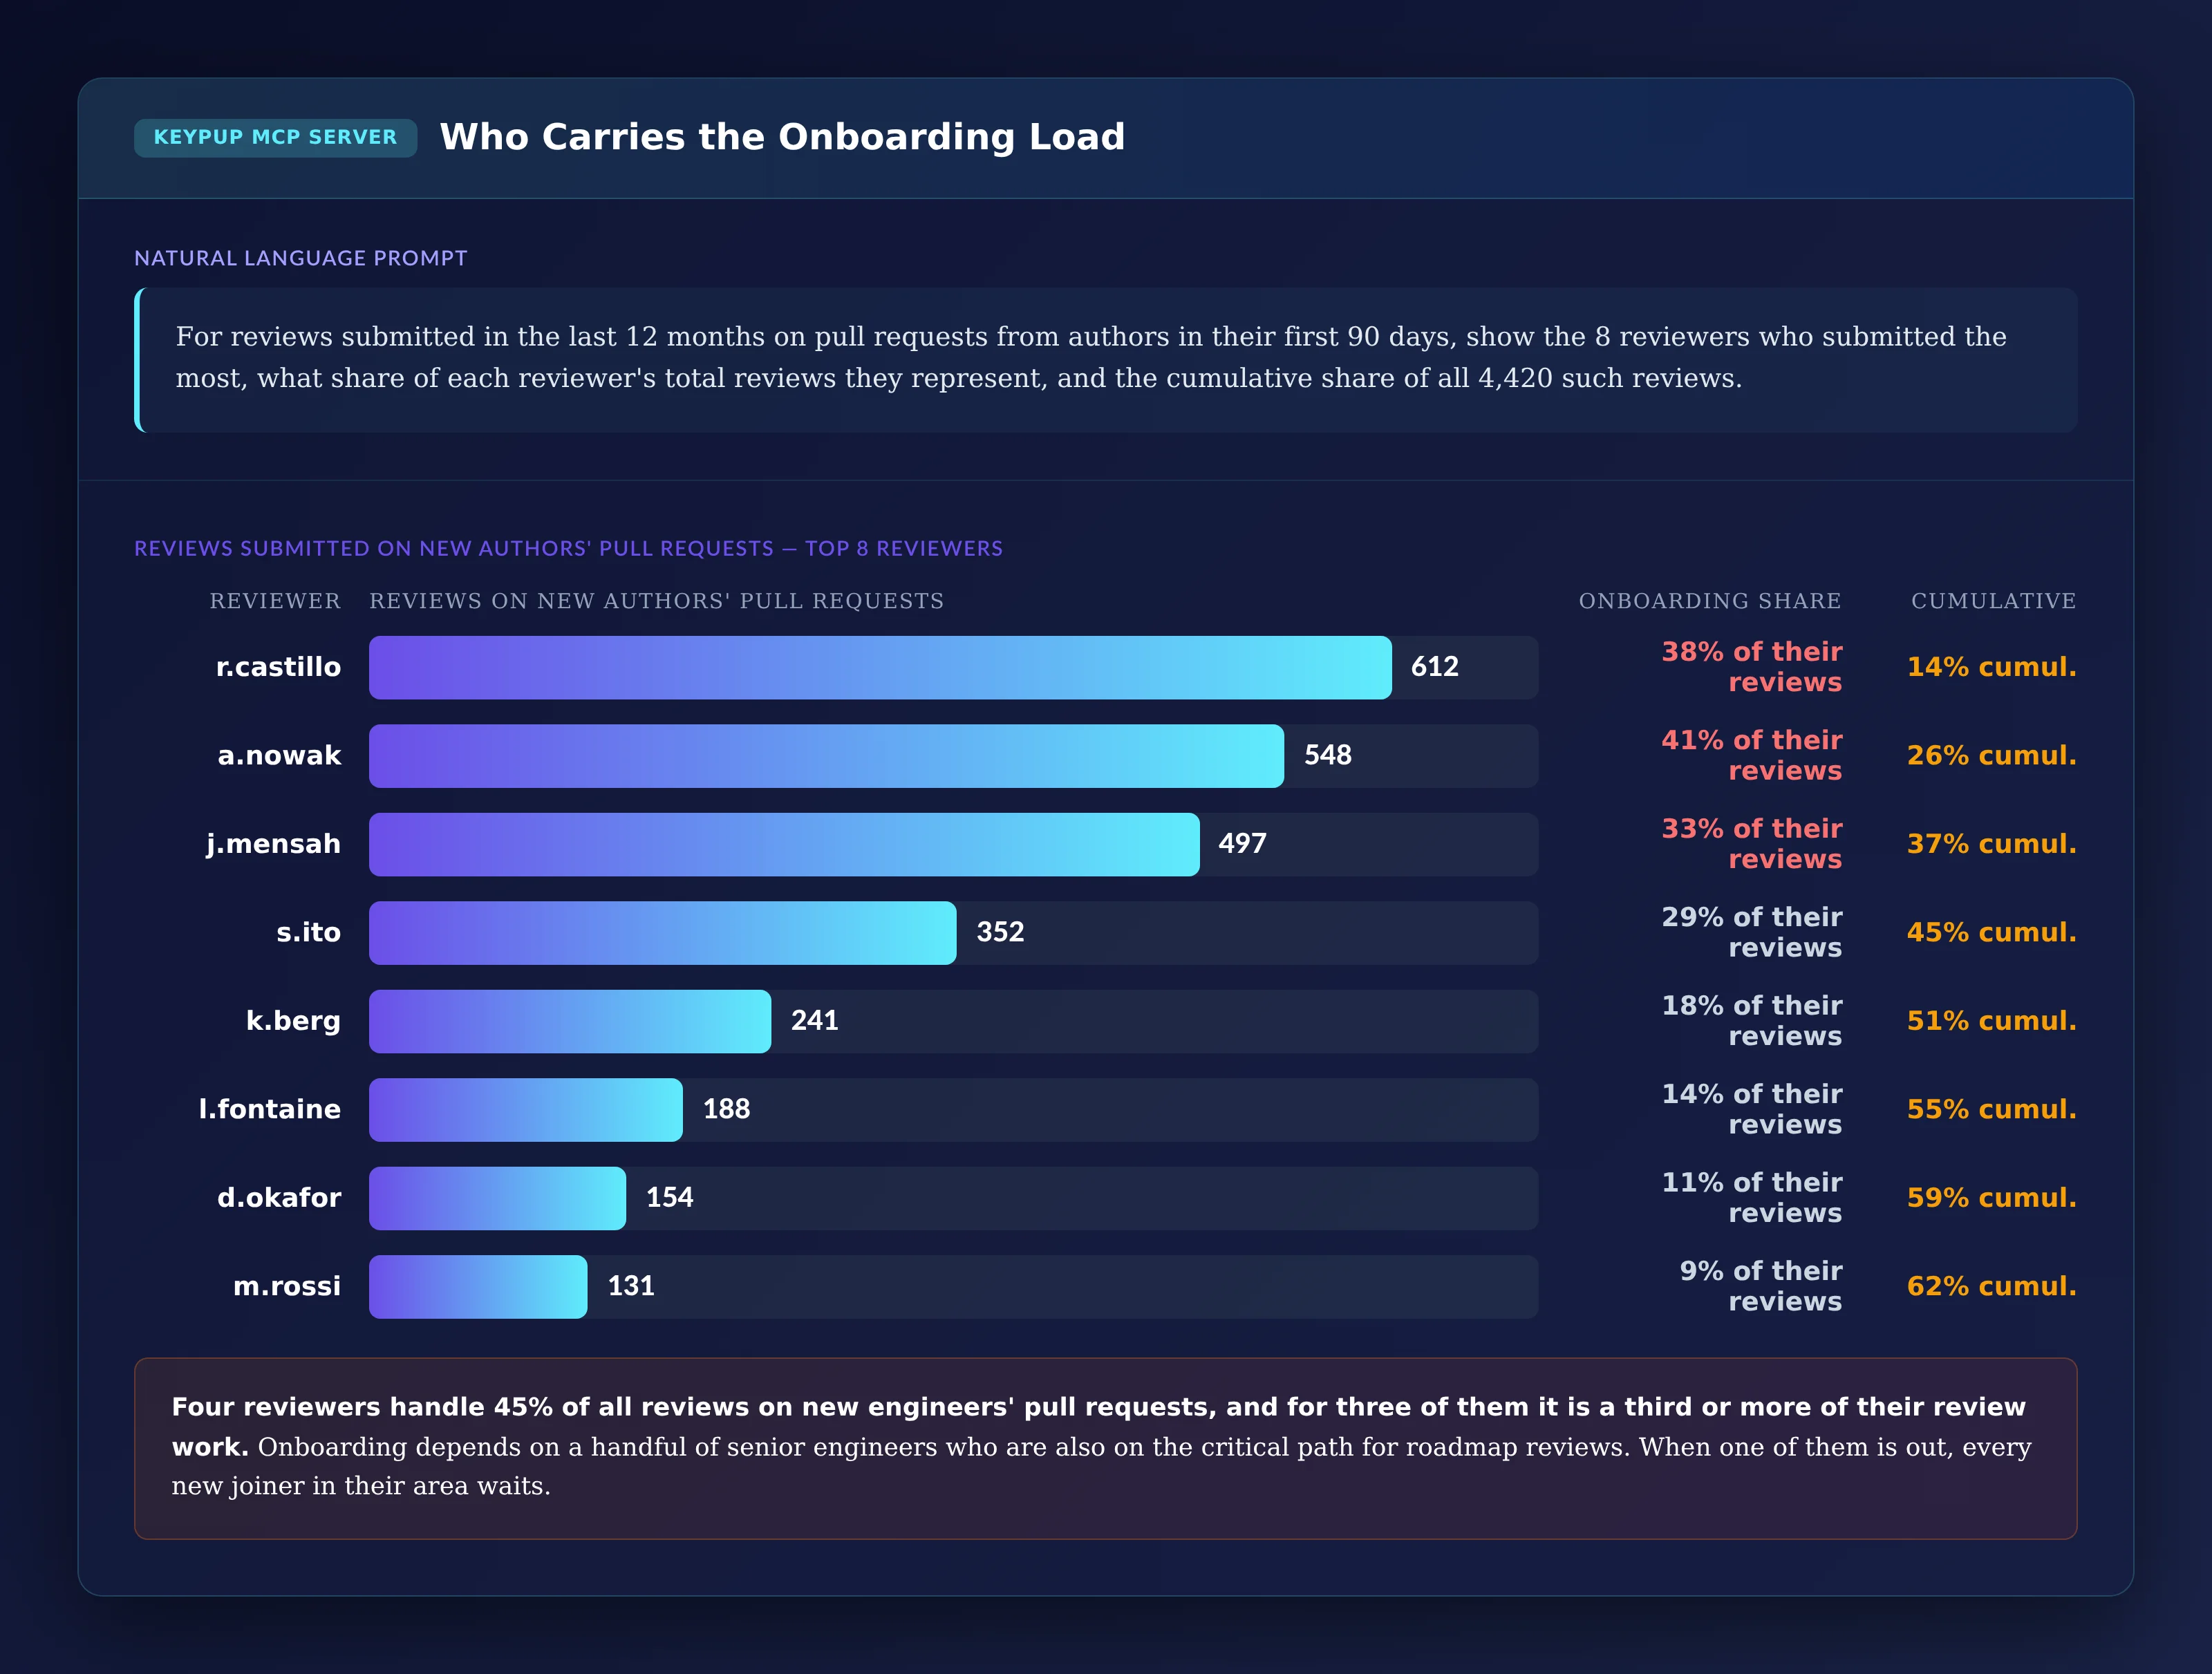
For reviews submitted in the last 12 months on pull requests
from authors in their first 90 days, show the 8 reviewers who
submitted the most, what share of each reviewer's total
reviews they represent, and the cumulative share of all such
reviews.
Output: Who Carries the Onboarding Load
Key Insight: Four reviewers handle 45% of all reviews on new engineers' pull requests, and for three of them it's a third or more of their review work. Onboarding depends on a handful of senior engineers who are also on the critical path for roadmap work. When one of them is away, every new joiner in their area waits.
6. Building an Onboarding Scorecard per Repository
The last step turns the analysis into something each team can act on.
MCP Prompt:
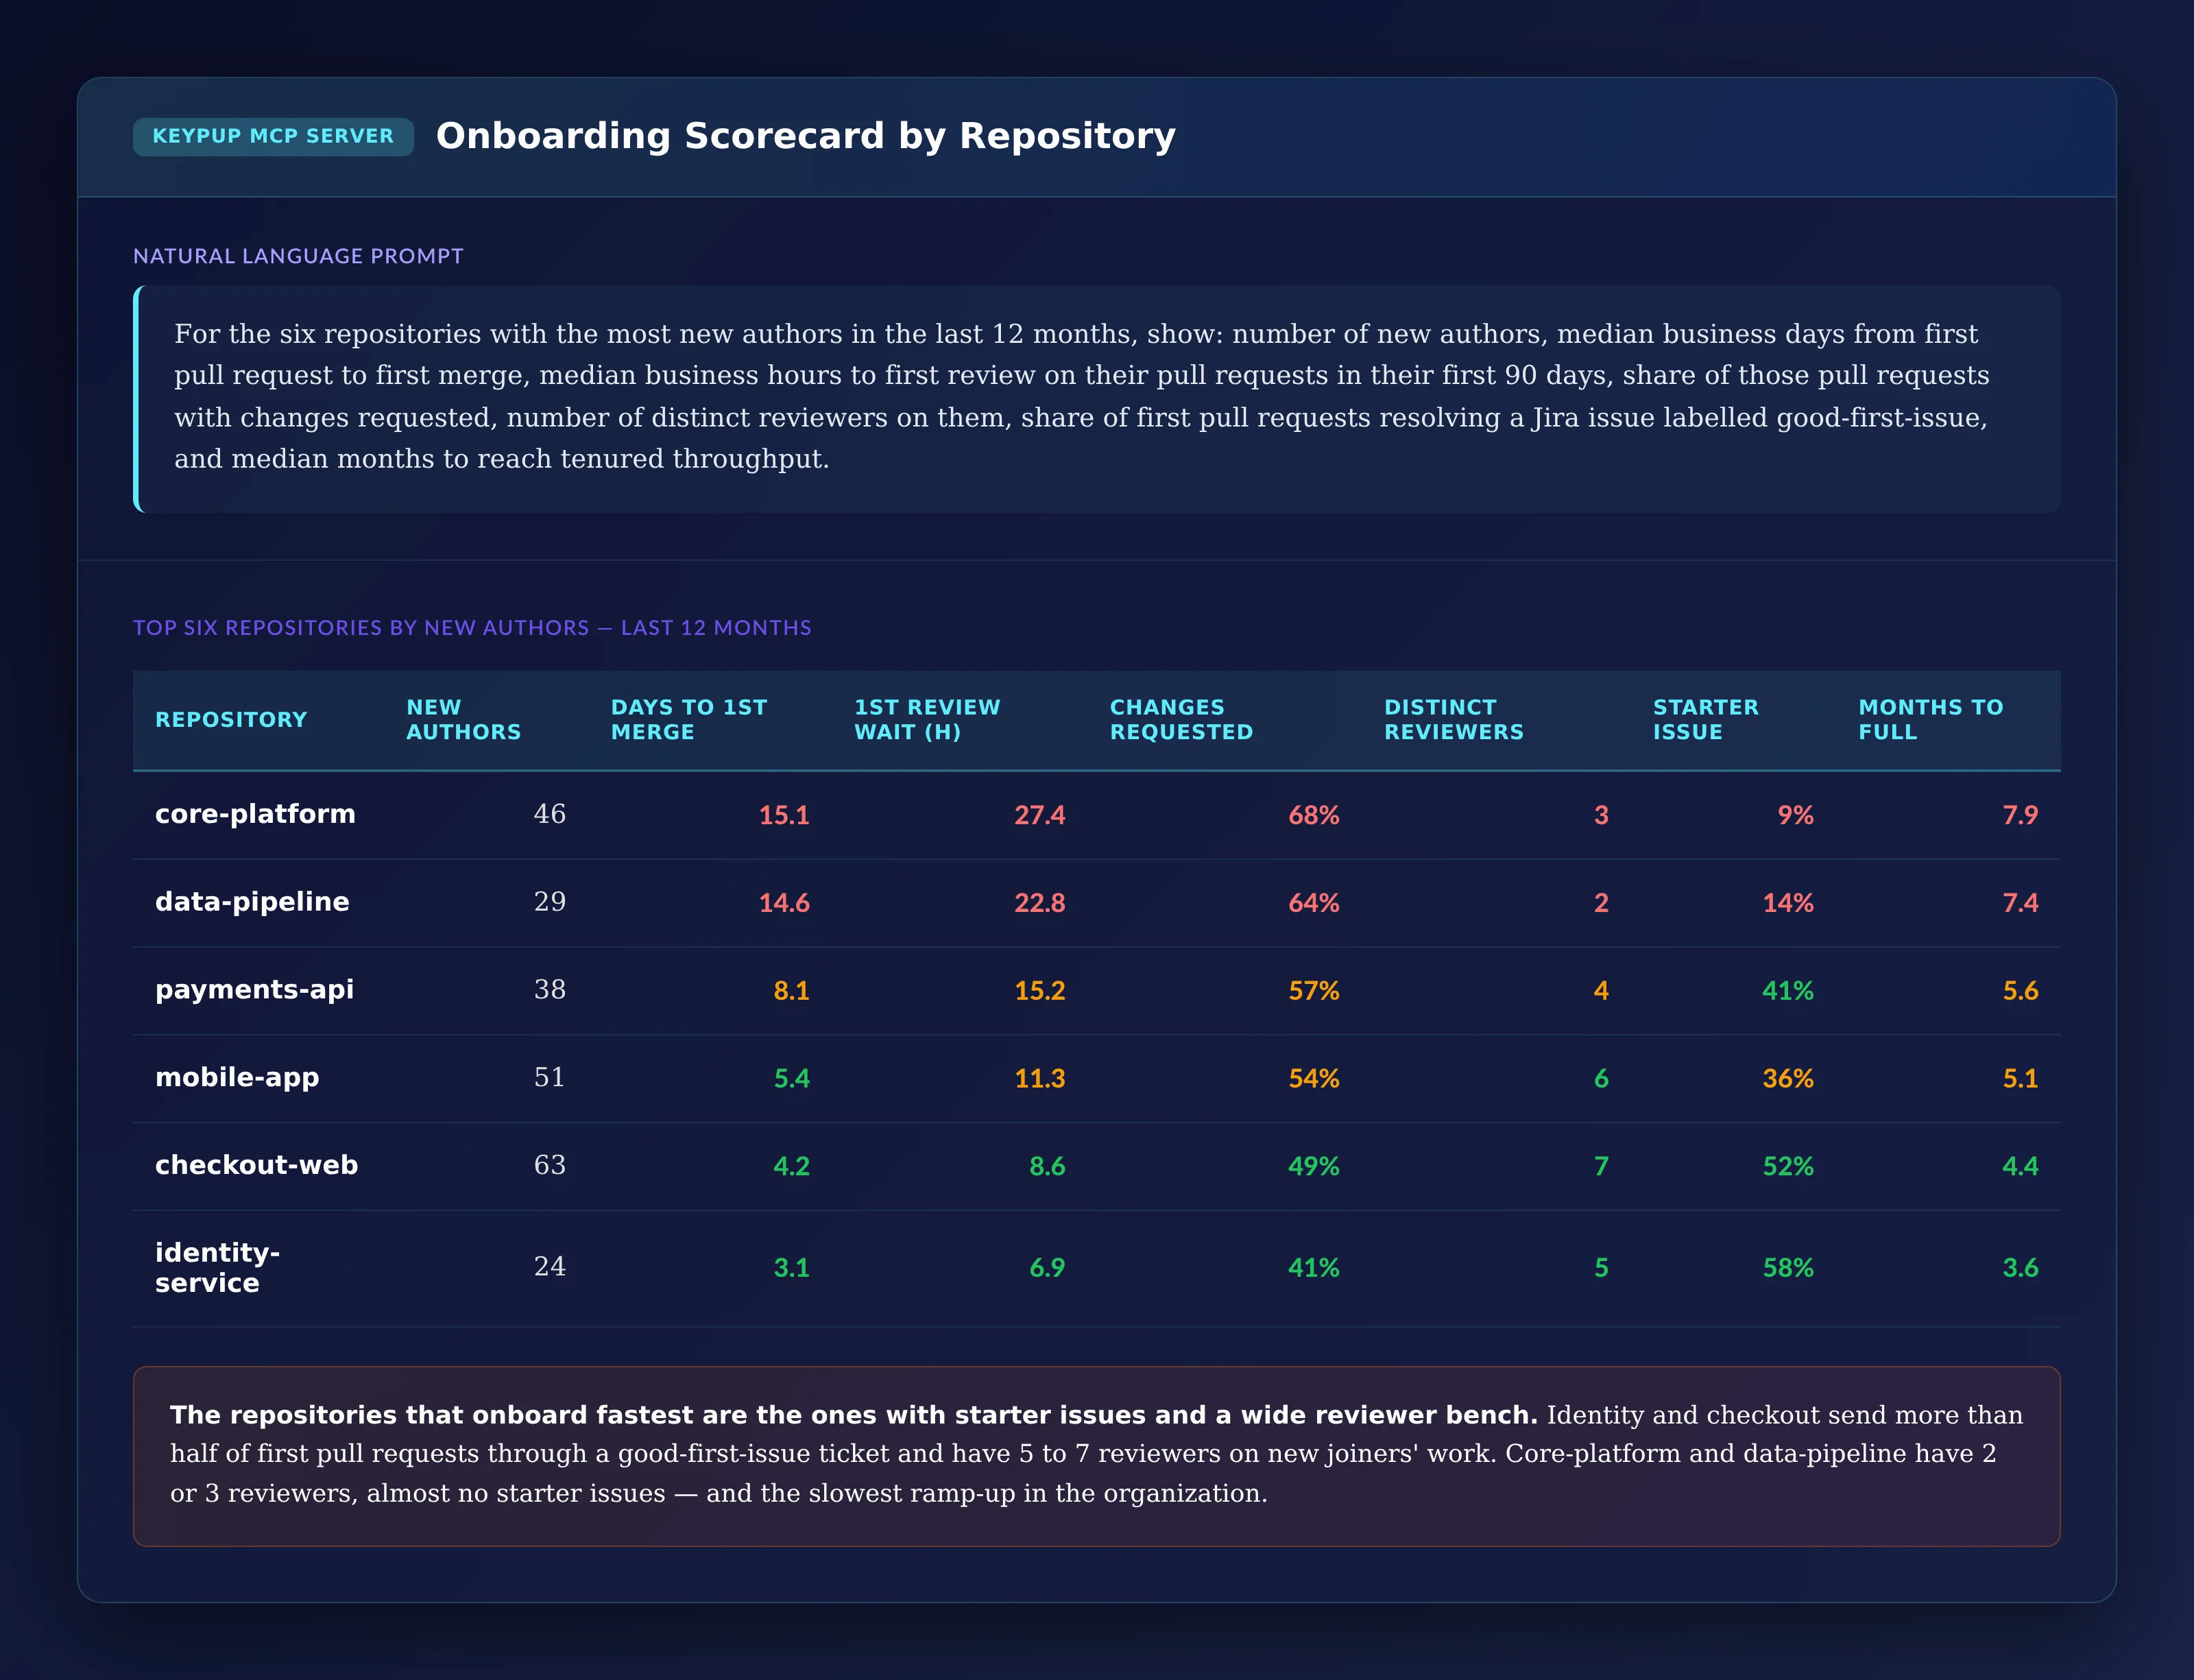
For the six repositories with the most new authors in the last
12 months, show: number of new authors, median business days
from first pull request to first merge, median business hours
to first review on their pull requests in their first 90 days,
share of those pull requests with changes requested, number
of distinct reviewers on them, share of first pull requests
resolving a Jira issue labelled good-first-issue, and median
months to reach tenured throughput.
Output: Onboarding Scorecard by Repository
Repository
New Authors
Days to 1st Merge
1st Review Wait (h)
Changes Requested
Distinct Reviewers
Starter Issue
Months to Full
core-platform
46
15.1
27.4
68%
3
9%
7.9
data-pipeline
29
14.6
22.8
64%
2
14%
7.4
payments-api
38
8.1
15.2
57%
4
41%
5.6
mobile-app
51
5.4
11.3
54%
6
36%
5.1
checkout-web
63
4.2
8.6
49%
7
52%
4.4
identity-service
24
3.1
6.9
41%
5
58%
3.6
Key Insight: The repositories that onboard fastest are the ones with starter issues and a wide reviewer bench. Identity-service and checkout-web send more than half of first pull requests through a good-first-issue ticket and have 5 to 7 reviewers on new joiners' work. Core-platform and data-pipeline have 2 or 3 reviewers, almost no starter issues, and the slowest ramp-up in the organization.
The Technical Implementation: What Keypup MCP Actually Reads
Every number above comes from pull request, review and issue data Keypup already imports. It helps to be precise about what that data is — and what it isn't.
"New" Means First Pull Request, Not Start Date
Keypup doesn't import HR systems, so it has no hire dates. An author's ramp-up starts with the creation date of their first pull request in the repositories you've connected. That's usually within a week or two of joining, so it's a good proxy — but it excludes the time before the first pull request, and it counts internal transfers as new authors in the repositories they join. Usernames are specific to each Git platform, so an engineer who contributes on two platforms appears as two authors.
Throughput Means Merged Pull Requests
"Full throughput" is defined as an author's monthly merged pull requests reaching the median of tenured authors. It's a measure of delivered work, not of hours or of individual performance, and it should be read at cohort and repository level. Pull request size, measured in lines changed, sits alongside it to avoid rewarding many tiny pull requests.
Review Friction Comes From Review Dates and States
Time to first review is the business hours between the review request and the first review submitted. "Changes requested" means at least one review on the pull request had the changes-requested state. Review rounds count the reviews submitted on each pull request. The reviewer load chart uses the individual reviews, each with its reviewer, state, submission date and the author of the pull request it belongs to.
Starter Issues Depend on Your Jira Labels
The starter-issue column relies on the labels of the Jira issues a pull request resolves. It works only if your teams label starter work consistently — good-first-issue here, or whatever label you use — and if pull requests reference the Jira issue key. Without those, the column stays empty while the rest of the scorecard still works.
Real-World Impact: Enterprise Case Studies
Case Study 1: Global Payments Provider
Before Keypup MCP:
280 engineers hired in a year across 35 teams
Headcount plans assumed full productivity after one quarter
Onboarding measured by a week-one satisfaction survey
After Keypup MCP:
The ramp-up prompt replaced the guesswork: the median time to tenured throughput was 7 months, not 3, and capacity plans were adjusted for every team that was hiring
The heatmap identified two repositories where first merges took more than three weeks; both got a curated starter-issue list
Time to first merge fell from 12 to 5 business days within two quarters, and the next cohort's curve reached tenured throughput two months earlier
"We were planning as if every new hire was fully productive after one quarter. The ramp-up curve showed it was closer to seven months. Fixing the plans was the easy part — the hard part was realizing how much capacity we'd been promising that never existed."
— SVP Engineering, Global Payments Provider
Case Study 2: Enterprise Healthcare Software Company
Before Keypup MCP:
New joiners in the platform group regularly waited more than a week for a first review
Two staff engineers informally reviewed almost all new joiners' work
Early attrition in the platform group was twice the company average
After Keypup MCP:
The reviewer load chart made the hidden mentoring work visible, and it was formally redistributed to a rotation of six reviewers
First review wait for new authors dropped from 31 to 9 business hours
The onboarding scorecard became part of the quarterly engineering review, with targets for time to first merge per repository
"Two of our staff engineers were doing a third of their reviews for new joiners and nobody knew. Once we could see it, we built a proper rotation. They got time back for architecture work, and new hires stopped waiting a week for a first comment."
— VP Engineering, Enterprise Healthcare Software Company
Implementation: Getting Started with Keypup MCP
1. Connect Your Git Platform and Jira
Connect GitHub, GitLab, Bitbucket or Azure DevOps, plus Jira, to Keypup. Pull requests, reviews, authors, dates and sizes are imported automatically, along with the Jira issues pull requests reference.
2. Agree on Your Definitions
Decide what counts as a new author (first pull request in the period), a tenured author (for example, more than 12 months of pull requests) and full throughput (for example, the tenured median of monthly merged pull requests). Use the same definitions in every prompt so cohorts stay comparable.
3. Label Starter Work
Pick a label such as good-first-issue for Jira issues suitable for new joiners, and ask teams to reference the Jira key in every pull request so Keypup can link them.
4. Connect the MCP Server to Your AI Assistant
Follow the MCP documentation to connect Keypup to Claude, ChatGPT, Cursor or any MCP-compatible assistant.
5. Set a Baseline, Then Track Every Cohort
Run the ramp-up and cohort prompts to set a baseline. Use the heatmap and scorecard to choose which repositories to fix first, the reviewer load chart to plan mentoring time, and re-run the cohort curve every quarter to see whether changes are working.
Frequently Asked Questions
How long does it take a new software engineer to become productive?
It varies widely by codebase and organization, which is exactly why it should be measured rather than assumed. In large organizations, reaching the throughput of tenured colleagues commonly takes several months. Comparing each cohort's ramp-up curve against tenured authors gives you your own number.
What is time to first merge?
Time to first merge is the time from a new engineer's first pull request being opened to their first pull request being merged. It's a simple, early indicator of onboarding friction: long waits usually point to slow reviews, oversized first tasks or unclear ownership.
How do you measure developer onboarding without micromanaging?
Measure at cohort and repository level, not per person. Compare groups of new authors with tenured authors, look at review wait times and pull request sizes, and use the results to fix the system — starter issues, reviewer rotations, documentation — rather than to rank individuals.
Can Keypup measure onboarding without HR data?
Yes. Keypup uses the date of each author's first pull request in your connected repositories as the start of their ramp-up. It doesn't know hire dates, so the time between joining and opening a first pull request isn't included, and internal transfers count as new authors in the repositories they join.
The Bottom Line
You can't plan capacity that's still ramping up if you can't see it. Keypup MCP shows how long new engineers take to reach full speed, and why:
✅ Sizing the ramp-up tax — time to first merge and time to full throughput ✅ Plotting ramp-up curves by cohort to see whether onboarding is improving ✅ Comparing review friction between new and tenured engineers ✅ Finding the repositories where new engineers get stuck ✅ Seeing who carries the onboarding load before it burns them out ✅ Giving every repository an onboarding scorecard to act on
Ready to Transform Your Analytics?
Join teams already using AI to make data-driven decisions faster than
ever.
Leadership asks why the roadmap is slipping. Engineering says "bugs and maintenance", but can't prove how much. Learn what engineering leaders on Reddit say about the keep-the-lights-on (KTLO) tax in large organizations, why investment allocation is so hard to measure, and how Keypup MCP uses Jira issue types, labels and linked pull requests to show where engineering capacity actually goes.
Are your engineers really using AI for code, is it making delivery faster, and is quality holding up? A three-question method, with the data and queries to answer each one.
Compare the 5 best value stream analytics platforms for engineering leaders — Keypup, Pluralsight Flow, LinearB, Jellyfish and Swarmia — across DORA Metrics depth, cross-platform data unification, contextual analysis, customization, AI and natural language capabilities, and setup speed. Find out which value stream management platform turns Git, Jira and CI/CD data into prescriptive, actionable insights.