Is AI Actually Improving Your SDLC? How to Measure the Impact of AI Coding Assistants on Delivery and Code Quality
Are your engineers really using AI for code, is it making delivery faster, and is quality holding up? A three-question method, with the data and queries to answer each one.
TL;DR: Three questions decide whether AI coding assistants are paying off: are we really using AI for code, is it improving delivery, and is quality holding up? Seat counts, acceptance rates and developer surveys can't answer them, and the research disagrees with developers' own perception: in METR's 2025 trial, experienced developers were 19% slower with AI while believing they were 20% faster. The reliable method is to measure depth of use (active days, share of added lines written by AI), then compare cohorts of habitual, occasional and non-users against their own pre-AI baseline on throughput, cycle time and time to first review, and finally watch quality signals such as bug-fix share, change requests and large pull requests approved without changes. Keypup's AI Usage dataset puts GitHub Copilot usage next to your pull requests, so all three answers come from one place, in a dashboard or by asking your AI assistant through the Keypup MCP Server.
Every engineering leader who rolled out an AI coding assistant eventually gets the same three questions from the CEO, the CFO or the board. Are we actually using it? Is it making us faster? And is it breaking anything?
They sound simple. They are not. The vendor console answers a different question (how many suggestions were offered), developer surveys answer a third one (how fast people feel), and the delivery dashboard rarely knows who used AI at all. The result is that most AI rollouts are judged on adoption and anecdotes, while the real effect on the software development lifecycle (SDLC) stays invisible.
This article is not about monitoring adoption: we covered that in AI Usage Monitoring: How to Measure Who Uses AI Coding Assistants. It is about reaching a verdict. We'll look at what the latest research says, why the obvious metrics mislead, and a three-question method that tells you whether AI is improving your delivery and your quality, with the exact queries to run.
Why "Is AI Working?" Is So Hard to Answer
AI coding assistants are now nearly universal. 90% of respondents to the 2025 DORA report use AI at work, and 84% of the 49,000 developers in Stack Overflow's 2025 survey use or plan to use AI tools. Yet the evidence on their effect points in different directions, and the people using them are not reliable judges of it.
What the Research Actually Says
Source
Finding
What it means for you
METR randomized trial (2025)
16 experienced open-source developers took 19% longer on 246 real issues with AI tools. They expected a 24% speed-up beforehand and still believed in a 20% speed-up afterwards.
Self-reported productivity is not evidence. Measure delivery data instead.
DORA report (2025)
AI adoption now has a positive relationship with delivery throughput, but still a negative relationship with delivery stability.
Speed and quality must be measured together, or speed gains hide stability losses.
Stack Overflow Developer Survey (2025)
46% of developers distrust AI accuracy versus 33% who trust it; 66% cite solutions that are almost right, but not quite; 45% find debugging AI code more time-consuming.
Watch rework and review effort, not just output.
GitClear code quality research (2025)
Across 211 million changed lines (2020 to 2024), copy-pasted lines rose from 8.3% to 12.3% while lines associated with refactoring fell from 25% to under 10%.
AI can grow the codebase faster than it improves it. Track pull request size and rework.
The METR authors are careful to say their study does not show that AI slows down most developers. But it shows something every leader should take seriously: how fast AI feels is a poor proxy for how fast work ships.
The DORA team summarises the whole picture in one sentence:
Google Cloud, announcing the 2025 DORA Report
AI doesn't fix a team; it amplifies what's already there.
Google Cloud, announcing the 2025 DORA Report
Strong teams use AI to become even better and more efficient. Struggling teams will find that AI only highlights and intensifies their existing problems.
If AI amplifies what is already there, the same tool can speed up one team and destabilise another. That is exactly why an organisation-wide average, or a vendor's global benchmark, can't tell you whether AI is working for you.
Why the Obvious Metrics Mislead
Seat counts measure purchasing, not usage. A licence assigned is not a developer helped.
Acceptance rate measures one surface. It only covers inline completions. Teams that work mostly in chat or agent mode can show a low acceptance rate while AI writes a large share of their code.
Lines of code reward the wrong thing. AI makes code cheap to produce. More lines can mean more value, or more duplication to maintain.
Org-wide averages hide the effect. If half your developers barely use AI, their unchanged numbers dilute the change in the half that does.
No baseline, no answer. Without the same developers' numbers from before the rollout, you can't separate the AI effect from seasonality, team changes or a quieter quarter.
The Three-Question Method
The method answers the three questions in order, because each one depends on the previous answer. You can't measure the effect of AI on delivery until you know who really uses it, and you can't call a speed gain a win until you know what it did to quality.
Question
Misleading metric
Reliable metric
Keypup data
1. Are we really using AI for code?
Licences assigned, acceptance rate
Active days per developer, share of added lines written by AI, usage by surface
AI Usage dataset, Commits
2. Is it improving our SDLC?
Org-wide PR count, developer surveys
Throughput, cycle time and time to first review per usage cohort, against each cohort's own baseline
AI Usage dataset, Issues & Pull Requests
3. Is quality holding up?
Test coverage alone, gut feeling
Bug-fix share, change requests, large PRs approved without changes, PR size
Issues & Pull Requests, Reviews
The analyses below were produced by an AI assistant connected to the Keypup MCP Server, using GitHub Copilot usage from Keypup's AI Usage dataset and pull request data from GitHub. The figures come from a fictional sample organisation, DoeCorp, with 64 developers who adopted Copilot in spring 2026. The queries shown are the real formulas the MCP Server runs.
Question 1: Are We Really Using AI for Code?
The first question sounds like the easiest, and it is the one most organisations get wrong. Usage is not binary. A developer who tried Copilot once in a month and a developer who uses agent mode every day both count as "active users" in a seat report, but only one of them can plausibly change your delivery numbers.
Two measures answer the question properly:
Depth of use: how many days each developer used an AI assistant in the month. In Keypup's AI Usage dataset, each row is one provider-published measurement for one day, so counting a developer's daily rows gives their active days.
AI share of the code: the lines written by the AI assistant that reached the file (lines_added in the AI Usage dataset), compared with all lines added in pull request commits. Keypup keeps lines that were merely offered (lines_suggested_added) separate from lines that landed, so this share is not inflated by ignored suggestions.
Splitting usage by surface (IDE completion, chat, agent mode, CLI, cloud agent, code review) then tells you how the code gets written, which matters for the next two questions: agent-written changes tend to be larger.
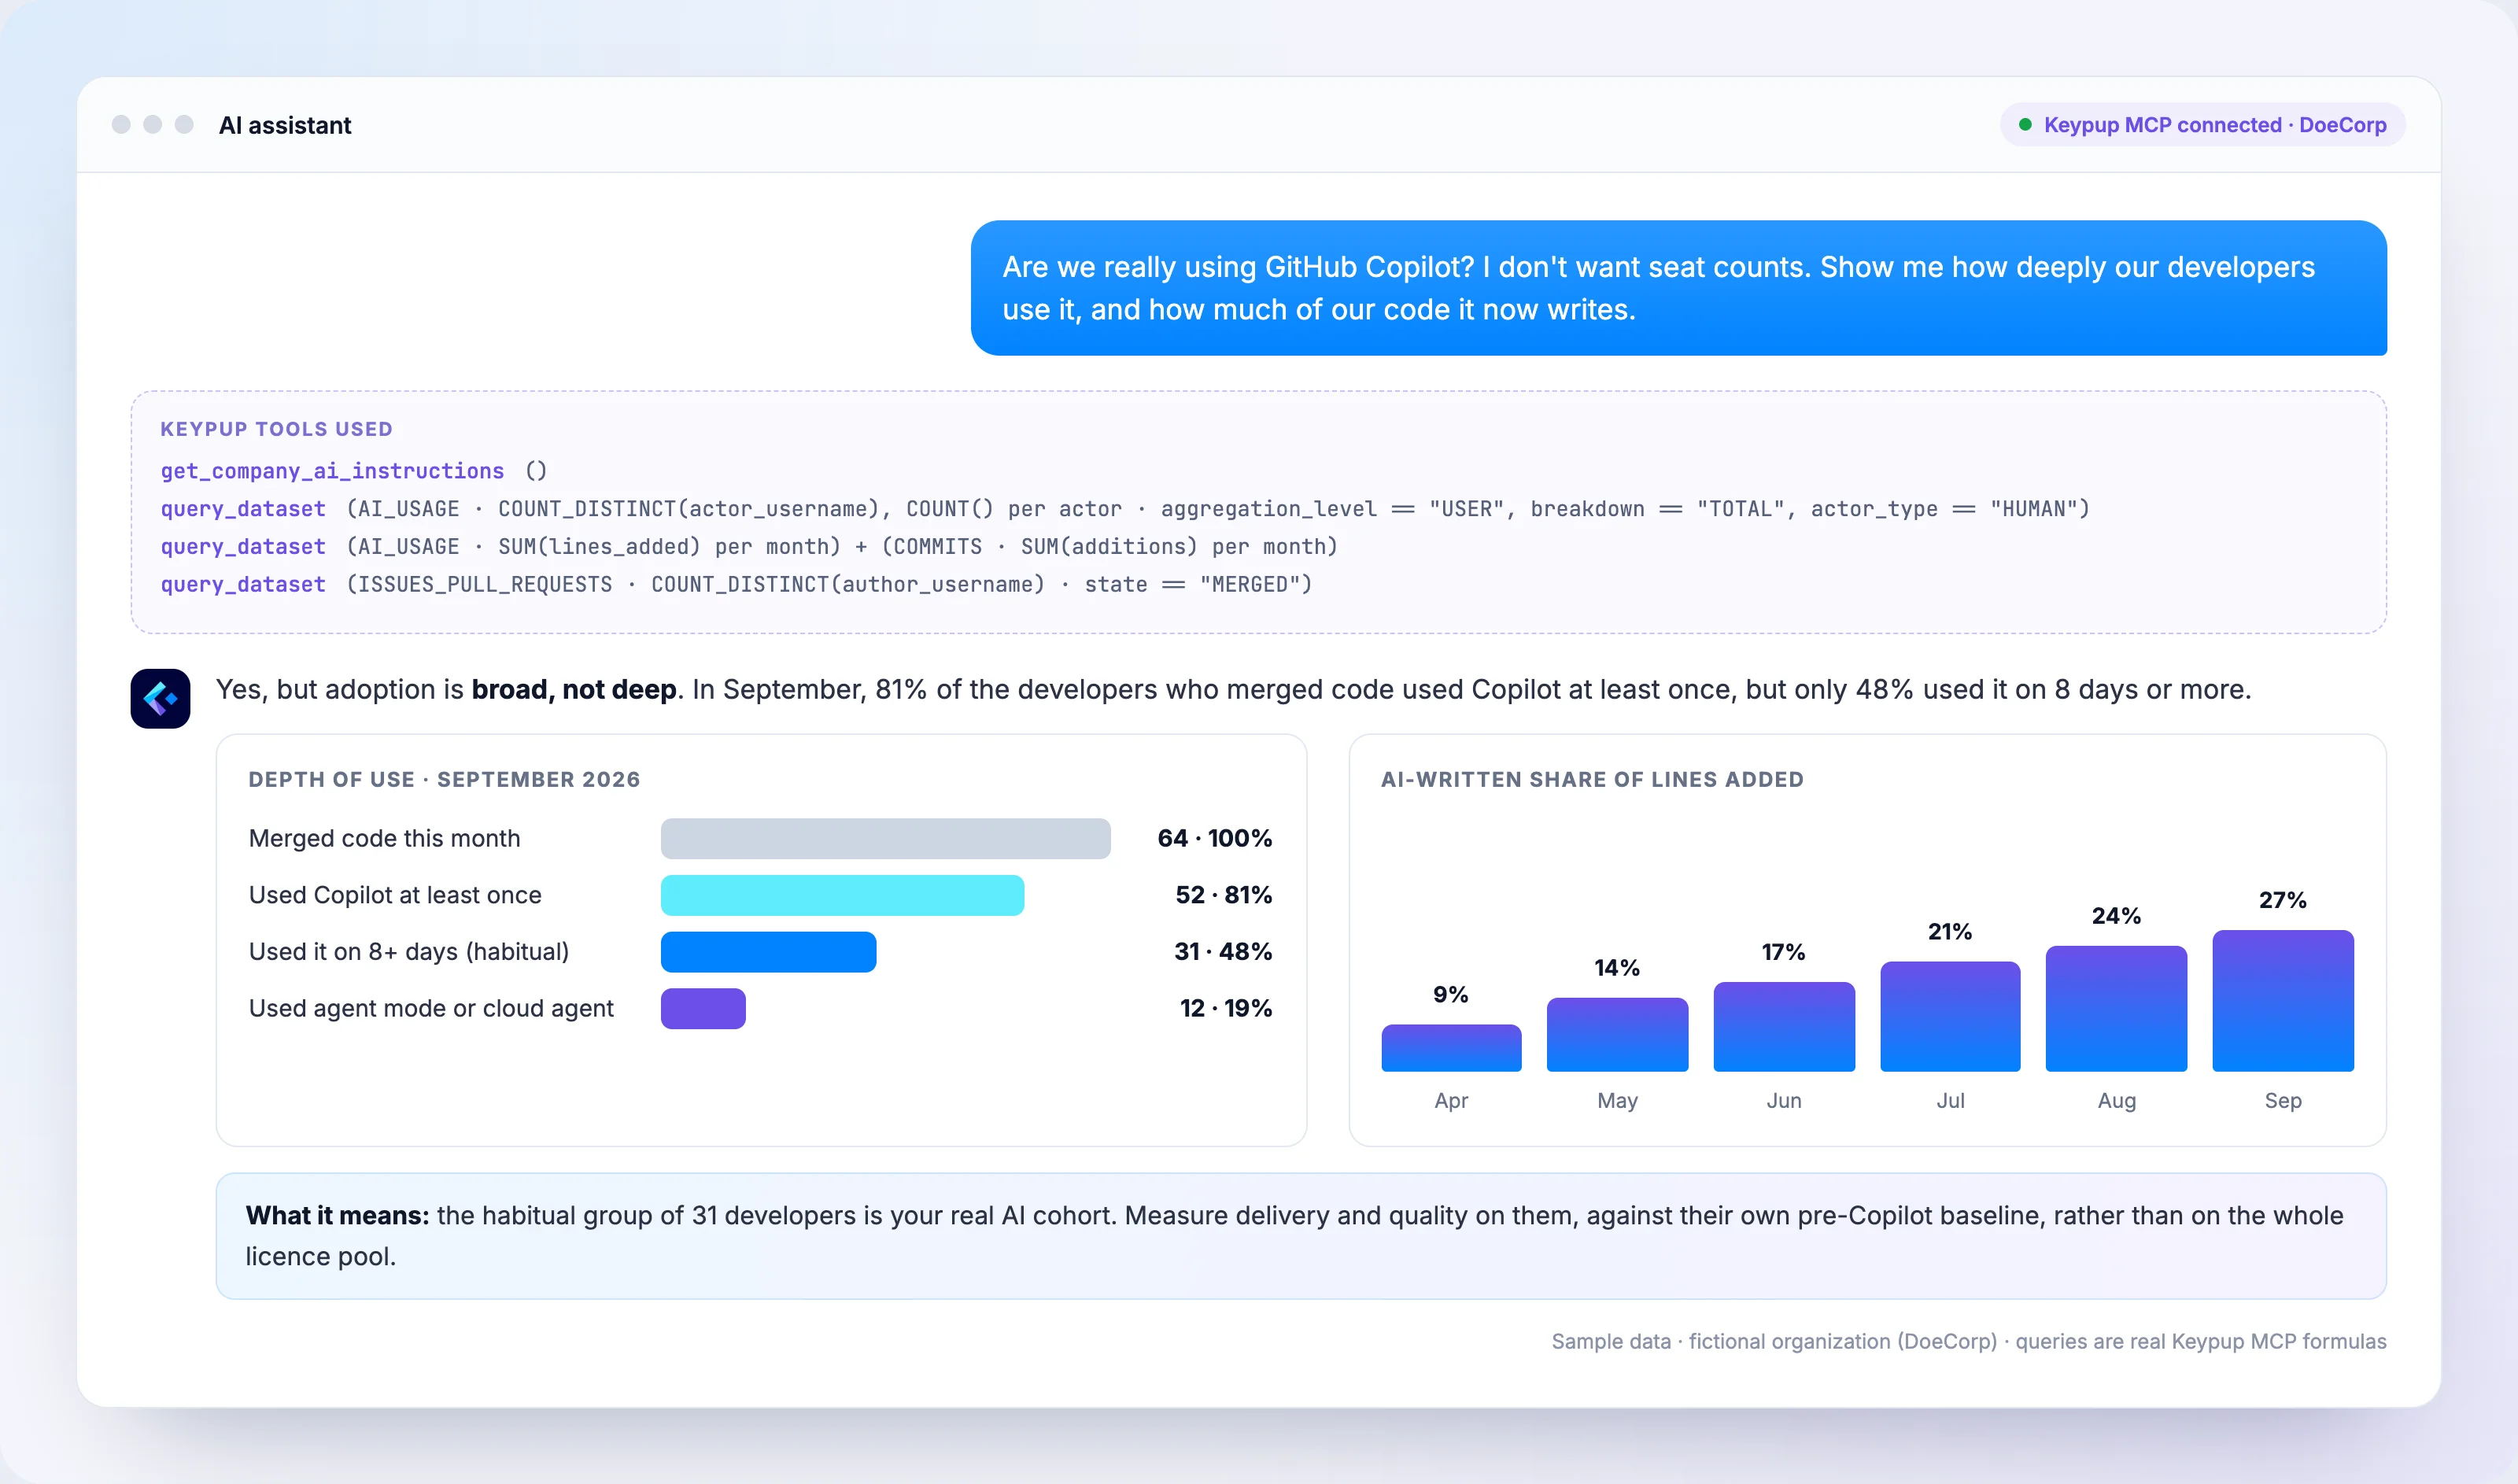
Prompt to your AI assistant, connected to the Keypup MCP Server
Are we really using GitHub Copilot? I don't want seat counts. For last month, show how many of the developers who merged code used Copilot at least once, how many used it on 8 days or more, and how many used agent mode or a cloud agent. Then show the share of lines added that were written by Copilot, month by month, since we rolled it out.
Analysis from Keypup AI
Key Insights
Adoption is broad, not deep. 81% of developers who merged code used Copilot in September, but only 48% used it on 8 days or more.
AI is writing a growing share of the code. The share of added lines written by Copilot tripled in six months, from 9% to 27%.
Agent usage is concentrated. Only 12 developers (19%) use agent mode or a cloud agent, the surfaces that produce the largest changes.
Bottlenecks and Problem Areas
21 developers use Copilot occasionally (1 to 7 days a month). They pay the learning cost without a habit that could change their output.
12 developers who merge code don't use Copilot at all, which is useful: they are the natural control group for Question 2.
Recommendations
Treat the 31 habitual users as your AI cohort when measuring impact, not the whole licence pool.
Track active days per developer and the AI share of added lines monthly. They are the leading indicators; delivery effects follow.
Priority Actions
Define usage cohorts: habitual (8+ active days a month), occasional (1 to 7) and non-users.
Record the cohort definition in your team's AI Instructions so every analysis uses the same thresholds.
Re-run the depth analysis monthly before reading any delivery or quality metric.
What a "Good" Adoption Level Looks Like
There is no universal benchmark worth copying, and acceptance rates in particular vary with how a team works. What matters is the trend in depth: the share of habitual users and the AI share of added lines should rise as enablement improves. If both stall while licences grow, the problem is enablement or fit, not the tool's potential.
Question 2: Is AI Improving Our SDLC?
This is the question behind every budget review, and the one where the METR result matters most: developers' own sense of speed is not evidence. You need delivery data, and you need to read it the right way.
Compare Cohorts, Not the Whole Organisation
Because each developer's AI usage sits in the same warehouse as their pull requests, you can split delivery metrics by usage cohort. For GitHub Copilot this works per developer: Copilot reports each user by their GitHub login, which is the same username that authors their pull requests.
Then compare each cohort with its own baseline, the same developers over the six months before the rollout. This controls for the fact that early adopters are often your strongest engineers to begin with: comparing habitual users against non-users directly would credit AI for a difference that already existed.
Measure the Whole Path, Not Just Coding
Four measures together show whether AI speeds up delivery or only moves the bottleneck:
Throughput: pull requests merged per developer per week.
Cycle time: from pull request creation to merge.
Time to first review: from review request to the first submitted review. This is where AI gains most often disappear.
Pull request size: lines changed per pull request. Larger changes take longer to review and are riskier to merge.
Prompt to your AI assistant, connected to the Keypup MCP Server
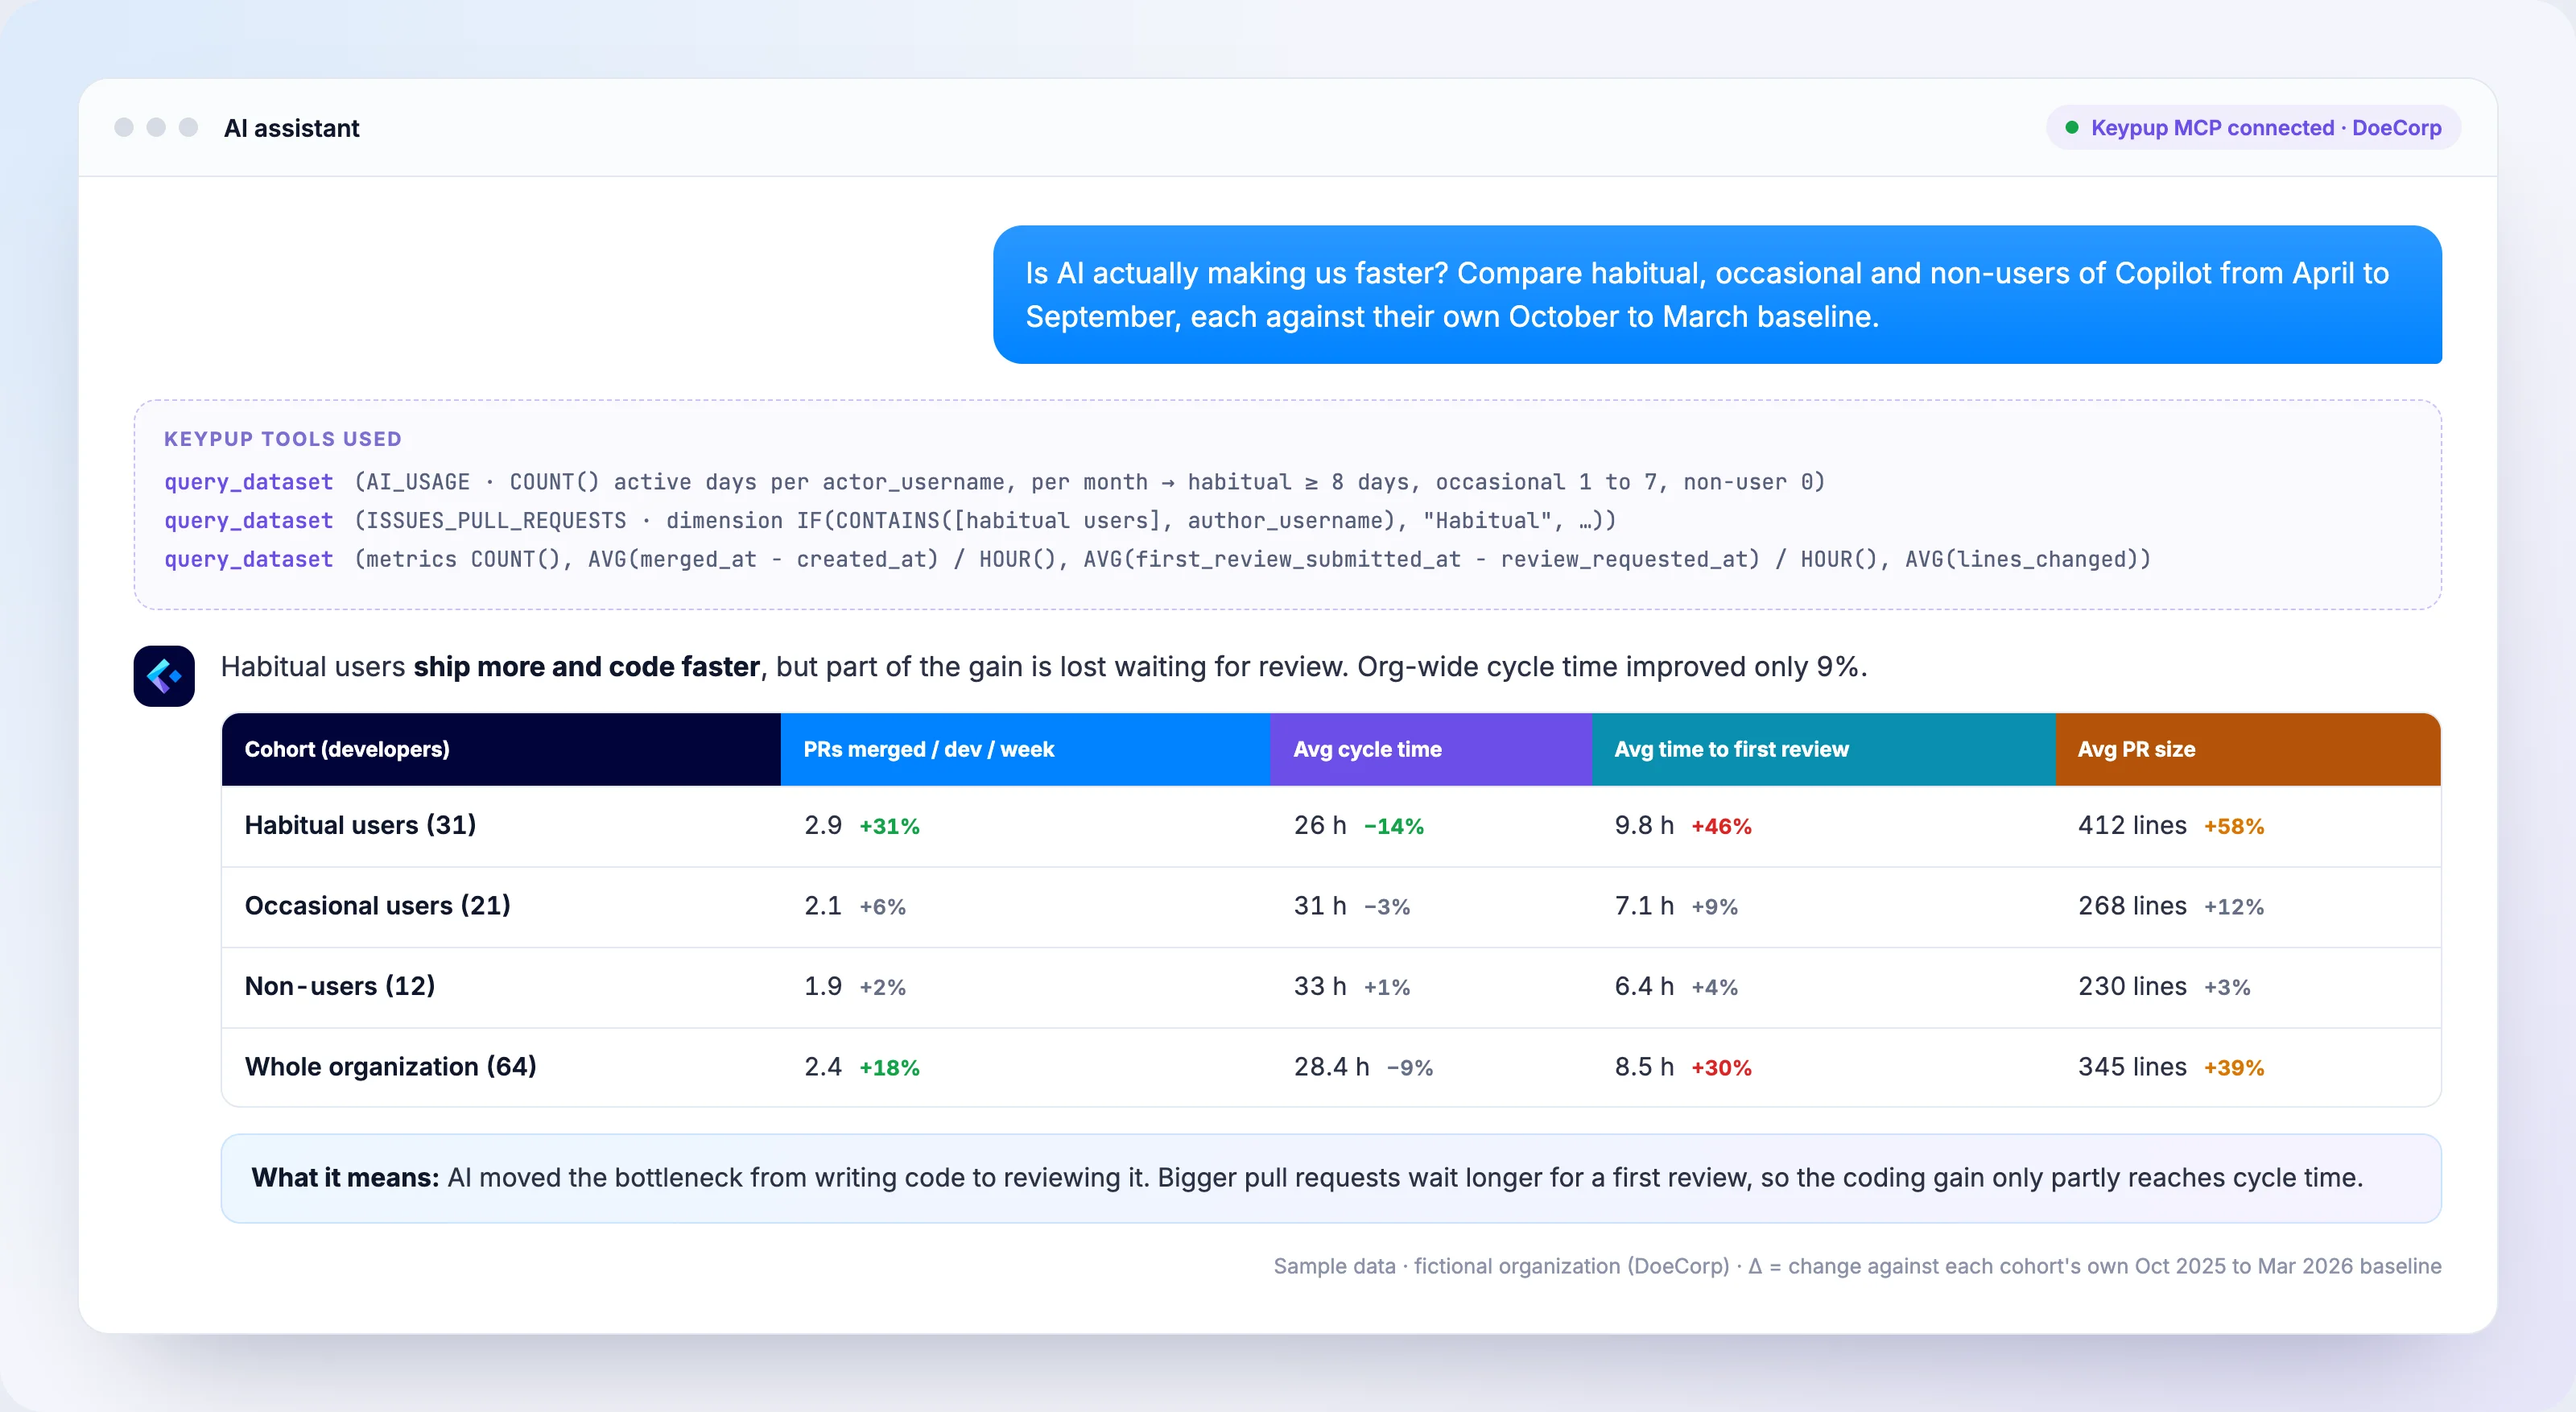
Is AI actually making us faster? Split developers into habitual Copilot users (8 or more active days a month), occasional users (1 to 7 days) and non-users. For merged pull requests from April to September, show for each cohort the pull requests merged per developer per week, the average cycle time, the average time to first review and the average lines changed, each compared with the same developers from October to March. Add a row for the whole organisation.
Analysis from Keypup AI
Key Insights
AI users ship more. Habitual users merge 2.9 pull requests per developer per week, 31% more than their own baseline. Occasional users gained 6%, non-users 2%.
Coding got faster, waiting got longer. Habitual users' cycle time fell 14%, but their time to first review rose 46%, from 6.7 to 9.8 hours.
The organisation captured only part of the gain. Org-wide throughput rose 18%, but cycle time improved only 9%.
Bottlenecks and Problem Areas
Habitual users' pull requests are 58% larger than before. Bigger changes queue longer for review and take longer to review.
Time to first review rose 30% across the organisation: reviewers, often non-users or occasional users, absorb the extra volume.
Recommendations
Treat review capacity as part of the AI rollout. The throughput gain is real only if reviews keep pace.
Encourage smaller, more frequent pull requests for AI-assisted work, so the speed gain reaches merge rather than piling up in review.
Priority Actions
Set a pull request size guideline for AI-assisted changes and track the share of pull requests above it.
Track time to first review weekly, split by author cohort.
Review cycle time by cohort monthly; a widening gap between throughput and cycle time means the bottleneck has moved to review.
Why the Gains Rarely Show Up in Lead Time Straight Away
This sample matches what DORA reports at industry level: AI now improves throughput, but the improvement shrinks on its way through the pipeline. Writing code is only one stage. If review, testing and release don't absorb the extra volume, the gain sits in a queue. We look at the review side in more detail in The AI Review Tax and in Measuring the Real Impact of AI Coding Assistants on Your Pull Request Cycle Time.
Question 3: Does AI-Generated Code Hurt Quality?
This is the question developers themselves raise most: two-thirds of Stack Overflow's 2025 respondents struggle with AI answers that are "almost right, but not quite," and DORA still finds a negative relationship between AI adoption and delivery stability. A throughput gain that comes with more rework is not a gain.
No single metric captures quality, so use a small set of signals that move early, again by cohort and against each cohort's baseline:
Bug-fix share: the share of merged pull requests that fix bugs, using your team's own convention (a bug label, or the type of the Jira issue a pull request resolves). A rising share means more effort goes into rework.
Change requests: the share of pull requests where a reviewer requested changes. A sharp drop while pull requests grow is not a sign of better code; it is often a sign of lighter review.
Large pull requests approved without changes: pull requests above 500 lines approved without any change request. This is the clearest early signal of rubber-stamp reviews.
Very large pull requests: the share of pull requests above 1,000 lines, which are hard to review properly at all.
If your team tags production failures consistently, add change failure rate from Keypup's DORA metrics templates, which you can calculate from pull requests or commits using your own naming conventions.
Prompt to your AI assistant, connected to the Keypup MCP Server
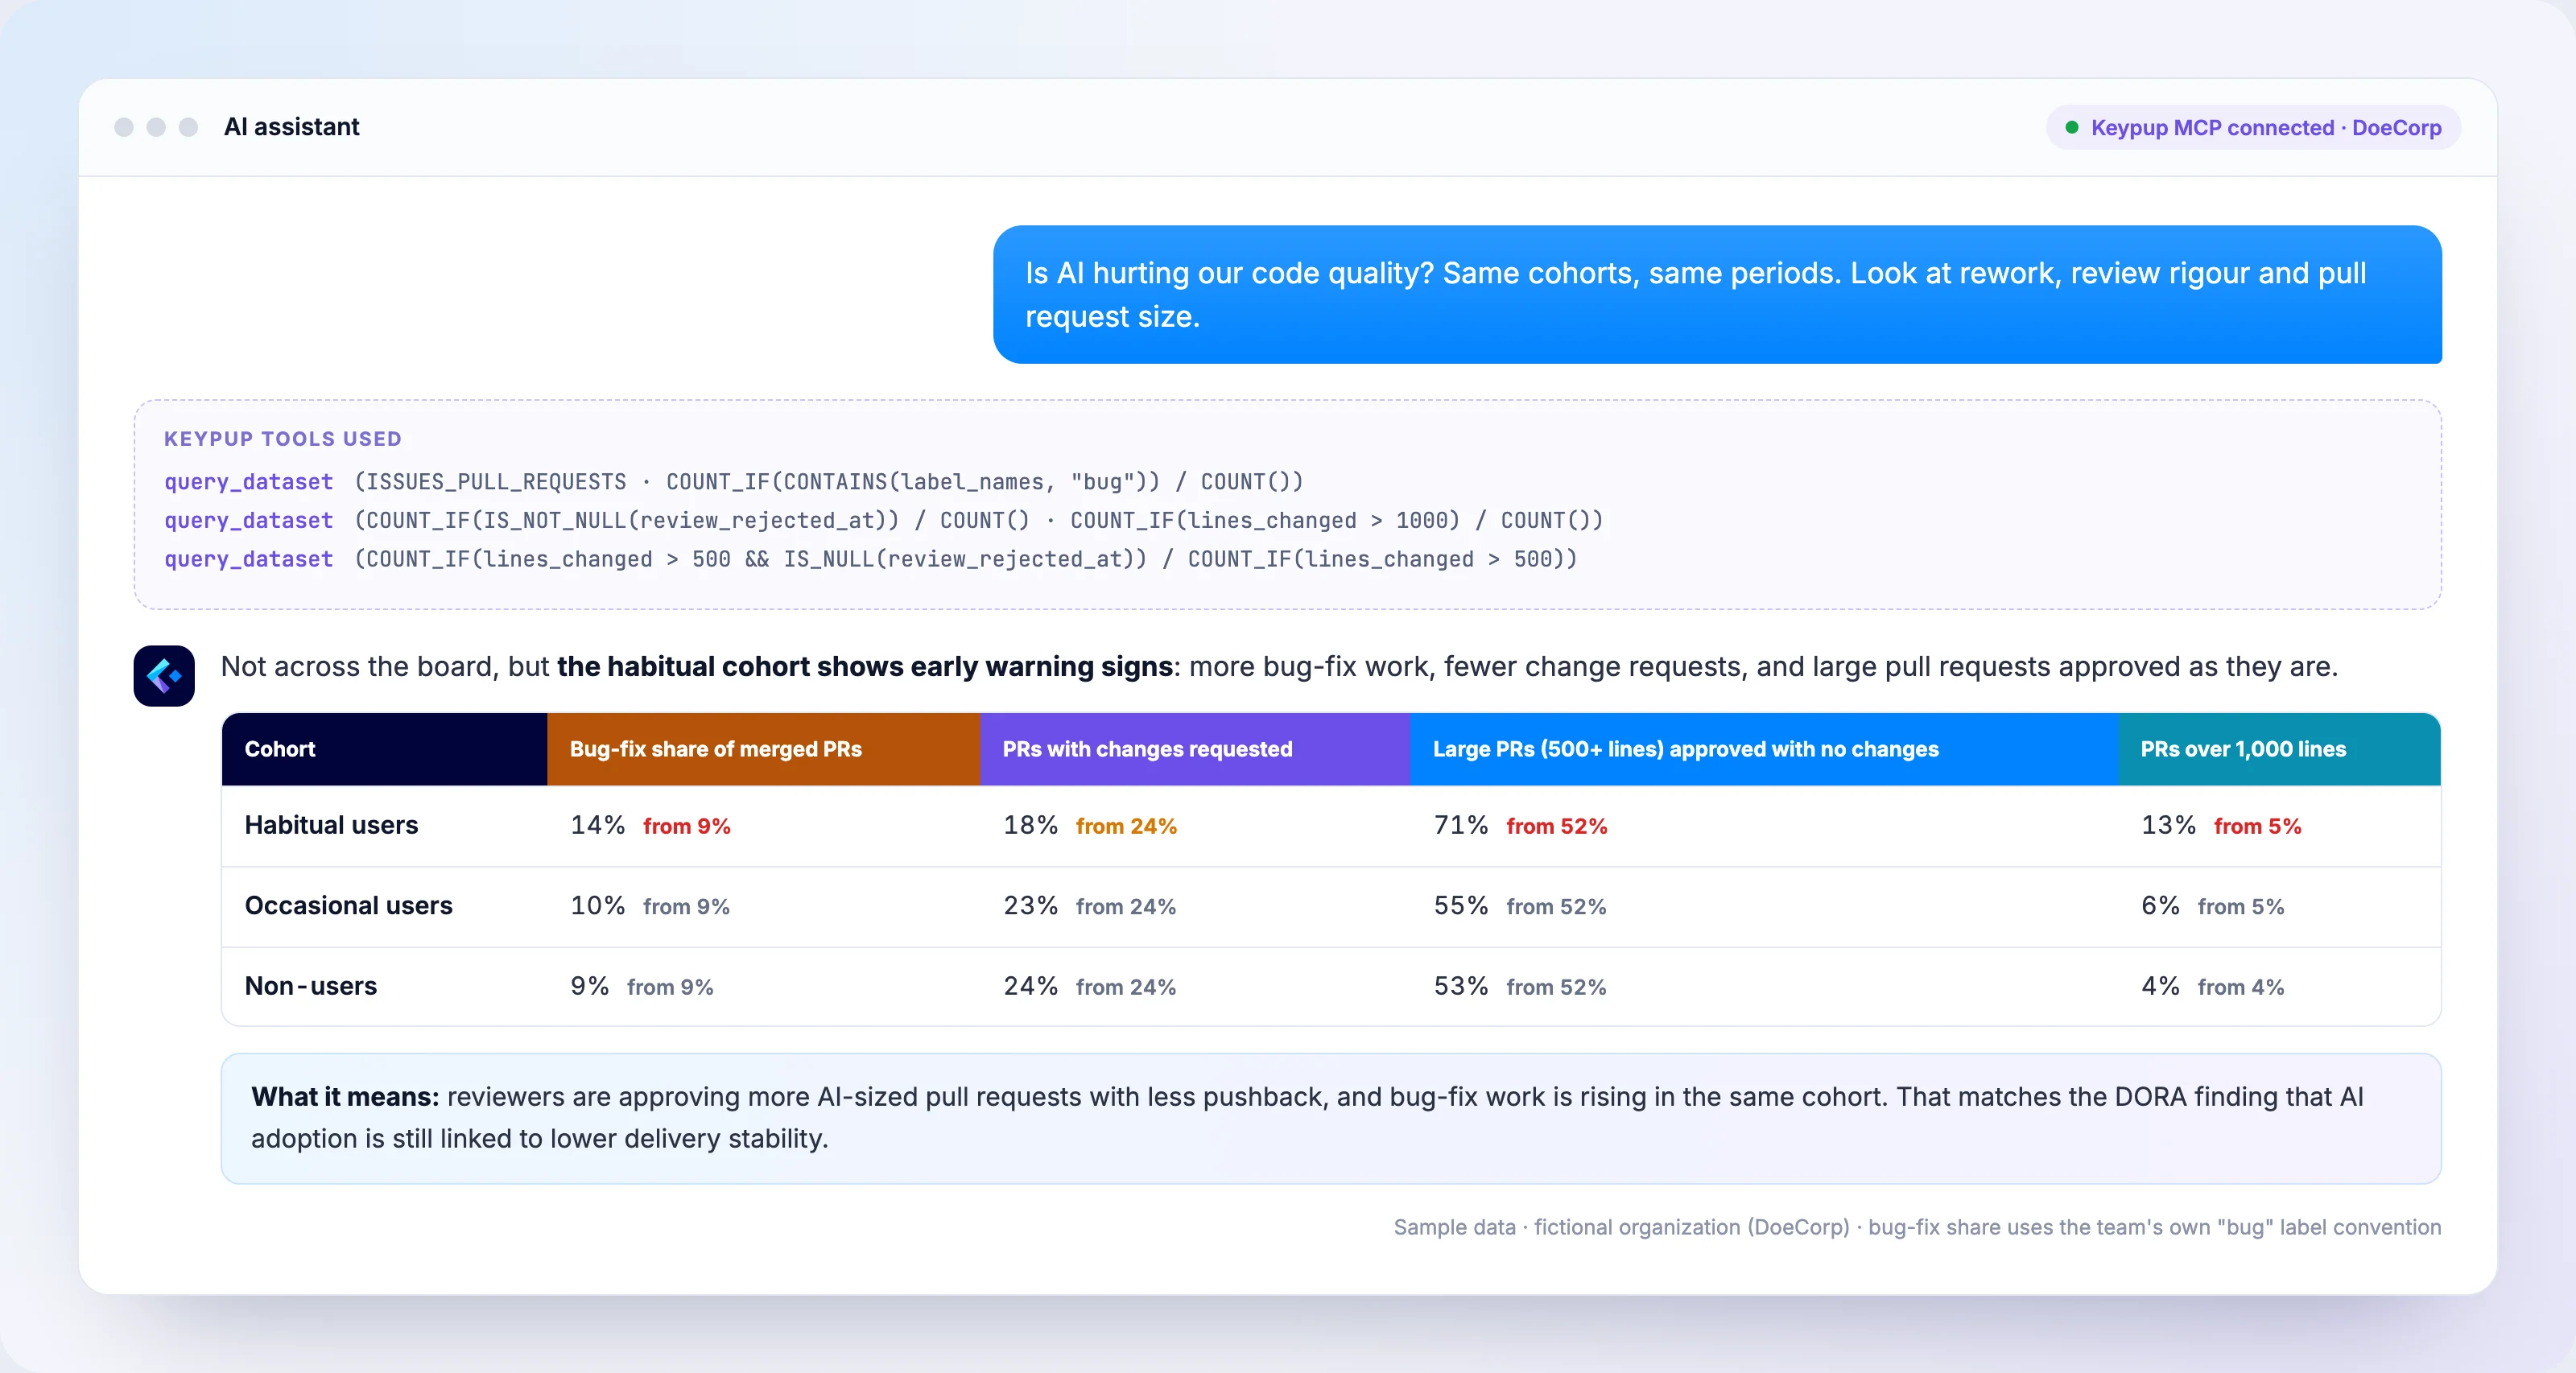
Is AI hurting our code quality? For the same three Copilot cohorts and the same periods, compare the share of merged pull requests labelled bug, the share of pull requests where changes were requested, the share of pull requests over 500 lines that were approved without any change request, and the share of pull requests over 1,000 lines.
Analysis from Keypup AI
Key Insights
Quality signals are flat for most developers. Occasional users and non-users stay within a point or two of their baseline on every signal.
The habitual cohort shows early warnings. Bug-fix share rose from 9% to 14%, while change requests fell from 24% to 18%.
Large pull requests are being approved as they are. 71% of pull requests above 500 lines from habitual users were approved without changes, against 52% before.
Bottlenecks and Problem Areas
Very large pull requests (over 1,000 lines) went from 5% to 13% of habitual users' work. These are the changes reviewers are least able to check.
Fewer change requests on larger changes, combined with more bug fixes afterwards, suggests problems are found after merge instead of in review.
Recommendations
Require a second reviewer for pull requests above 500 lines, regardless of who or what wrote them.
Track bug-fix share by cohort monthly. If it keeps rising, the throughput gain from Question 2 is partly being spent on rework.
Priority Actions
Make sure bug fixes are labelled consistently, so bug-fix share stays trustworthy.
Add review rules for very large pull requests, and split agent-generated changes before review.
Re-check these four signals one month after any change to review rules.
The Verdict for Leadership
Once the three questions are answered, the summary for leadership writes itself. It should state a verdict per question, the evidence behind it, and what changes next quarter.
Prompt to your AI assistant, connected to the Keypup MCP Server
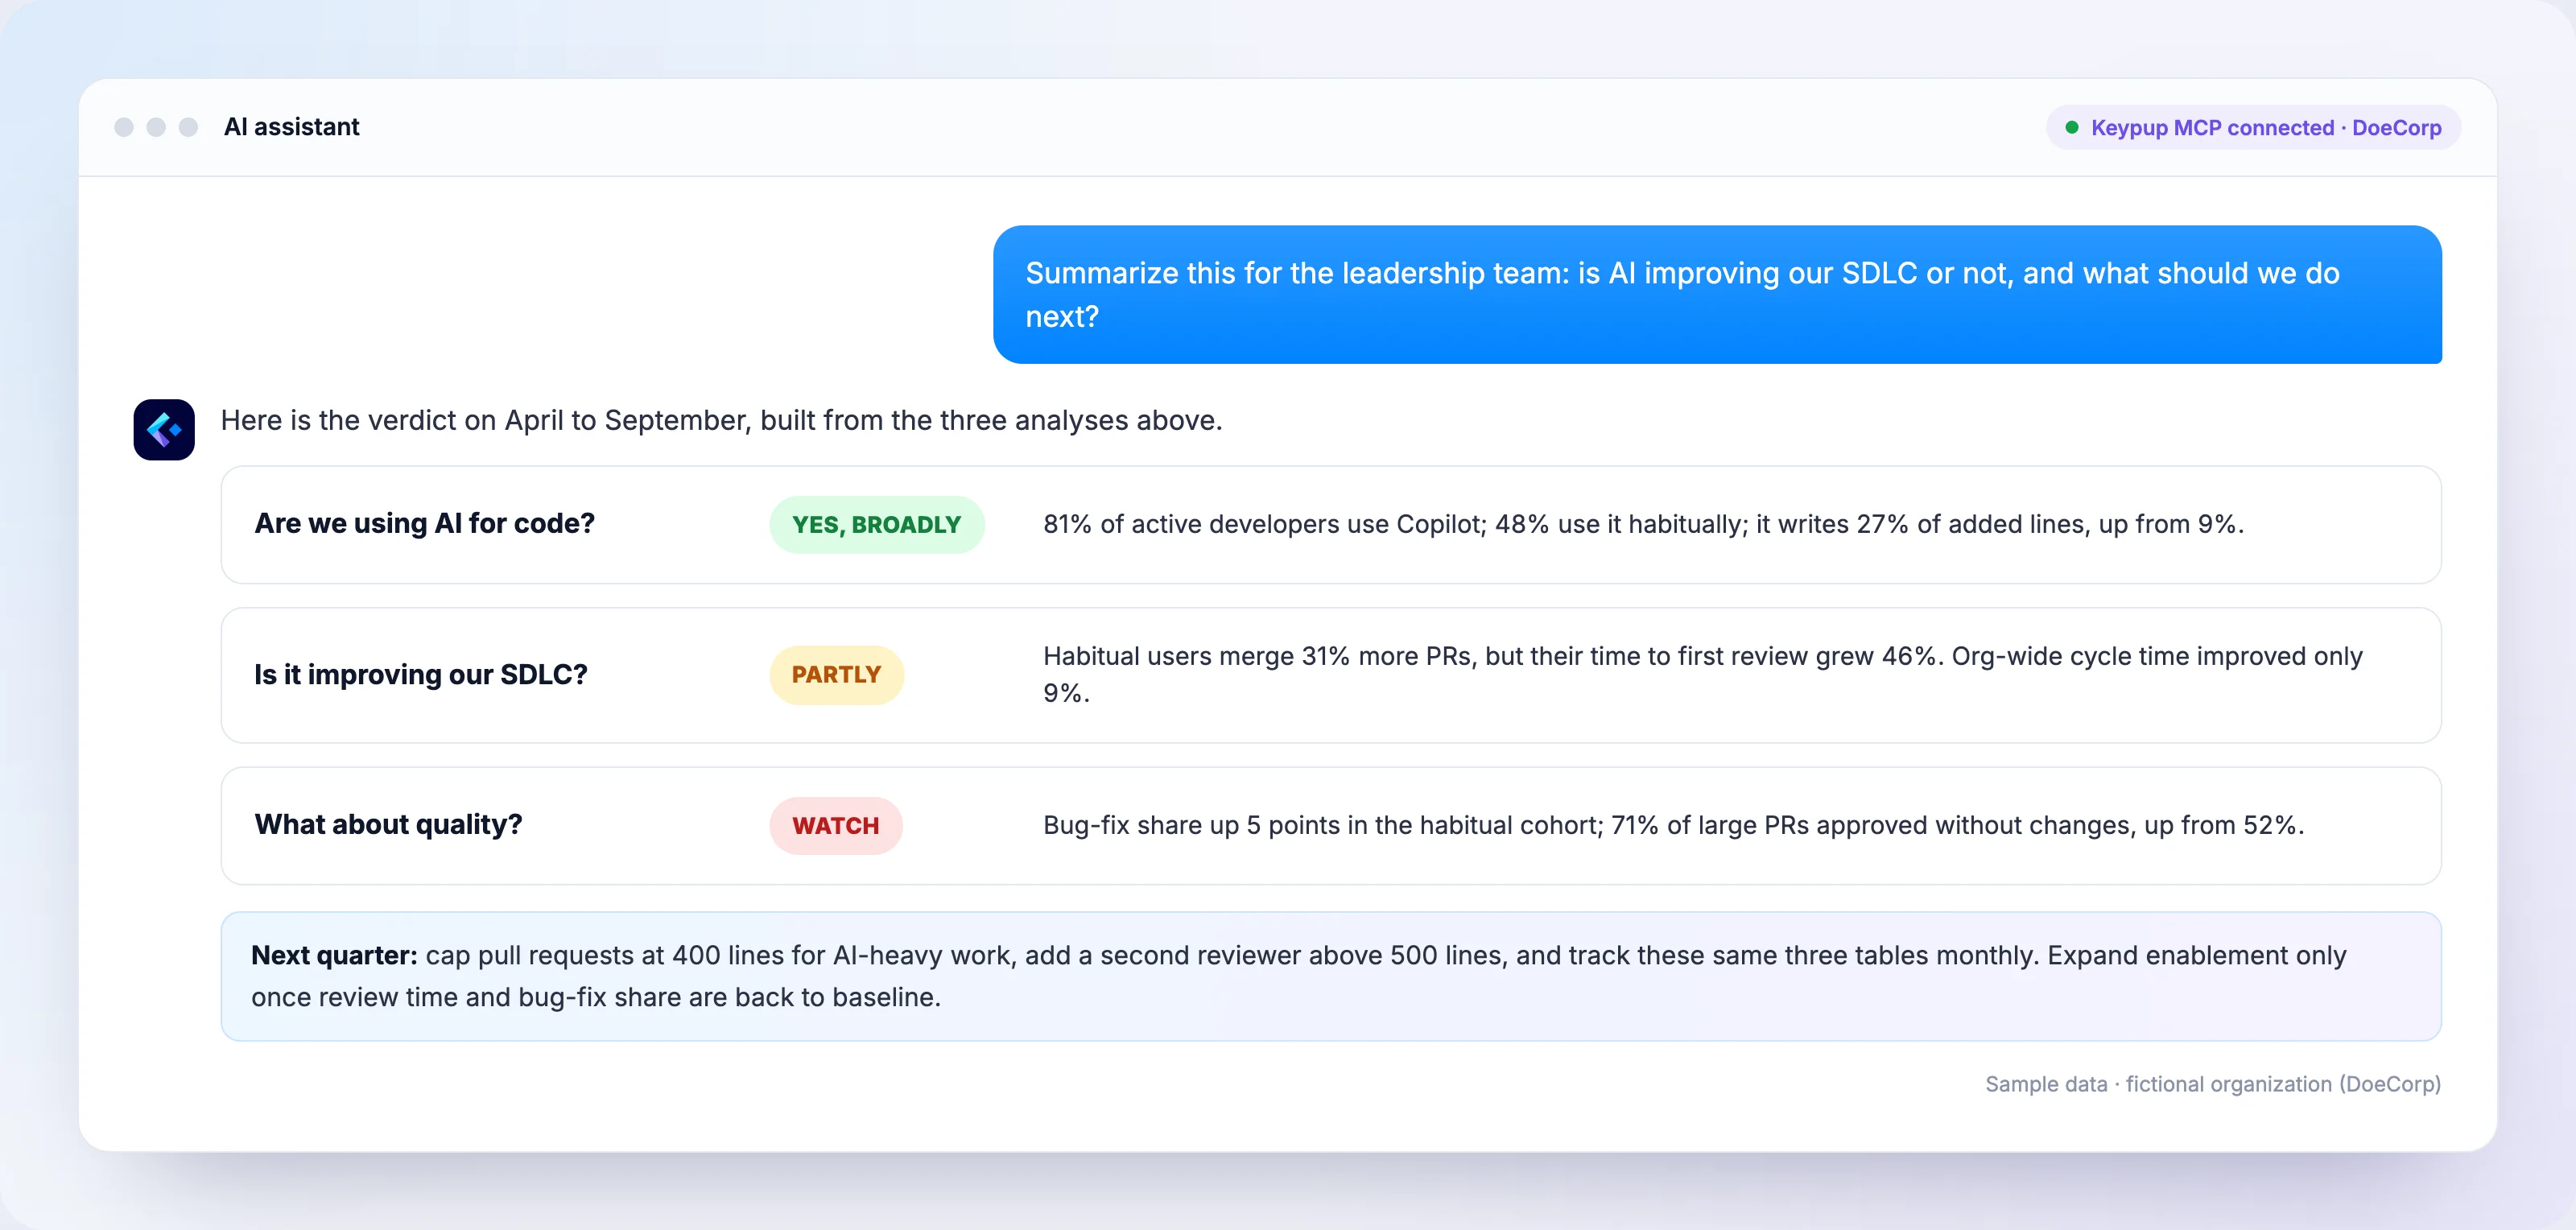
Summarize this for the leadership team: are we using AI for code, is it improving our SDLC, and is quality holding up? Give a one-word verdict per question with the supporting numbers, and recommend what we should change next quarter.
Analysis from Keypup AI
Key Insights
Usage: yes, broadly. 81% of developers use Copilot, 48% habitually, and it writes 27% of added lines.
SDLC: partly. Habitual users merge 31% more pull requests, but review delays absorb much of the gain.
Quality: watch. The habitual cohort shows more bug-fix work and lighter review on large changes.
Recommendations
Don't expand licences or mandate usage until review time and bug-fix share return to baseline.
Invest the next quarter in review capacity and pull request discipline: that is where this organisation's AI gain is currently lost.
Priority Actions
Cap AI-assisted pull requests at around 400 lines and add a second reviewer above 500.
Report the three tables monthly to leadership, with the same cohorts and baseline.
Re-assess the verdict after one quarter.
Your own verdict may be different. In some organisations the review pipeline absorbs AI-sized changes well and the answer to Question 2 is a clear yes; in others, adoption is shallow and Question 1 is the real problem. The value of the method is not the answer it gives DoeCorp. It is that every answer rests on your own delivery data.
Common Mistakes When Measuring AI Coding Assistants
Using acceptance rate as the ROI metric. It covers inline completions only and says nothing about delivery or quality.
Comparing AI users with non-users directly. Early adopters are often stronger engineers already. Compare each group with its own baseline.
Reading results too early. Developers need time to change how they work. Look at trends over several months rather than the first weeks after a rollout.
Counting lines of code as output. More lines can mean more duplication to maintain, as GitClear's data shows.
Ranking individual developers. Usage data is for finding where AI helps and where enablement is missing, not for leaderboards. Ranking people by usage rewards the wrong behaviour and erodes trust in the data.
Measuring speed without quality. DORA's results are clear that throughput and stability can move in opposite directions.
How to Run This Analysis in Keypup
1. Bring AI Usage Next to Your Delivery Data
Keypup's AI Usage dataset stores AI coding assistant activity as one row per day, broken down by developer, surface, model, client and language. GitHub Copilot is supported through the GitHub integration: enable the Copilot Metrics project in your list of GitHub projects, and Keypup imports up to one year of history on the first import. Claude Platform, OpenAI Platform and OpenAI Codex Enterprise are available in beta.
Because Copilot reports each user by their GitHub login, its usage joins directly with the pull requests those developers author. Other providers report display names or email addresses, so per-developer comparisons across providers need the identities to be matched.
2. Start From the Dashboard Template
The AI Usage & Monitoring dashboard template covers active developers, adoption by model and surface, suggestion acceptance, code contribution and pull request outcomes. Add delivery and quality insights next to it, or start from the DORA Metrics dashboard for throughput and change failure rate.
3. Ask the Three Questions in Plain English
Connect Claude, ChatGPT, Cursor, VS Code or any MCP-compatible assistant to the Keypup MCP Server at https://hq.keypup.io/mcp, in one click with OAuth. The MCP tools are read-only: your assistant can query and analyse, never change your data. Then ask the questions above, refine them in conversation, and keep the cohort definitions consistent by writing them into your team's AI Instructions, which the MCP Server reads at the start of each conversation.
4. Review the Verdict Every Month
Re-run the three questions monthly with the same cohorts and baseline. The trend over a quarter tells you far more than any single month. For the broader framework, see how to measure the impact of AI on software development.
Frequently Asked Questions
Does GitHub Copilot make developers faster?
It depends on the team, and on what "faster" means. The 2025 DORA report links AI adoption with higher delivery throughput, while METR's 2025 trial found experienced developers 19% slower on their own repositories. The only reliable answer for your organisation comes from comparing usage cohorts against their own baseline on throughput, cycle time and time to first review.
Does AI-generated code have more bugs?
Research points to risks rather than a universal answer: DORA finds AI adoption still linked to lower delivery stability, and GitClear observed more copy-pasted code and less refactoring since AI assistants spread. Measure it in your own data with bug-fix share, change requests and large pull requests approved without changes, compared by usage cohort.
How do you measure the ROI of AI coding assistants?
Answer three questions in order: how deeply developers use AI (active days and AI share of added lines), whether delivery improves for heavy users against their own baseline, and whether quality signals hold steady. Licence cost only becomes a return when delivery improves without a rise in rework.
Is suggestion acceptance rate a good measure of AI impact?
No. Acceptance rate only covers inline completions, not chat or agent mode, where an AI assistant can write large changes. A team can have a low acceptance rate while AI writes a large share of its code. Use it to understand how a surface is used, not to judge impact.
How long does it take to see the impact of AI on delivery metrics?
Expect a learning curve before usage habits change delivery numbers. Track the leading indicators (active days and AI share of added lines) from the first month, and judge delivery and quality on trends over at least a quarter, against a baseline of several months before the rollout.
Should we compare developers who use AI with those who don't?
Yes, but not directly. Developers who adopt AI early are often stronger engineers to begin with. Compare each cohort with its own pre-rollout baseline, then compare the size of the changes between cohorts.
Can Keypup measure Claude Code, OpenAI Codex or Cursor usage?
Keypup's AI Usage dataset supports GitHub Copilot, with Claude Platform (including Claude Code), OpenAI Platform and OpenAI Codex Enterprise in beta, and Cursor coming next. All providers map onto the same dataset, so they can be compared side by side.
Can I get these answers without building dashboards?
Yes. Connect your AI assistant to the Keypup MCP Server and ask the questions in plain English. The assistant reads your team's AI Instructions, turns the question into Keypup queries over your AI usage and pull request data, and explains the results.
Conclusion
"Are we using AI, is it making us faster, and is it breaking anything?" deserves a better answer than seat counts and developer sentiment. The research shows why: AI can speed up throughput while hurting stability, and developers can feel faster while being slower.
The three-question method gives you a verdict grounded in your own data: depth of use first, then delivery by cohort against a baseline, then quality signals that move early. With AI usage stored next to your pull requests, each answer is one query away, in a dashboard or in a conversation with your AI assistant. As AI writes a growing share of every codebase, the teams that measure its effect honestly will be the ones that get the gain without paying for it later.
Ready to Transform Your Analytics?
Join teams already using AI to make data-driven decisions faster than
ever.
Leadership asks why the roadmap is slipping. Engineering says "bugs and maintenance", but can't prove how much. Learn what engineering leaders on Reddit say about the keep-the-lights-on (KTLO) tax in large organizations, why investment allocation is so hard to measure, and how Keypup MCP uses Jira issue types, labels and linked pull requests to show where engineering capacity actually goes.
Compare the 5 best value stream analytics platforms for engineering leaders — Keypup, Pluralsight Flow, LinearB, Jellyfish and Swarmia — across DORA Metrics depth, cross-platform data unification, contextual analysis, customization, AI and natural language capabilities, and setup speed. Find out which value stream management platform turns Git, Jira and CI/CD data into prescriptive, actionable insights.
Ten-line pull requests get twenty comments. Two-thousand-line pull requests get "LGTM" in four minutes. Learn what engineering leaders on Reddit say about rubber-stamp code reviews in large organizations, why the problem stays invisible, and how Keypup MCP uses pull request size, review timestamps, approvals and comments to measure it repository by repository.