The KTLO Tax: Why You Can't Prove How Much Engineering Goes to Bugs and Maintenance
Leadership asks why the roadmap is slipping. Engineering says "bugs and maintenance", but can't prove how much. Learn what engineering leaders on Reddit say about the keep-the-lights-on (KTLO) tax in large organizations, why investment allocation is so hard to measure, and how Keypup MCP uses Jira issue types, labels and linked pull requests to show where engineering capacity actually goes.
Liam Davis
•12 min read
Table of Contents
TL;DR: In most enterprise engineering organizations, a large and growing share of capacity goes to "keeping the lights on" (KTLO): fixing bugs, upgrading dependencies, paying down tech debt. Everyone feels it, but almost nobody can prove how big it is, which teams carry it or whether it's getting worse — so roadmap slips get blamed on "velocity". This is the KTLO tax. The Keypup MCP Server reads every Jira issue's type, labels, priority, project, creation and closure dates, and every pull request that resolves it. Your AI assistant can then split merged work into bugs, maintenance and roadmap, follow the trend month by month, compare bug inflow with outflow, see how long bugs wait by team and priority, and find the few repositories that absorb most of the bug-fix work.
Every quarterly planning meeting has the same moment. The roadmap from last quarter is half delivered, the CFO asks where the engineering budget went, and someone says "a lot of it went to bugs and maintenance". Everyone nods. Nobody can say whether "a lot" means 20% or 60%, and nobody can say whether it's going up.
The Friction: Capacity Nobody Can Account For
KTLO — keep the lights on — is all the work needed to keep existing software running: bug fixes, dependency and framework upgrades, security patches, tech debt paydown, small operational changes. It's necessary work. The problem isn't that it exists; it's that in large organizations it's invisible until it has already eaten the roadmap.
It stays invisible for structural reasons:
Allocation is planned in spreadsheets, delivered in Jira. Leadership agrees on "70% roadmap, 30% maintenance" at the start of the year. Nothing checks that split against what actually ships.
Bug work arrives as interrupts. Bugs don't wait for sprint planning. They're picked up mid-sprint, fixed in small pull requests, and never show up in the roadmap review.
Maintenance hides inside feature tickets. "While I was there, I upgraded the library" is how a lot of tech debt gets paid — inside a Story nobody would classify as maintenance.
Every team classifies work differently. One team uses a tech-debt label, another an Improvement issue type, a third nothing at all. Rolled up across 50 teams, the numbers mean nothing.
The result: when the roadmap slips, the conversation is about speed instead of allocation, and the teams buried under bugs are the ones asked to "go faster".
Why This Matters: The Real Cost of an Unmeasured KTLO Tax
The Planning Problem
If a team spends 55% of its capacity on bugs and maintenance but plans as if it spends 30%, every roadmap it commits to is overbooked from day one. Slips aren't a delivery problem; they're arithmetic.
The Investment Problem
Without data, reliability investment is decided by whoever complains loudest. With data, you can see that a handful of systems generate most of the bug work and fund a fix there, rather than launching an organization-wide "quality initiative" that touches everything and changes nothing.
The Trust Problem
Finance and product leaders hear "maintenance" as an excuse when it can't be quantified. A clear, repeatable allocation number turns that excuse into a budget line everyone can discuss.
The Enterprise Discussion: What Engineering Leaders Are Actually Saying
Investment allocation and KTLO come up constantly wherever directors, engineering managers and staff engineers at large organizations compare notes. The quotes below are representative of recurring threads on r/ExperiencedDevs, r/EngineeringManagers, r/cto and r/softwareengineering.
Director of Engineering, Enterprise Fintech (r/EngineeringManagers)
"Every quarter I get asked why we delivered half the roadmap. I know the answer is bugs and upgrades, but when I say that, it sounds like an excuse. I need a number, and Jira can't give me one."
"Our team is officially 80% feature work. In reality I'd guess half our pull requests are fixing things that broke in production. None of it is tracked against the roadmap, so on paper we're just slow."
VP Engineering, Global E-commerce (r/cto)
"We agreed on a 70/20/10 split at the start of the year. Nobody has checked it since. I'd bet real money we're nowhere near it, but I can't prove it without asking 40 managers to fill in a spreadsheet."
The pattern holds: everyone agrees KTLO is eating the roadmap, but nobody can show how much, where, or whether it's getting worse — because that evidence is spread across thousands of Jira issues and the pull requests that resolve them.
How Keypup MCP Measures the KTLO Tax
The Keypup Model Context Protocol (MCP) Server gives your AI assistant structured access to the issues Keypup imports from Jira and the pull requests it imports from GitHub, GitLab, Bitbucket and Azure DevOps. For every Jira issue, that includes its issue type, labels, priority, project, workflow status and creation and closure dates. For every pull request, it includes its labels, repository, merge date, and the issue types and labels of the Jira issues it resolves — as long as the pull request references the issue key. That's enough to classify merged work and see where capacity really goes.
In the prompts below, work is classified with three simple rules: Bugs resolve a Jira issue of type Bug; Maintenance carries a tech-debt, maintenance or dependencies label on the pull request or its issue; Roadmap resolves any other issue type. Adapt the labels and issue types to your own Jira configuration.
1. Sizing the KTLO Tax
The first question is simple: of everything merged, how much kept the lights on?
MCP Prompt:
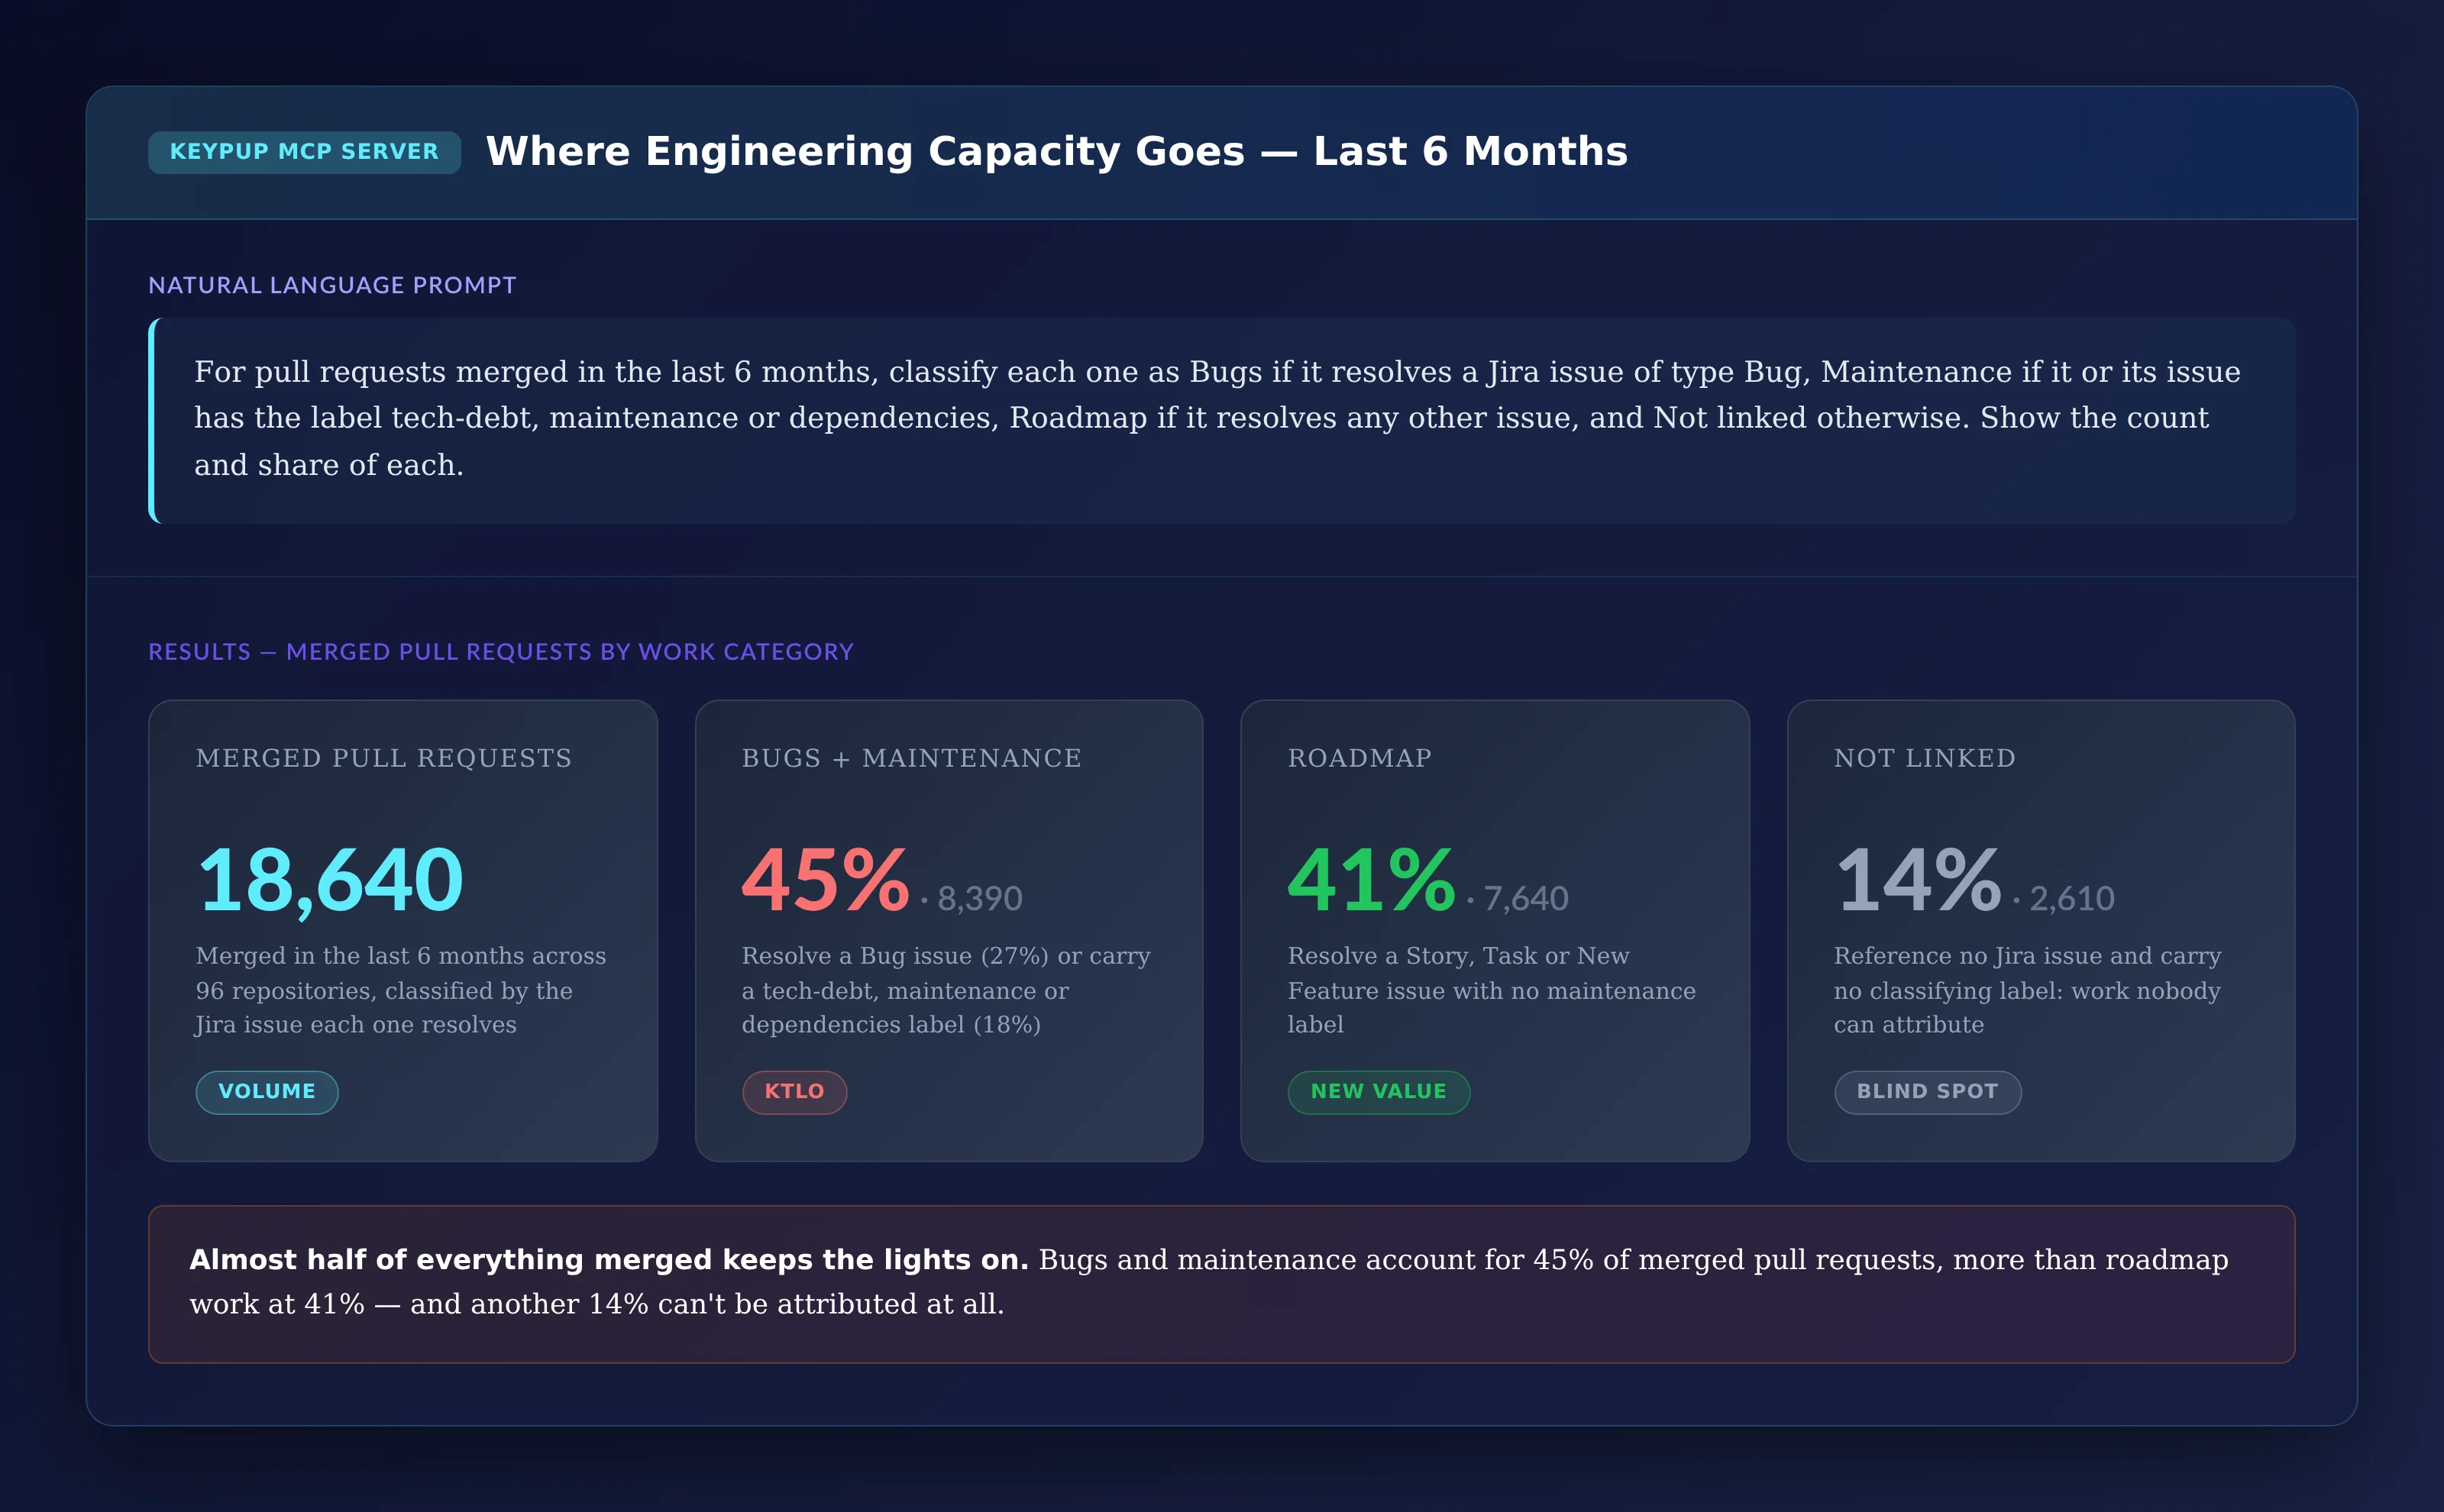
For pull requests merged in the last 6 months, classify each
one as Bugs if it resolves a Jira issue of type Bug,
Maintenance if it or its issue has the label tech-debt,
maintenance or dependencies, Roadmap if it resolves any other
issue, and Not linked otherwise. Show the count and share of
each.
Output: Where Engineering Capacity Goes — Last 6 Months
Key Insight: Almost half of everything merged keeps the lights on. Bugs and maintenance account for 45% of merged pull requests — more than roadmap work at 41% — and another 14% can't be attributed at all. That last number matters: it's the size of your blind spot, and the first thing to shrink.
2. Following the Trend
A single number starts the conversation. The trend tells you whether to worry.
MCP Prompt:
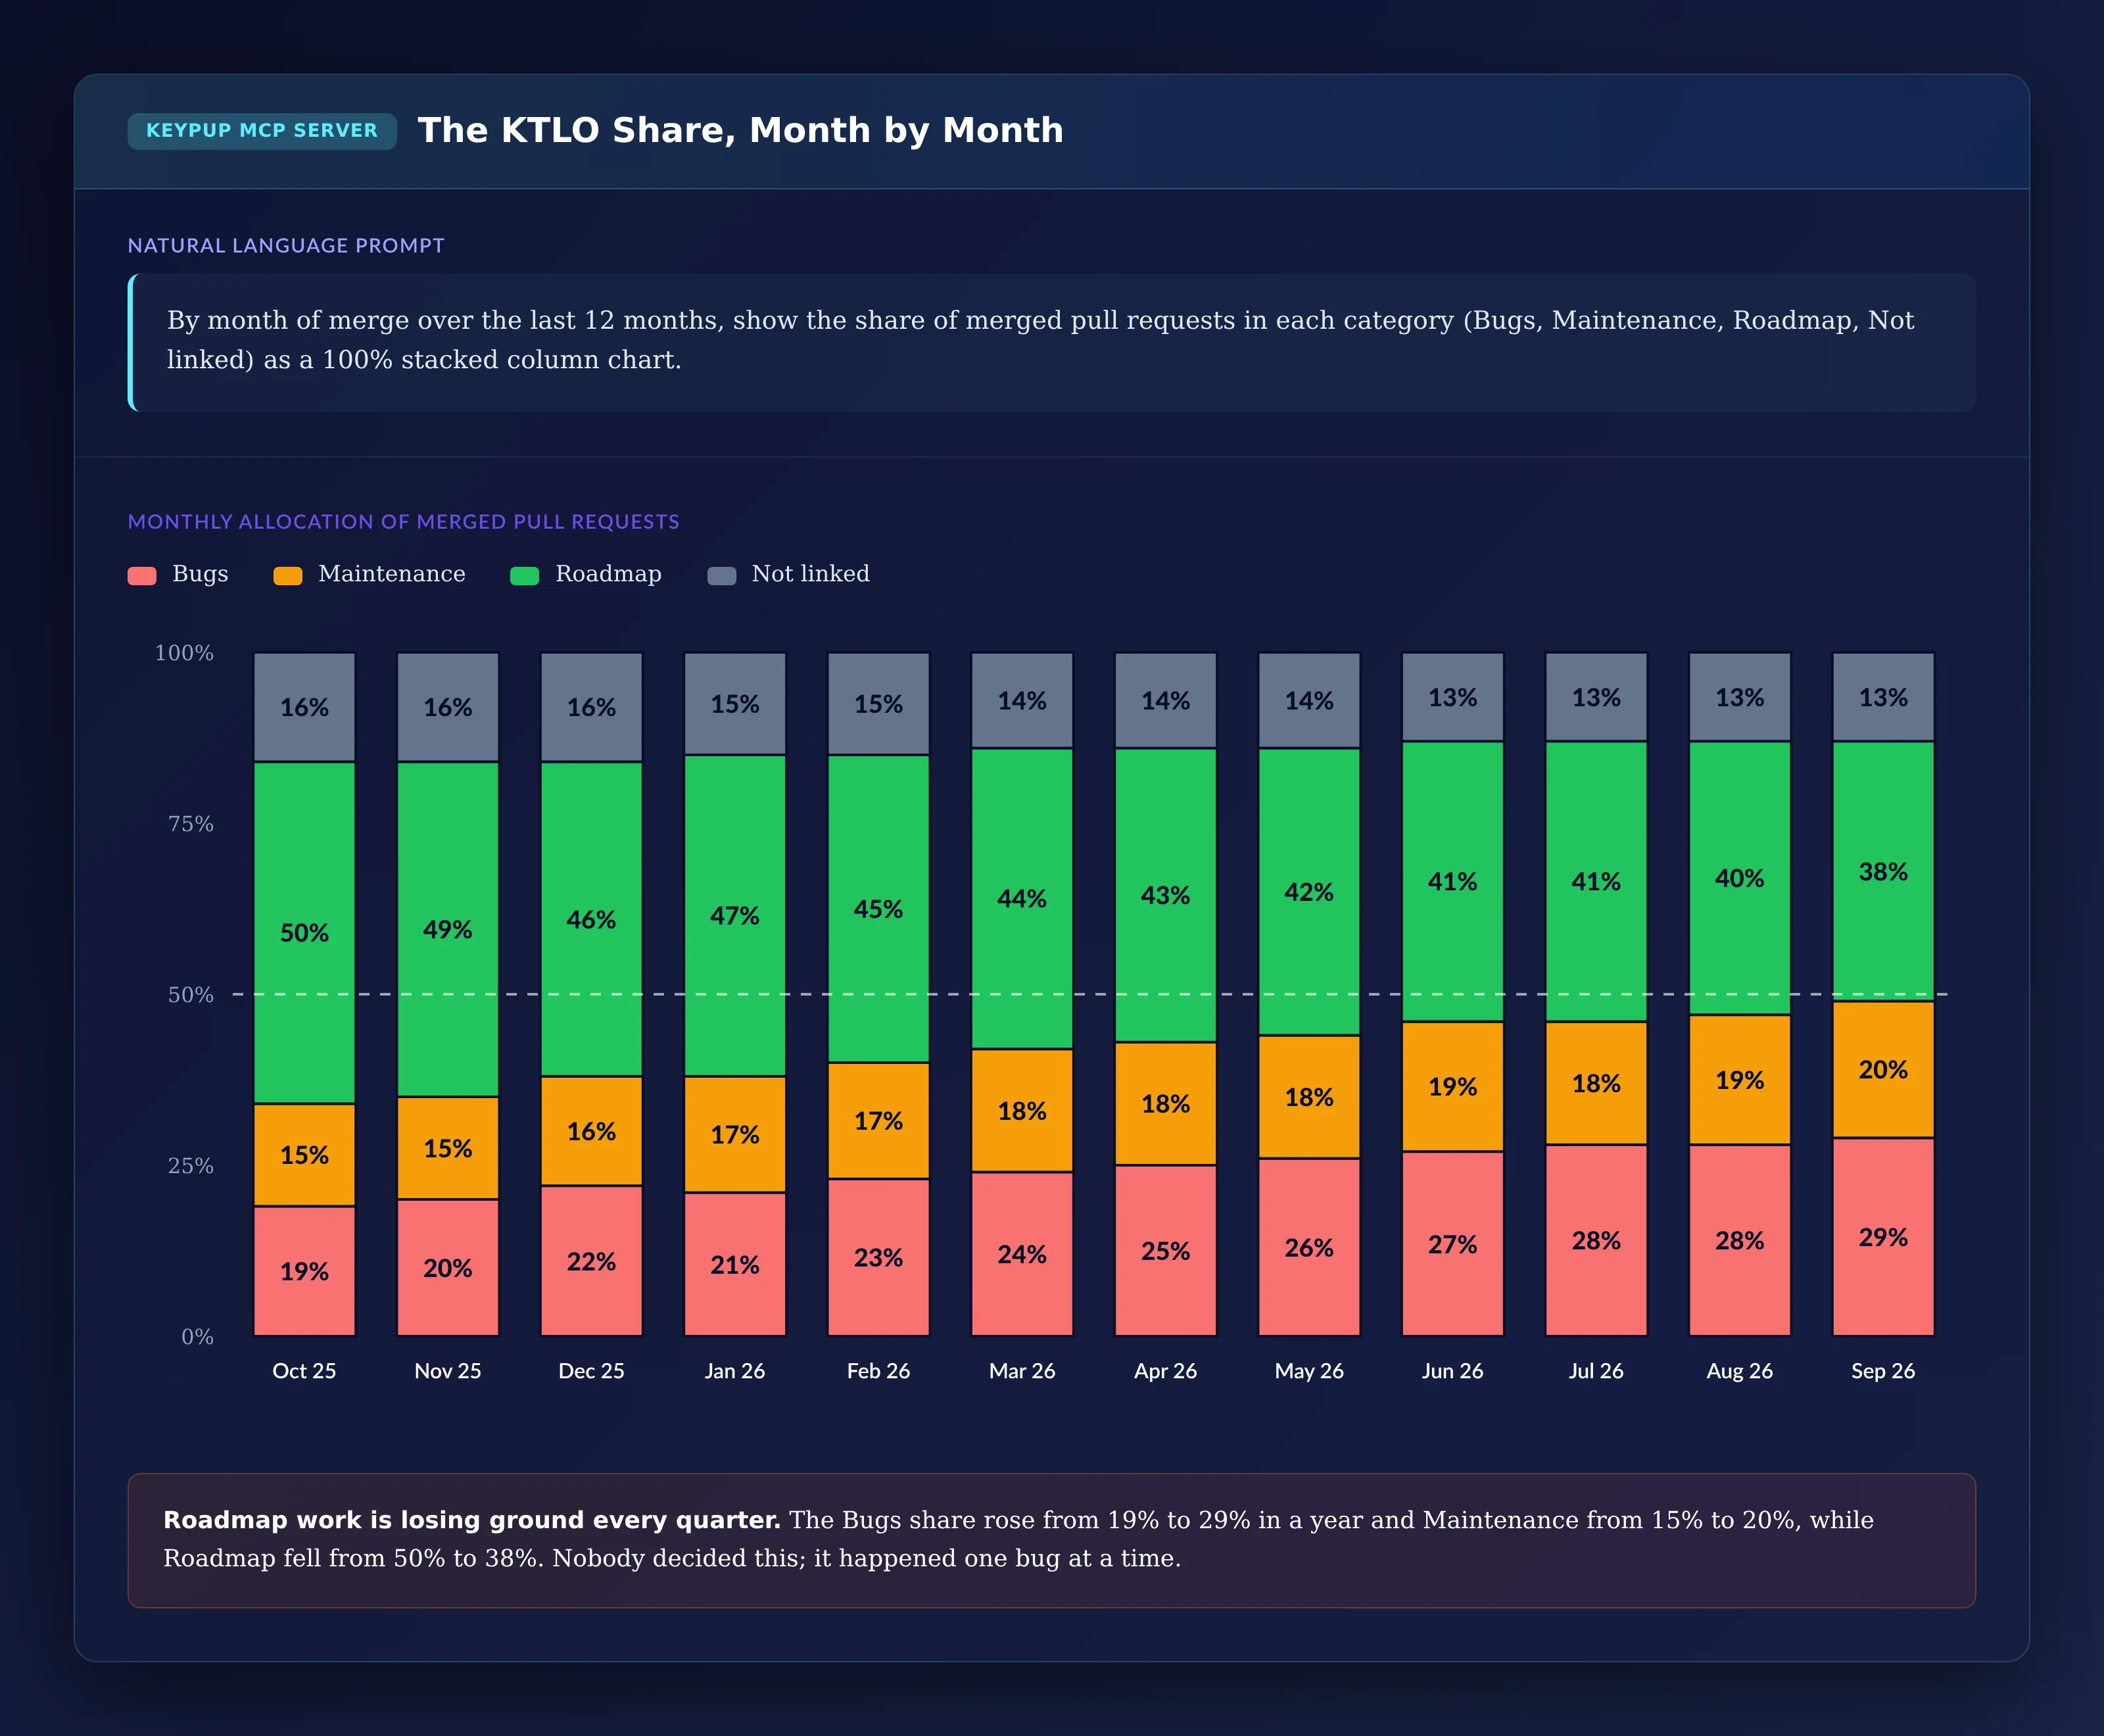
By month of merge over the last 12 months, show the share of
merged pull requests in each category (Bugs, Maintenance,
Roadmap, Not linked) as a 100% stacked column chart.
Output: The KTLO Share, Month by Month
Key Insight: Roadmap work is losing ground every quarter. The Bugs share rose from 19% to 29% in a year and Maintenance from 15% to 20%, while Roadmap fell from 50% to 38%. Nobody decided this. It happened one bug at a time, and it explains the roadmap slips better than any velocity chart.
3. Comparing Bug Inflow and Outflow
A rising bug share has two possible causes: more bugs coming in, or bugs being closed more slowly. The answer changes what you do.
MCP Prompt:
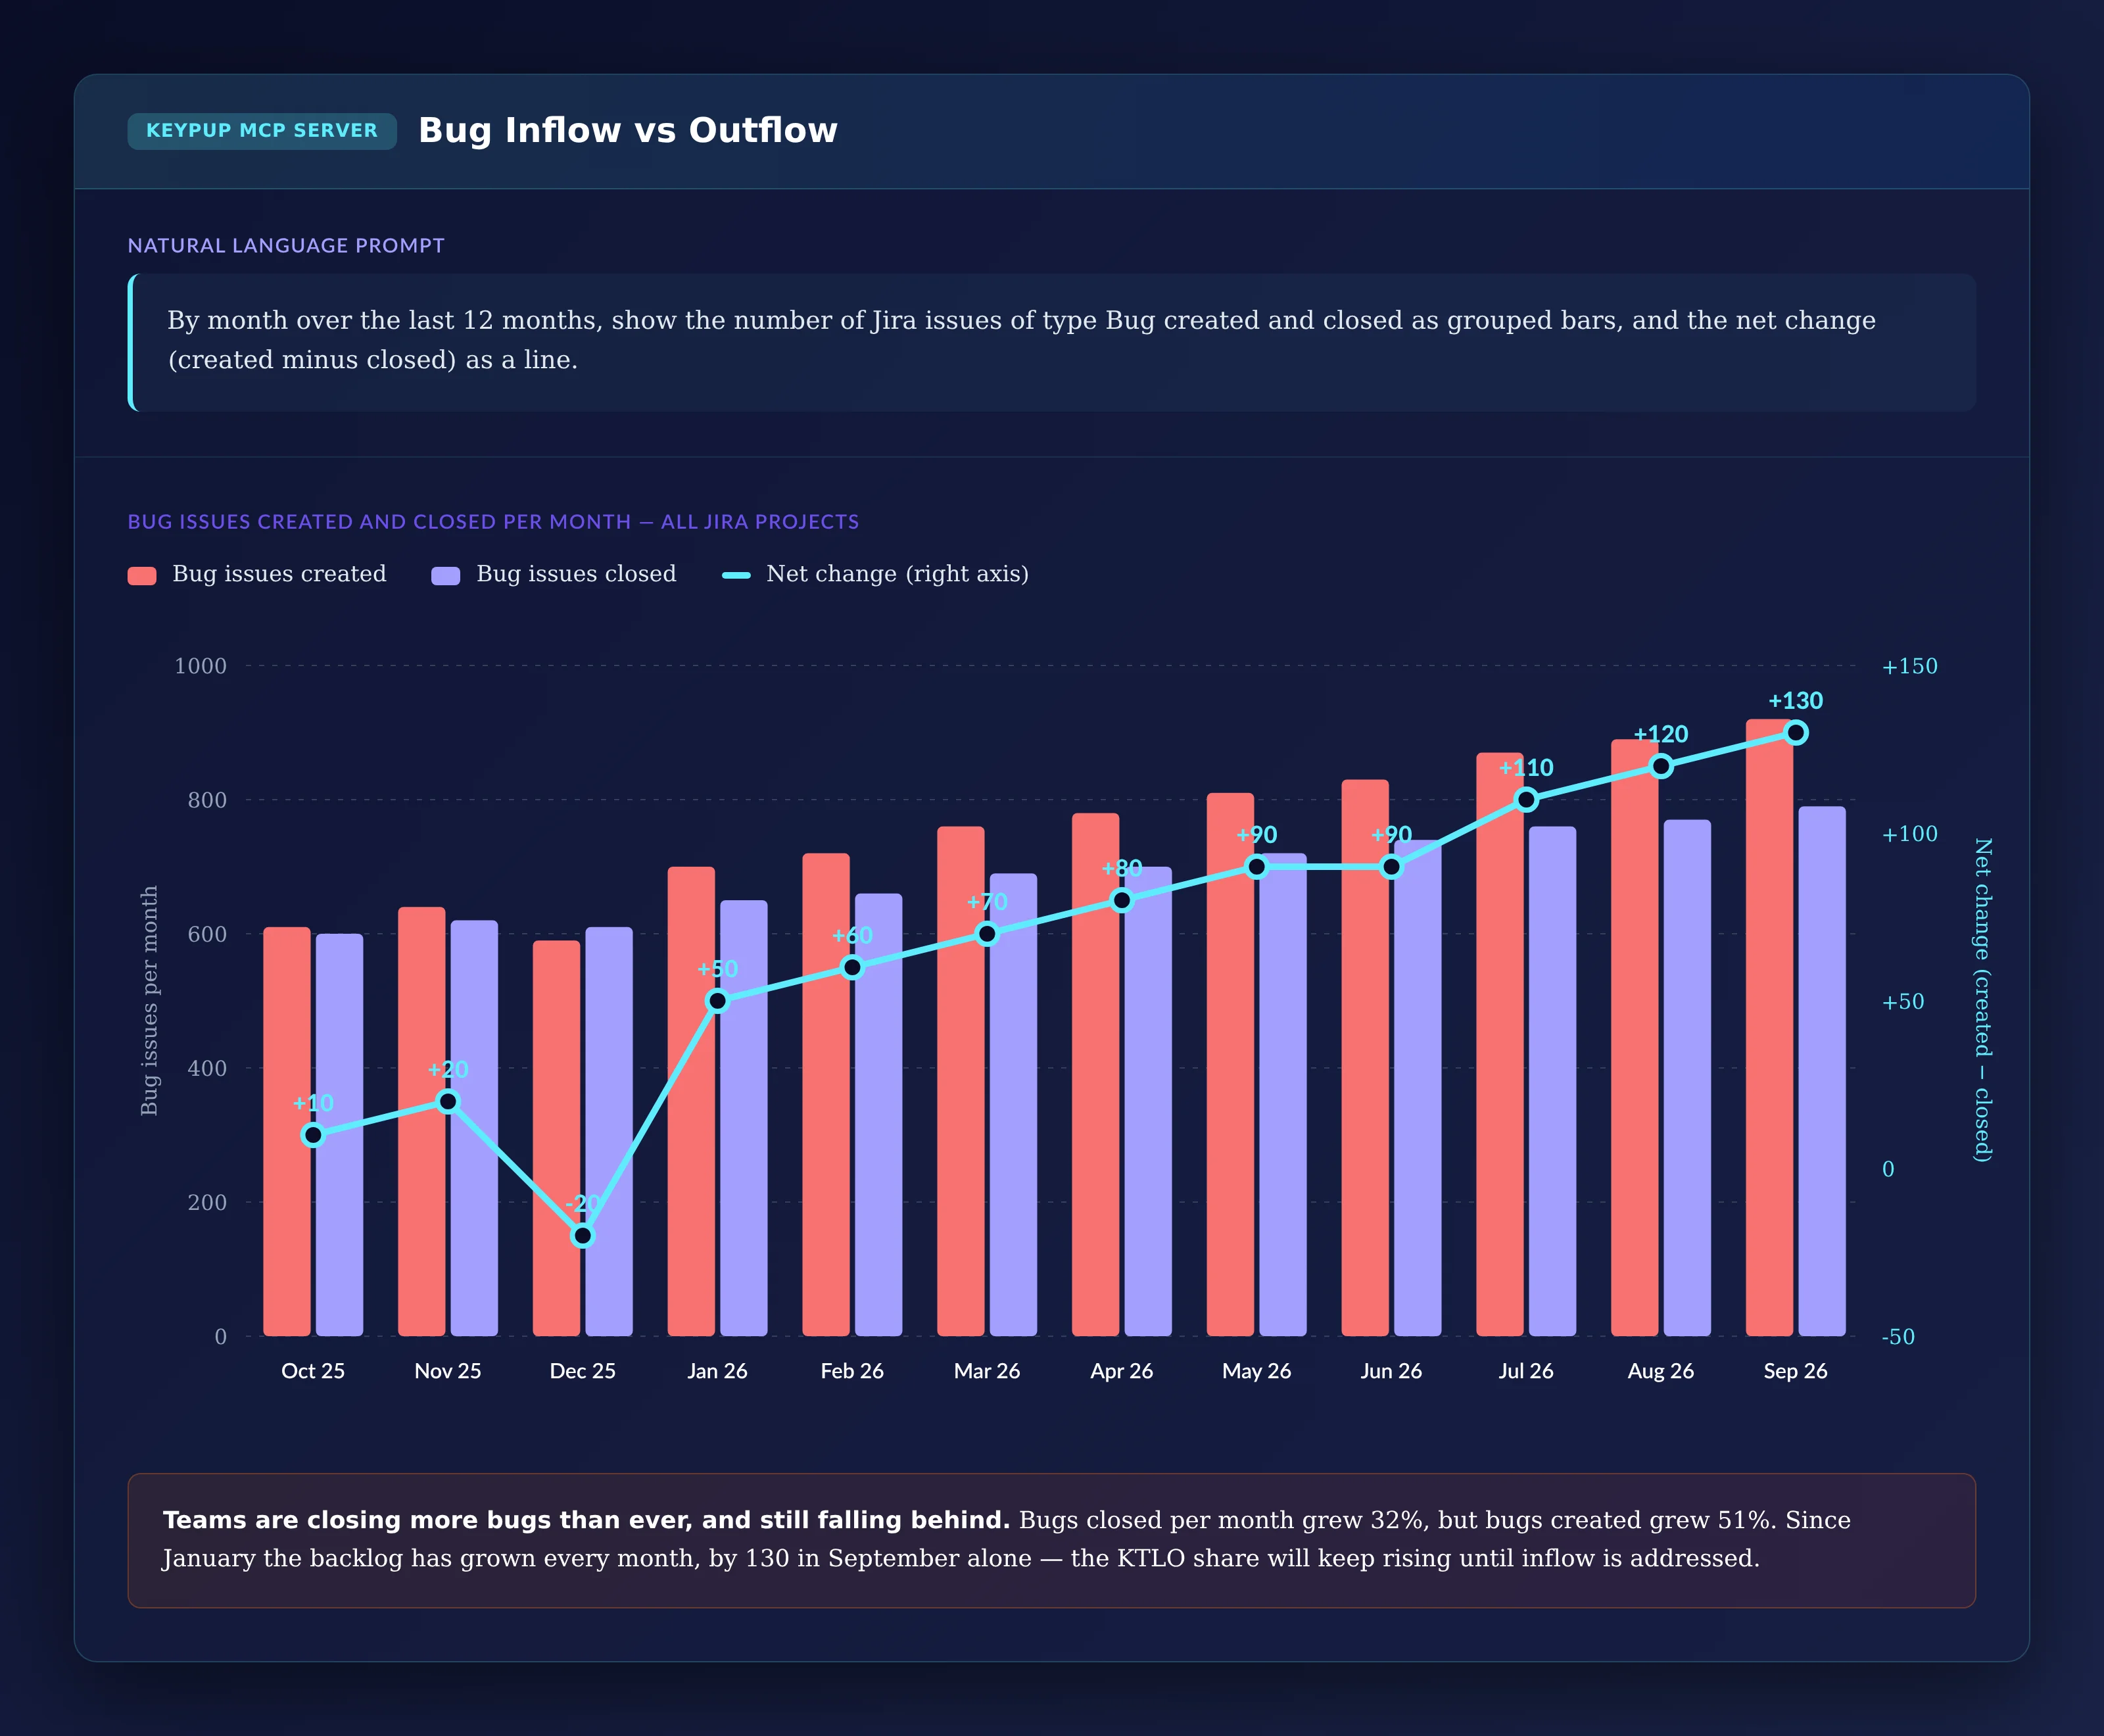
By month over the last 12 months, show the number of Jira
issues of type Bug created and closed as grouped bars, and the
net change (created minus closed) as a line.
Output: Bug Inflow vs Outflow
Key Insight: Teams are closing more bugs than ever, and still falling behind. Bugs closed per month grew 32%, but bugs created grew 51%. Since January, the open bug count has grown every month — by 130 in September alone. Fixing faster won't help; the KTLO share will keep rising until the inflow is addressed.
4. Seeing How Long Bugs Wait, by Team and Priority
Averages hide where the backlog is building. A heatmap shows it at a glance.
MCP Prompt:
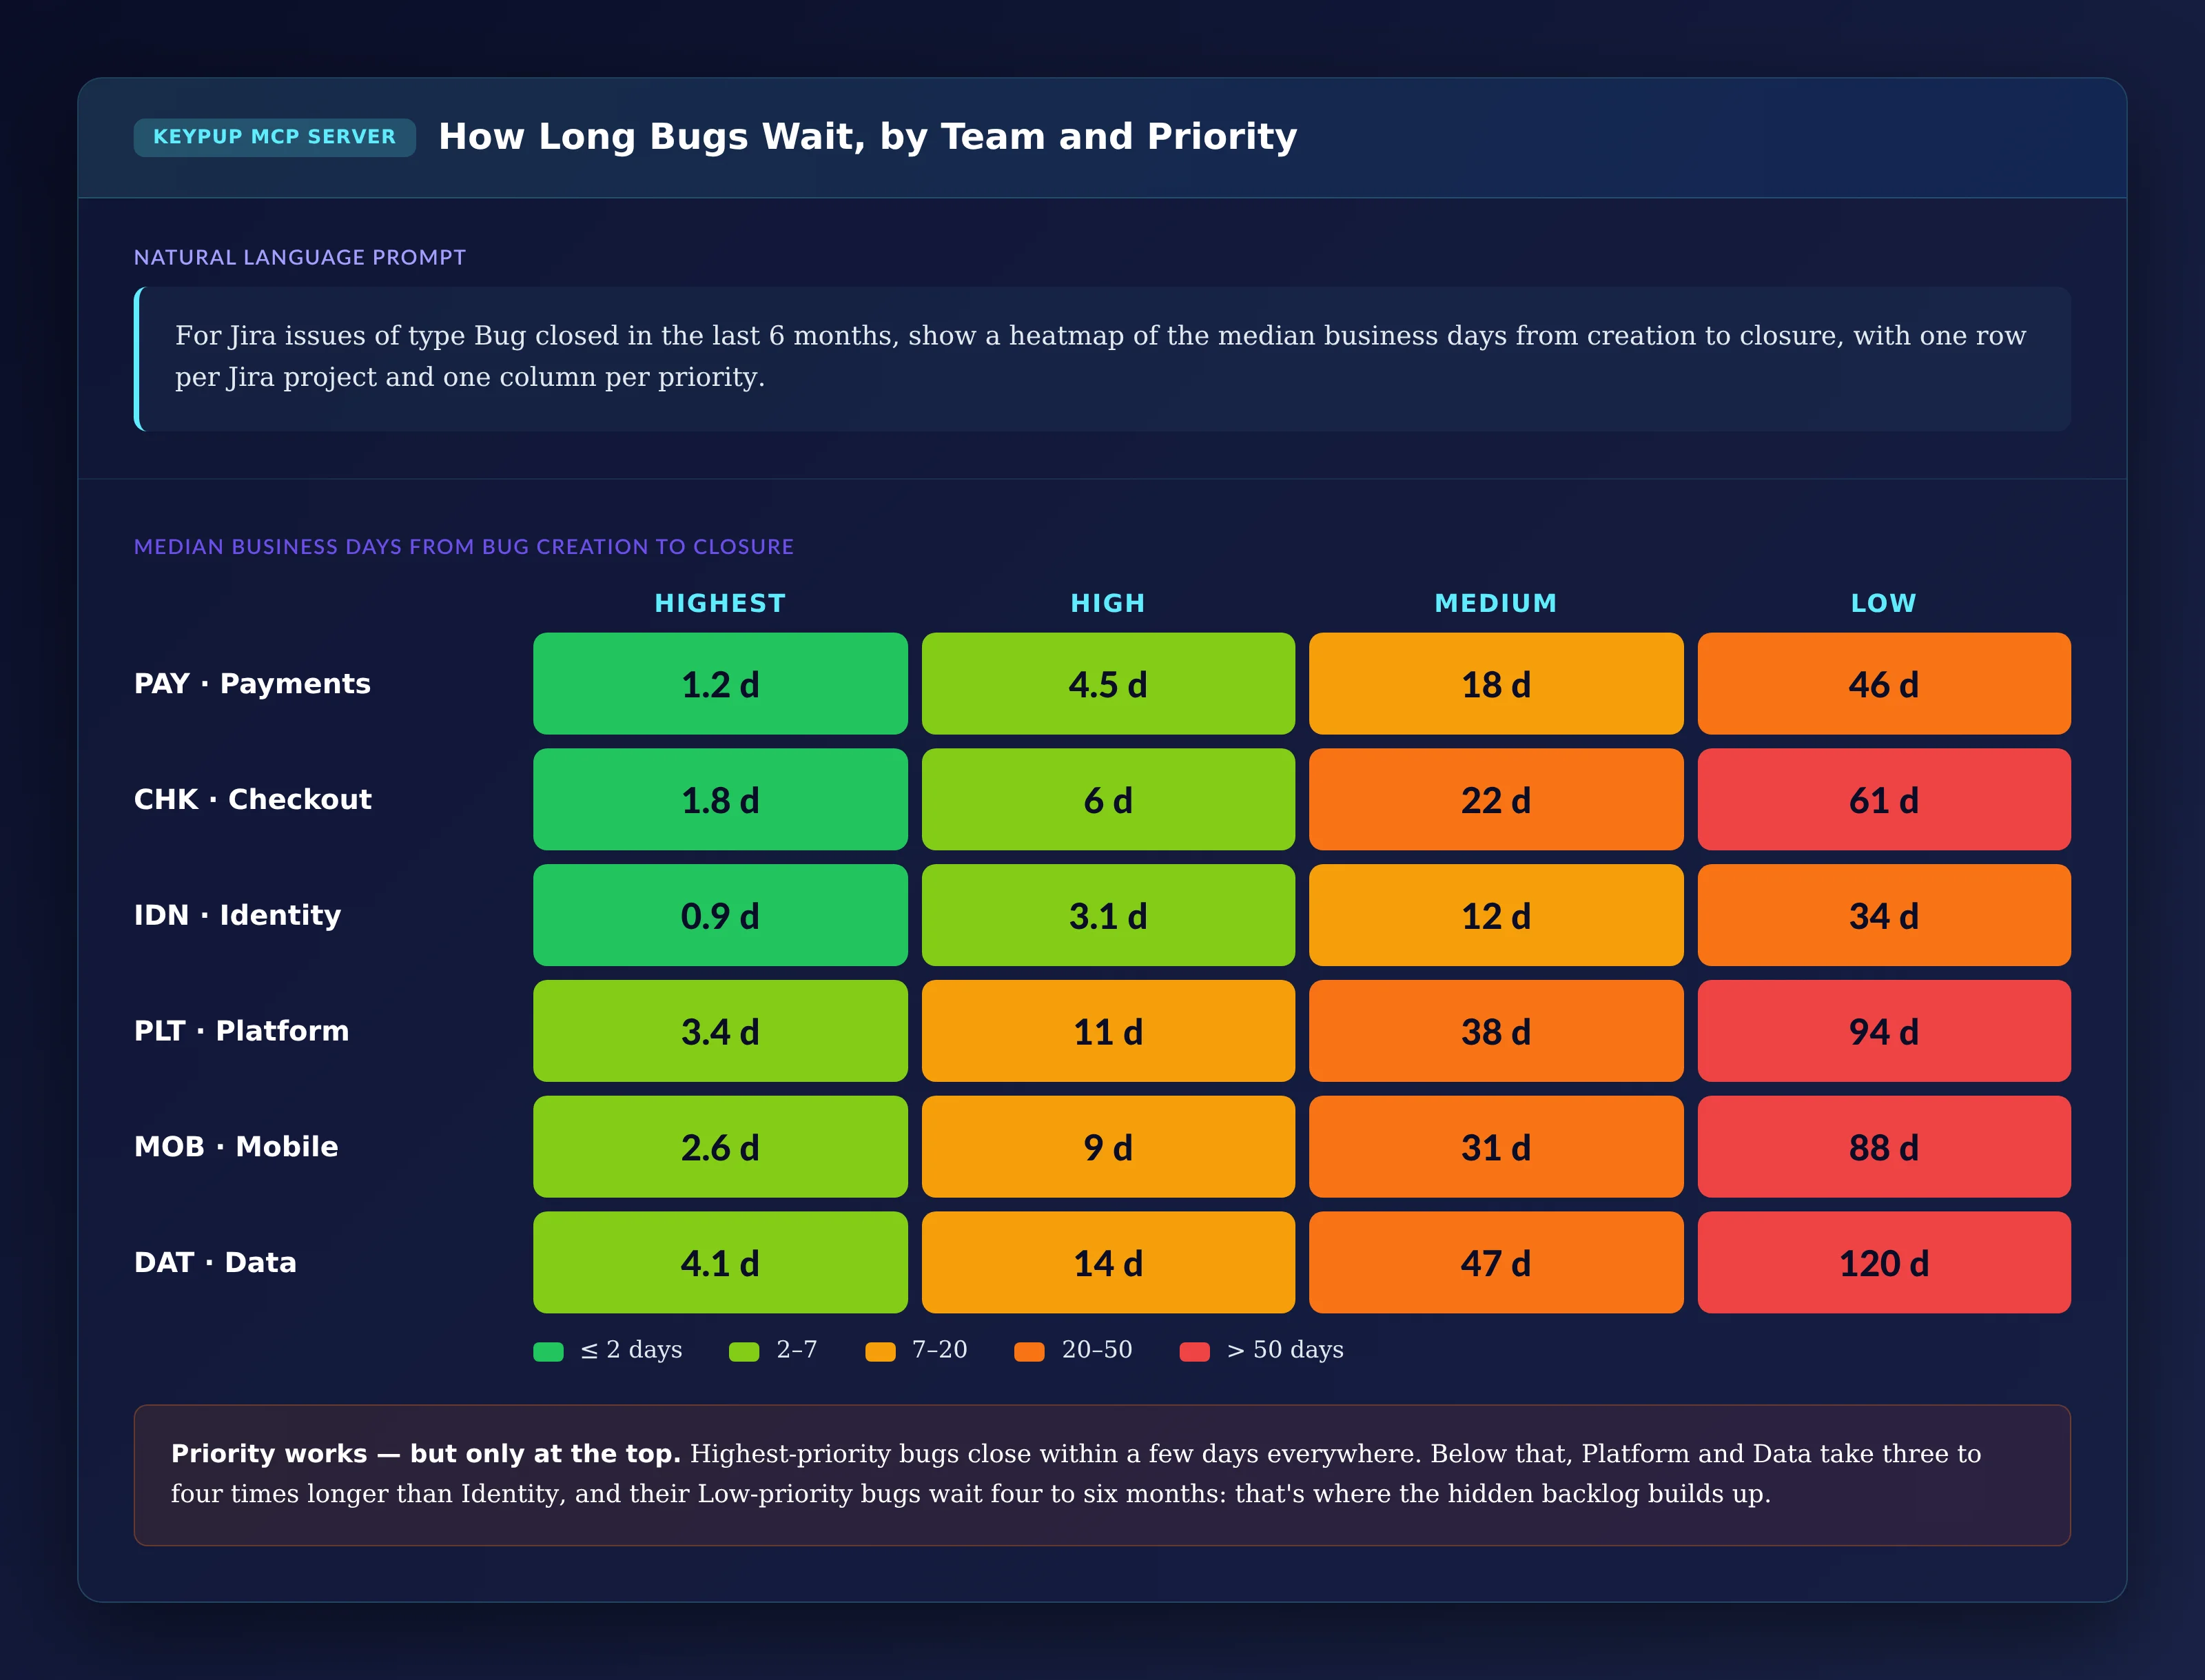
For Jira issues of type Bug closed in the last 6 months, show
a heatmap of the median business days from creation to
closure, with one row per Jira project and one column per
priority.
Output: How Long Bugs Wait, by Team and Priority
Key Insight: Priority works — but only at the top. Highest-priority bugs close within a few days everywhere. Below that, Platform and Data take three to four times longer than Identity, and their Low-priority bugs wait four to six months. That's where the hidden backlog builds up, and where it will eventually resurface as escalations.
5. Finding Where the Bug Work Lands
Bug work is rarely spread evenly. A Pareto chart shows how concentrated it is.
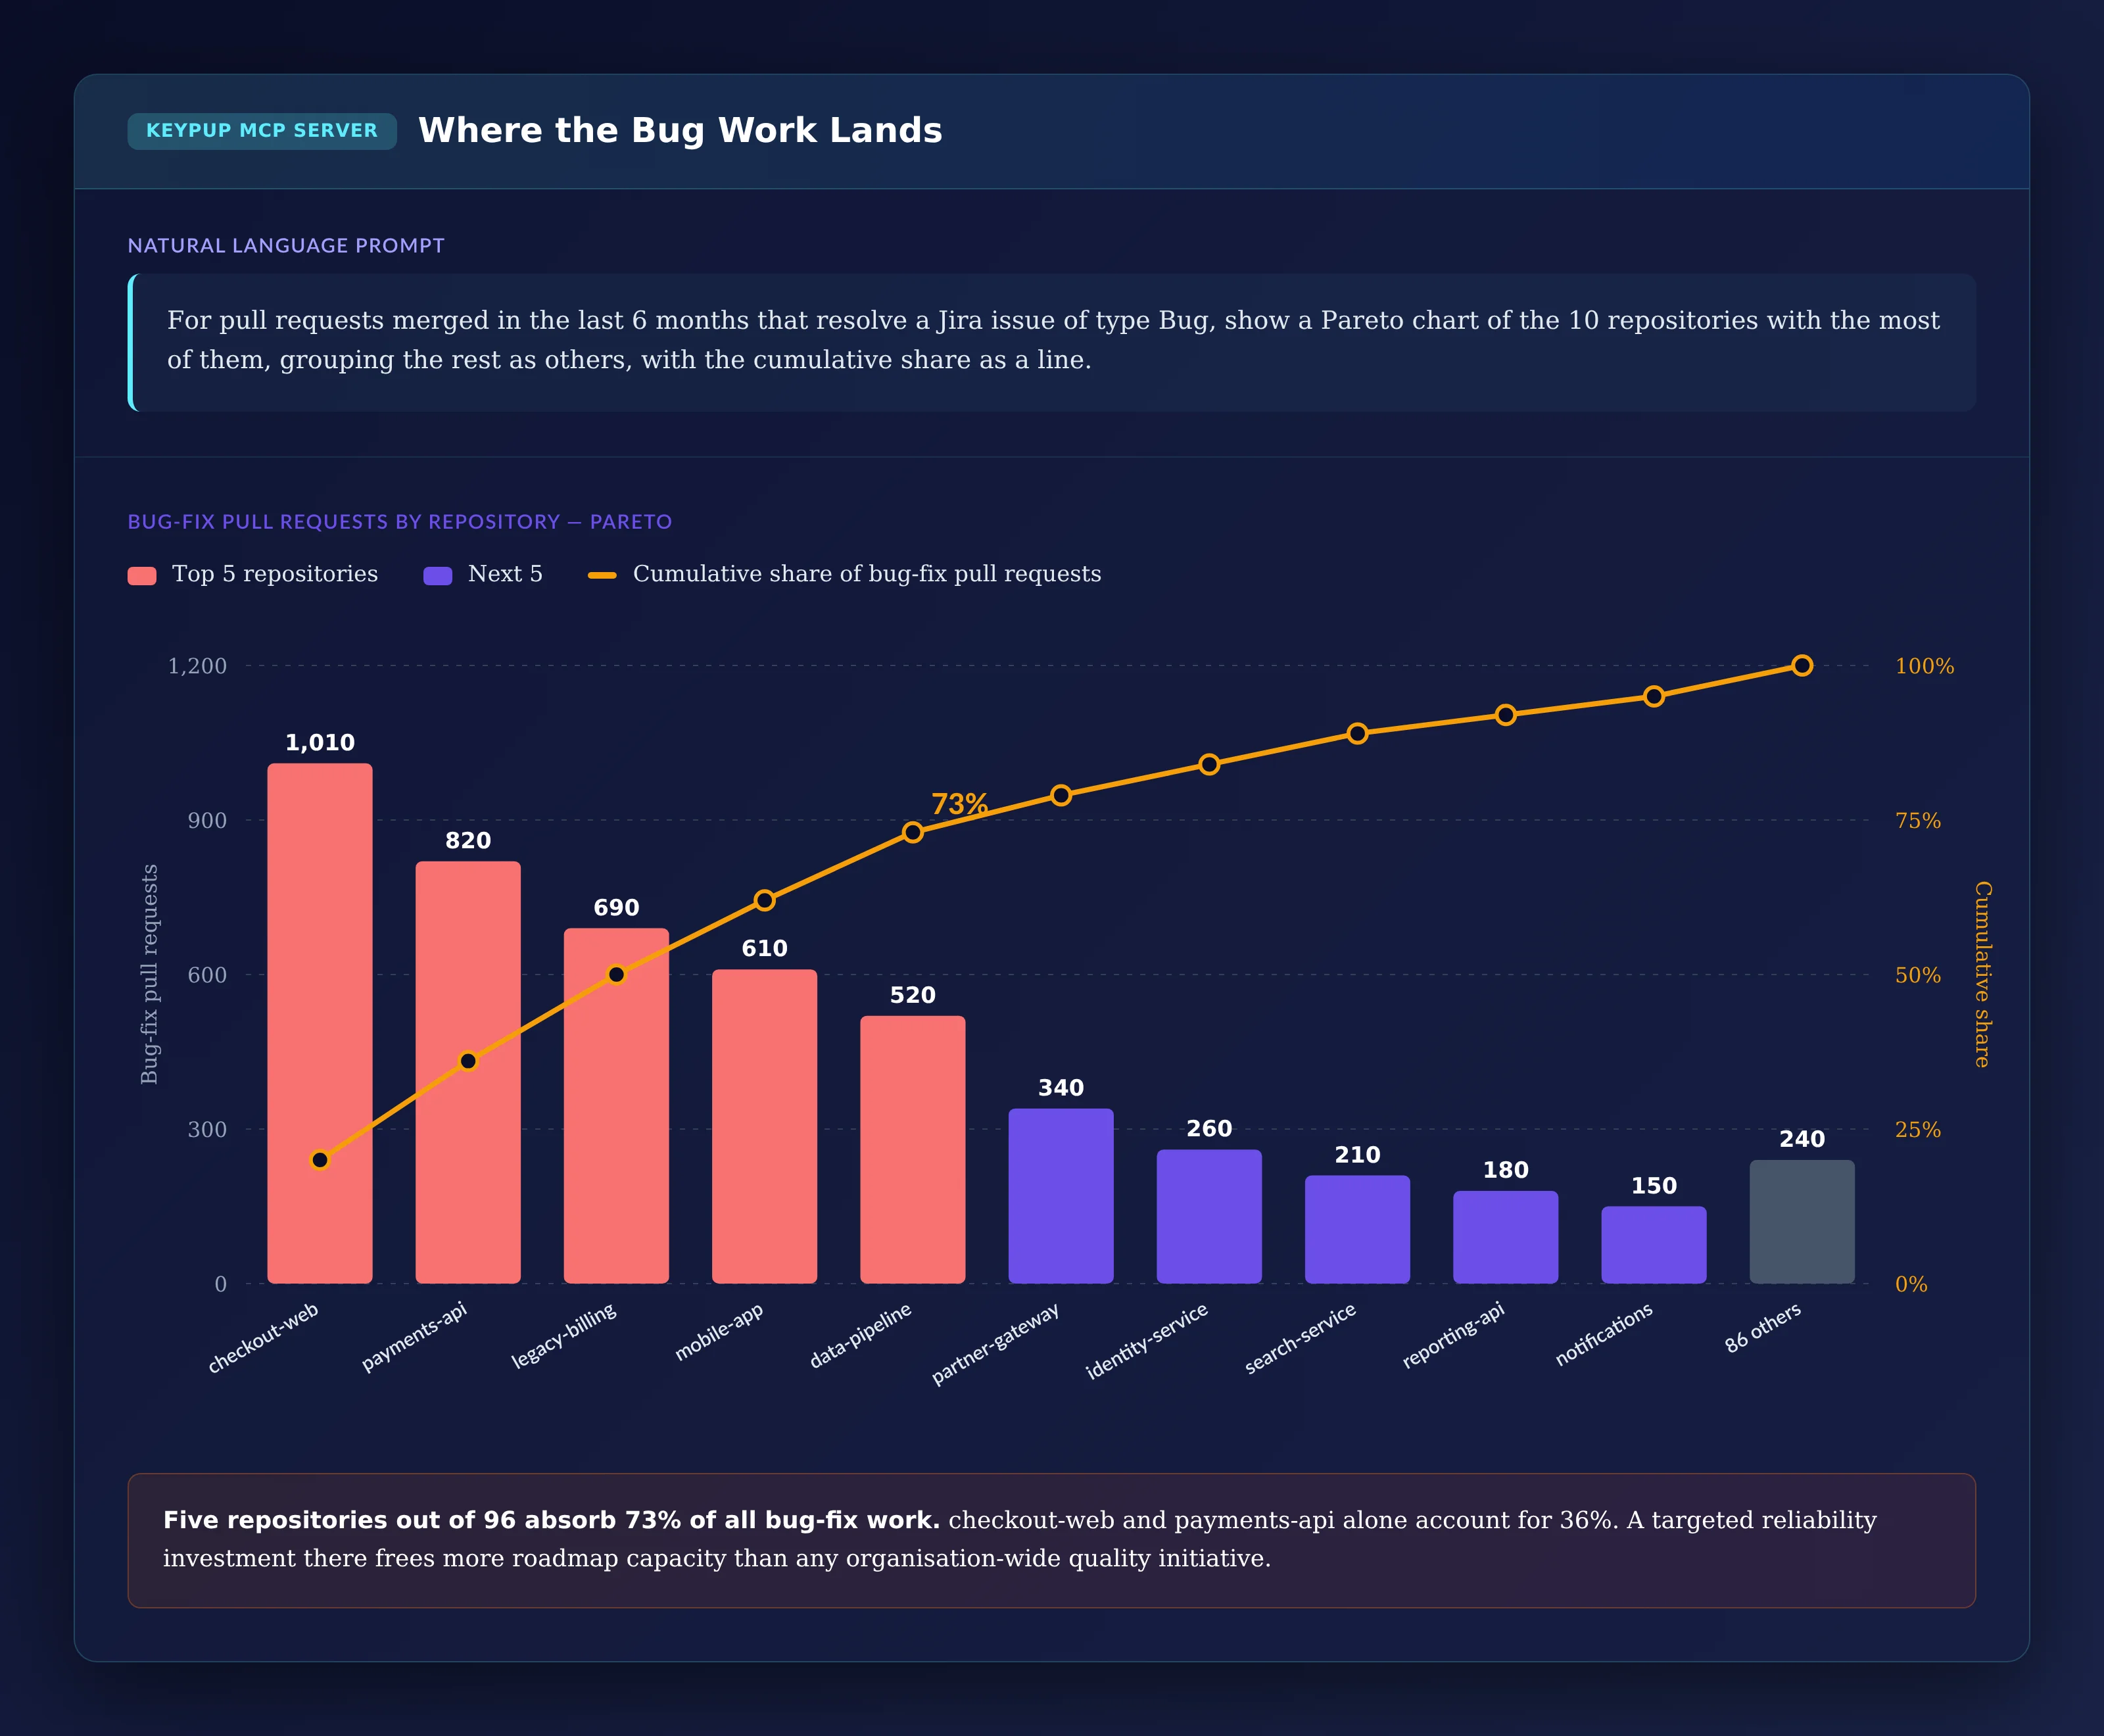
MCP Prompt:
For pull requests merged in the last 6 months that resolve a
Jira issue of type Bug, show a Pareto chart of the 10
repositories with the most of them, grouping the rest as
others, with the cumulative share as a line.
Output: Where the Bug Work Lands
Key Insight: Five repositories out of 96 absorb 73% of all bug-fix work, and checkout-web and payments-api alone account for 36%. A targeted reliability investment there — tests, refactoring, ownership — frees more roadmap capacity than any organization-wide quality initiative.
6. Building a KTLO Profile per Team
Allocation is a team-by-team conversation. This table gives every team the same view.
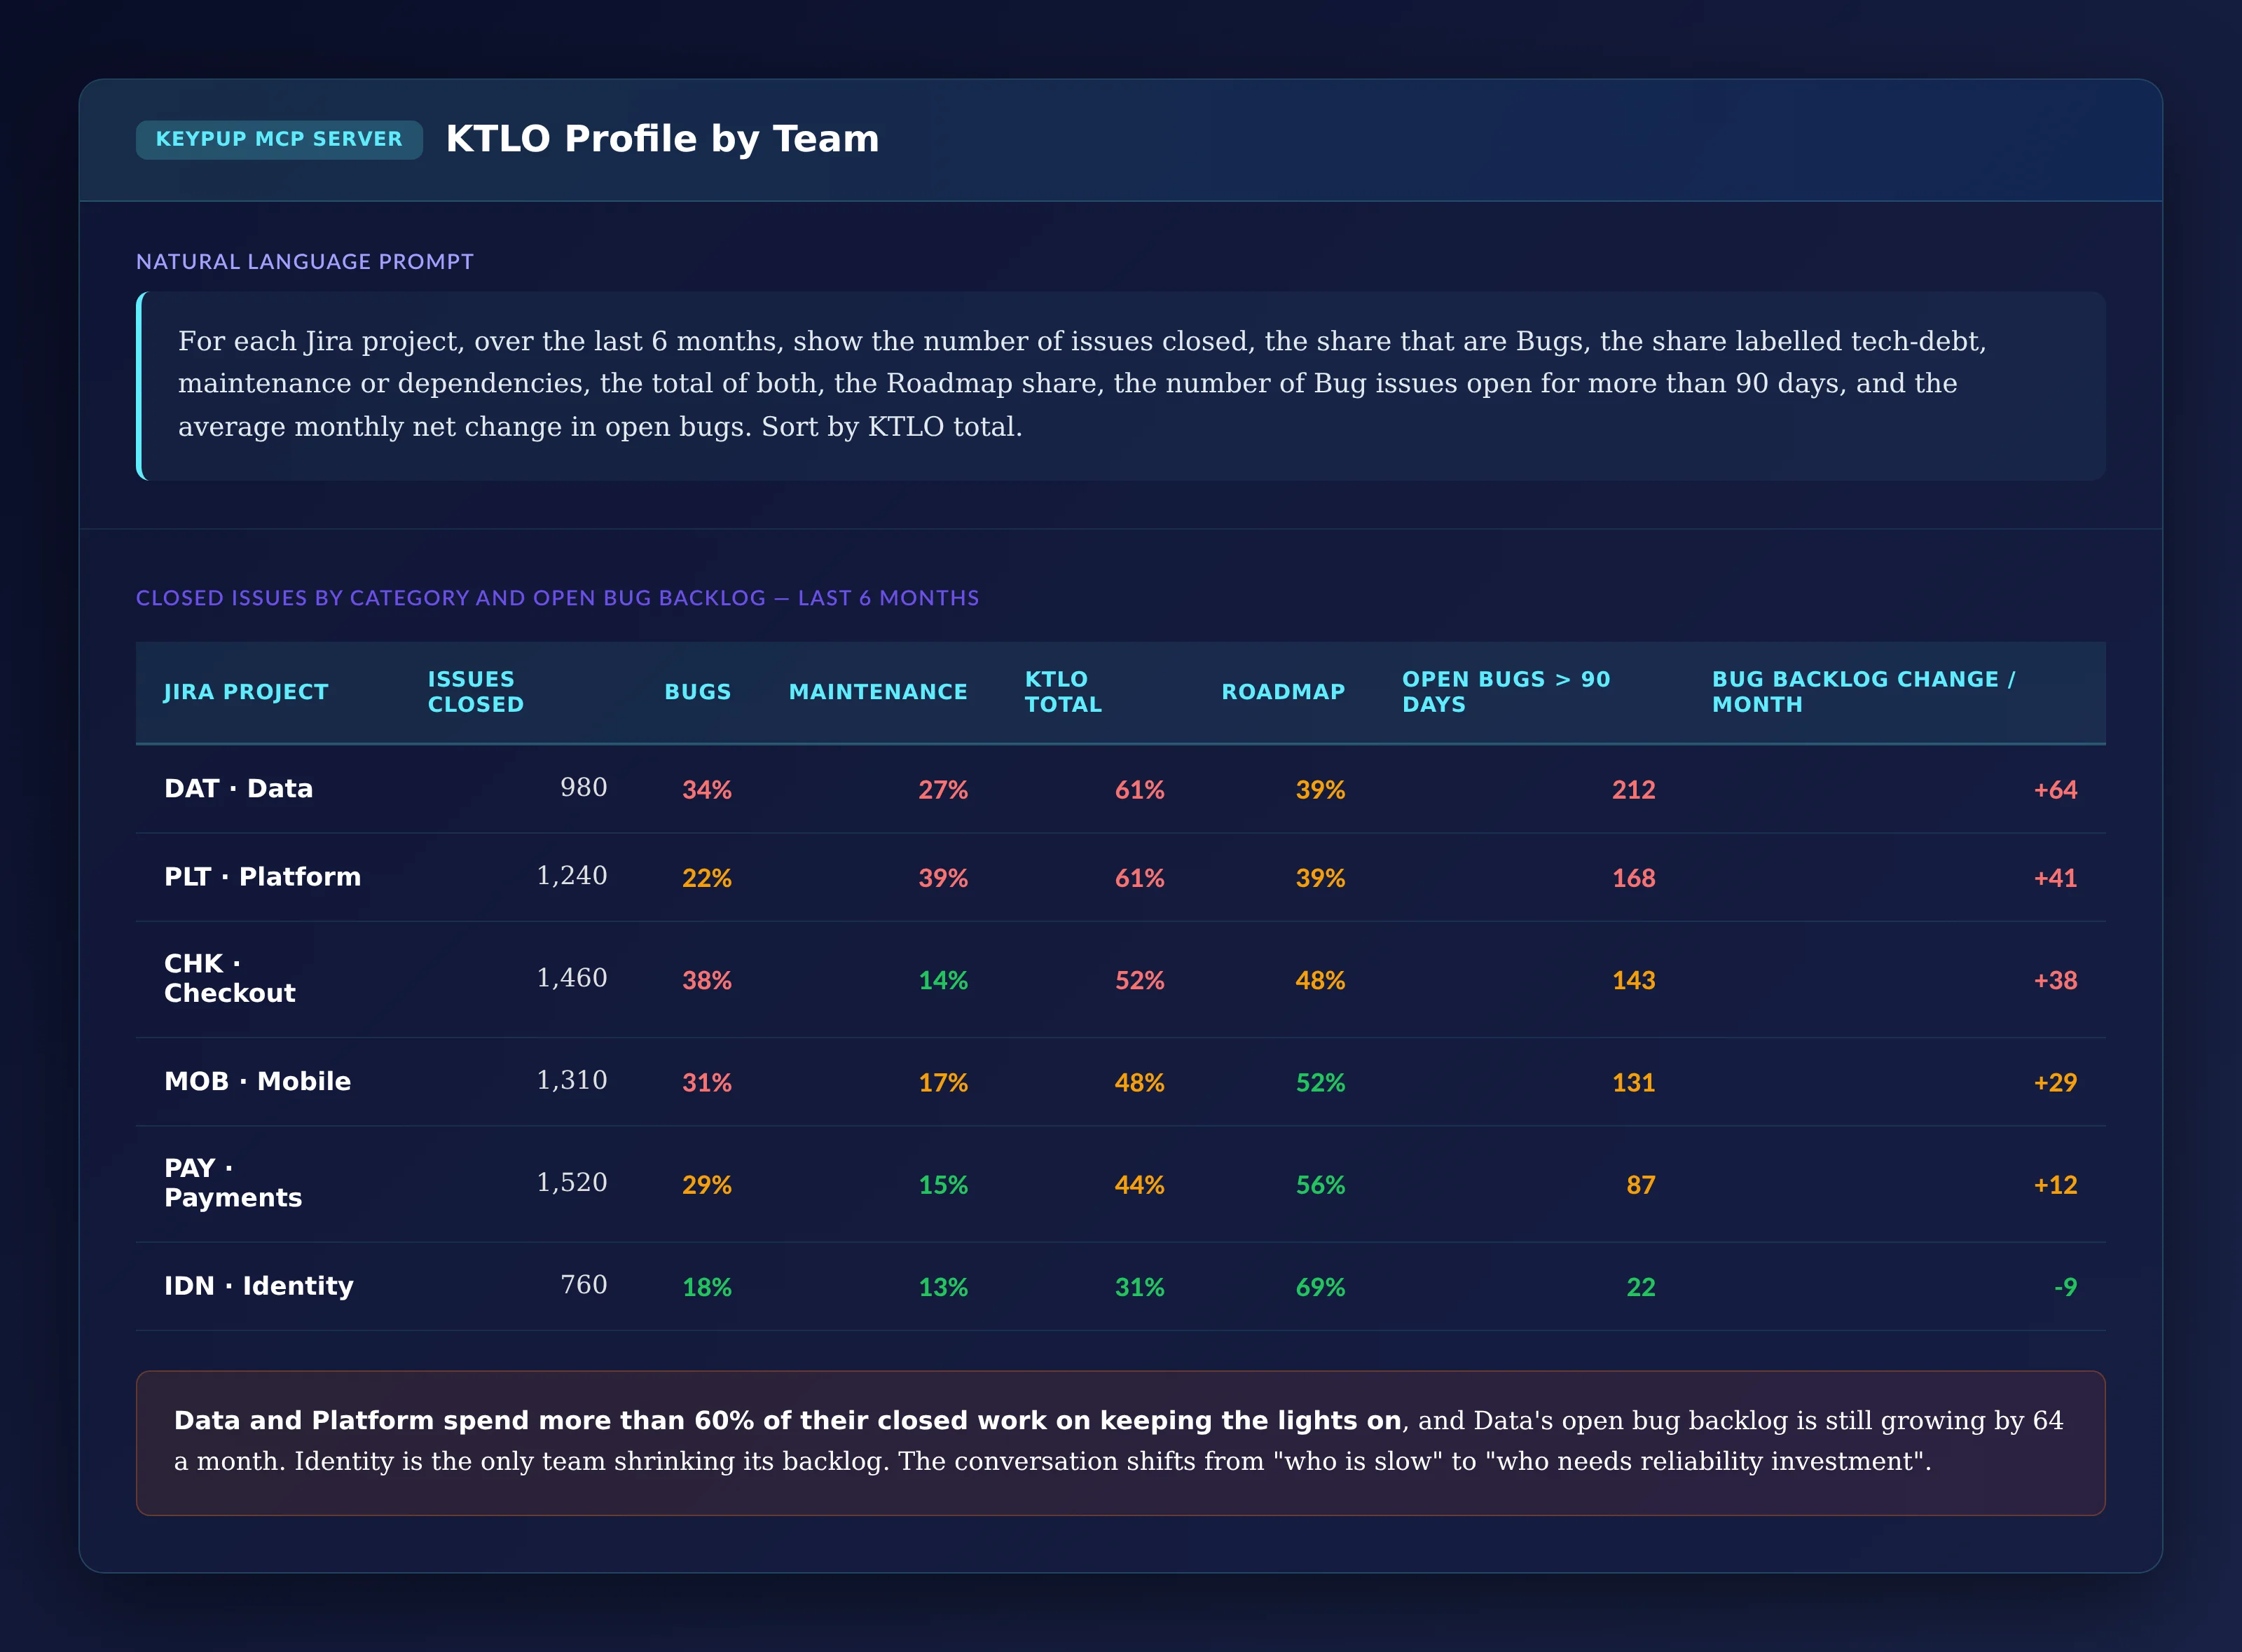
MCP Prompt:
For each Jira project, over the last 6 months, show the number
of issues closed, the share that are Bugs, the share labelled
tech-debt, maintenance or dependencies, the total of both, the
Roadmap share, the number of Bug issues open for more than 90
days, and the average monthly net change in open bugs. Sort by
KTLO total.
Output: KTLO Profile by Team
Jira Project
Issues Closed
Bugs
Maintenance
KTLO Total
Roadmap
Open Bugs > 90 Days
Bug Backlog Change / Month
DAT · Data
980
34%
27%
61%
39%
212
+64
PLT · Platform
1,240
22%
39%
61%
39%
168
+41
CHK · Checkout
1,460
38%
14%
52%
48%
143
+38
MOB · Mobile
1,310
31%
17%
48%
52%
131
+29
PAY · Payments
1,520
29%
15%
44%
56%
87
+12
IDN · Identity
760
18%
13%
31%
69%
22
-9
Key Insight: Data and Platform spend more than 60% of their closed work on keeping the lights on, and Data's open bug backlog is still growing by 64 a month. Identity is the only team shrinking its backlog. The conversation shifts from "which team is slow" to "which team needs reliability investment before it can take on more roadmap".
The Technical Implementation: What Keypup MCP Actually Reads
Every number above comes from data Keypup already imports from Jira and your Git platform. It helps to be precise about what that data is — and what it isn't.
Categories Come From Issue Types and Labels
Keypup imports each Jira issue's issue type (Bug, Story, Task, Epic, or your own types) and its labels, as well as each pull request's labels. The Bugs, Maintenance and Roadmap categories are rules you write in the prompt from those fields. They are only as good as your Jira hygiene: if teams log bugs as Tasks, or never use a maintenance label, that work will be counted as Roadmap. Keypup doesn't read issue descriptions to guess what the work was.
Pull Requests Are Linked to Issues by Their Issue Key
A pull request is attributed to a category through the Jira issues it resolves. Keypup links them when the pull request references the Jira issue key (for example PAY-1234), so this depends on your teams' linking habits. Pull requests that reference no issue and carry no classifying label land in Not linked — which is why measuring and reducing that share is the first step.
"Capacity" Means Merged Work, Not Hours
Keypup counts merged pull requests and closed issues, and can also sum lines changed or story points by category. It doesn't import time sheets or calendars, so the allocation shown is a share of delivered work, not of hours worked. For most planning conversations that's the right proxy: it measures what the organization actually shipped. If your teams log time in Jira, Keypup also imports the time spent field and you can allocate it the same way.
Bug Flow and Ageing Come From Issue Dates and Priority
Inflow and outflow are counts of Bug issues by creation date and closure date. Time to close is the business days between the two, broken down by Jira project and priority. "Open for more than 90 days" uses the issue's current state and creation date. These measures depend only on Jira data, so they work even before pull requests are consistently linked.
Real-World Impact: Enterprise Case Studies
Case Study 1: Global Insurance Group
Before Keypup MCP:
45 product teams under a "70% roadmap, 30% run" policy agreed with the board
Roadmap delivery below 60% for three consecutive quarters
Allocation data collected by survey from engineering managers, twice a year
After Keypup MCP:
The allocation prompt replaced the survey: the actual roadmap share was 42%, not the 70% everyone had planned around
The Not linked share was cut from 22% to 9% in two months by asking teams to reference the Jira key in every pull request
Quarterly plans now start from each team's measured KTLO share, so commitments match the capacity that's actually free
"For years we argued about whether engineering was slow. The allocation chart ended that argument in one meeting: we were spending more on running the platform than on building it. Now the board approves reliability work as an investment, not as an excuse."
— CTO, Global Insurance Group
Case Study 2: European Marketplace Platform
Before Keypup MCP:
A company-wide quality initiative launched after a string of incidents, touching every team
Bug backlog still growing after six months
No agreement on where the bugs were coming from
After Keypup MCP:
The Pareto chart showed that three repositories produced most of the bug-fix work, and the initiative was refocused on them
The inflow and outflow chart became a monthly review: the target moved from "close more bugs" to "create fewer"
The bug-age heatmap set per-priority targets per team, starting with the projects where Low-priority bugs waited longest
"We were spreading reliability effort across 80 repositories when the problem lived in three of them. Once we could see it, we put a team on those three. Bug inflow is down by a third and our roadmap share is back above half."
— VP Engineering, European Marketplace Platform
Implementation: Getting Started with Keypup MCP
1. Connect Jira and Your Git Platform
Connect Jira and GitHub, GitLab, Bitbucket or Azure DevOps to Keypup. Issue types, labels, priorities, projects and dates are imported automatically, along with pull requests and the issues they reference.
2. Agree on Your Categories
Decide which issue types and labels mean Bugs, Maintenance and Roadmap — for example Bug for bugs, and tech-debt, maintenance and dependencies labels for maintenance — and use the same rules in every prompt so trends stay comparable.
3. Link Pull Requests to Jira Issues
Ask teams to reference the Jira issue key in every pull request. Track the Not linked share every month until it's low enough to trust the allocation numbers.
4. Connect the MCP Server to Your AI Assistant
Follow the MCP documentation to connect Keypup to Claude, ChatGPT, Cursor or any MCP-compatible assistant.
5. Set a Baseline, Then Plan From It
Run the allocation and trend prompts to set a baseline. Use the team profile table in quarterly planning so each team commits only the capacity that's actually free, and use the Pareto chart to decide where reliability investment will free the most roadmap time. Re-run the prompts every month.
Frequently Asked Questions
What is KTLO in software engineering?
KTLO stands for "keep the lights on". It's the engineering work needed to keep existing software running — bug fixes, security patches, dependency upgrades, tech debt paydown and small operational changes — as opposed to building new features from the roadmap.
What is a healthy KTLO percentage?
There's no universal number, but many engineering organizations aim to keep KTLO between 20% and 40% of capacity. More important than the level is the trend: a KTLO share rising quarter after quarter means roadmap capacity is shrinking whatever the plan says.
How do you measure engineering investment allocation?
Classify delivered work into categories — for example Bugs, Maintenance and Roadmap — from Jira issue types and labels, link each pull request to the issue it resolves, and count merged work per category over time. Keypup MCP does this from the issue and pull request data it already imports, and shows the share of work it can't classify.
Why is the bug backlog growing even though teams fix more bugs?
Because bugs are being created faster than they're closed. Comparing monthly bug inflow and outflow shows whether the problem is fixing speed or bug creation. When inflow grows faster, the answer is usually targeted reliability work in the systems that generate most of the bugs.
The Bottom Line
You can't plan capacity you can't see. Keypup MCP shows how much of your engineering goes to keeping the lights on, and where:
✅ Sizing the KTLO tax — bugs, maintenance and roadmap shares of merged work ✅ Following the trend before roadmap capacity quietly disappears ✅ Comparing bug inflow and outflow to fix the cause, not the symptom ✅ Seeing how long bugs wait by team and priority ✅ Finding where the bug work lands, repository by repository ✅ Planning per team from the capacity that's actually free
Ready to Transform Your Analytics?
Join teams already using AI to make data-driven decisions faster than
ever.
Are your engineers really using AI for code, is it making delivery faster, and is quality holding up? A three-question method, with the data and queries to answer each one.
Compare the 5 best value stream analytics platforms for engineering leaders — Keypup, Pluralsight Flow, LinearB, Jellyfish and Swarmia — across DORA Metrics depth, cross-platform data unification, contextual analysis, customization, AI and natural language capabilities, and setup speed. Find out which value stream management platform turns Git, Jira and CI/CD data into prescriptive, actionable insights.
Ten-line pull requests get twenty comments. Two-thousand-line pull requests get "LGTM" in four minutes. Learn what engineering leaders on Reddit say about rubber-stamp code reviews in large organizations, why the problem stays invisible, and how Keypup MCP uses pull request size, review timestamps, approvals and comments to measure it repository by repository.