TL;DR: Most engineering organizations now pay for at least one AI coding assistant, but almost none can answer the basic questions behind that spend: who actually uses it, how much, on which surfaces and models, and how much of the code it suggests lands in the codebase. Keypup's AI Usage dataset stores that activity as one row per developer per day, with breakdowns by surface, model, client and language, starting with GitHub Copilot (up to one year of history on the first sync). The ready-made AI Usage & Monitoring Dashboard turns it into adoption, consumption and code-contribution insights in minutes, and the Keypup MCP Server lets you query it from Claude, ChatGPT, Cursor or VS Code in plain English. Because AI usage lives next to your pull requests, reviews and commits, adoption can finally be compared with delivery instead of argued about. Learn more on the AI Usage Monitoring page.
Ask a CTO how much the company spends on AI coding assistants and you'll get a precise number within seconds: it's a line on the invoice. Ask the same CTO how many engineers used those assistants last week, on which surfaces, with which models, and how much of the suggested code actually made it into the codebase, and the answer usually becomes "we think adoption is good."
That gap is the problem this article is about. AI coding tools are now one of the fastest-growing lines in the engineering budget, and the data that would justify, steer or cut that spend sits in vendor admin consoles that don't talk to each other or to your delivery data.
In this article, we'll look at why AI usage is so hard to measure honestly, what engineers themselves say about AI adoption metrics, and how Keypup's new AI Usage dataset, the AI Usage & Monitoring Dashboard and the Keypup MCP Server turn AI adoption into numbers you can actually act on.
The Friction: AI Spend You Can See, AI Usage You Can't
AI coding assistants spread faster than any developer tool before them, and the measurement layer never caught up.
- Every vendor reports differently. GitHub Copilot, Claude, Cursor and OpenAI each publish their own metrics, with their own definitions of a "user," a "request" and an "acceptance." Comparing them side by side means exporting four sets of CSVs and hoping the columns mean the same thing.
- Vendor dashboards stop at the tool. The admin console tells you how many suggestions were offered. It doesn't tell you whether the teams that use AI the most ship faster, review longer or merge bigger pull requests, because it has never seen your pull requests.
- "Usage" means three different things. A single prompt in agent mode can trigger dozens of model calls. Count calls and adoption looks enormous; count prompts and it looks modest. Without a clear definition, the same data supports opposite stories.
- Missing data quietly becomes zero. When a provider doesn't publish a measure, most spreadsheets and BI tools display a zero. A chart that says "0 tokens" when the vendor simply doesn't report tokens for that surface is worse than no chart at all.
The result: the budget conversation happens on the invoice, and the adoption conversation happens on anecdotes.
Why This Matters: Three Ways Unmeasured AI Usage Bites Back
The Licence Waste Problem
Seats are assigned at rollout and rarely revisited. Without a per-developer view of activity, nobody notices the licences that haven't been used in two months, or the team that never moved past the trial. The spend keeps renewing while the adoption it was supposed to buy never materializes.
The Wrong-Surface Problem
AI assistance is no longer one feature. IDE completion, chat, agent mode, the CLI, cloud agents and AI code review each have different costs and different impact. If you only see a single "active user" number, you can't tell whether your team is still using autocomplete like it's 2023 or has moved its real work to agents, and you can't target enablement where it would make a difference.
The ROI Narrative Problem
Leadership wants to know whether AI makes the team faster. That question can only be answered by putting AI usage next to delivery data: cycle time, review load, pull request size and throughput. As long as AI usage lives in a vendor console and delivery data lives somewhere else, the ROI discussion stays a debate between opinions. We covered the delivery side of this question in Measuring the Real Impact of AI Coding Assistants on Your Pull Request Cycle Time; usage data is the missing other half.
The Enterprise Discussion: What Engineers Are Actually Saying
The tension between "leadership wants AI adoption numbers" and "engineers don't trust the numbers" comes up again and again wherever engineers compare notes on AI rollouts.
"Our VP put Copilot 'active users' on a slide as proof the rollout worked. Half of those people opened chat once to ask how to rename a variable. Nobody can tell me how many of us actually use agent mode, which models we're on, or whether any of it changed how fast we ship. It's a vanity metric with a budget attached."
"We pay for Copilot and a few Claude seats, and I've been asked to justify both for next year. The admin dashboards each tell a different story, none of them talk to our PR data, and I'm not going to rank my engineers by 'acceptance rate.' I just want to know where it's helping and where we're paying for nothing."
The pattern holds: engineers don't object to measuring AI usage; they object to measuring it badly. What's missing is a dataset that defines usage precisely, shows gaps honestly, and puts AI activity in the same place as the delivery data it is supposed to improve.
Introducing the Keypup AI Usage Dataset
The AI Usage dataset answers four questions: who is using AI coding tools, how much, on what, and to what effect. It lands in the same warehouse as your pull requests, reviews, commits and issues, which is the whole point of having it rather than reading each vendor's dashboard.
One Row per Developer per Day, Across Providers
Each row is one provider-published measurement for one UTC day, attributed to a developer, a repository or the whole organization. Every provider maps onto the same fields, so a "surface" or a "model" means the same thing whichever tool produced it.
- GitHub Copilot is live today, with up to one year of history imported on the first sync.
- Anthropic Claude is next, followed by Cursor and OpenAI.
What It Measures
| Group | Measures | What it tells you |
| Interaction | Requests, interactions, sessions | How intensively AI is used, from human prompts to automated model calls |
| Suggestions | Suggestions offered, accepted, rejected | How useful suggestions are, and the basis of the acceptance rate |
| Lines | Lines suggested vs. lines landed | How much AI-suggested code actually reaches the file |
| Delivery | Commits, pull requests created, reviewed, merged | AI activity that turns into delivery |
| Review | Review suggestions offered and accepted | AI code review, kept separate from IDE suggestions |
| Consumption | Tokens and credits | What the usage costs, in the provider's own unit |
How You Can Slice It
Every measure can be broken down by developer, surface (IDE completion, IDE chat, IDE agent, CLI, cloud agent, code review), model (with its vendor), client (VS Code, JetBrains and others), language and repository. Each normalized value keeps the provider's raw value alongside it, so you can always drill back to exactly what the vendor published.
Numbers You Can Trust
- Missing is not zero. When a provider doesn't publish a measure, Keypup stores it as null and shows it as "not available," never as a misleading zero.
- Restated days are updated in place. Providers sometimes revise recent days; Keypup overwrites the day instead of duplicating it.
- Humans and automation are separated. Adoption metrics count people, not service-account keys.
The AI Usage & Monitoring Dashboard, Section by Section
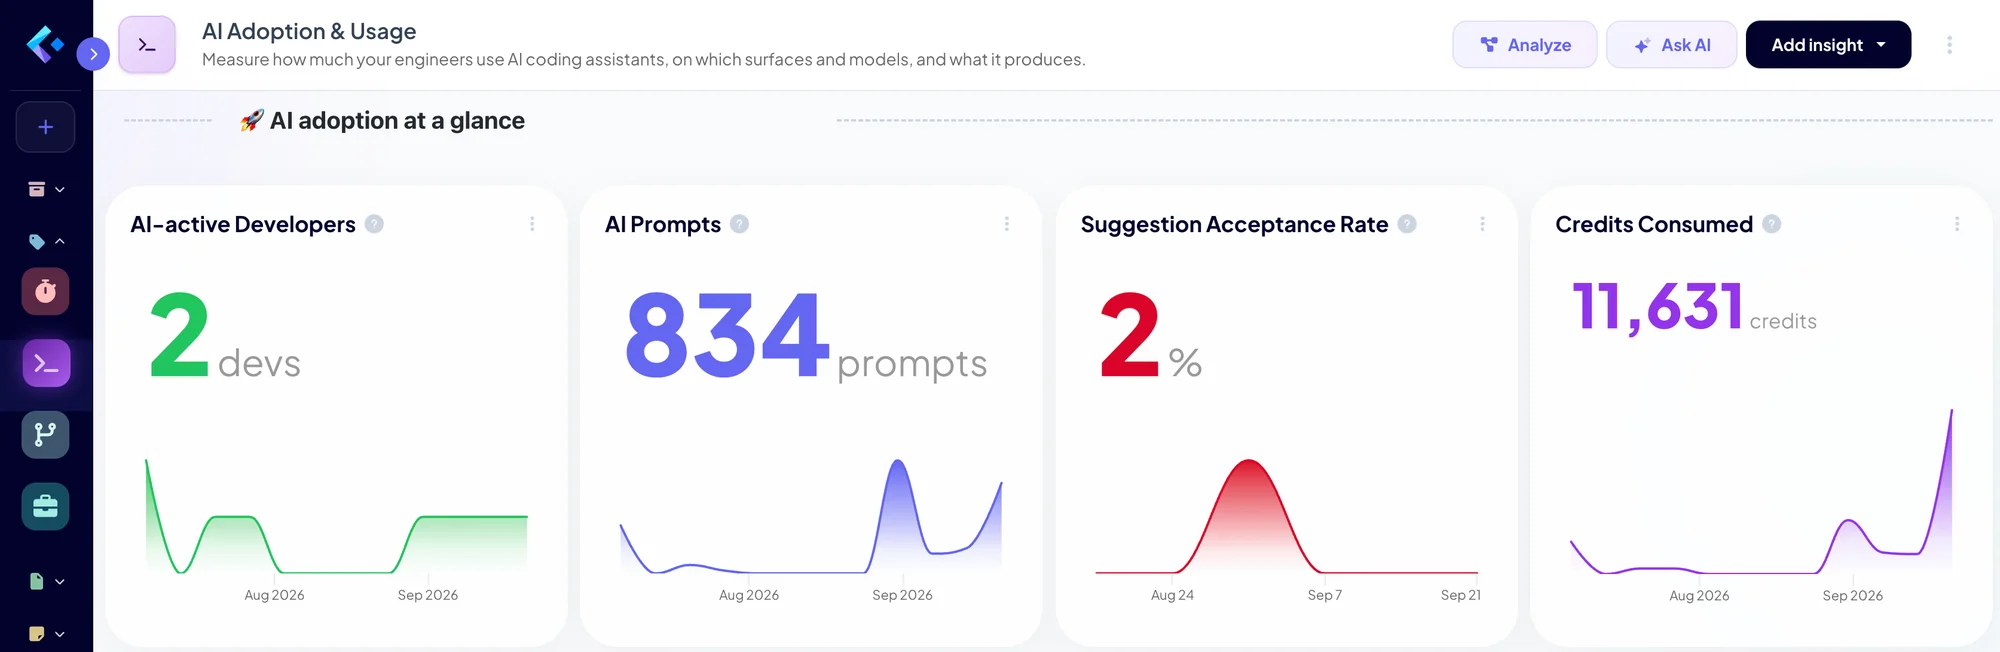
You don't need to build any of this yourself. The AI Usage & Monitoring Dashboard template ships with the insights below, ready to fill from your own data the moment the Copilot Metrics project is enabled in your GitHub integration. The screenshots below come from a small two-developer workspace, which makes each chart easy to read.
1. AI Adoption at a Glance
The first row answers the question every engineering leader gets asked first: are we actually using the AI tools we pay for?
Prompt:
How many developers used AI coding assistants over the last 60 days,
how many prompts did they send, what is our suggestion acceptance
rate, and how many credits did we consume?
Output: AI-active Developers, AI Prompts, Suggestion Acceptance Rate and Credits Consumed
Key Insight: 834 prompts from 2 developers is intensive usage, yet the suggestion acceptance rate sits at 2%. That isn't a contradiction: the acceptance rate measures inline completions, while most of this team's prompts go to chat and agent surfaces. A single headline "acceptance rate" would have suggested the tool wasn't working; the breakdowns below show it's being used differently.
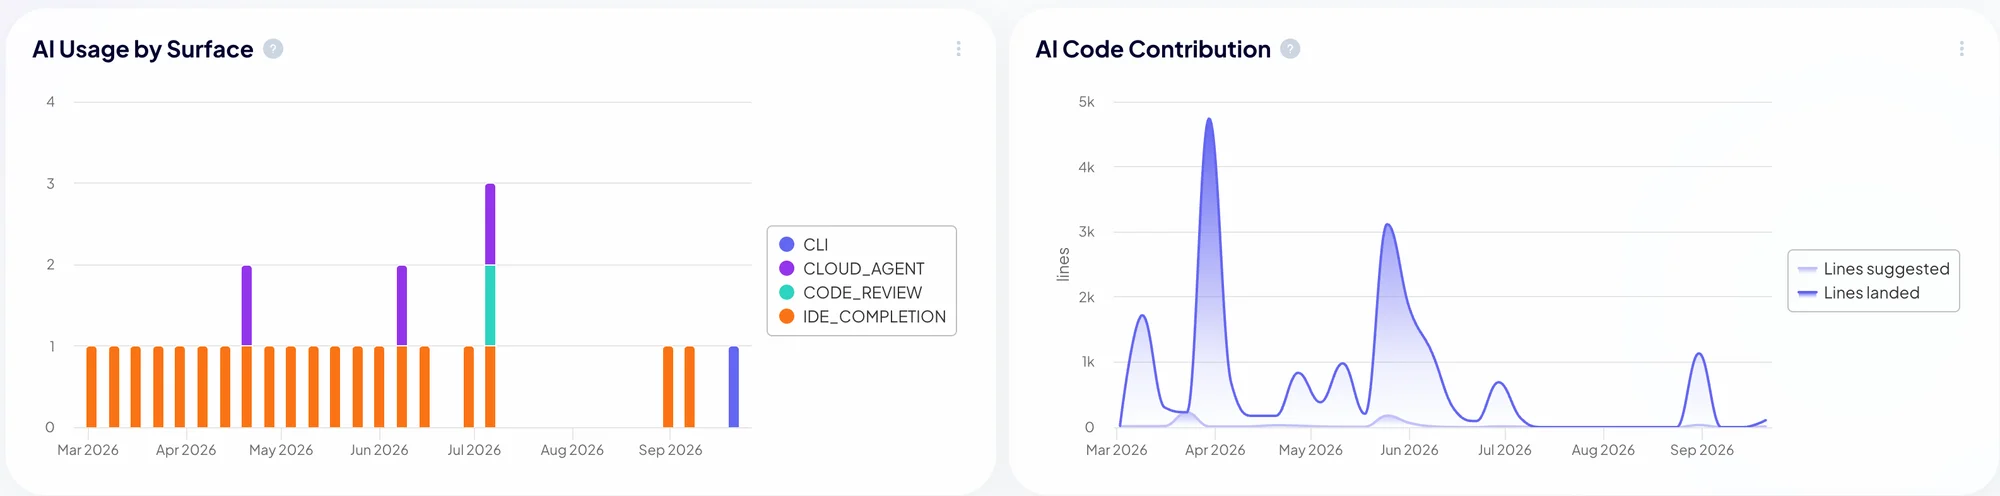
2. Where and How AI Is Used: Surfaces and Code Contribution
Usage volume only tells half the story. This section shows where AI fits into the workflow and how much of its output reaches the codebase.
Prompt:
Show AI usage by surface per day since March, and compare the lines
of code AI suggested with the lines that actually landed.
Output: AI Usage by Surface and AI Code Contribution
Key Insight: IDE completion was the everyday surface from March to July, while cloud agents, AI code review and finally the CLI appeared over the summer. On the right, lines suggested spike far above lines landed: AI proposes a lot more code than engineers keep. That gap is the most honest measure of AI's real contribution to the codebase.
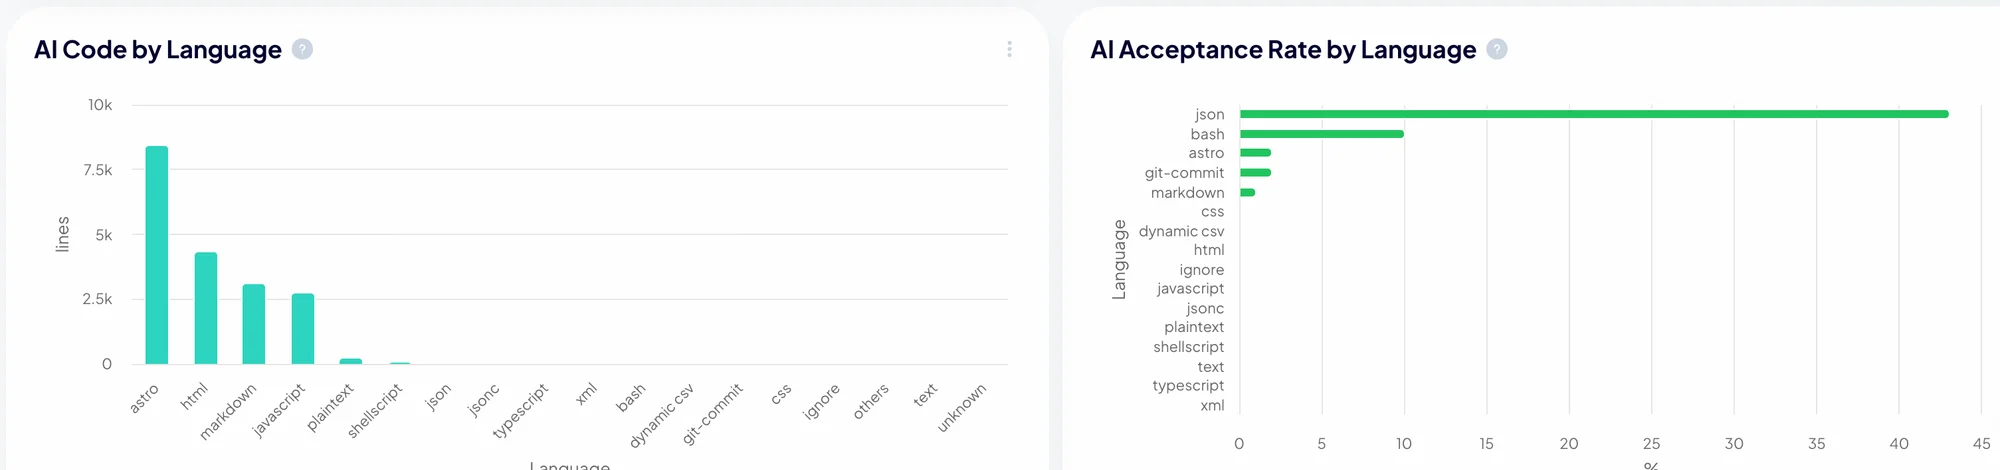
3. Where AI Helps Most: Languages
Not every language benefits equally from AI. Knowing where suggestions are trusted, and where they are thrown away, tells you where AI is already pulling its weight and where it needs better prompting, context or guidelines.
Prompt:
Which languages receive the most AI-generated code, and what is the
AI suggestion acceptance rate for each language?
Output: AI Code by Language and AI Acceptance Rate by Language
Key Insight: The languages that receive the most AI code (Astro, HTML, Markdown, JavaScript) are not the ones where suggestions are most often accepted (JSON and Bash). Structured, repetitive formats are where engineers trust AI completions; component and markup code gets generated in volume but rewritten heavily.
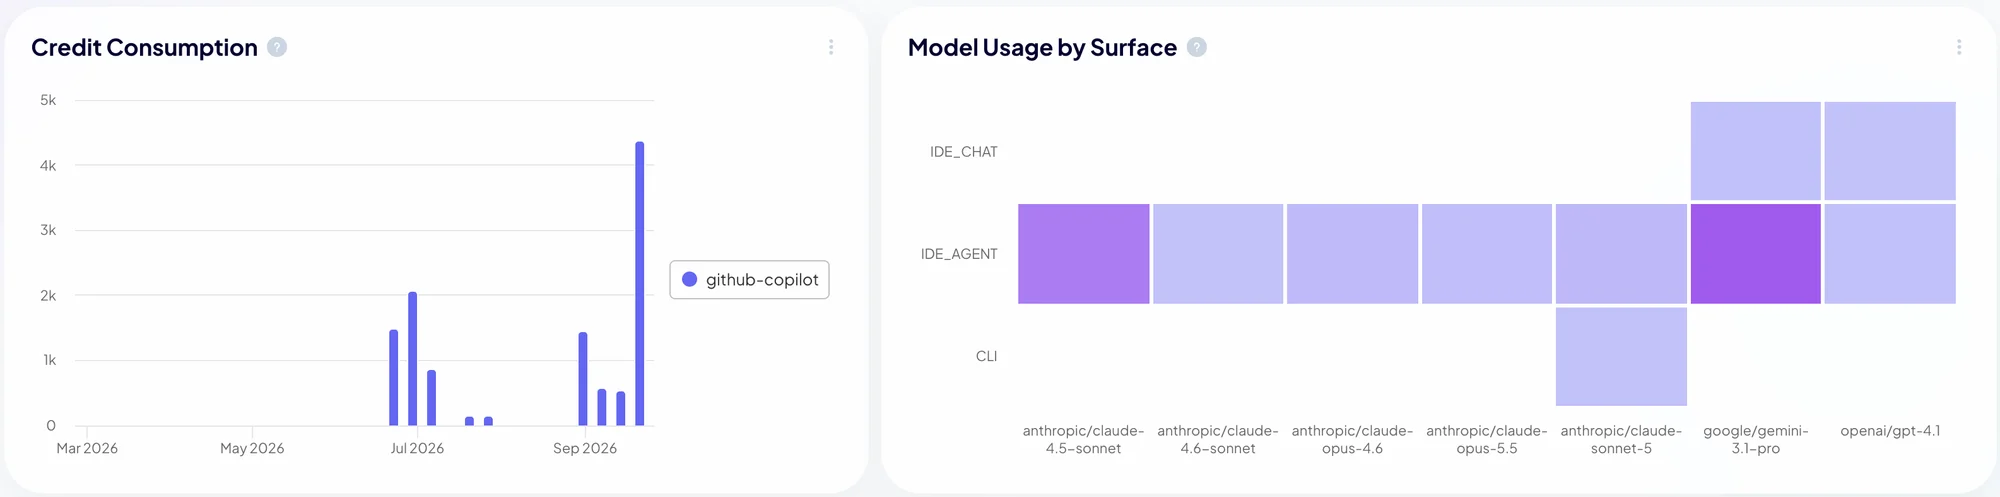
4. Models and Consumption
The model your engineers pick drives both quality and cost. This section shows credit consumption over time and which models are used on which surfaces.
Prompt:
Show AI credits consumed per day since March, and which models our
engineers use on each AI surface.
Output: Credit Consumption and Model Usage by Surface
Key Insight: Credit consumption is spiky, not linear: a handful of days account for most of the spend, which is typical of agent-mode sessions. The heatmap shows a single Copilot subscription serving Claude, Gemini and GPT models, with IDE agent as the surface where model choice varies the most.
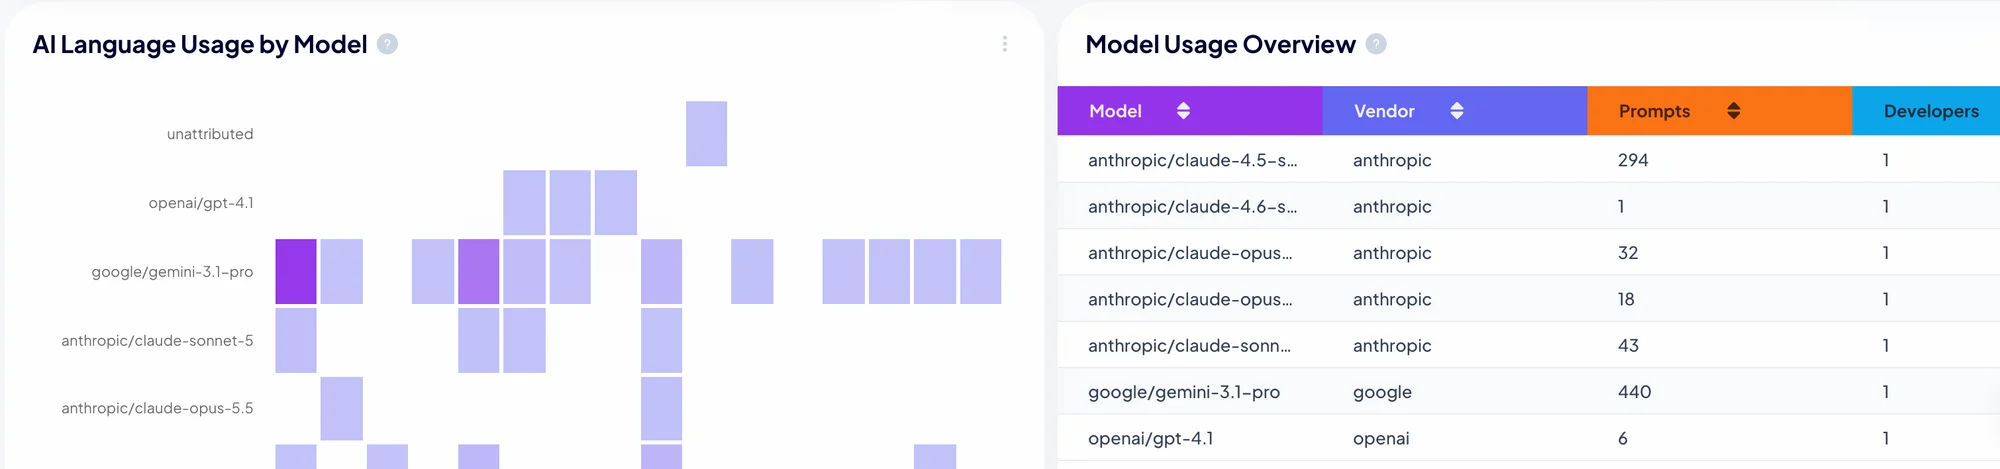
5. Model Usage Overview
Finally, a table gives the receipts: prompts and developers per model and vendor.
Output: AI Language Usage by Model and Model Usage Overview
Key Insight: Two models carry almost all the usage: Gemini 3.1 Pro with 440 prompts and Claude 4.5 Sonnet with 294. Everything else, from Claude Opus to GPT-4.1, is experimentation. That's the kind of fact that turns a vague "should we standardize on a model?" discussion into a five-minute decision.
Ask Your AI Assistant: AI Usage Through the Keypup MCP Server
Dashboards are great for recurring reviews. For one-off questions, the fastest path is to ask your own AI assistant. The AI Usage dataset is available through the Keypup MCP Server, so Claude, ChatGPT, Cursor or VS Code can query it directly.
1. Connect in One Click
Add https://hq.keypup.io/mcp to your AI client and sign in with your Keypup account. The connection uses OAuth, so there's no API token to copy, and every MCP tool is read-only: your assistant can query your engineering data, never change it. Step-by-step guides are available for Claude and ChatGPT.
2. Ask in Plain English
Prompt to your AI assistant, connected to the Keypup MCP Server
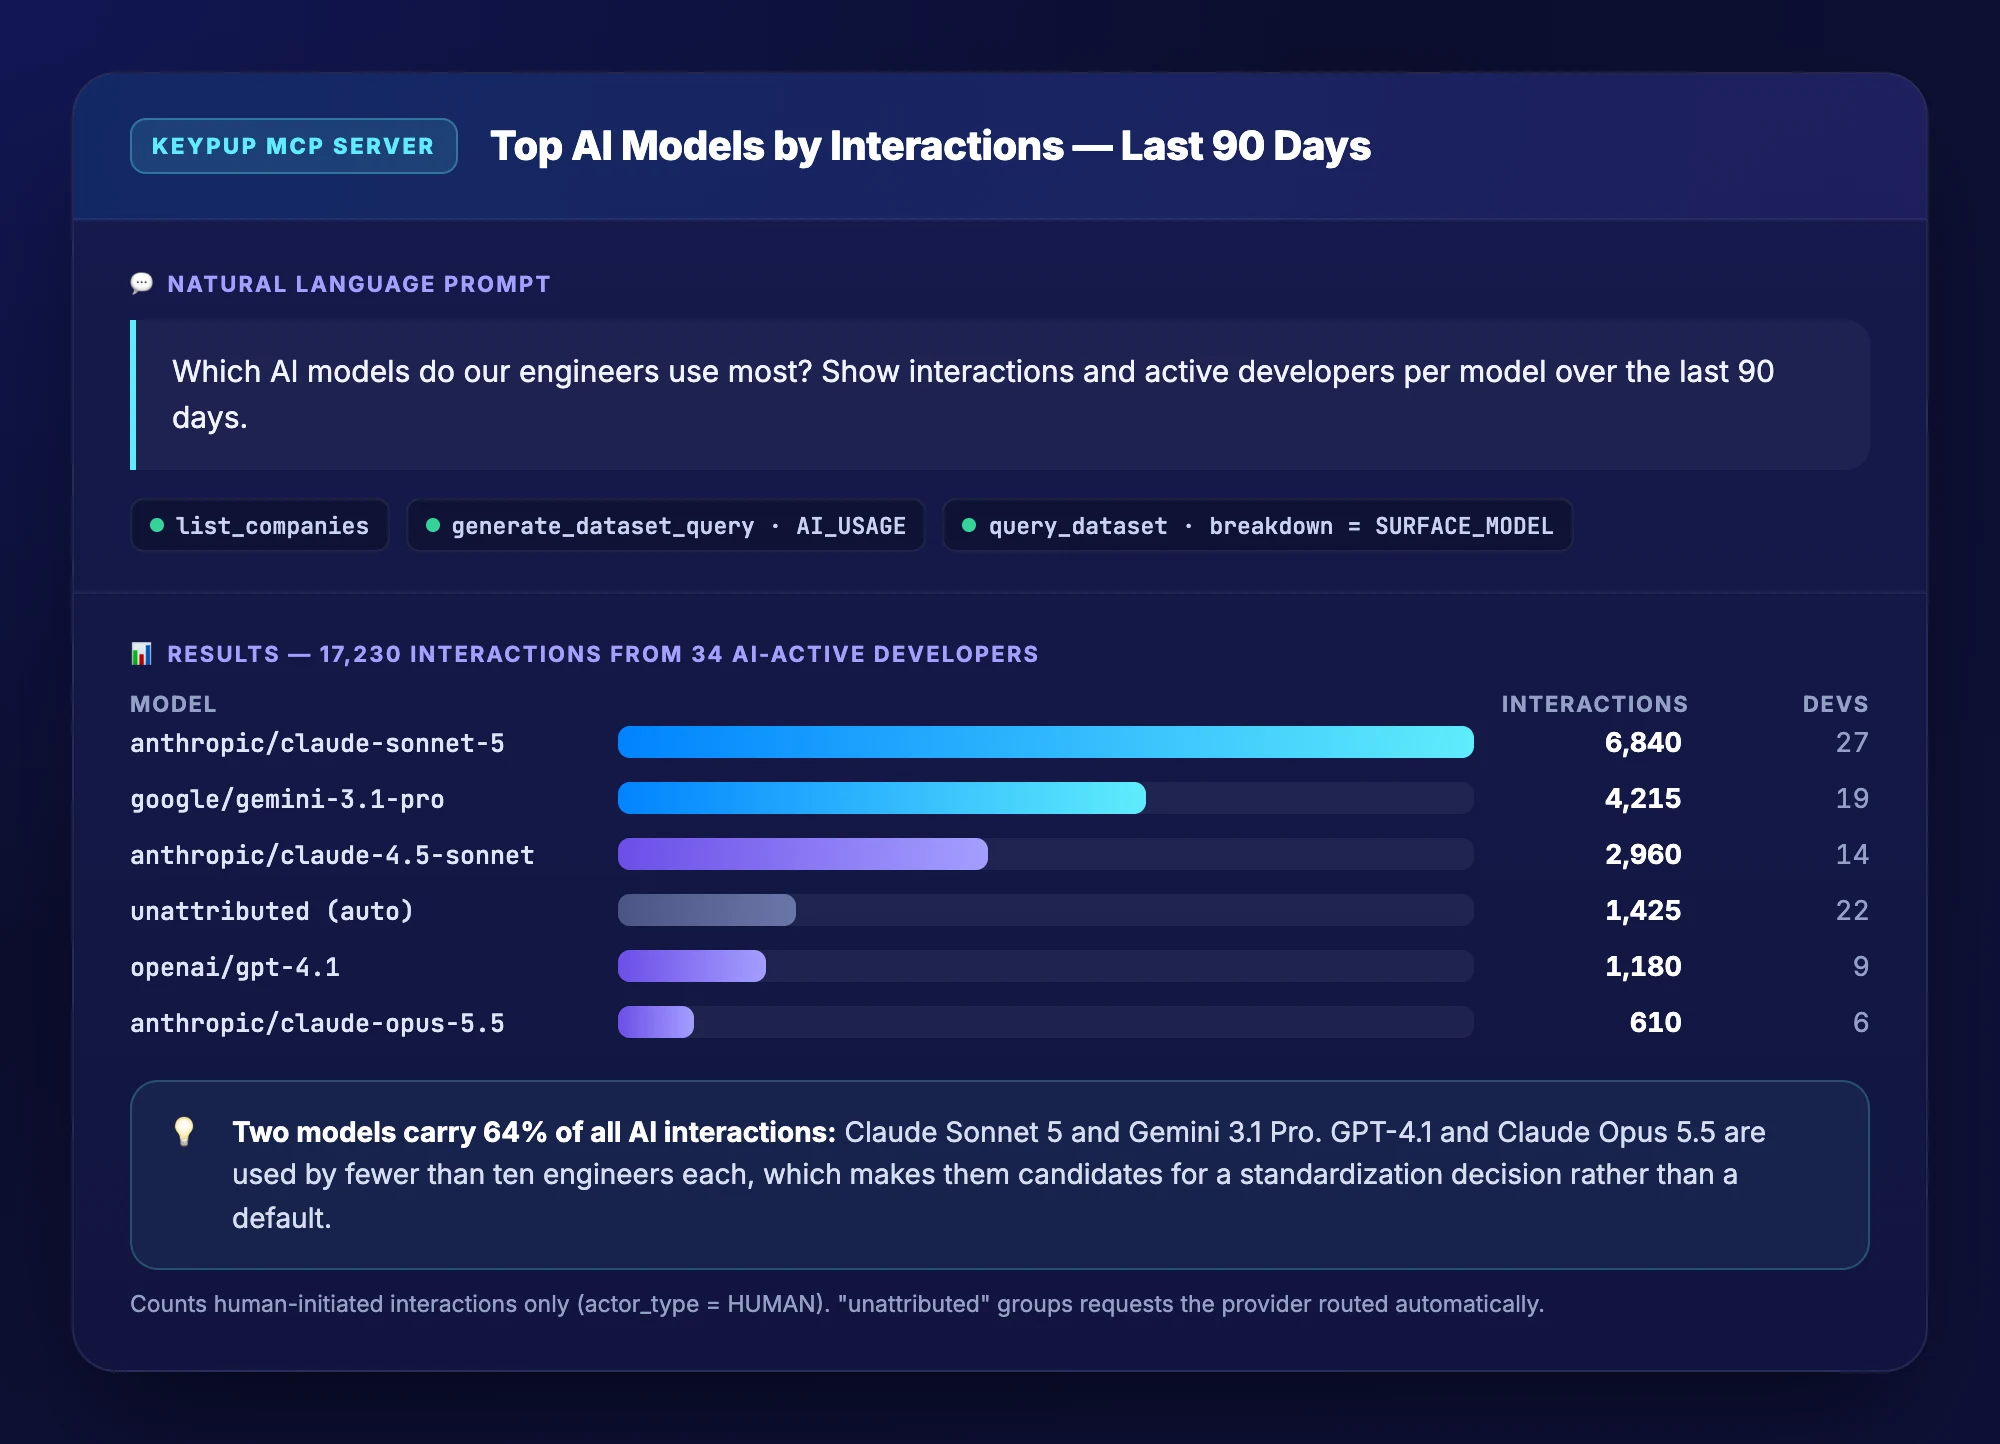
Which AI models do our engineers use most? Show interactions and active developers per model over the last 90 days.
3. See What Happens Behind the Scenes
The assistant finds your workspace with list_companies, then calls generate_dataset_query, which turns the question into a structured query on the AI Usage dataset. This is the query the Keypup MCP Server actually generated for the prompt above:
{
  "dataset": "AI_USAGE",
  "metrics": [
    { "label": "Interactions", "formula": "SUM(interactions)", "sort": "DESC" },
    { "label": "Active developers", "formula": "COUNT_DISTINCT(actor_username)" }
  ],
  "dimensions": [
    { "label": "Model", "formula": "model_ref" }
  ],
  "filters": [
    { "formula": "aggregation_level == \"USER\" && breakdown == \"SURFACE_MODEL\" && actor_type == \"HUMAN\" && created_at >= NOW() - 90 * DAY()" }
  ]
}
Notice what the server gets right without being told:
- It sums interactions, the human-initiated prompts, instead of counting raw model calls that would inflate agent-mode usage.
- It pins a single
aggregation_level and breakdown, so the same activity is never counted twice across overlapping cuts of a provider report. - It filters on
actor_type == "HUMAN", so service accounts are not counted as developers.
The assistant then runs the query with query_dataset and answers with your numbers. Here is what the answer looks like for a 40-engineer team:
Output: Top AI Models by Interactions — Last 90 Days
Key Insight: Two models carry 64% of all AI interactions. The long tail of models used by a handful of engineers is where a standardization decision saves the most, in both cost and support effort.
4. Combine AI Usage With Delivery Data
Because the MCP Server exposes every Keypup dataset, your assistant can cross AI usage with pull requests, reviews and commits in the same conversation. The outputs below come from the same 40-engineer team.
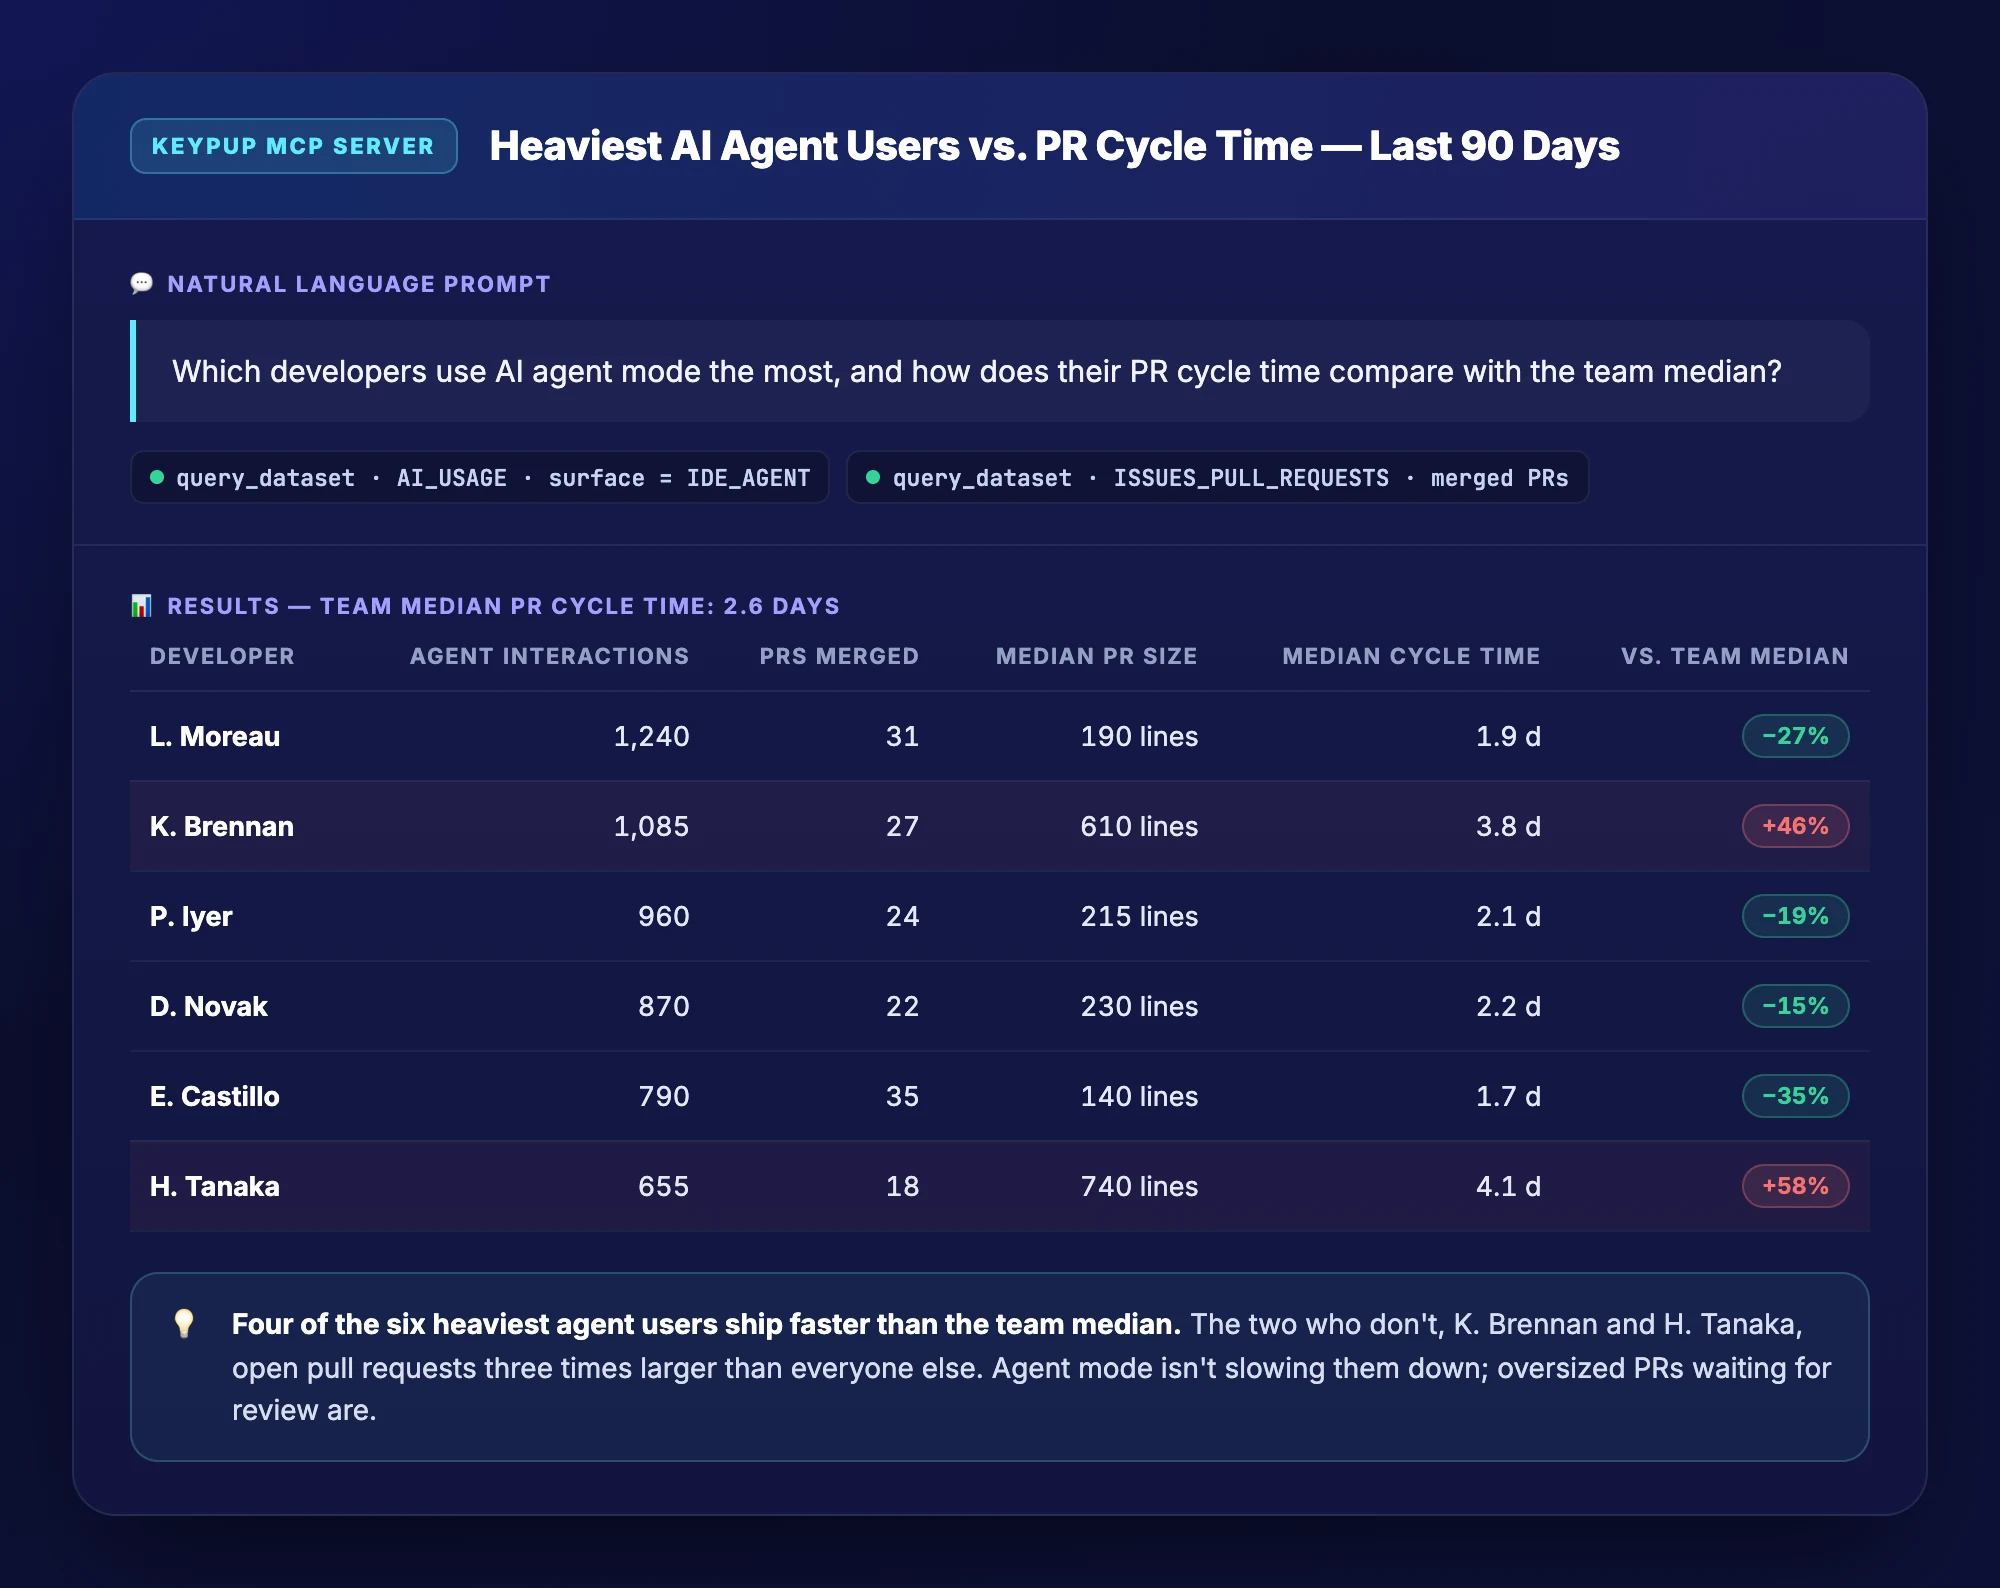
Are Heavy Agent Users Shipping Faster?
MCP Prompt:
Which developers use AI agent mode the most, and how does their PR
cycle time compare with the team median?
Output: Heaviest AI Agent Users vs. PR Cycle Time — Last 90 Days
Key Insight: Four of the six heaviest agent users ship faster than the team median. The two who don't open pull requests three times larger than their peers, so the fix is smaller PRs, not less AI.
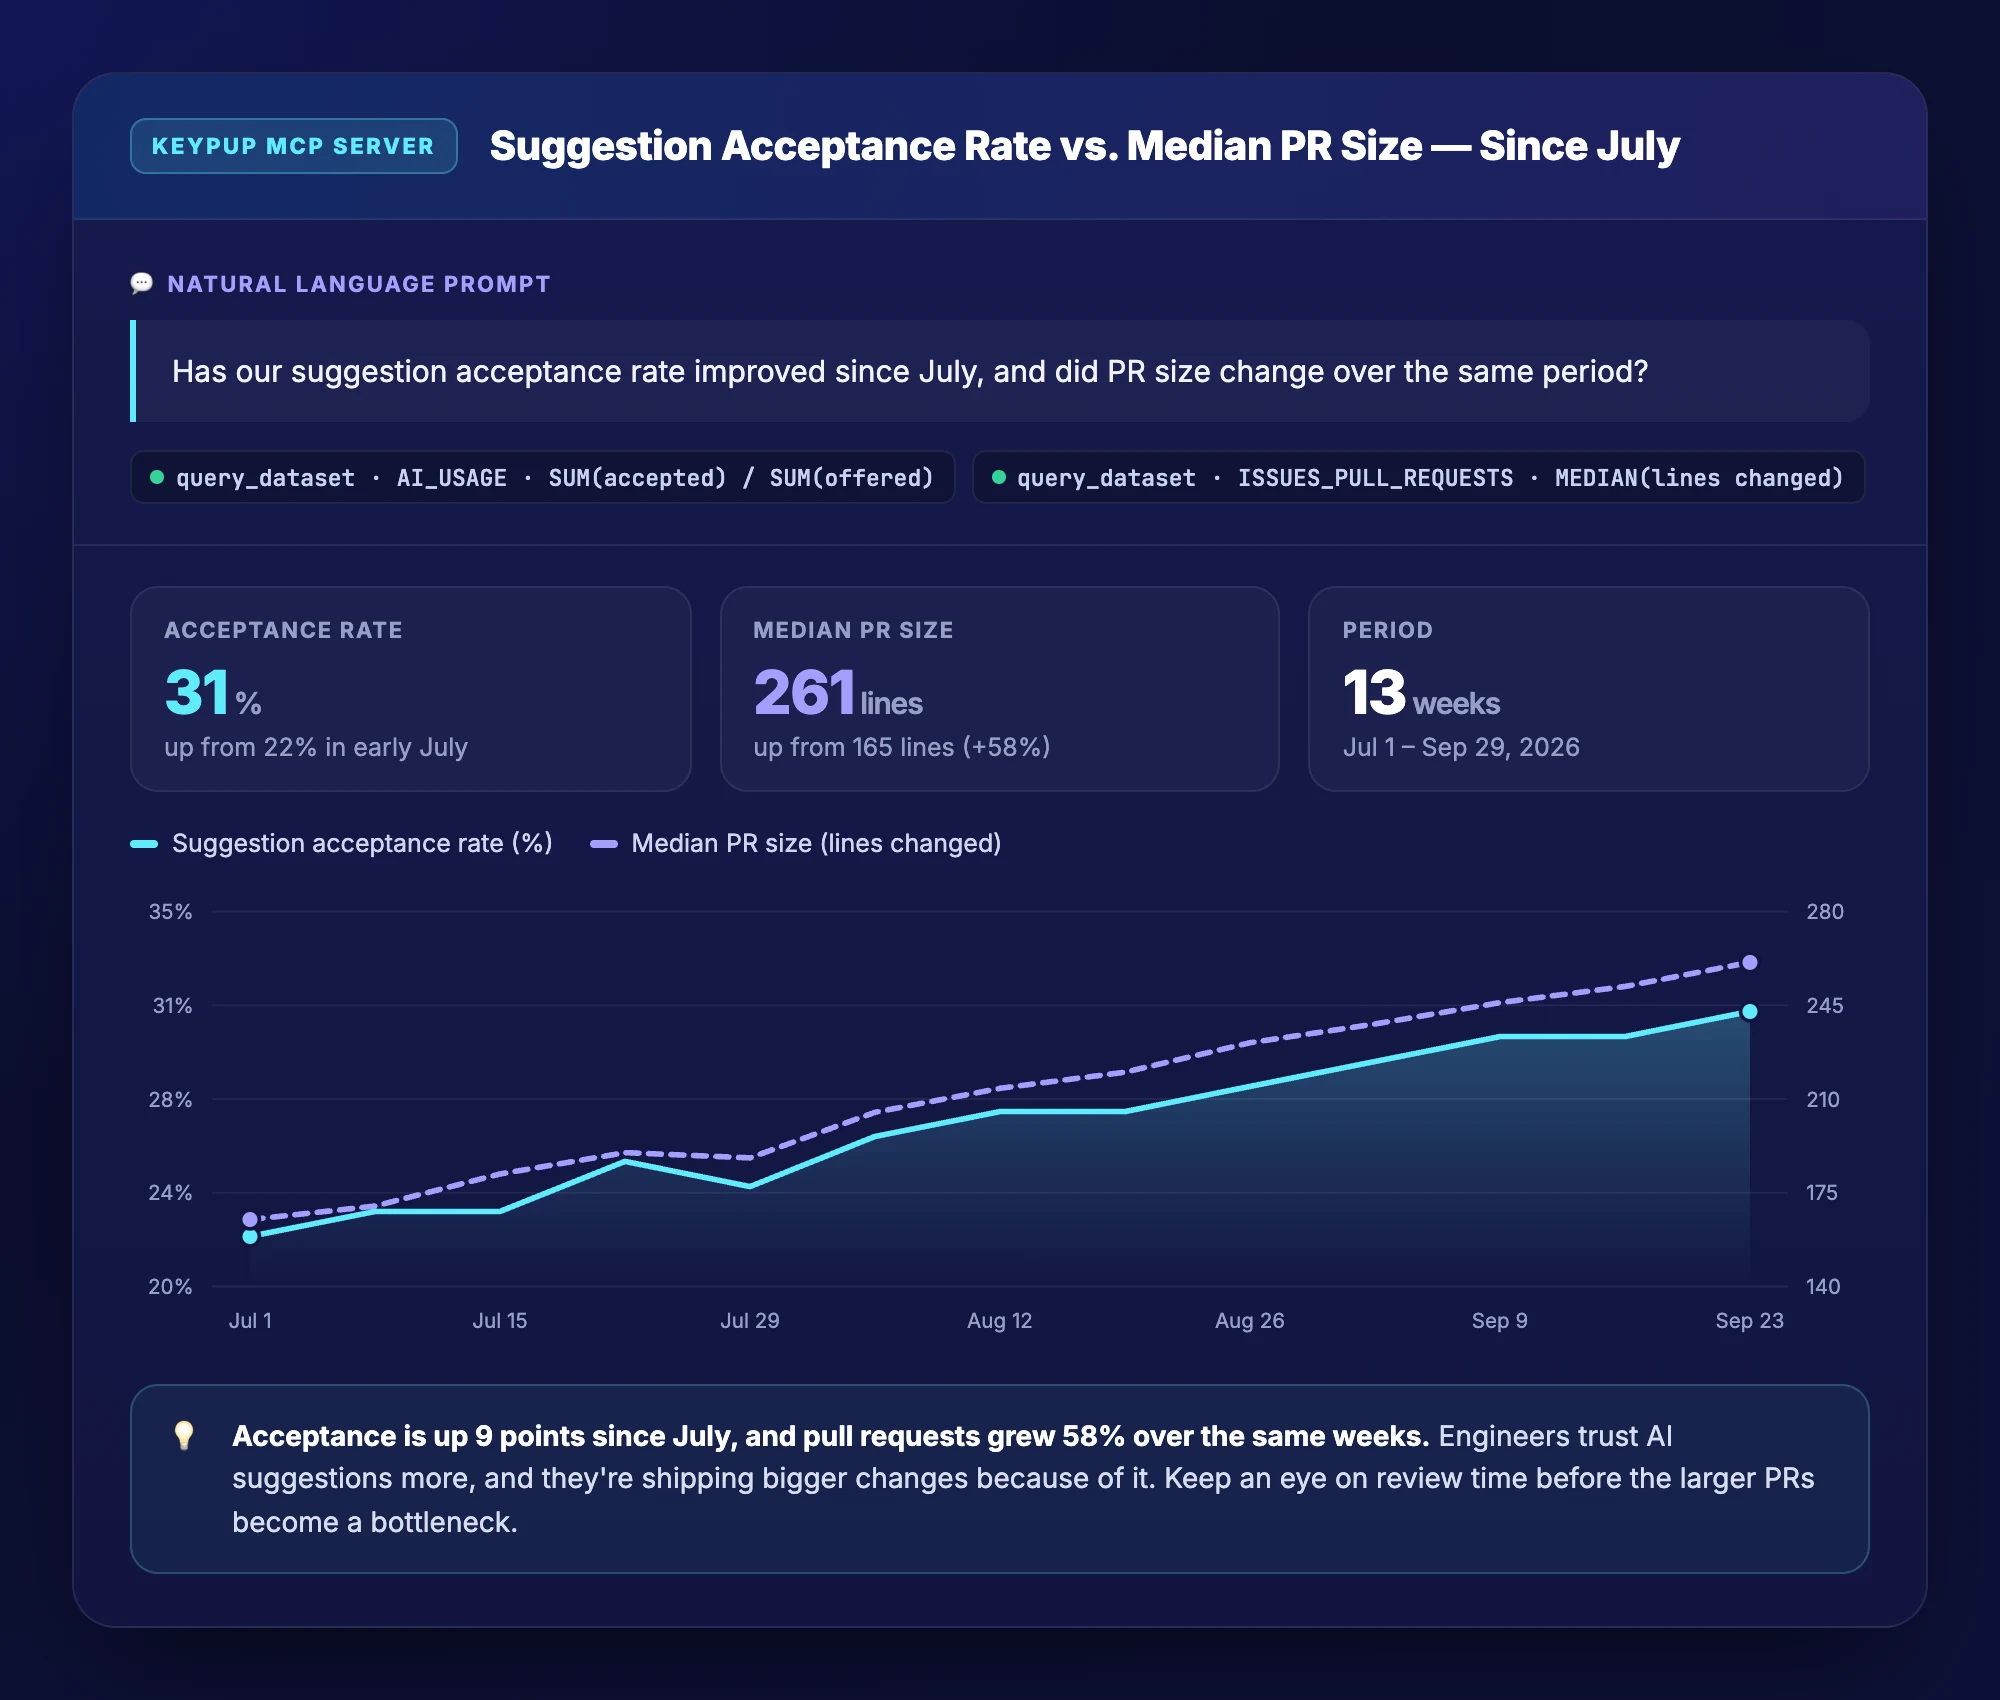
Is AI Getting More Useful, and Are PRs Getting Bigger?
MCP Prompt:
Has our suggestion acceptance rate improved since July, and did PR
size change over the same period?
Output: Suggestion Acceptance Rate vs. Median PR Size — Since July
Key Insight: The acceptance rate rose 9 points in 13 weeks while median PR size grew 58%. AI is earning trust, and the larger changes it enables are the next thing to watch in review.
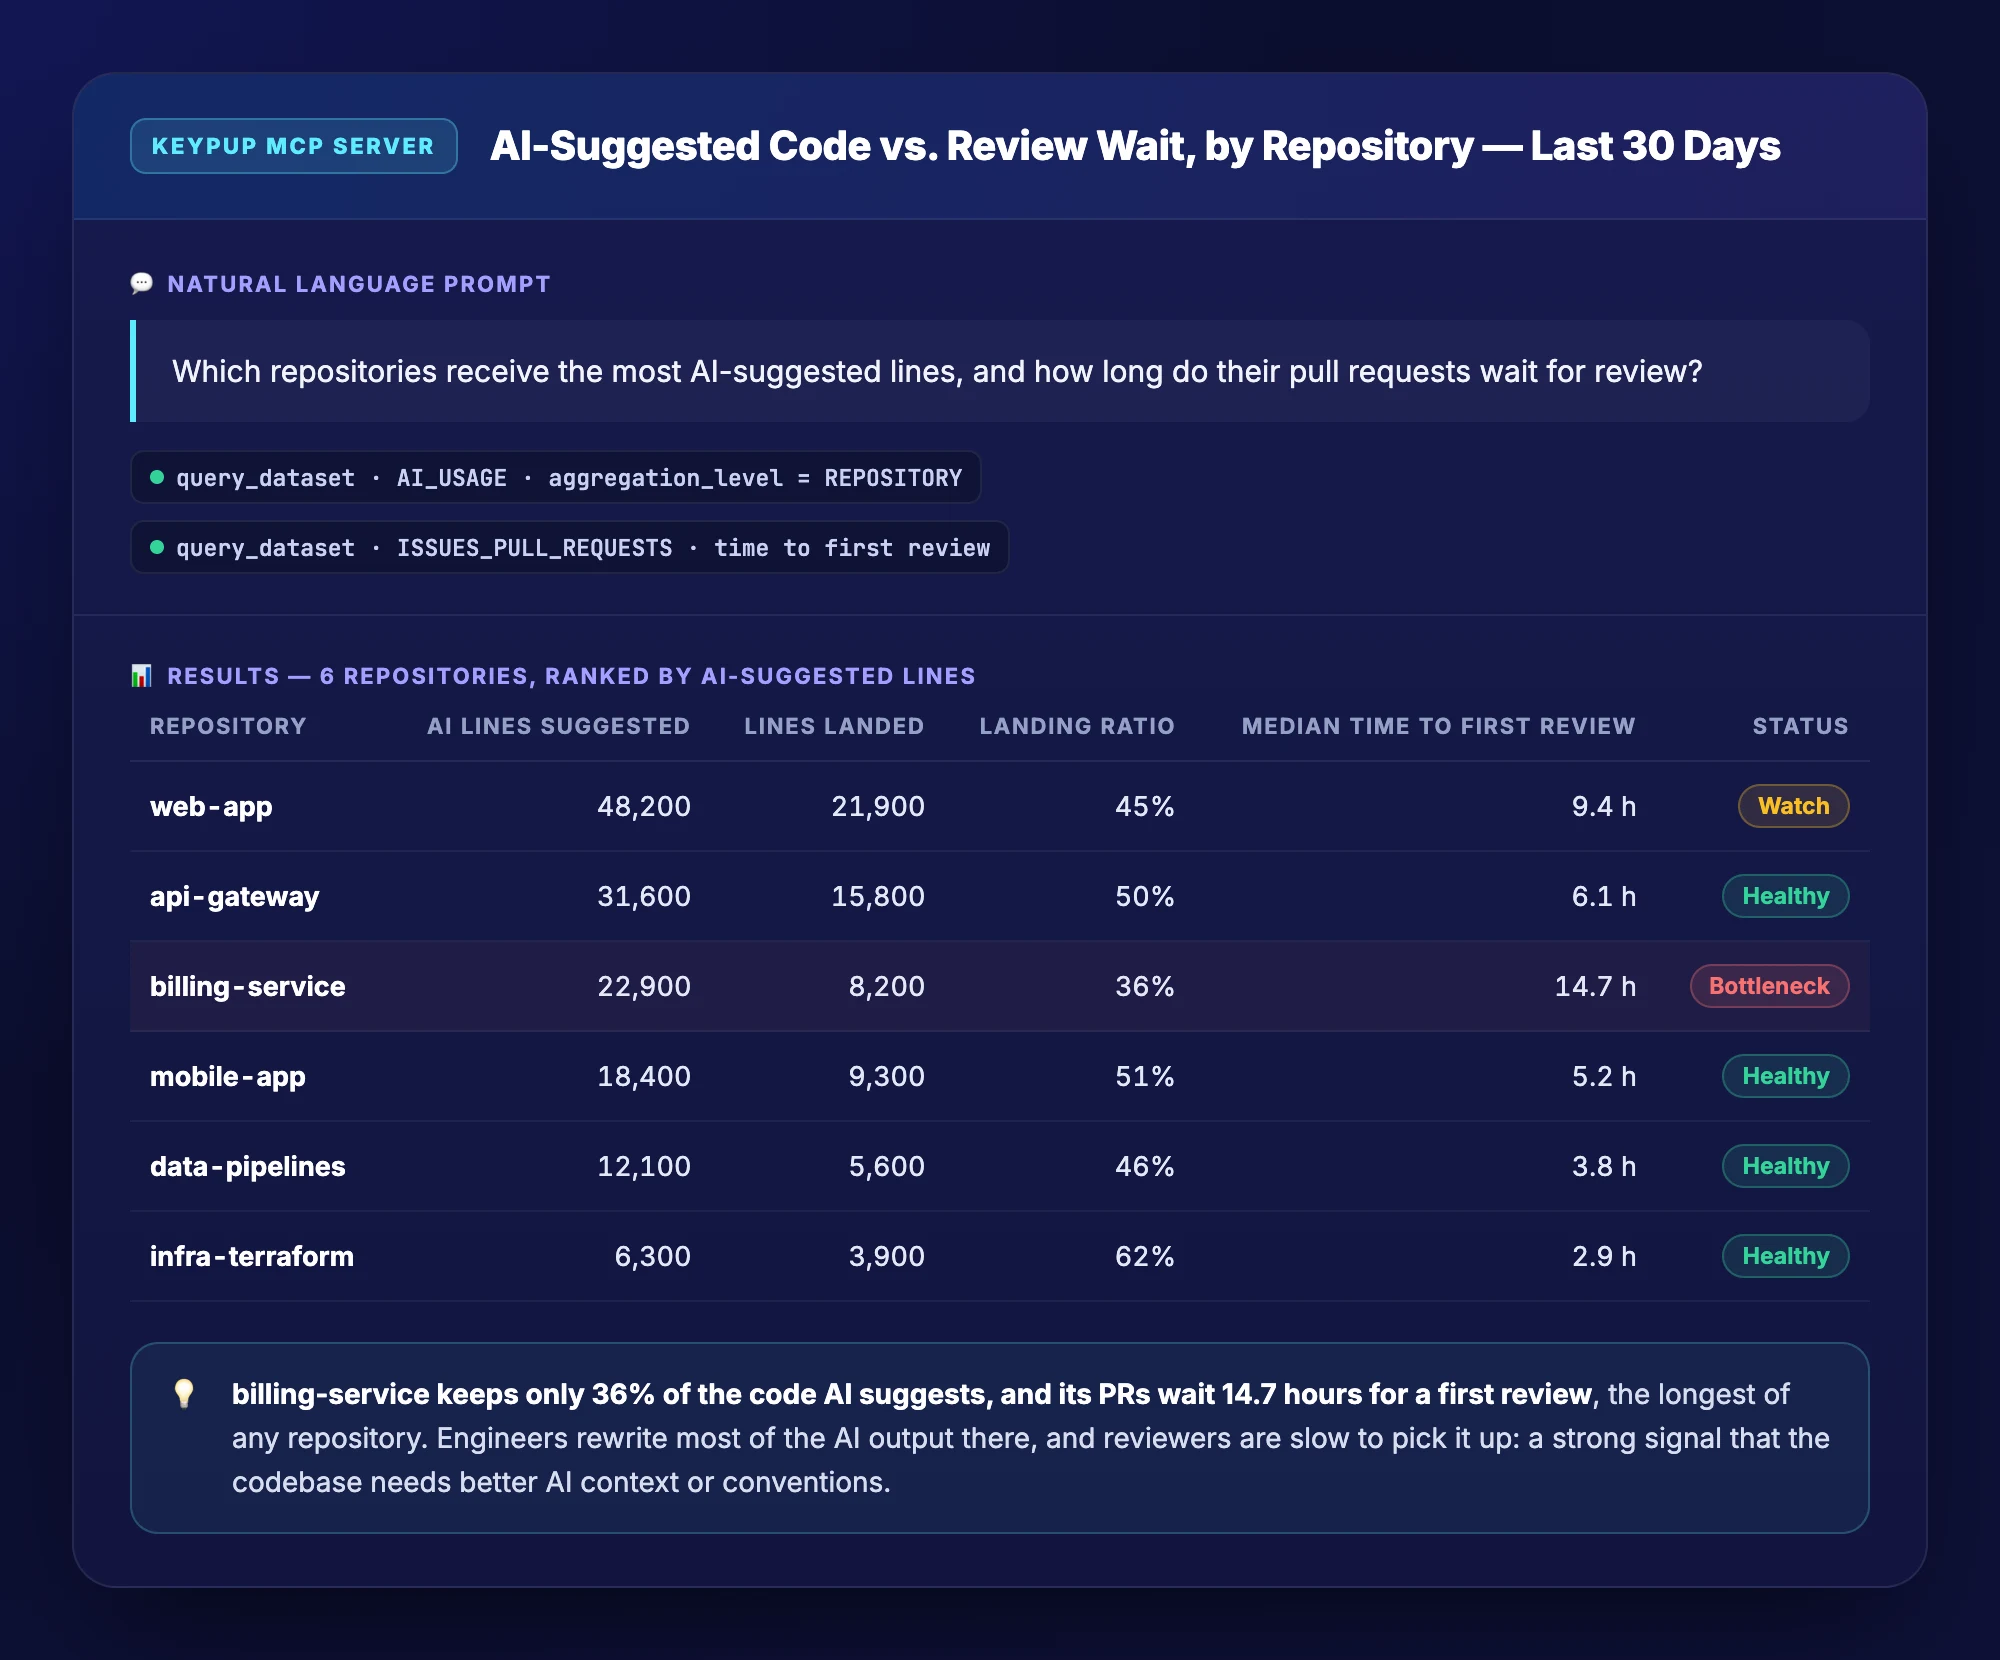
Where Does AI-Suggested Code Wait the Longest?
MCP Prompt:
Which repositories receive the most AI-suggested lines, and how long
do their pull requests wait for review?
Output: AI-Suggested Code vs. Review Wait, by Repository — Last 30 Days
Key Insight: billing-service keeps the smallest share of AI-suggested code and has the longest review wait. That combination points to a codebase where AI lacks context, a better target for enablement than a team-wide training session.
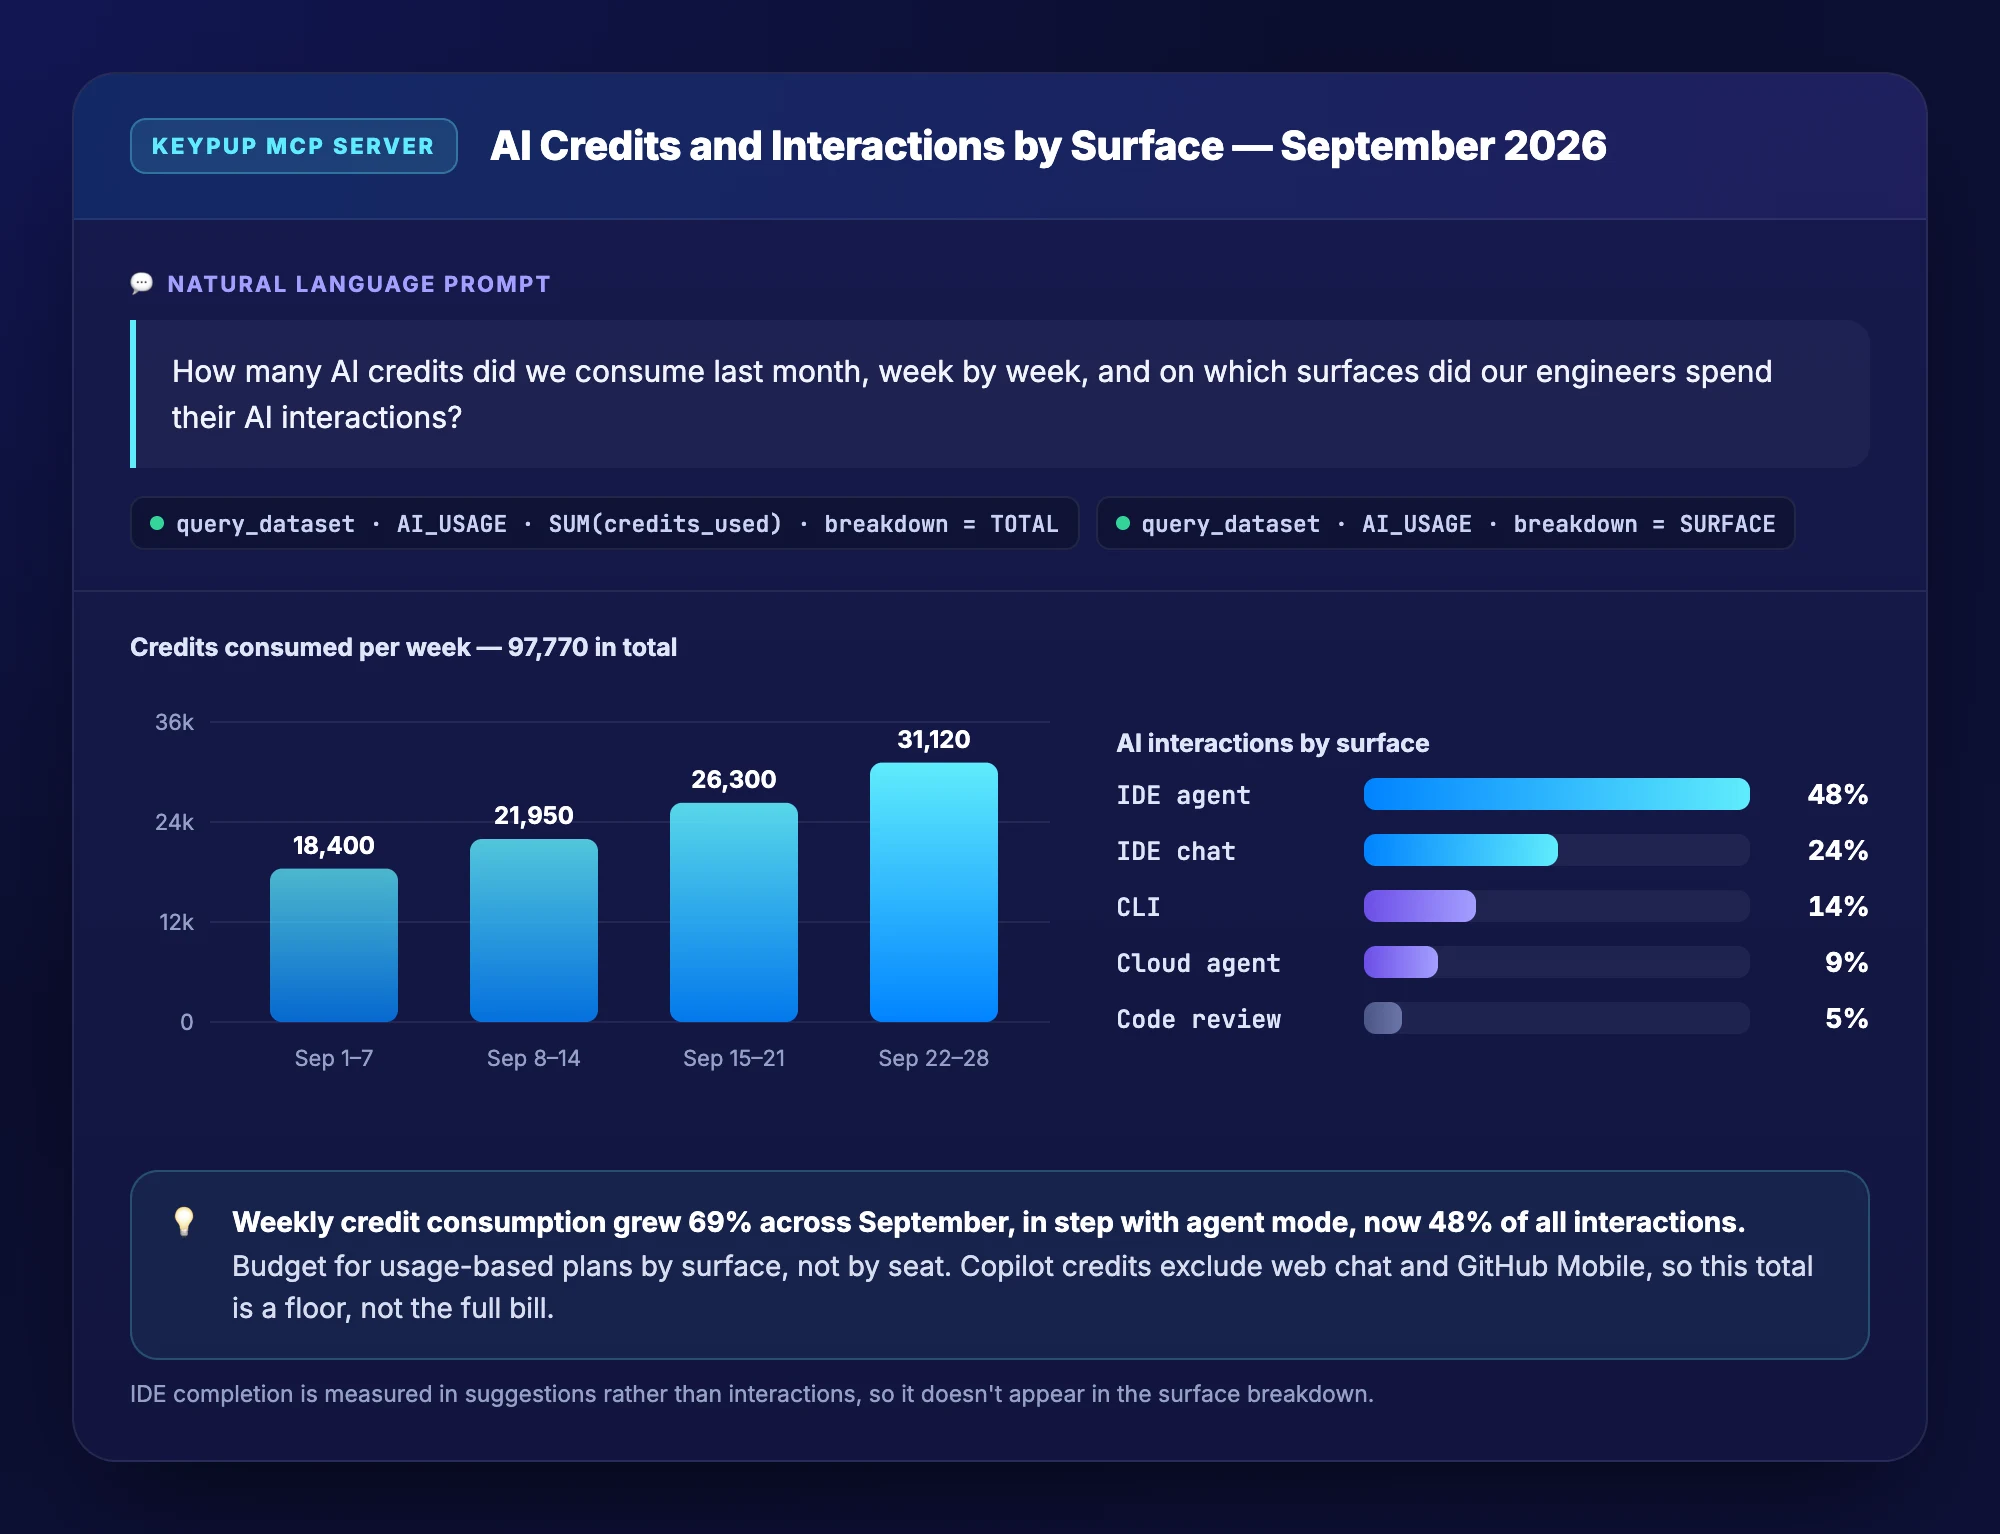
What Did AI Cost Us Last Month, and Where Did the Usage Go?
MCP Prompt:
How many AI credits did we consume last month, week by week, and on
which surfaces did our engineers spend their AI interactions?
Output: AI Credits and Interactions by Surface — September 2026
Key Insight: Weekly credit consumption grew 69% across the month, in step with agent mode. GitHub Copilot doesn't break credits down by model, so the assistant pairs credits with the surface mix instead, the closest honest proxy for where the spend goes.
For a deeper walkthrough of measuring AI's effect on delivery, see Measure AI Impact on Software Development.
The Technical Implementation: How Keypup Keeps AI Usage Numbers Honest
Overlapping Breakdowns, Counted Once
A single Copilot user report contains a day total plus several breakdowns, each slicing the same activity differently. Stored naively, those rows look identical and summing them multiplies usage. Keypup labels every row with an aggregation_level and a breakdown, and every shipped AI usage insight pins both, so totals stay totals.
Requests, Interactions and Sessions Are Kept Apart
requests counts model calls, including automated follow-ups; interactions counts human prompts; sessions counts working sessions. On agentic surfaces one prompt can trigger dozens of calls, so Keypup keeps all three and lets each insight say which one it means.
Provider Limits Are Shown, Not Hidden
Coverage varies by provider. Copilot, for example, publishes tokens only for its CLI and desktop app, and its credits exclude web chat and GitHub Mobile, so Copilot credits are a floor rather than a full bill. Keypup surfaces those gaps as "not available" instead of zero, so a missing measure is never reported as a drop in usage.
Implementation: Getting Started with AI Usage Monitoring
1. Enable Copilot Metrics in Your GitHub Integration
Turn on the Copilot Metrics project in your Keypup GitHub integration. Keypup imports up to one year of history on the first sync, so trends are available on day one.
2. Add the AI Usage & Monitoring Dashboard
Add the dashboard template in one click. Every insight is pre-configured with the right filters, and you can edit any of them or ask the Keypup AI Agent to build new ones.
3. Connect Your AI Assistant to the MCP Server
Add https://hq.keypup.io/mcp to Claude, ChatGPT, Cursor or VS Code and sign in. From there, ask AI usage questions in plain English, alone or combined with delivery data.
4. Review AI Usage Alongside Delivery, Every Month
Schedule a recurring review covering:
- Active developers versus licences assigned, to spot unused seats
- Usage by surface, to see whether agents are replacing autocomplete
- Lines suggested versus lines landed, to measure real code contribution
- Credits over time and by surface, to keep usage-based plans predictable
- AI adoption next to cycle time and review load, to ground the ROI discussion
Frequently Asked Questions
What is AI usage monitoring?
AI usage monitoring is the practice of measuring how engineers use AI coding assistants: who uses them, how often, on which surfaces and models, how many suggestions they accept and how much AI-suggested code reaches the codebase. In Keypup, it's powered by the AI Usage dataset and the AI Usage & Monitoring Dashboard.
Which AI coding assistants does Keypup support?
GitHub Copilot is available today, with up to one year of history imported on the first sync. Anthropic Claude is coming next, followed by Cursor and OpenAI. All providers map onto the same dataset, so they can be compared side by side.
How is the AI suggestion acceptance rate calculated?
The acceptance rate is the sum of suggestions accepted divided by the sum of suggestions offered over a period. Because not every provider publishes suggestions offered, acceptance rates aren't directly comparable across all tools, and a low rate can simply mean a team works mostly in chat or agent mode rather than inline completion.
Does Keypup show a zero when a provider doesn't report a metric?
No. When a provider doesn't publish a measure, Keypup stores it as null and displays it as "not available." This prevents a missing measure from being misread as a drop in usage.
Can I query AI usage data from Claude, ChatGPT or Cursor?
Yes. The AI Usage dataset is available through the Keypup MCP Server at https://hq.keypup.io/mcp. Connect your AI client with a one-click OAuth sign-in and ask questions in plain English; all MCP tools are read-only.
How do I connect AI usage to delivery metrics like cycle time?
Because AI usage lands in the same place as pull requests, reviews and commits, you can build insights or ask the MCP Server questions that combine them, such as comparing AI agent usage with PR cycle time or review load per developer.
Should I use AI usage metrics to rank individual engineers?
We don't recommend it. AI usage metrics are best used to find unused licences, target enablement, choose models and understand where AI helps. Ranking people by prompts or acceptance rate rewards the wrong behaviour and erodes trust in the data.
The Bottom Line: Measure AI Adoption Like Any Other Engineering Investment
AI coding assistants have become a significant line in every engineering budget, and they deserve the same rigour as any other investment. Doing that well requires:
✅ One dataset for every AI provider, with the same definitions of usage, surface and model ✅ Daily, per-developer granularity, broken down by surface, model, client and language ✅ Honest numbers, where missing measures read "not available" and restated days are corrected in place ✅ AI usage next to delivery data, so adoption can be compared with cycle time, review load and throughput ✅ Answers in plain English, from a ready-made dashboard or your own AI assistant through MCP
The AI Usage & Monitoring Dashboard and the Keypup MCP Server turn "we think adoption is good" into a precise answer: who uses AI, how much, on what, and to what effect.
Get Started
Ready to see how your engineers really use AI?
Start Free Trial — Connect GitHub in minutes and import up to one year of Copilot usage history.
Add the AI Usage & Monitoring Dashboard — Get adoption, surface, model and code-contribution insights in one click.
Explore AI Usage Monitoring — See everything the AI Usage dataset can answer.
View MCP Documentation — Connect Claude, ChatGPT, Cursor or VS Code to your Keypup data.
Keywords: AI usage monitoring, AI coding assistant adoption, GitHub Copilot usage metrics, Copilot acceptance rate, AI code contribution, AI credits consumption, AI model usage analytics, engineering AI ROI, MCP server AI usage, Keypup AI Usage dataset