The Context-Switching Tax: How Too Many Concurrent Tickets Are Quietly Doubling Your Cycle Time
Cycle time keeps climbing even though the backlog looks "normal." The hidden cause is concurrent WIP per engineer. See what Reddit engineers say about ticket-juggling, and how Keypup MCP exposes the context-switching tax hiding inside your sprint data.
TL;DR: Engineers juggling five or more concurrent tickets take more than twice as long to close any single one of them compared to engineers focused on one or two — yet almost no sprint dashboard tracks concurrent WIP per person at all. The result is a slow, invisible cycle-time inflation that gets blamed on "harder tickets" or "bad estimation" every retro, while the real driver — an engineer quietly carrying seven open tickets at once — never shows up anywhere leadership looks. The Keypup MCP Server reconstructs concurrent WIP per engineer from Git and issue-tracker timestamps, correlates it directly against cycle time, and flags which teams and individuals have blown past a sustainable WIP limit — turning a recurring "why is everything taking longer" mystery into a precise, fixable workload problem.
Ask an engineering leader why cycle time has been creeping up for two quarters straight, and you'll usually get a story about "more complex tickets" or "the backlog just got harder." Ask the engineer who has seven tickets open in Jira right now which one they're actually working on, and you'll get a long pause — because the honest answer is "whichever one just got a Slack ping," and that answer never makes it into a single sprint report.
The Friction: Every Open Ticket Looks Like Progress, Until It Isn't
Most sprint boards treat "ticket is in progress" as a binary, point-in-time state. They have no concept of how many other tickets that same engineer also has marked "in progress" at the exact same moment — and that blind spot is where the real cost hides.
"In Progress" doesn't mean "being worked on right now." A ticket can sit in an in-progress column for four days while the assigned engineer is actually deep in two other tickets, because nothing in the board distinguishes active focus from parked, half-started work.
Concurrent WIP accumulates silently. Nobody deliberately decides to hand an engineer seven tickets at once. It happens one Slack message, one "quick favor," and one urgent reprioritization at a time, until a backlog of half-finished work has quietly built up without a single explicit decision to allow it.
Cycle time is measured per ticket, never per engineer's total load. Standard cycle time reports show how long an individual ticket took, start to finish. They don't show that the engineer who owned it also had four other tickets open the whole time — the one variable that actually explains why it took so long.
Re-orientation cost is invisible by design. Every switch back to a parked ticket costs real time rebuilding context — what the code does, why the last change was made, what the reviewer asked for. None of that time appears in any tracking system; it just quietly lengthens the ticket's total elapsed time.
The result: the engineers carrying the heaviest concurrent WIP load look like the slowest performers on a cycle-time leaderboard, while the actual driver of the slowdown — an unmanaged pile of simultaneously "in progress" tickets — stays completely invisible to the people reviewing that leaderboard.
Why This Matters: The Backlog Looks Fine, But the Flow Is Broken
The Misdiagnosis Problem
When cycle time climbs, the reflexive question is "are tickets getting harder, or are engineers getting slower?" But if the engineers with the longest cycle times are also the ones with the most tickets open simultaneously, the honest answer isn't difficulty or skill — it's that each ticket is competing with three or four others for the same finite attention, and nobody is tracking the competition.
The False Productivity Signal
A high concurrent-WIP count can look like someone is in high demand and highly productive — "they're trusted with everything." In practice, a growing body of research on task-switching shows that splitting attention across more simultaneously active items reduces total throughput, even though it feels busier. The dashboard rewards the appearance of being stretched thin; the engineer pays for it in elapsed time per ticket.
The Flow Efficiency Problem
Lean and kanban practices have long argued that limiting WIP is one of the single highest-leverage ways to improve flow — yet almost no enterprise engineering org enforces a WIP limit per engineer, because until it can be measured, there's no number to enforce it against. The cost of ignoring it stays diffuse: slightly longer cycle times everywhere, never obviously attributable to any one decision.
The Enterprise Discussion: What Engineers Are Actually Saying
This exact frustration is one of the most consistently upvoted themes wherever engineers at large organizations compare notes on ticket assignment, sprint planning, and why "simple" tickets take a week.
"I currently have six tickets assigned to me that are all technically 'in progress.' I am actively working on exactly one of them. The other five got reprioritized mid-sprint and I was told to 'just keep them open, we'll get back to them.' My manager keeps asking why my average cycle time went from three days to eight. It's not that the tickets got harder. It's that I'm context-switching between six different mental models every single day."
"Every time I switch back to a ticket I parked three days ago, I spend the first 20-30 minutes just re-reading my own diff to remember what I was doing and why. Multiply that by five open tickets and I'm spending close to two hours a day just re-loading context into my own head. None of that shows up anywhere except as 'this ticket is taking longer than estimated.'"
The pattern holds: engineers already feel exactly how much concurrent ticket load slows them down — what's missing is a number that turns that lived, unmeasured experience into a WIP-limit policy leadership will actually enforce.
How Keypup MCP Solves the Context-Switching Tax
The Keypup Model Context Protocol (MCP) Server reconstructs concurrent WIP per engineer directly from Git commit timestamps and issue-tracker state transitions — then correlates it against cycle time, surfaces where the day's hours are actually going, and flags teams and individuals who have blown past a sustainable ticket load, all through natural-language prompts against your existing Git and issue-tracker data.
1. Comparing Cycle Time Across WIP Bands
Before anything else, leadership needs proof that concurrent WIP actually drives cycle time, rather than assuming ticket difficulty explains the gap.
MCP Prompt:
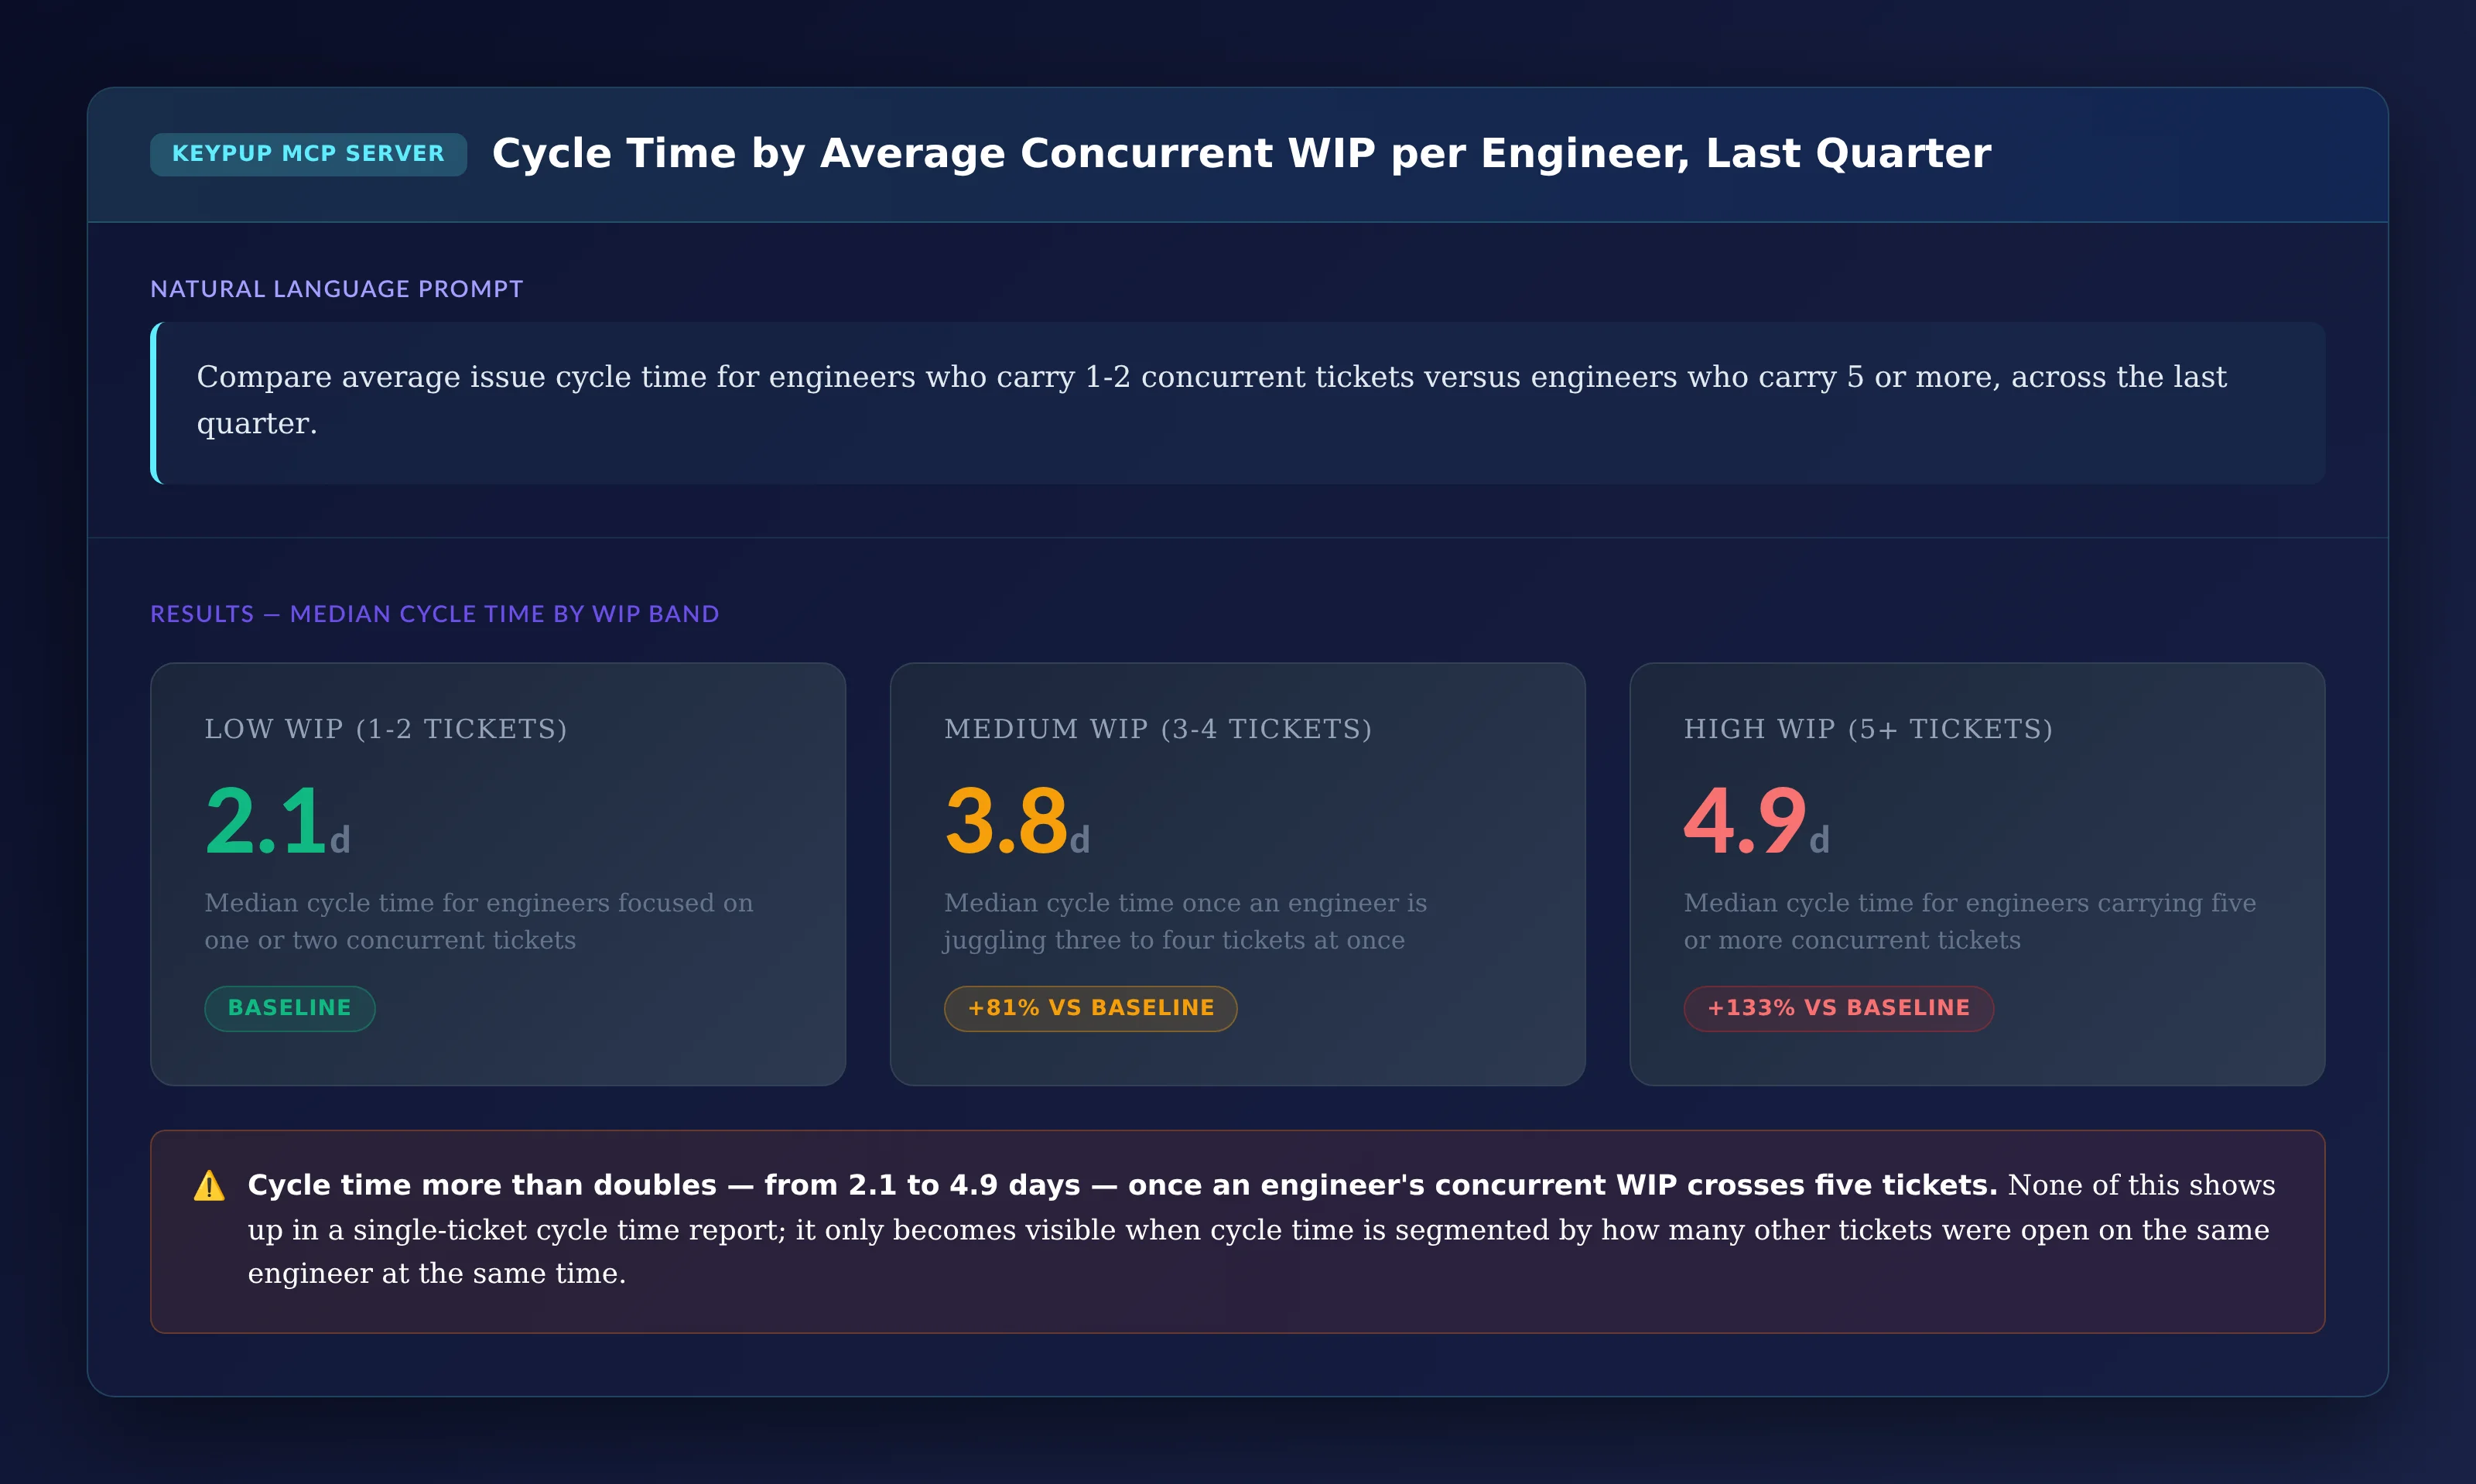
Compare average issue cycle time for engineers who carry 1-2
concurrent tickets versus engineers who carry 5 or more,
across the last quarter.
Output: Cycle Time by Average Concurrent WIP per Engineer
Key Insight: Cycle time more than doubles — from 2.1 to 4.9 days — once an engineer's concurrent WIP crosses five tickets. None of this shows up in a single-ticket cycle time report; it only becomes visible when cycle time is segmented by how many other tickets were open on the same engineer at the same time.
2. Tracking the Correlation Between Switch Rate and Cycle Time Over Time
Once the WIP-to-cycle-time link is established, leadership needs to see whether it's a one-time snapshot or a trend that's actively getting worse.
MCP Prompt:
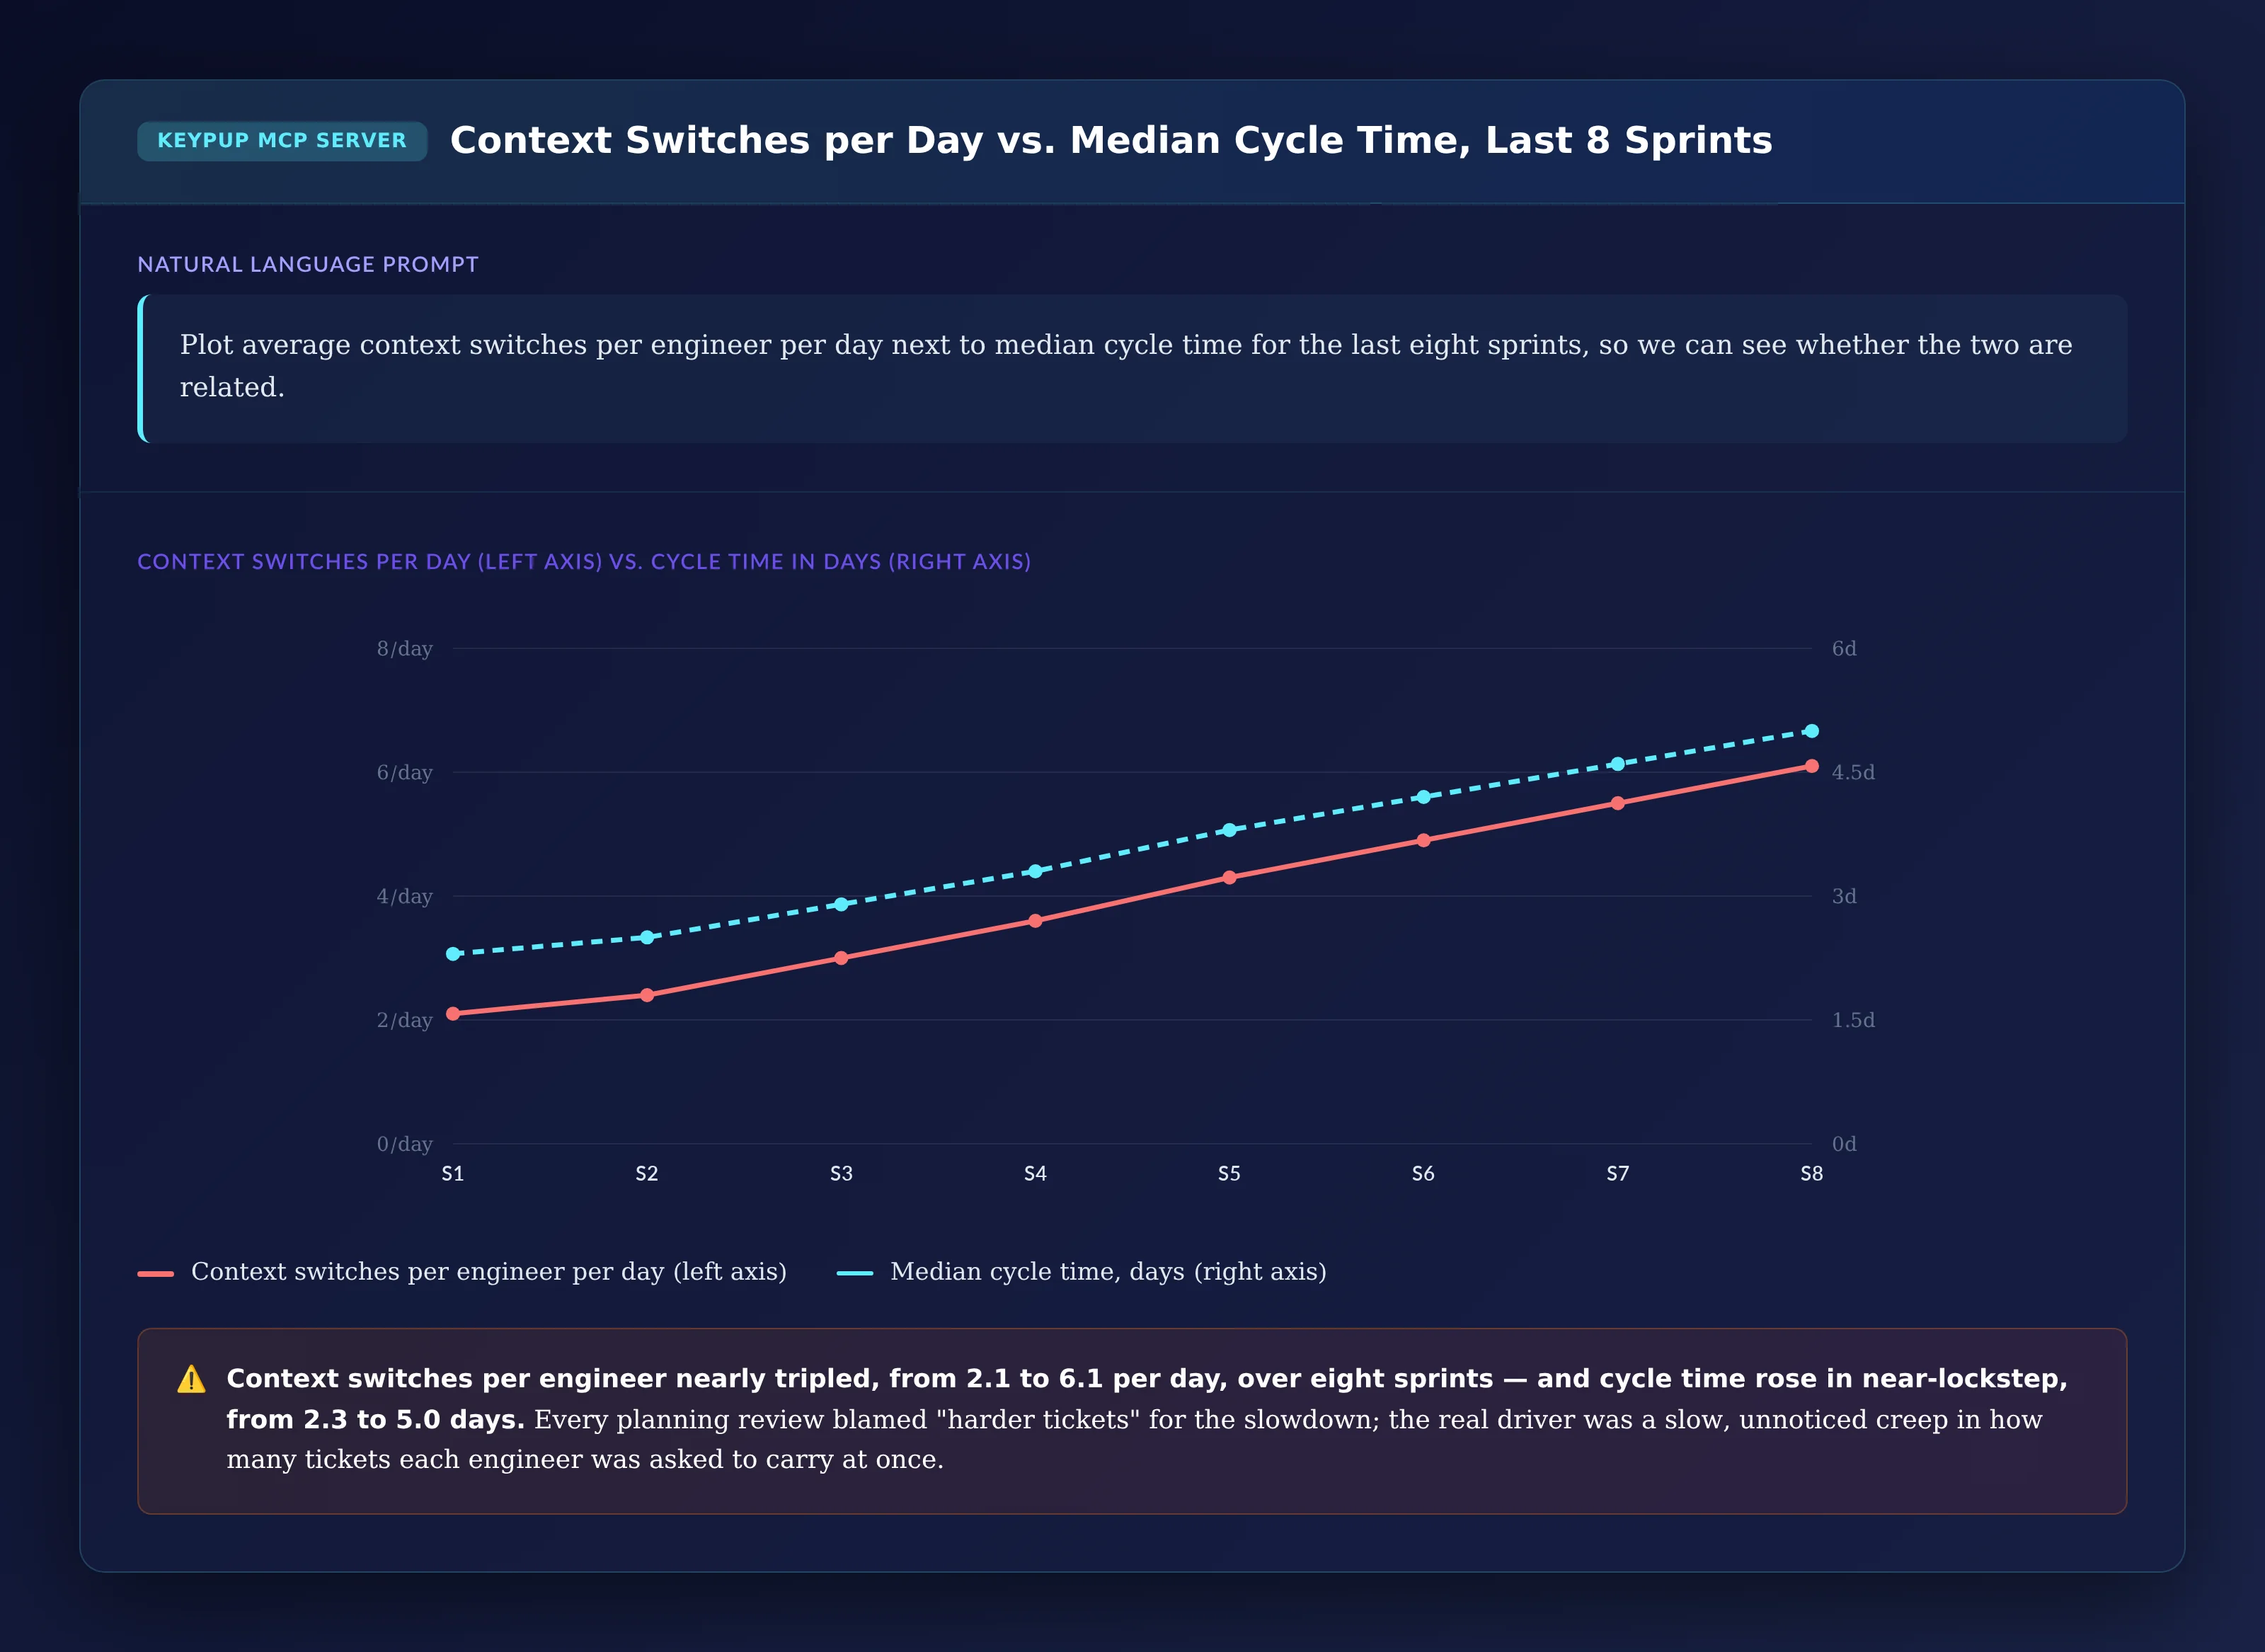
Plot average context switches per engineer per day next to
median cycle time for the last eight sprints, so we can see
whether the two are related.
Output: Context Switches per Day vs. Median Cycle Time, Last 8 Sprints
Key Insight: Context switches per engineer nearly tripled, from 2.1 to 6.1 per day, over eight sprints — and cycle time rose in near-lockstep, from 2.3 to 5.0 days. Every planning review blamed "harder tickets" for the slowdown; the real driver was a slow, unnoticed creep in how many tickets each engineer was asked to carry at once.
3. Splitting Logged Hours Into Deep Work vs. Switching Overhead, by Team
With the trend confirmed, the next question is how much of each team's day is genuinely productive versus consumed by re-orientation after a switch.
MCP Prompt:
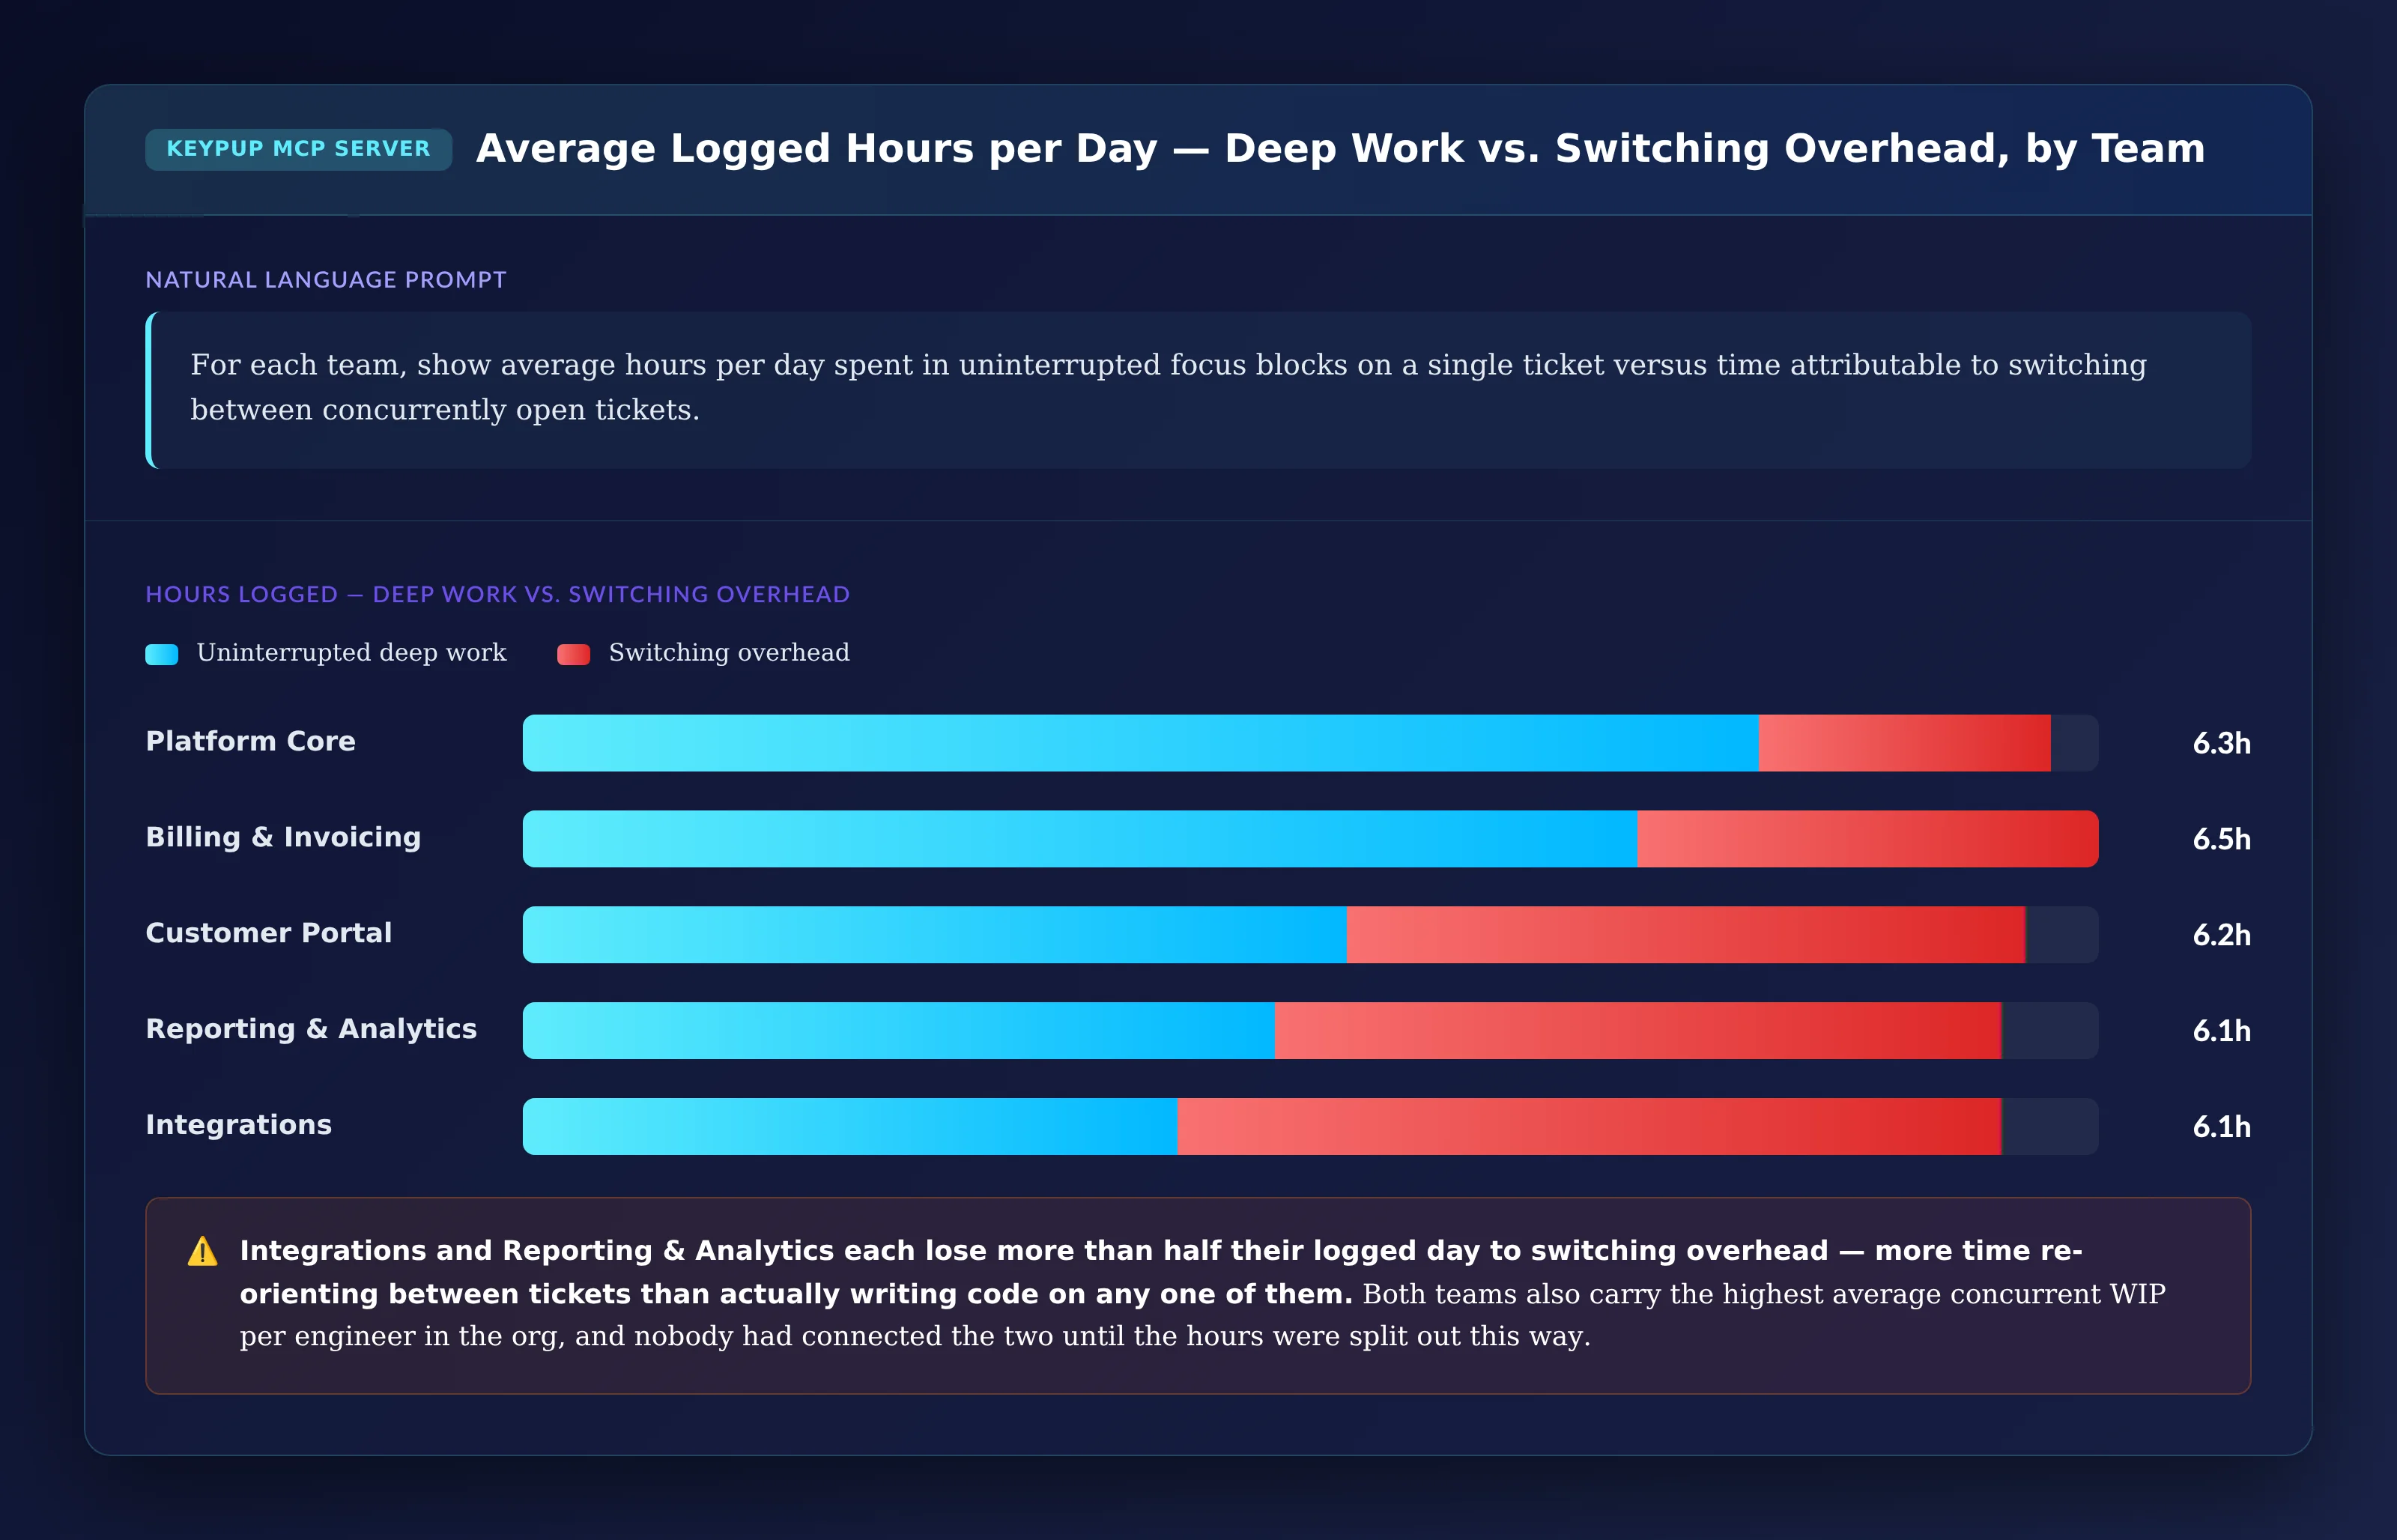
For each team, show average hours per day spent in uninterrupted
focus blocks on a single ticket versus time attributable to
switching between concurrently open tickets.
Output: Average Logged Hours per Day — Deep Work vs. Switching Overhead, by Team
Key Insight: Integrations and Reporting & Analytics each lose more than half their logged day to switching overhead — more time re-orienting between tickets than actually writing code on any one of them. Both teams also carry the highest average concurrent WIP per engineer in the org, and nobody had connected the two until the hours were split out this way.
4. Identifying the Most Fragmented Engineers Right Now
Aggregate team numbers are useful for strategy, but individual visibility is what prevents the next burnout conversation from being a surprise.
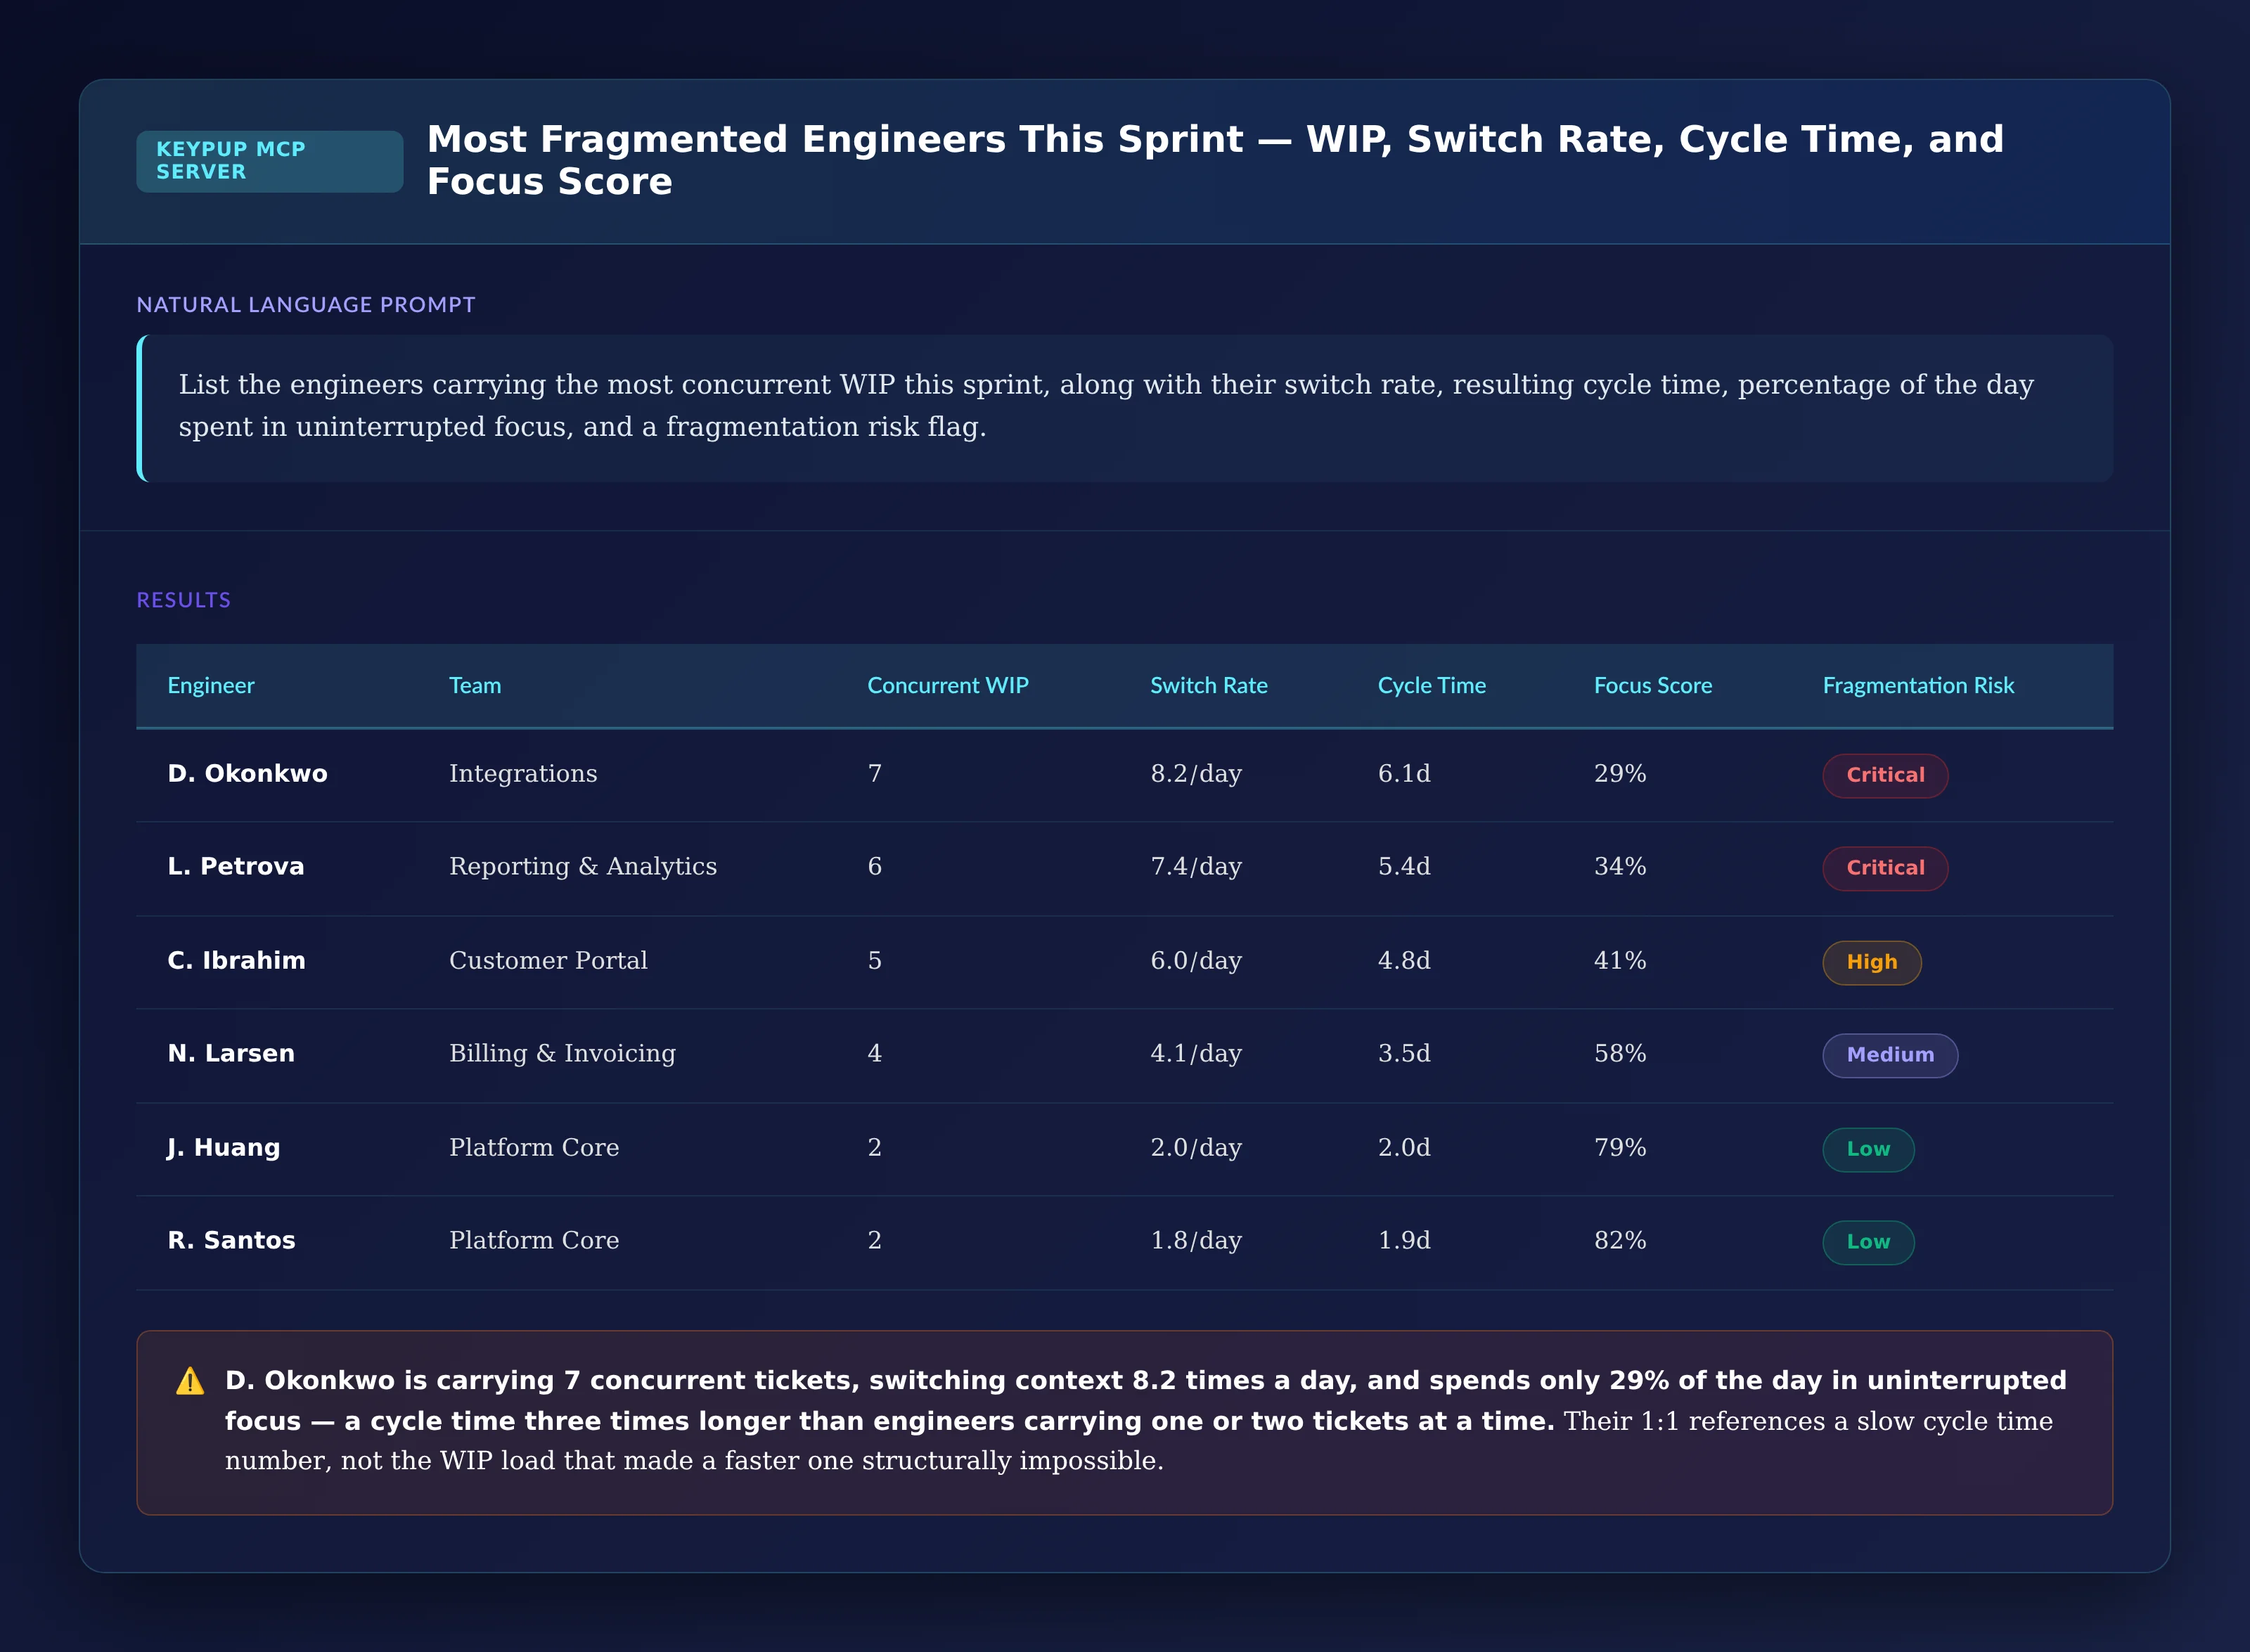
MCP Prompt:
List the engineers carrying the most concurrent WIP this sprint,
along with their switch rate, resulting cycle time, percentage of
the day spent in uninterrupted focus, and a fragmentation risk flag.
Output: Most Fragmented Engineers This Sprint — WIP, Switch Rate, Cycle Time, and Focus Score
Key Insight: D. Okonkwo is carrying 7 concurrent tickets, switching context 8.2 times a day, and spends only 29% of the day in uninterrupted focus — a cycle time three times longer than engineers carrying one or two tickets at a time. Their 1:1 references a slow cycle time number, not the WIP load that made a faster one structurally impossible.
5. Reconstructing Where a High-WIP Engineer's Day Actually Goes
For individuals already flagged as fragmented, leadership and the engineer both need a granular breakdown of the day, not just a single aggregate score.
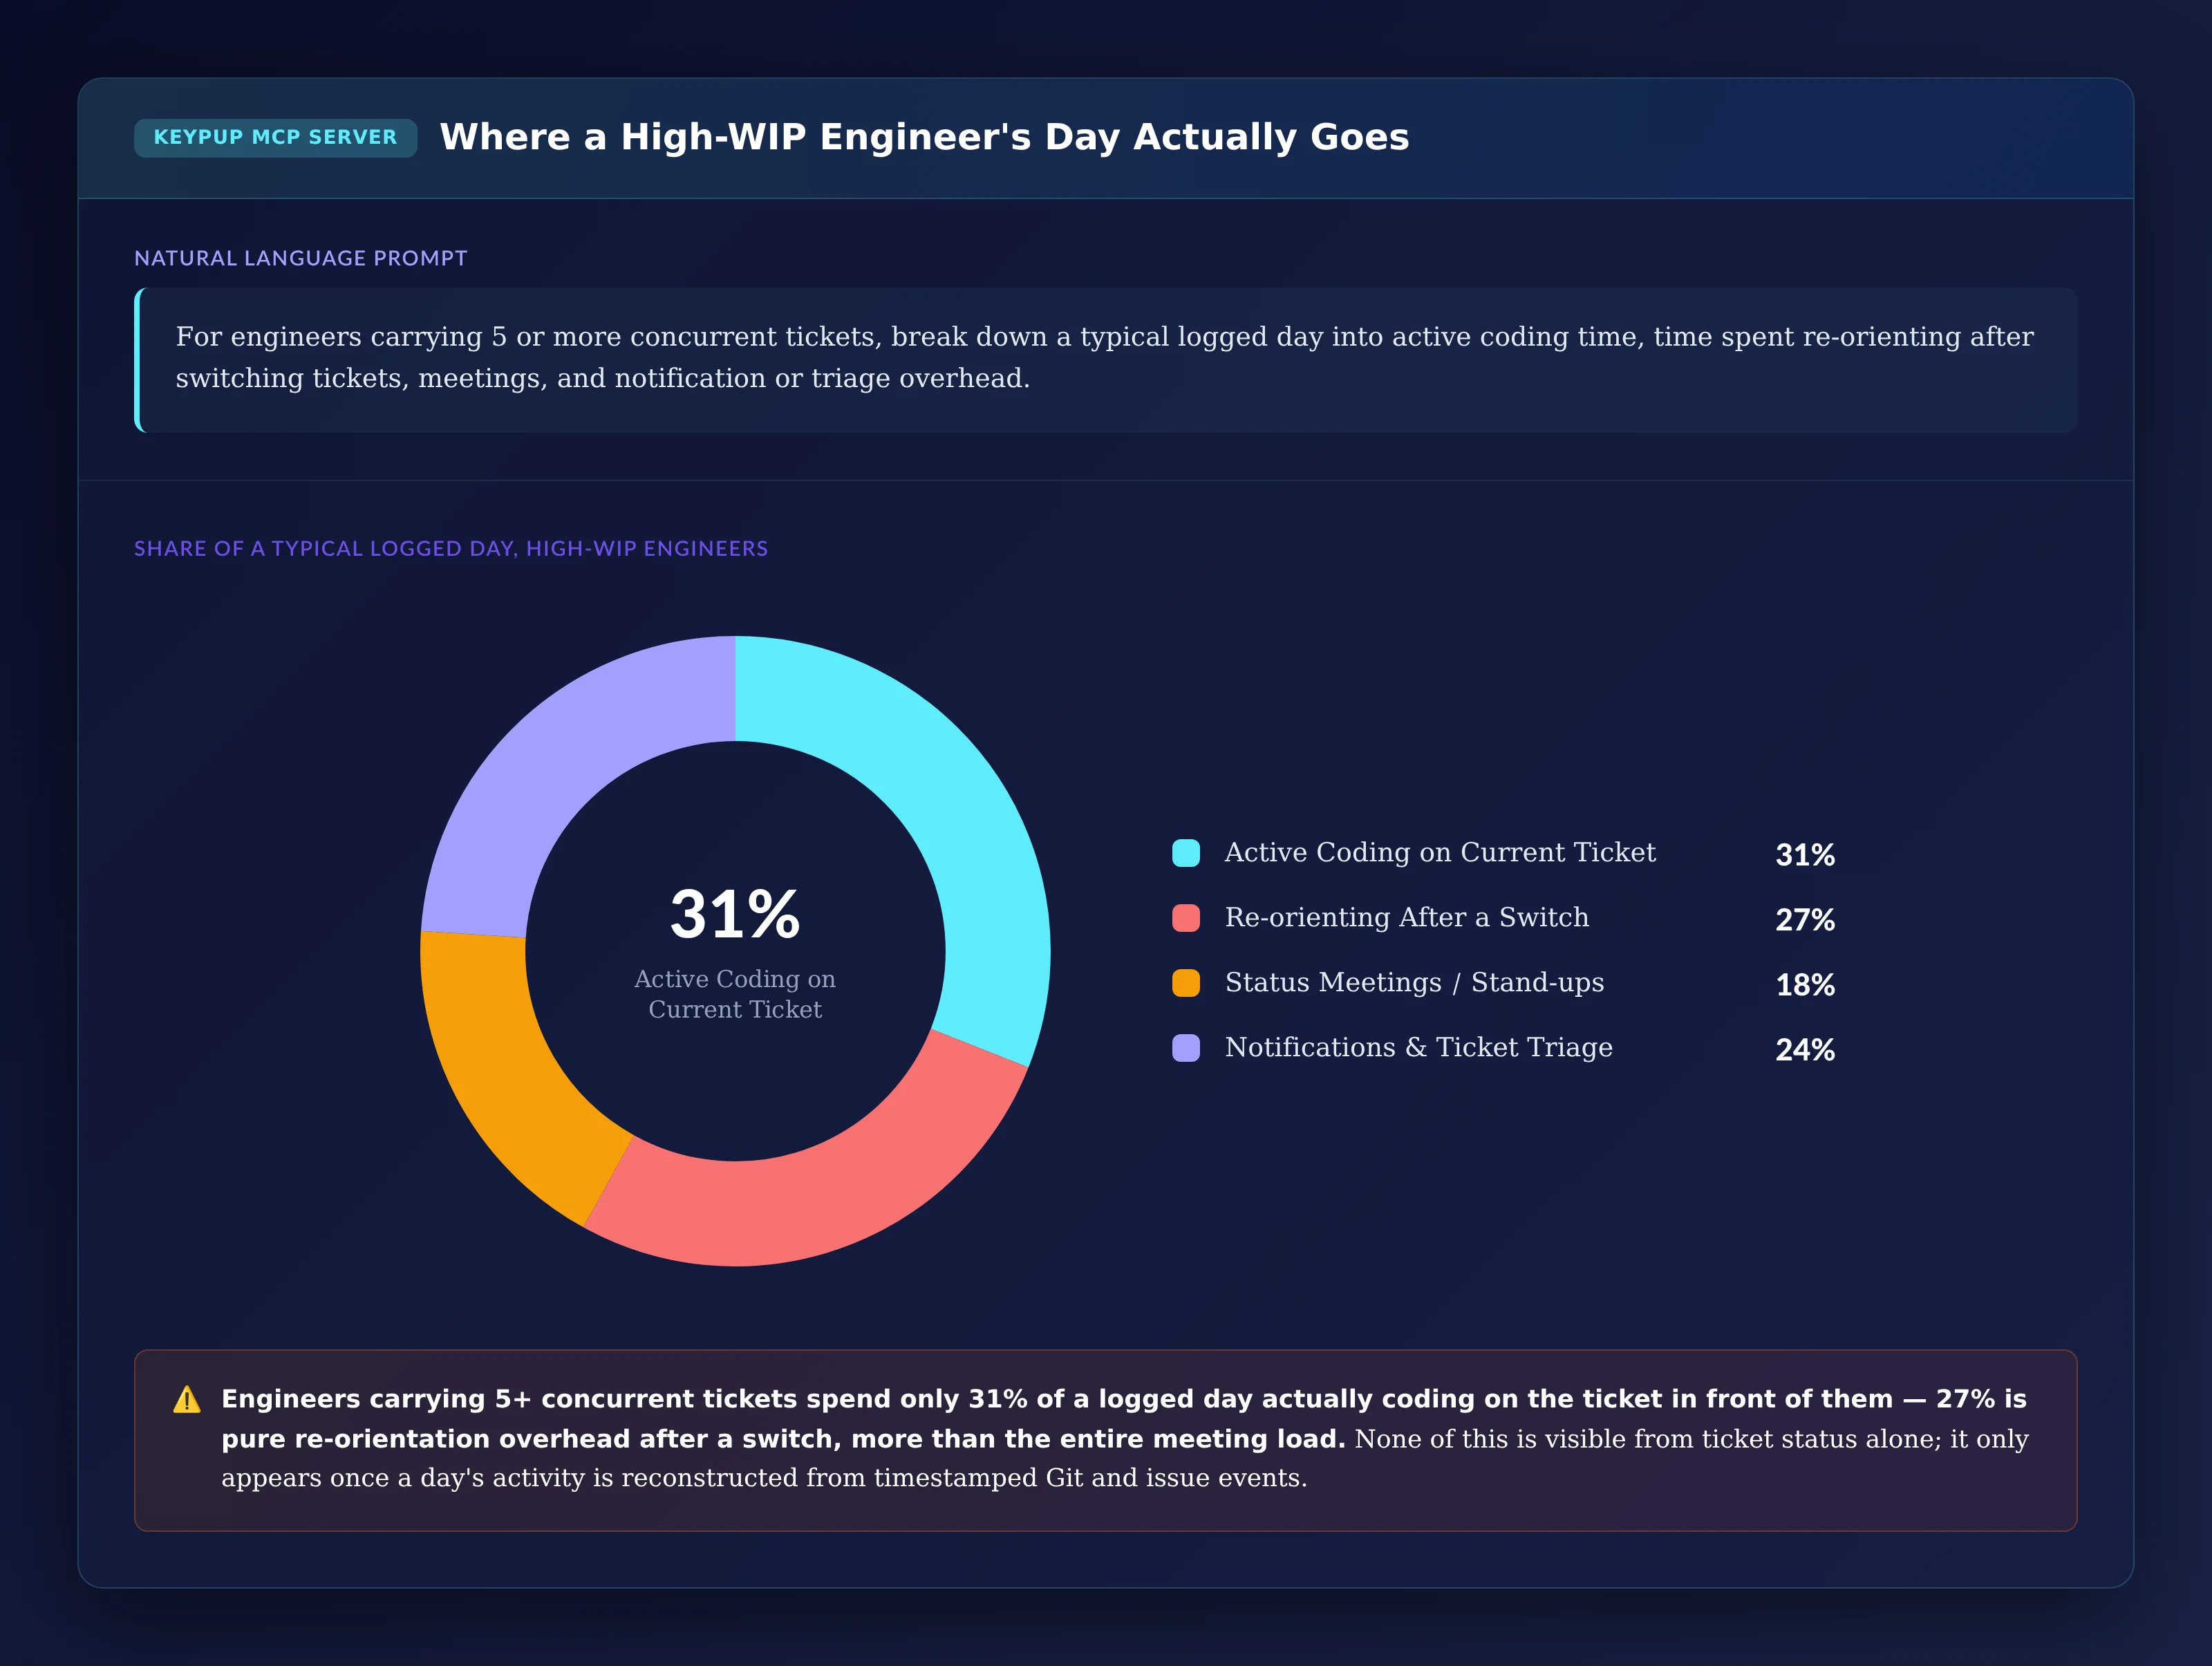
MCP Prompt:
For engineers carrying 5 or more concurrent tickets, break down
a typical logged day into active coding time, time spent
re-orienting after switching tickets, meetings, and notification
or triage overhead.
Output: Where a High-WIP Engineer's Day Actually Goes
Key Insight: Engineers carrying 5+ concurrent tickets spend only 31% of a logged day actually coding on the ticket in front of them — 27% is pure re-orientation overhead after a switch, more than the entire meeting load. None of this is visible from ticket status alone; it only appears once a day's activity is reconstructed from timestamped Git and issue events.
6. Scoring Every Team Against a Target WIP Limit
Finally, leadership needs a standing view of which teams have structurally exceeded a sustainable WIP limit, so enforcement becomes a policy decision instead of a one-off fire drill.
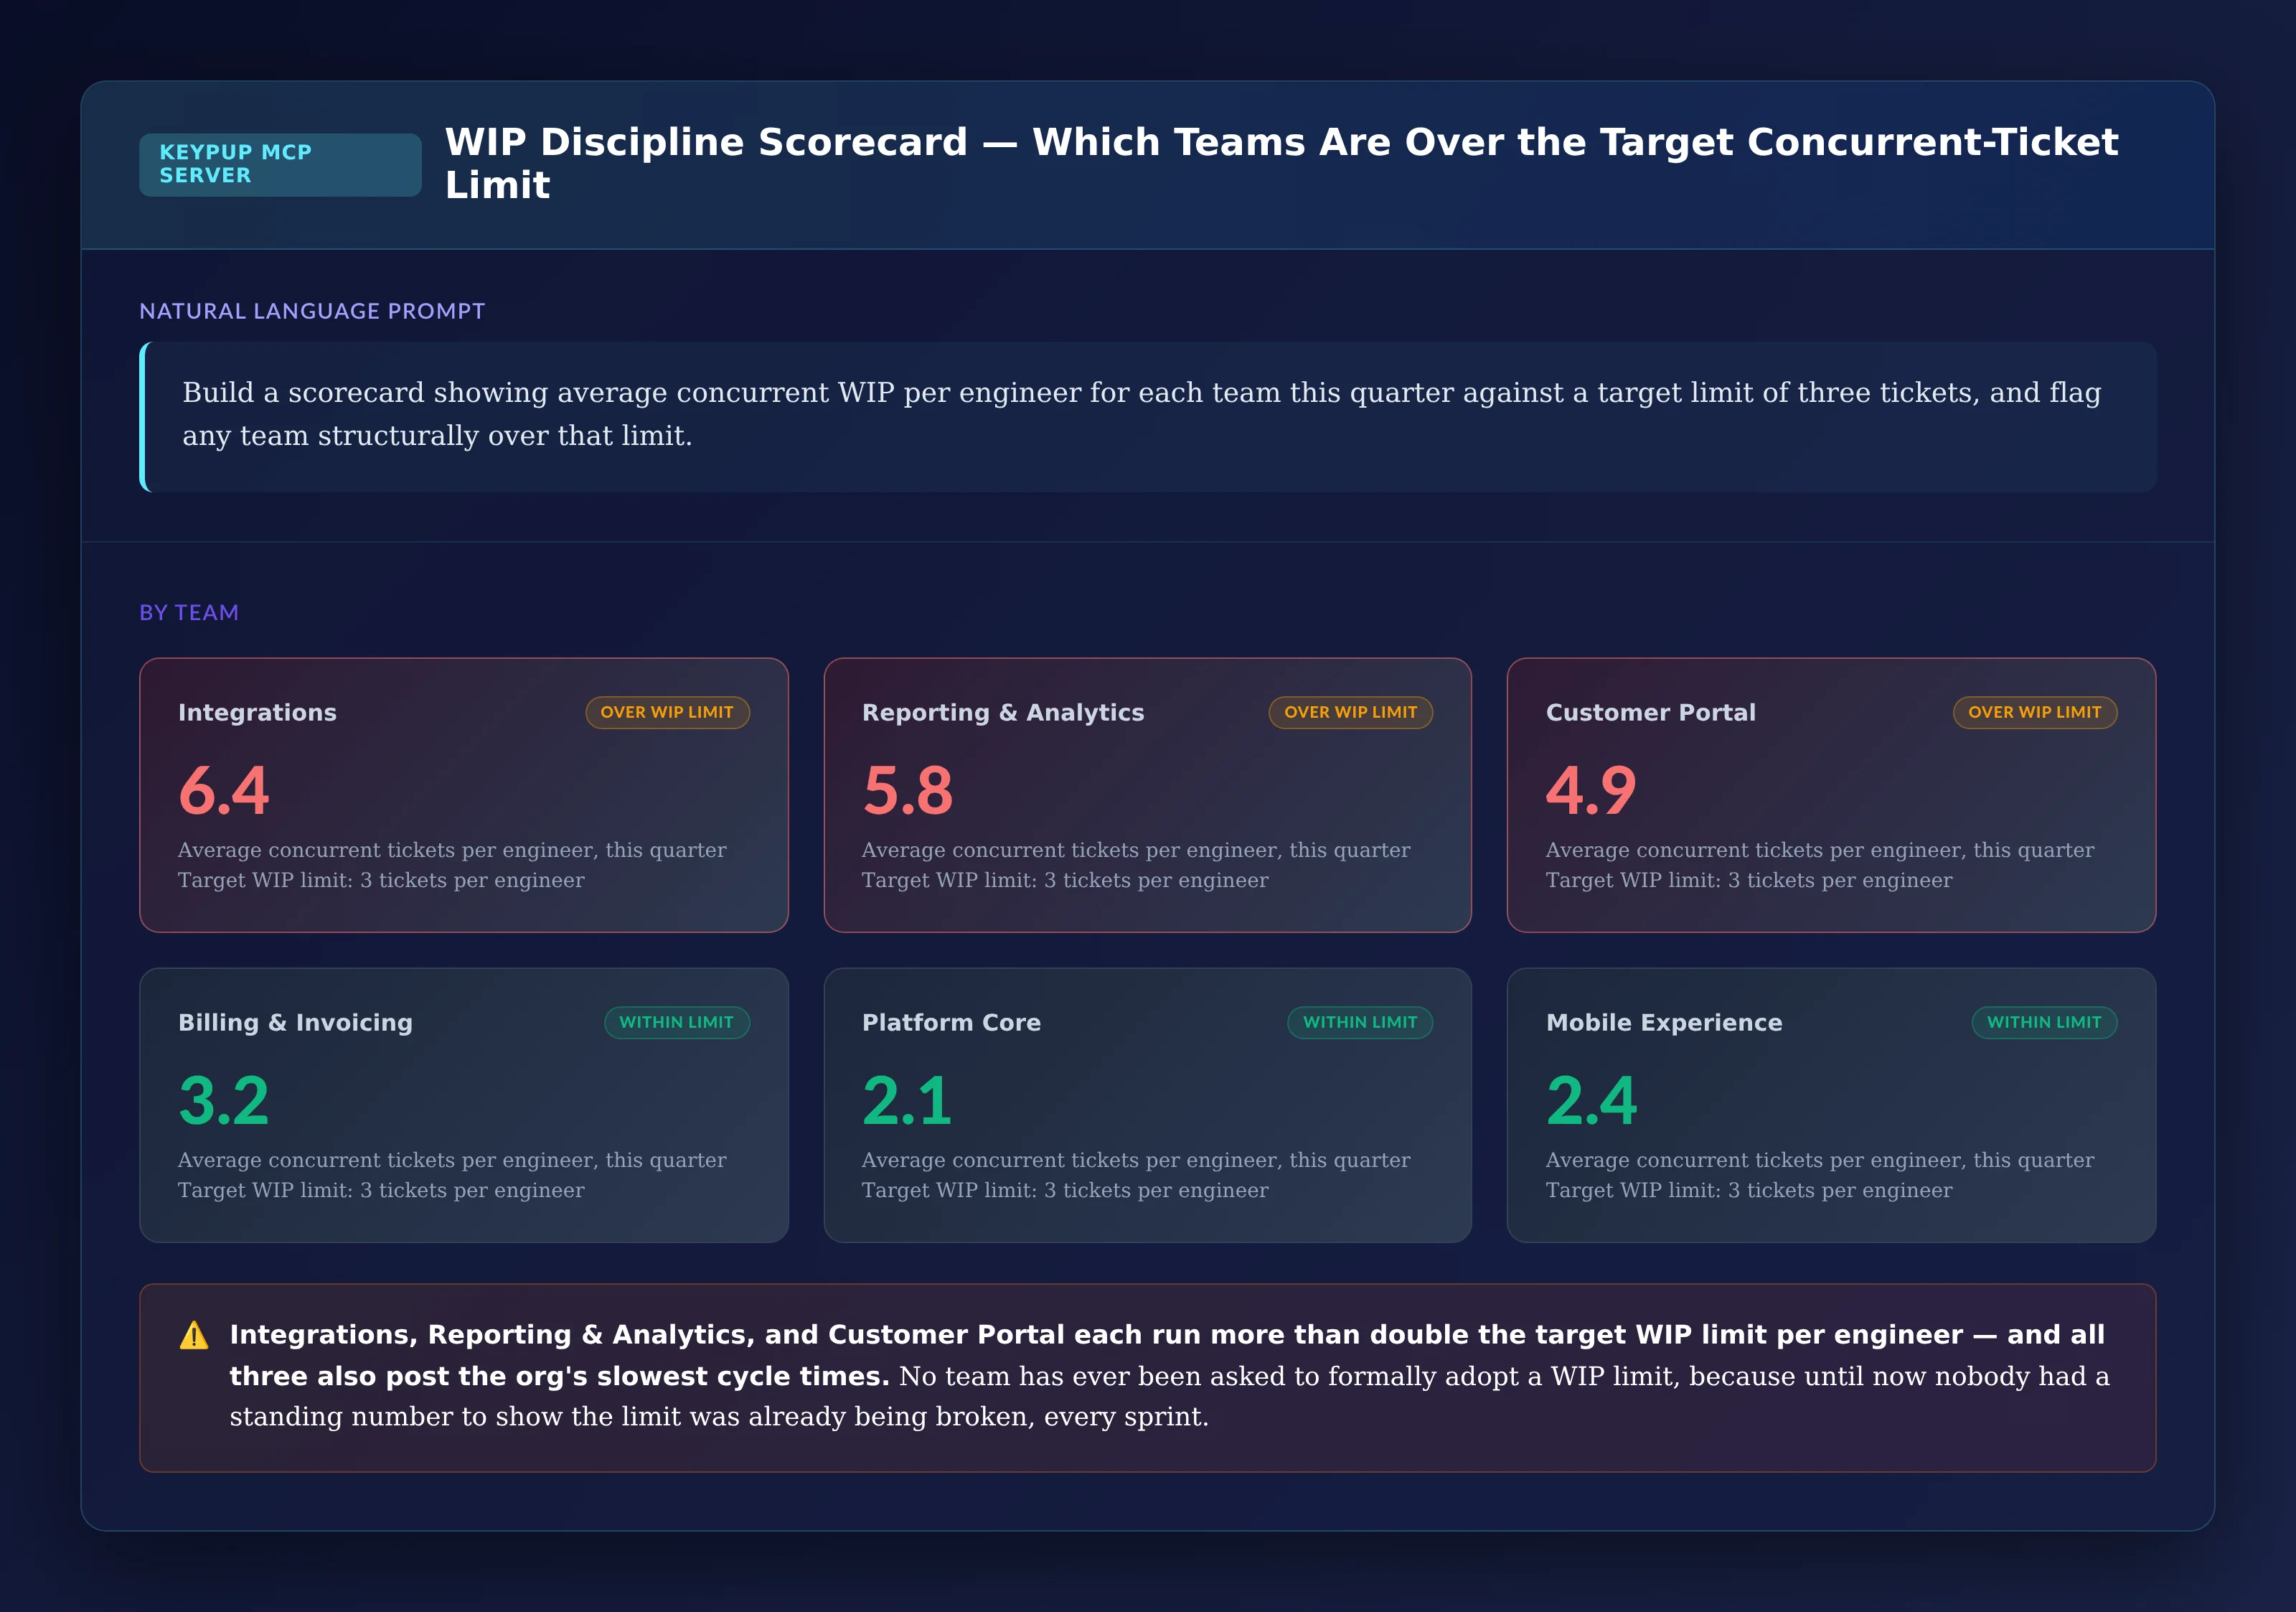
MCP Prompt:
Build a scorecard showing average concurrent WIP per engineer
for each team this quarter against a target limit of three
tickets, and flag any team structurally over that limit.
Output: WIP Discipline Scorecard — Which Teams Are Over the Target Concurrent-Ticket Limit
Key Insight: Integrations, Reporting & Analytics, and Customer Portal each run more than double the target WIP limit per engineer — and all three also post the org's slowest cycle times. No team has ever been asked to formally adopt a WIP limit, because until now nobody had a standing number to show the limit was already being broken, every sprint.
The Technical Implementation: How Keypup MCP Sees Concurrent WIP
Reconstructing Concurrent State From Timestamped Events, Not Point-in-Time Status
Keypup MCP doesn't rely on a ticket's current status column to determine whether work is active. It reconstructs, for every point in time, exactly how many tickets a given engineer had open simultaneously by correlating issue-tracker state transitions with Git commit and pull request activity — so "in progress" that actually means "parked for four days" is distinguishable from genuine active focus.
Attributing Re-Orientation Cost to the Switch, Not the Ticket
Rather than treating all elapsed time on a ticket as equally attributable to its own complexity, Keypup MCP identifies the time windows immediately following a switch back to a previously parked ticket, and attributes that re-orientation overhead to the switching pattern itself — so a ticket's inflated cycle time is correctly explained by the WIP load around it, not misread as unusually difficult work.
WIP-Aware Cycle Time Benchmarking
Because cycle time is only a meaningful signal when compared against similar conditions, Keypup MCP segments cycle time benchmarks by concurrent WIP band automatically, so leadership compares like-for-like — a focused engineer against other focused engineers, a fragmented one against the honest baseline their workload actually allows.
Real-World Impact: Enterprise Case Studies
Case Study 1: Enterprise Logistics and Supply Chain Platform
Before Keypup MCP:
Average cycle time across the Integrations team had risen 60% over three quarters, with leadership attributing the slowdown to "increasingly complex integration work"
No visibility into how many tickets any individual engineer actually had open at once, since the sprint board only showed ticket-level status, not engineer-level concurrent load
Engineers with the slowest individual cycle times were flagged in performance reviews without any context for their simultaneous ticket count
After Keypup MCP:
Concurrent WIP was isolated as the primary driver, showing cycle time tracked almost exactly with average tickets-open-per-engineer across eight sprints, independent of ticket complexity ratings
A hard WIP limit of three tickets per engineer was adopted for the Integrations team, with new ticket assignment blocked by the tracker once an engineer hit the limit
Median cycle time on the team dropped by 38% within one quarter, once engineers were structurally prevented from accumulating the concurrent load that had been driving the inflation
"We spent three quarters telling the Integrations team their work had gotten harder. The moment we overlaid concurrent WIP per engineer on the cycle-time chart, it was obvious the complexity story was wrong — it was a workload-concentration problem hiding behind a difficulty narrative. We adopted a WIP limit in one planning cycle once we finally had the number to justify it."
— VP Engineering, Enterprise Logistics and Supply Chain Platform
Case Study 2: Enterprise Financial Reporting Software Vendor
Before Keypup MCP:
The Reporting & Analytics team had the longest average cycle time in the engineering org for over a year, and was quietly viewed as the organization's slowest-moving team in quarterly reviews
Several senior engineers on that team reported feeling constantly busy but rarely able to point to recent shipped work, with no operational data to explain the disconnect
Nobody had connected the team's ticket assignment practices — which routinely handed engineers four or five tickets at once "to keep options open" — to either the cycle time or the stalled-progress feeling
After Keypup MCP:
Concurrent WIP and switching overhead were correlated directly to individual cycle time and self-reported stalled progress, showing the engineers with the most "constantly busy, nothing shipped" feedback were also carrying the highest simultaneous ticket counts
Ticket assignment practice was changed to a pull-based model, where engineers only picked up a new ticket once a prior one was closed, rather than being pre-assigned a queue
Switching overhead dropped from over half the logged day to under a quarter within one quarter, and the team's cycle time improved to match the org average for the first time in over a year
"We'd been treating this as a motivation or focus problem for a year. It was actually a workload-concentration problem we had built directly into our own ticket assignment process. Once we could show the team the exact share of their day lost to switching overhead, moving to a pull-based assignment model took one conversation instead of another four quarters of the same story."
— Director of Engineering, Enterprise Financial Reporting Software Vendor
Implementation: Getting Started with Keypup MCP
1. Connect Your Issue Tracker and Git Activity Together
Concurrent-WIP reconstruction only works once Keypup MCP can see issue state transitions and Git commit activity on the same timeline — connect your existing issue-tracker and Git integrations so engineer-level activity can be correlated event by event.
2. Stop Reporting Cycle Time as a Single, Undifferentiated Number
Report cycle time segmented by concurrent WIP band for every engineer, so a fragmented, over-committed week never gets misread as a sudden drop in skill or a run of unusually difficult tickets.
3. Query in Natural Language, Per Engineer or Per Team
No manual spreadsheet reconciliation between ticket assignment history and commit logs required. Just ask:
"How much of this engineer's slow cycle time is explained by concurrent WIP versus genuine complexity?"
"Which team has the highest average concurrent tickets per engineer this quarter?"
"Show me switching overhead as a share of the day for anyone flagged as fragmentation risk"
"Is our rising cycle time correlated with rising context-switch rate?"
4. Automate Recurring Root-Cause Reporting
Schedule recurring queries for:
Quarterly cycle time benchmarking segmented by concurrent WIP band, by team and by individual
Most-fragmented engineer tracking per sprint, with an automatic WIP-overload risk flag
Context-switch rate versus cycle-time trend lines, ahead of every planning retro
Standing WIP discipline scorecards ahead of workload-policy and staffing conversations
The Bottom Line: Flow Needs a WIP Limit, and a WIP Limit Needs a Number
A cycle-time model that only measures elapsed time per ticket will always misattribute the cost of concurrent WIP to "difficulty" or "skill" — not occasionally, but every single sprint, in every enterprise that assigns tickets without a hard concurrency limit. Fixing it requires:
✅ Reconstructing concurrent WIP per engineer from timestamped Git and issue-tracker events, not point-in-time status columns ✅ Correlating switch rate and concurrent WIP directly against cycle time, so the slowdown reads as structural, not anecdotal ✅ Attributing re-orientation overhead to the switch itself, not leaving it folded invisibly into a ticket's total elapsed time ✅ Flagging fragmentation risk from WIP count and focus score, before it shows up as a stalled-progress conversation instead ✅ Maintaining a standing WIP discipline scorecard, to justify and enforce concurrency limits where the data actually points
The Keypup MCP Server turns "why is everything taking longer" from a recurring complexity-blame exercise into a precise answer — concurrent WIP, switching overhead, or both — giving engineering leaders the data to fix the actual bottleneck instead of asking already-overloaded engineers to simply focus better.
Frequently Asked Questions (FAQ)
Q: Isn't a high ticket count just a sign that an engineer is trusted and in demand?
A: It can look that way on a dashboard, but the data consistently shows the opposite effect on output: once concurrent WIP crosses a threshold, total throughput per ticket falls even as the raw count of assigned tickets rises. Keypup MCP separates the appearance of being in demand from the measurable cost of fragmented focus.
Q: How is this different from just looking at story points per sprint?
A: Story points measure planned output; they say nothing about how many tickets were open simultaneously while that output was produced. Keypup MCP reconstructs concurrent WIP from event timestamps, which is a different axis entirely — and the one that actually explains cycle-time inflation.
Q: Will enforcing a WIP limit slow down urgent, unplanned work?
A: A WIP limit doesn't block urgent work; it forces an explicit trade-off decision — pause ticket X to start ticket Y — instead of silently stacking tickets on top of each other with no visibility into the accumulating cost. Keypup MCP makes that trade-off visible so it can be a deliberate choice, not a default.
Q: Does this require developers to manually log which ticket they're "really" working on?
A: No. Keypup MCP reconstructs concurrent WIP and switching patterns from existing Git commit and issue-tracker timestamps your teams already generate — no new manual tracking, time logging, or extra process required.
Q: Is this only useful for very large engineering organizations?
A: Any team assigning more than one or two tickets per engineer at a time can benefit from visibility into the resulting cycle-time cost. The effect scales with team size and ticket volume, but the underlying mechanism — attention split across concurrent work — applies at every scale.
Get Started
Ready to stop measuring cycle time with a number that's silently hiding your entire context-switching load?
Start Free Trial — Connect your engineering stack in minutes and start separating focused work from switching overhead.
Request Demo — See how enterprise engineering leaders use Keypup MCP to quantify and fix the context-switching tax.
View MCP Documentation — Technical details for engineering teams implementing Keypup MCP across Git and issue-tracker data.
Keywords: context-switching tax, concurrent WIP per engineer, cycle time inflation, work in progress limits, ticket fragmentation risk, developer focus metrics, DORA metrics cycle time, MCP server workload tracking, enterprise flow efficiency, kanban WIP limits engineering
Ready to Transform Your Analytics?
Join teams already using AI to make data-driven decisions faster than
ever.
Sprint commitment accuracy is collapsing across enterprise engineering orgs, and nobody can explain why. Discover the hidden on-call interrupt tax draining planned capacity, what engineers on Reddit are saying about it, and how Keypup MCP makes the unplanned work finally visible.
Your AI coding assistant bill is easy to read. How your engineers actually use those tools is not. Discover Keypup's AI Usage dataset and AI Usage & Monitoring Dashboard, what engineers on Reddit are saying about AI adoption metrics, and how to query AI usage in plain English through the Keypup MCP Server.
Every enterprise SDLC has issues that span two or more teams — and every one of them quietly loses days waiting on an API contract, a review, or a shared environment slot that no single team's dashboard ever shows as blocked. Discover how Keypup MCP measures the hidden cross-team dependency tax, names the teams causing the most downstream drag, and turns "why does this always take longer than it should" into a precise, fundable staffing conversation.