The On-Call Interrupt Tax: How Production Incidents Quietly Cannibalize Sprint Commitments
Sprint commitment accuracy is collapsing across enterprise engineering orgs, and nobody can explain why. Discover the hidden on-call interrupt tax draining planned capacity, what engineers on Reddit are saying about it, and how Keypup MCP makes the unplanned work finally visible.
TL;DR: Engineers on an active on-call rotation routinely lose 30-45% of their logged hours to production incidents, escalations, and pages — time that sprint planning never accounts for because it isn't tracked against the same capacity model as committed work. The result is a slow, invisible collapse in sprint commitment accuracy that gets blamed on "bad estimation" every retro, while the real driver — a rising interrupt load — never shows up in a single dashboard. The Keypup MCP Server decomposes logged hours into planned work and on-call interrupt time, ranks which teams and individuals carry the heaviest interrupt tax, and tracks the direct correlation between interrupt volume and commitment accuracy — turning a recurring "we keep missing our sprint goals" mystery into a precise, fundable staffing and reliability conversation.
Ask an engineering leader why sprint commitment accuracy has been sliding for two quarters straight, and you'll usually get a story about "estimation discipline" or "scope creep." Ask the engineer who was paged eleven times last rotation why they only shipped 40% of what they committed to, and you'll get a very different, much more specific story — one that almost never makes it into the retro, because nothing in the sprint tooling tracks it.
The Friction: A Fixed Capacity Model Applied to a Rotating, Unpredictable Workload
Sprint planning assumes a roughly fixed amount of available capacity per engineer per week. On-call rotations violate that assumption completely, and almost no planning process adjusts for it.
Sprint boards only track committed tickets, not interrupts. A production incident, a customer escalation call, or an unplanned hotfix rarely gets its own ticket in the sprint — it gets handled in Slack, PagerDuty, or a war-room call, and then the engineer quietly returns to a sprint board that still expects the same output.
Capacity planning uses the same number for every rotation week. Whether an engineer is off-rotation or carrying the pager, sprint planning tools typically allocate the same story-point capacity, because nothing in the system distinguishes "a normal week" from "a week with 14 pages."
Interrupt time is logged inconsistently, if at all. Some teams tag incident tickets; most don't bother, because the goal in the moment is resolving the outage, not maintaining clean time-tracking data for a retro three weeks later.
The engineer absorbs 100% of the performance narrative. When sprint commitment comes in at 41%, that number ends up in the 1:1 and sometimes the performance review — not the 23 pages that made hitting 100% structurally impossible that week.
The result: the engineers carrying the heaviest interrupt load look like the weakest sprint performers on paper, while the actual driver of missed commitments — a rotation schedule with no capacity adjustment — stays completely invisible to the people making staffing and performance decisions.
Why This Matters: The Metric Everyone Trusts Is Measuring the Wrong Denominator
The Misdiagnosis Problem
When commitment accuracy drops, the reflexive question is "why are we estimating so badly?" But if the same engineers who were on-call also have the lowest completion rates, the honest answer isn't estimation — it's that a meaningful share of their week was never actually available for sprint work in the first place, and nobody adjusted the denominator.
The Burnout-Blind-Spot Problem
Without visibility into interrupt load per engineer, there's no early warning system for who is quietly approaching burnout. The engineer with 23 pages this rotation and a 41% commitment rate looks like a performance problem on a dashboard, when the data that actually matters — the interrupt hours — was never captured anywhere leadership looks.
The Reliability Investment Problem
When nobody can quantify how much engineering capacity production incidents are consuming, it's impossible to build a credible business case for the reliability investment — better alerting, runbooks, auto-remediation — that would actually reduce the interrupt load at its source. The cost stays diffuse, anecdotal, and perpetually deprioritized against features with a visible ROI.
The Enterprise Discussion: What Engineers Are Actually Saying
This exact frustration is one of the most consistent, most upvoted themes wherever engineers at large organizations compare notes on sprint planning, on-call, and burnout.
Senior SRE, Enterprise SaaS (r/ExperiencedDevs)
"Every sprint retro is the same conversation: 'why didn't you finish your commitments.' Nobody ever asks how many times I got paged. I was on-call for one week this sprint and got interrupted eleven times for things that had nothing to do with my actual tickets. My velocity number doesn't know the difference between 'didn't try hard enough' and 'spent 20 hours firefighting.'"
Staff Engineer, Fintech Infrastructure (r/devops)
"We rotate on-call across six engineers and capacity planning treats every week identically. The on-call week is objectively a worse week for shipping committed work — everyone on the team knows it — but the sprint board doesn't have a concept of 'this person was interrupted 40% of their week.' So commitment accuracy just looks bad, forever, for whoever drew the short straw that sprint."
The pattern holds: engineers already know exactly how much of their week disappears into interrupts — what's missing is a number that turns that lived, unmeasured experience into a staffing and reliability-investment decision leadership will actually act on.
How Keypup MCP Solves the On-Call Interrupt Tax
The Keypup Model Context Protocol (MCP) Server treats on-call interrupt time as its own first-class category of logged work — decomposing capacity into planned sprint hours and interrupt hours, tracking which teams and individuals carry the heaviest load, and correlating interrupt volume directly against commitment accuracy, all through natural-language prompts against your existing Git, issue-tracker, and incident data.
1. Decomposing Sprint Capacity Into Planned Work vs. On-Call Interrupts
Before anything else, leadership needs to see how much of a rotation engineer's week is actually available for committed work, versus consumed by interrupts.
MCP Prompt:
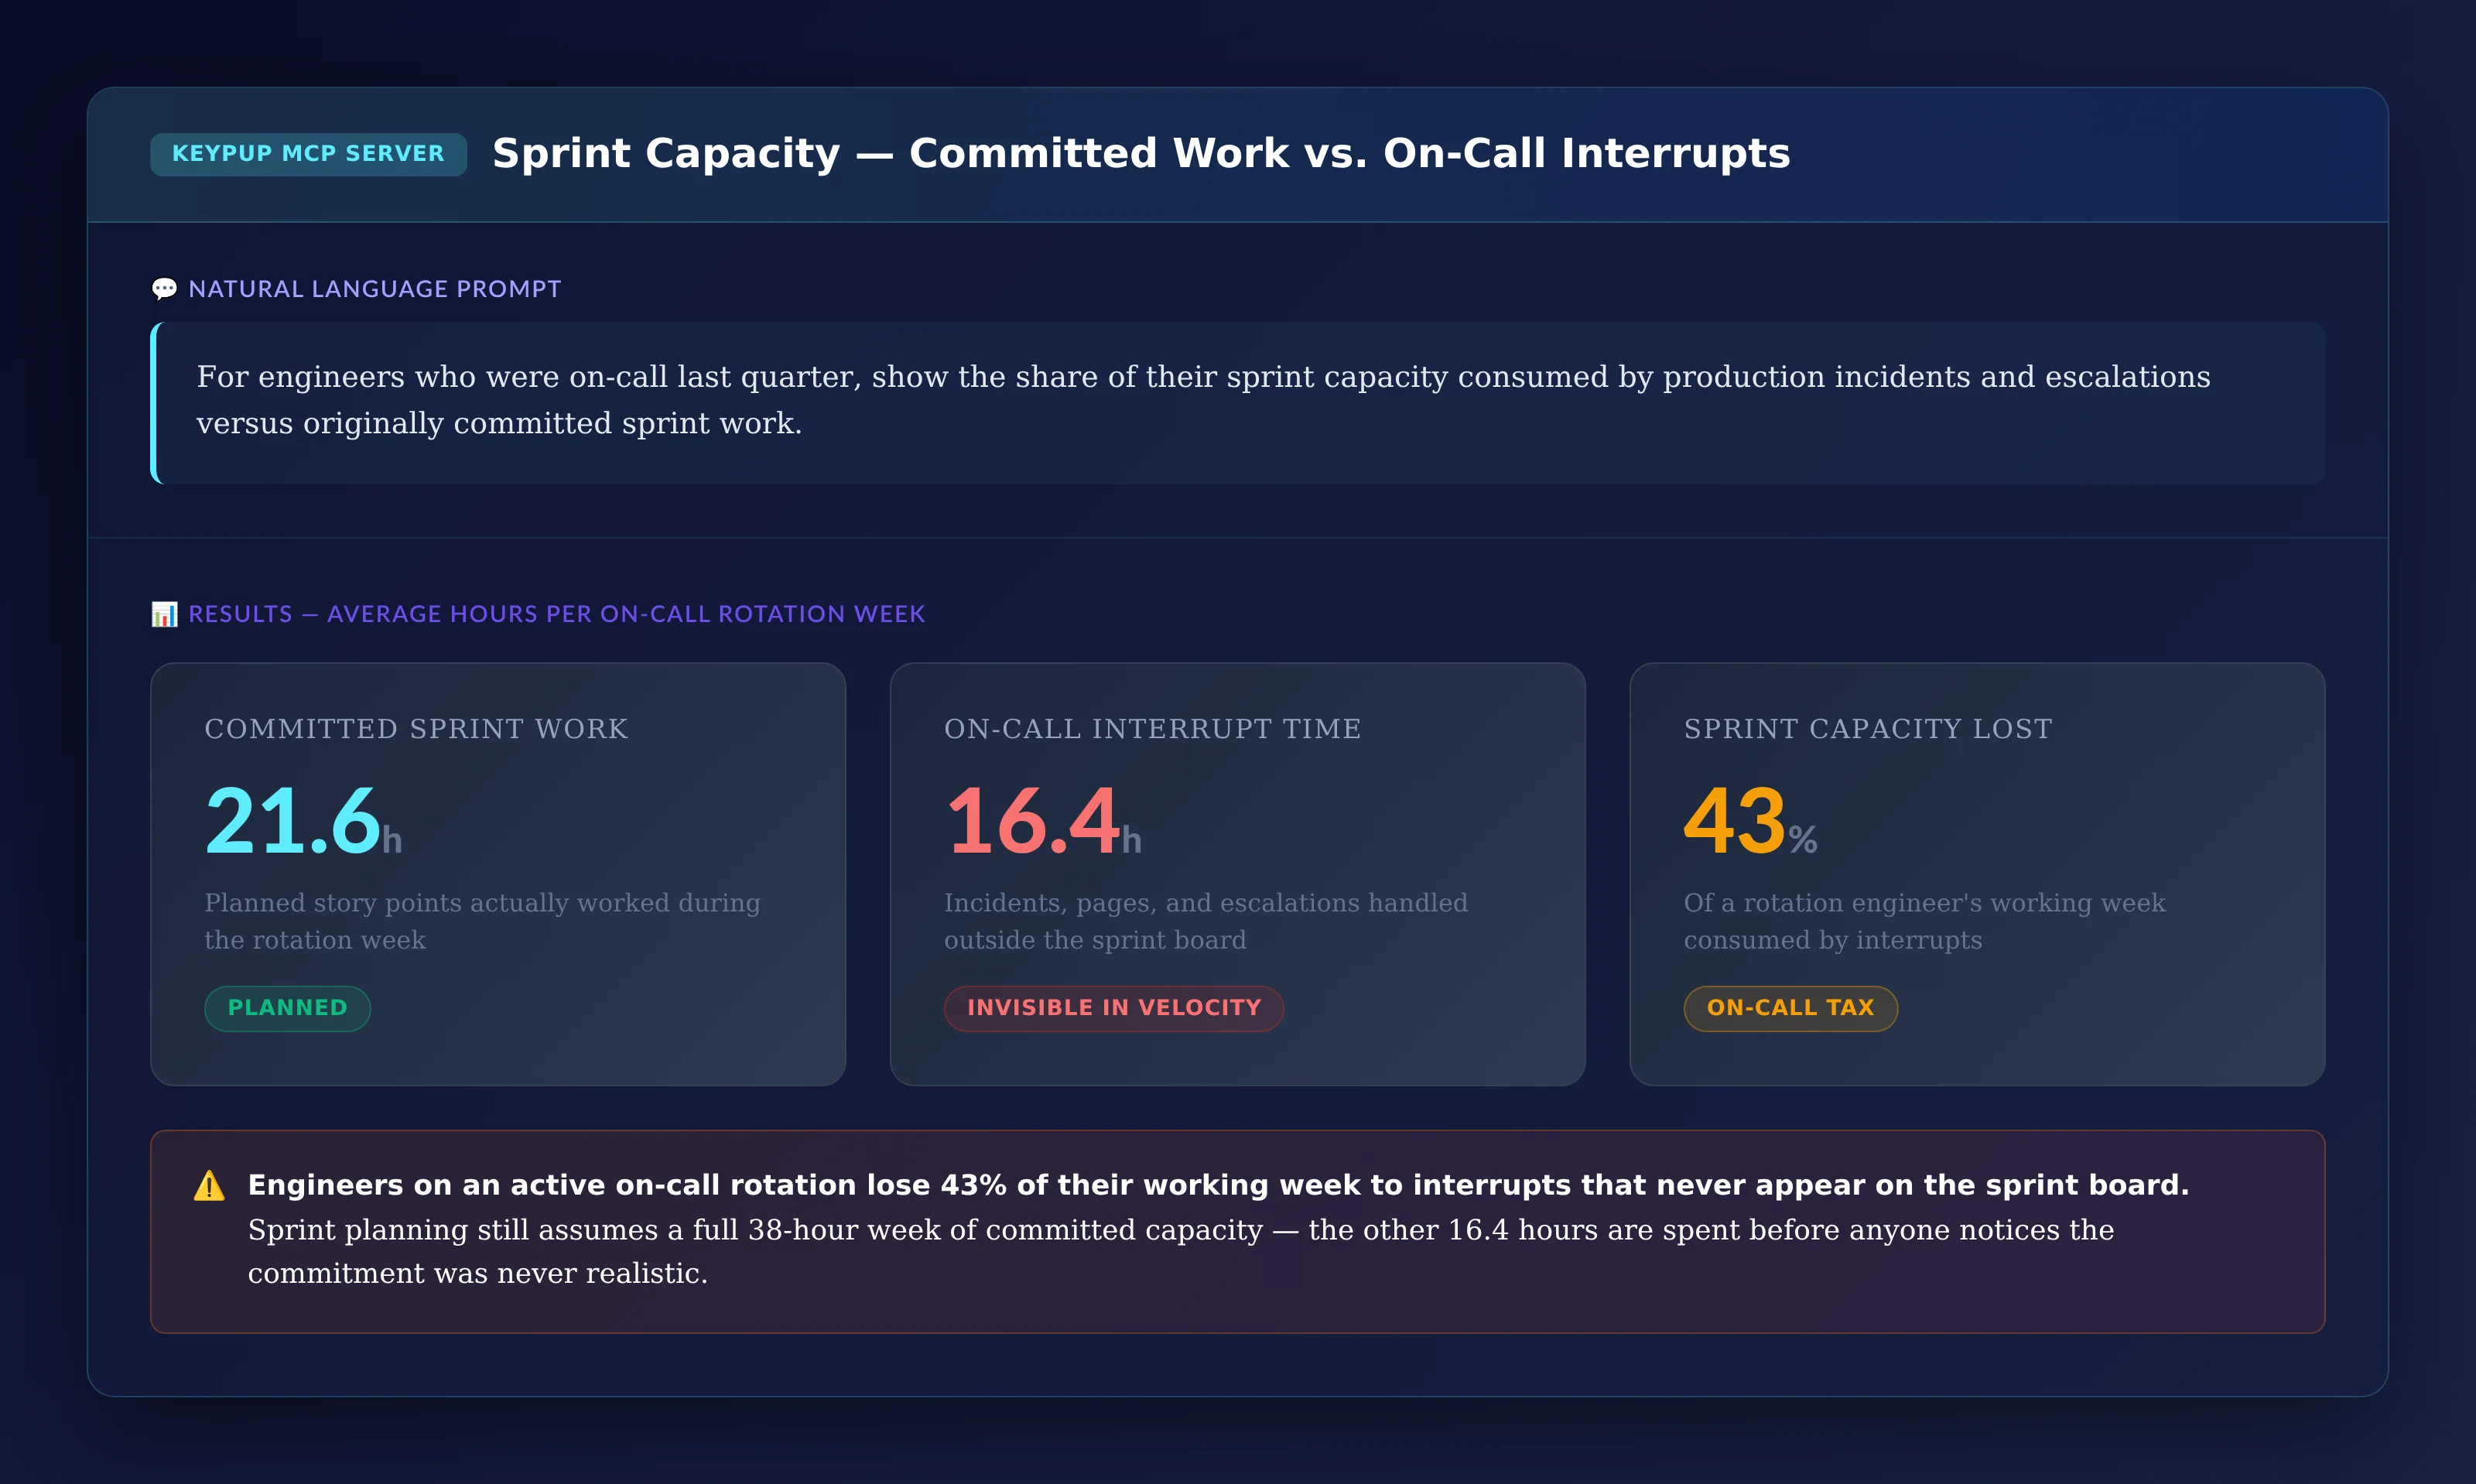
For engineers who were on-call last quarter, show the share of their
sprint capacity consumed by production incidents and escalations
versus originally committed sprint work.
Output: Sprint Capacity — Committed Work vs. On-Call Interrupts
Key Insight: Engineers on an active on-call rotation lose 43% of their working week to interrupts that never appear on the sprint board. Sprint planning still assumes a full 38-hour week of committed capacity — the other 16.4 hours are spent before anyone notices the commitment was never realistic.
2. Breaking Down What the Interrupt Time Is Actually Spent On
Once interrupt time is visible as its own category, the next question is what kind of work is generating most of it.
MCP Prompt:
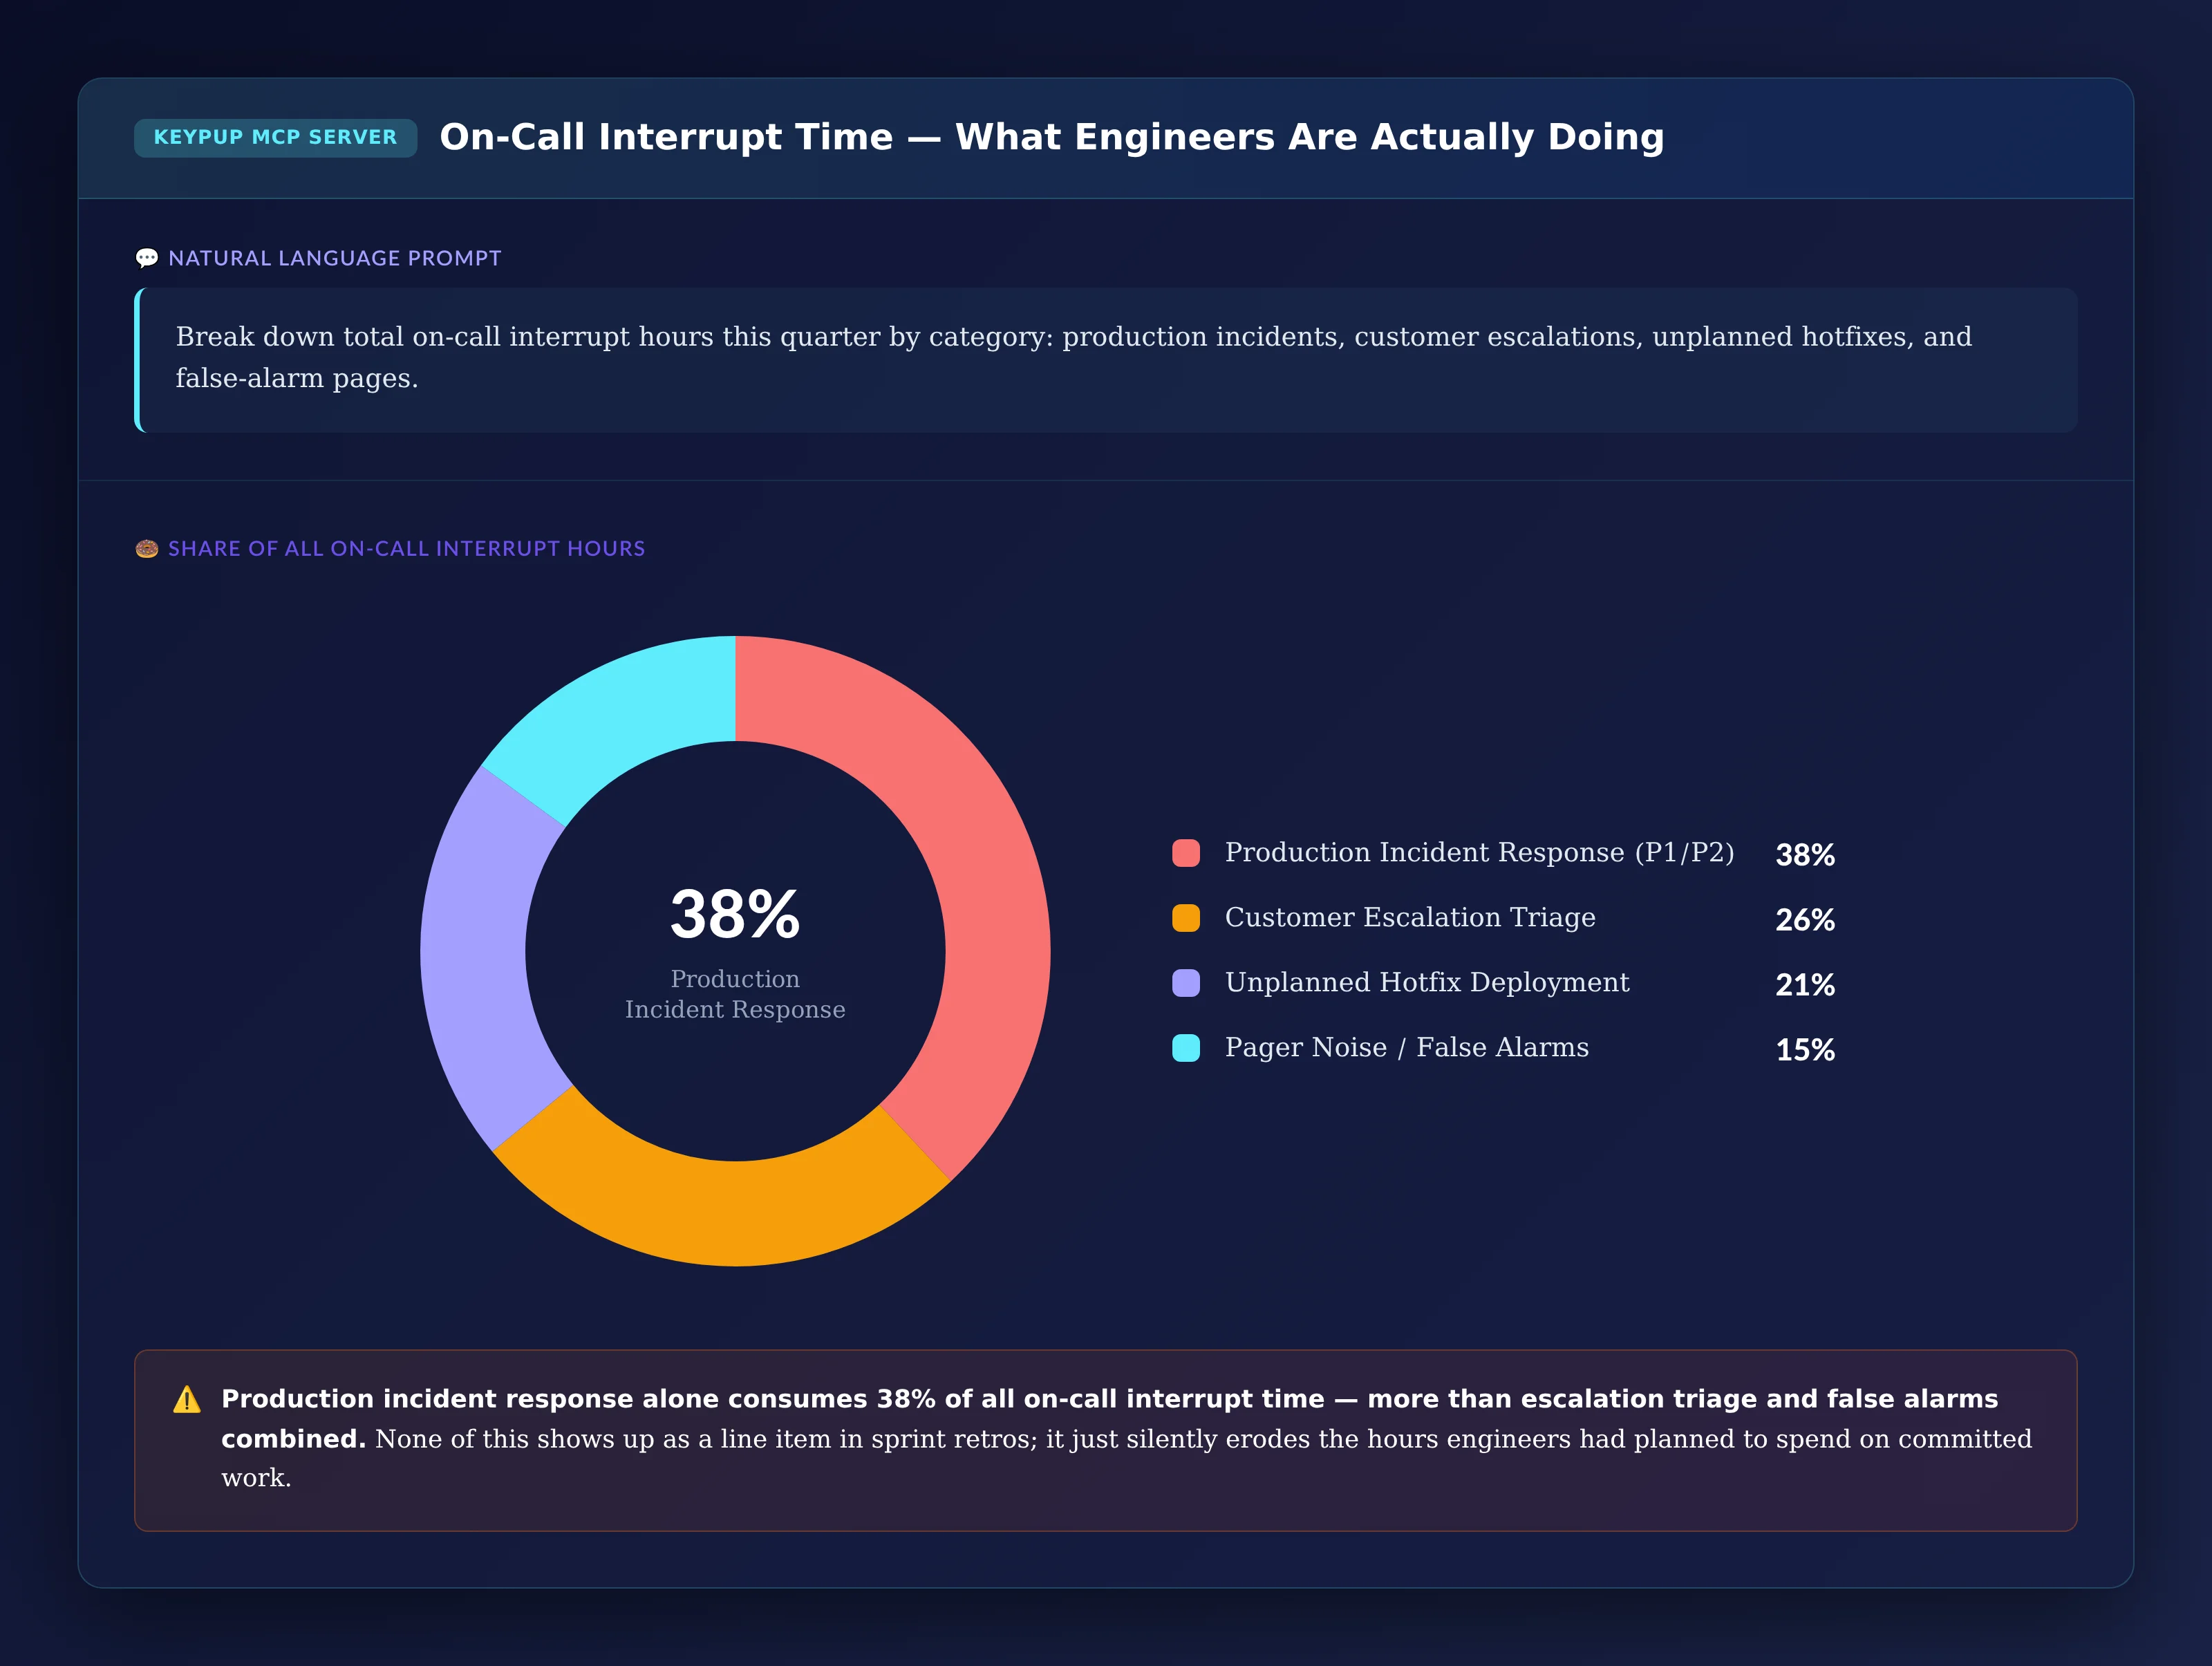
Break down total on-call interrupt hours this quarter by category:
production incidents, customer escalations, unplanned hotfixes, and
false-alarm pages.
Output: On-Call Interrupt Time — What Engineers Are Actually Doing
Key Insight: Production incident response alone consumes 38% of all on-call interrupt time — more than escalation triage and false alarms combined. None of this shows up as a line item in sprint retros; it just silently erodes the hours engineers had planned to spend on committed work.
3. Ranking Teams by Planned vs. Interrupt Hours
With the interrupt categories established, leadership needs to know exactly which teams are absorbing the most unplanned work in absolute hours.
MCP Prompt:
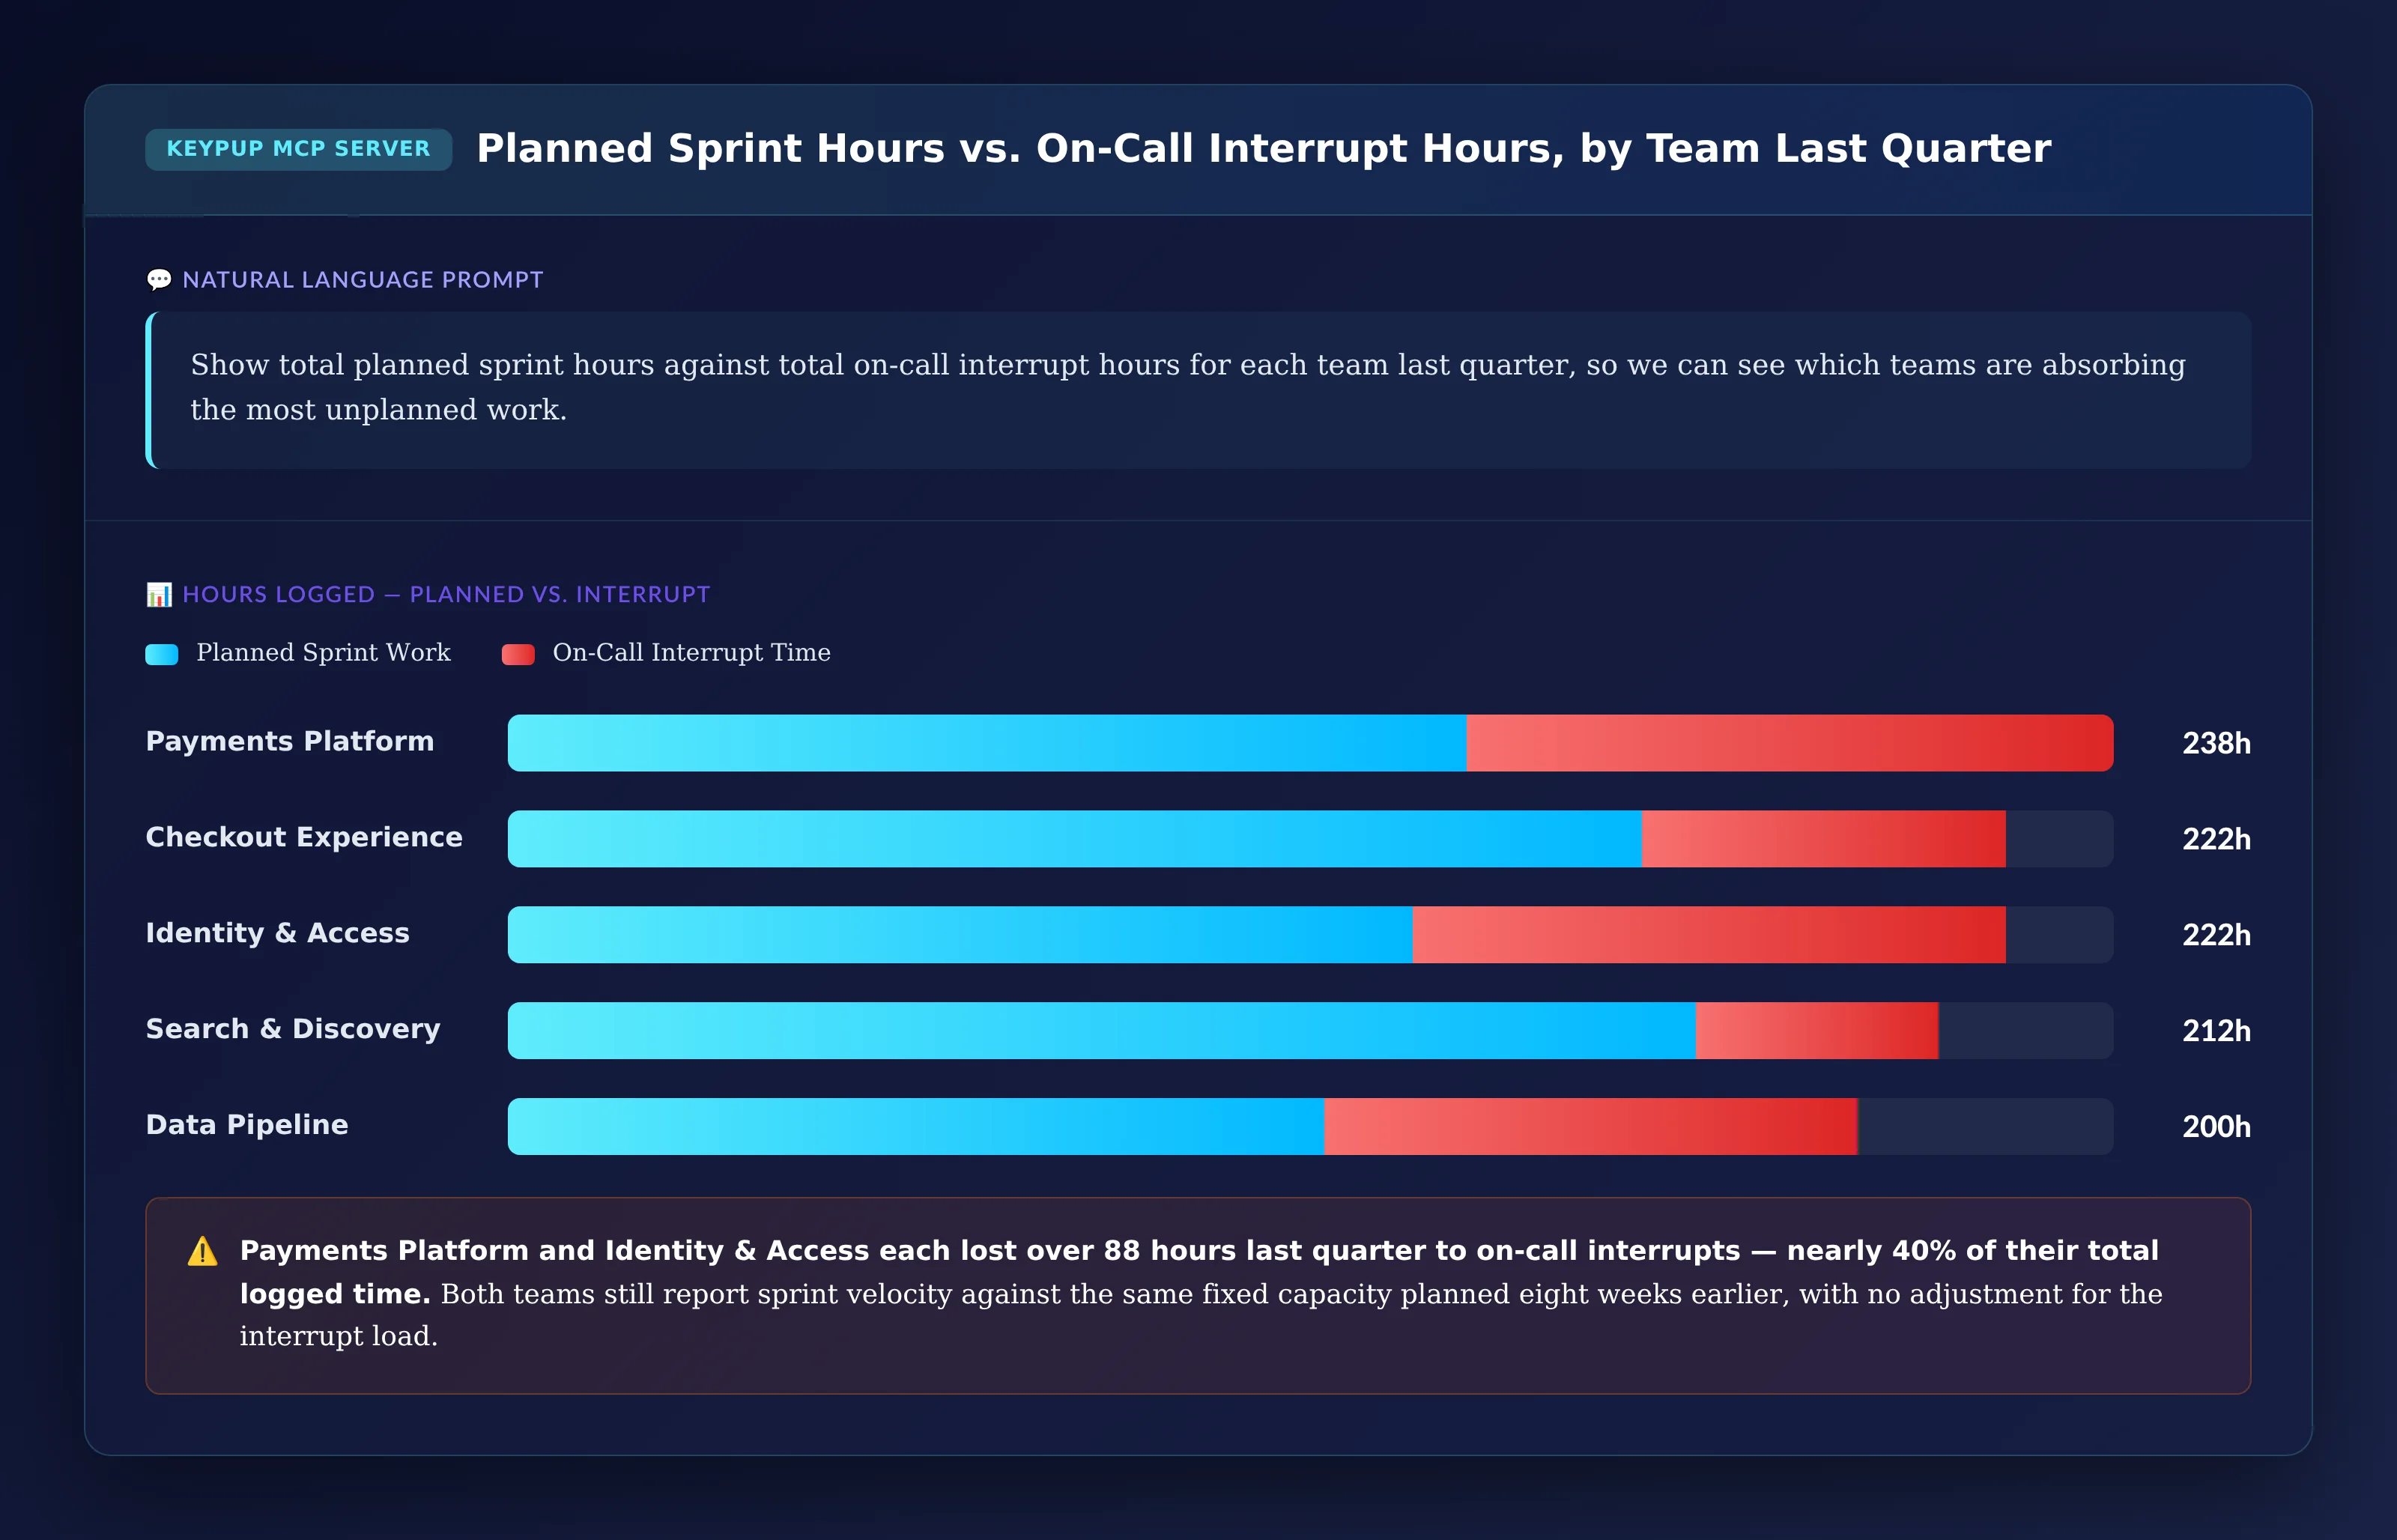
Show total planned sprint hours against total on-call interrupt
hours for each team last quarter, so we can see which teams are
absorbing the most unplanned work.
Output: Planned Sprint Hours vs. On-Call Interrupt Hours, by Team Last Quarter
Key Insight: Payments Platform and Identity & Access each lost over 88 hours last quarter to on-call interrupts — nearly 40% of their total logged time. Both teams still report sprint velocity against the same fixed capacity planned eight weeks earlier, with no adjustment for the interrupt load.
4. Proving the Correlation Between Interrupt Volume and Commitment Accuracy
A single quarter's breakdown is useful. A trend line across sprints proves the declining commitment accuracy is structurally tied to rising interrupt volume, not a sudden drop in estimation discipline.
MCP Prompt:
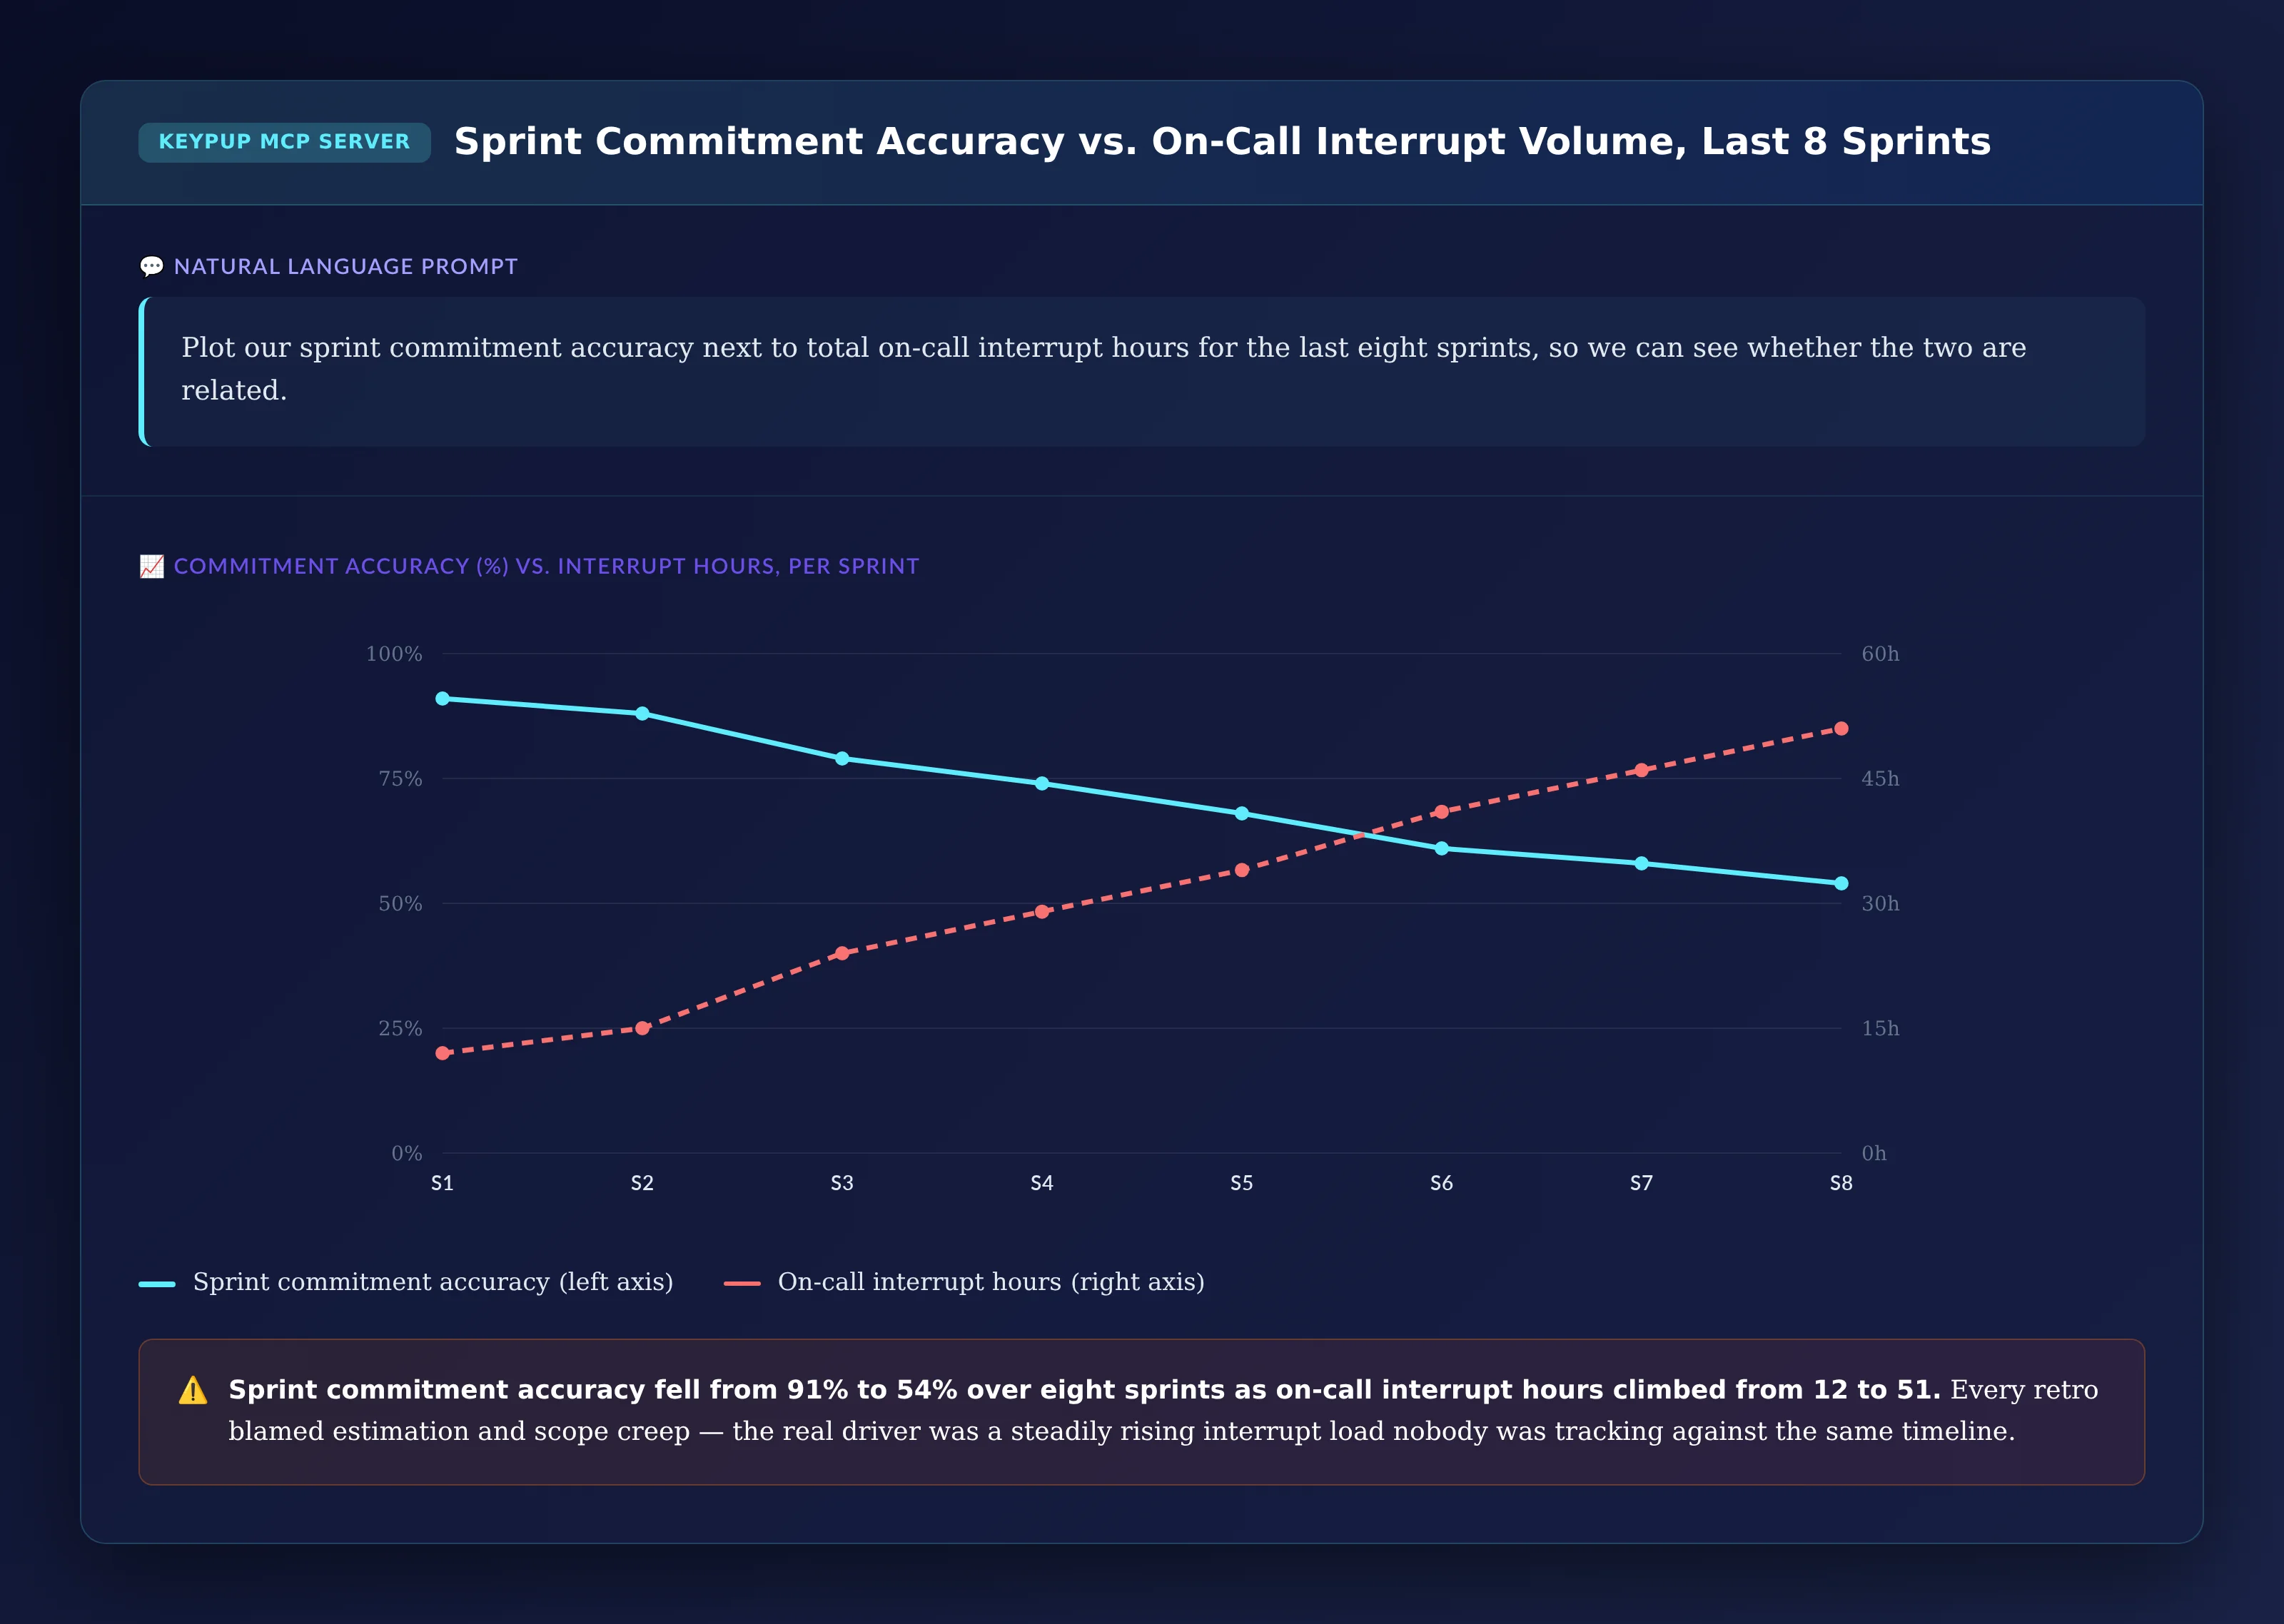
Plot our sprint commitment accuracy next to total on-call interrupt
hours for the last eight sprints, so we can see whether the two are
related.
Output: Sprint Commitment Accuracy vs. On-Call Interrupt Volume, Last 8 Sprints
Key Insight: Sprint commitment accuracy fell from 91% to 54% over eight sprints as on-call interrupt hours climbed from 12 to 51. Every retro blamed estimation and scope creep — the real driver was a steadily rising interrupt load nobody was tracking against the same timeline.
5. Naming the Most-Interrupted Engineers Right Now
For a 1:1 or burnout-prevention conversation, leadership needs the receipts on exactly who is carrying the heaviest interrupt load this rotation, not a lagging quarterly average.
MCP Prompt:
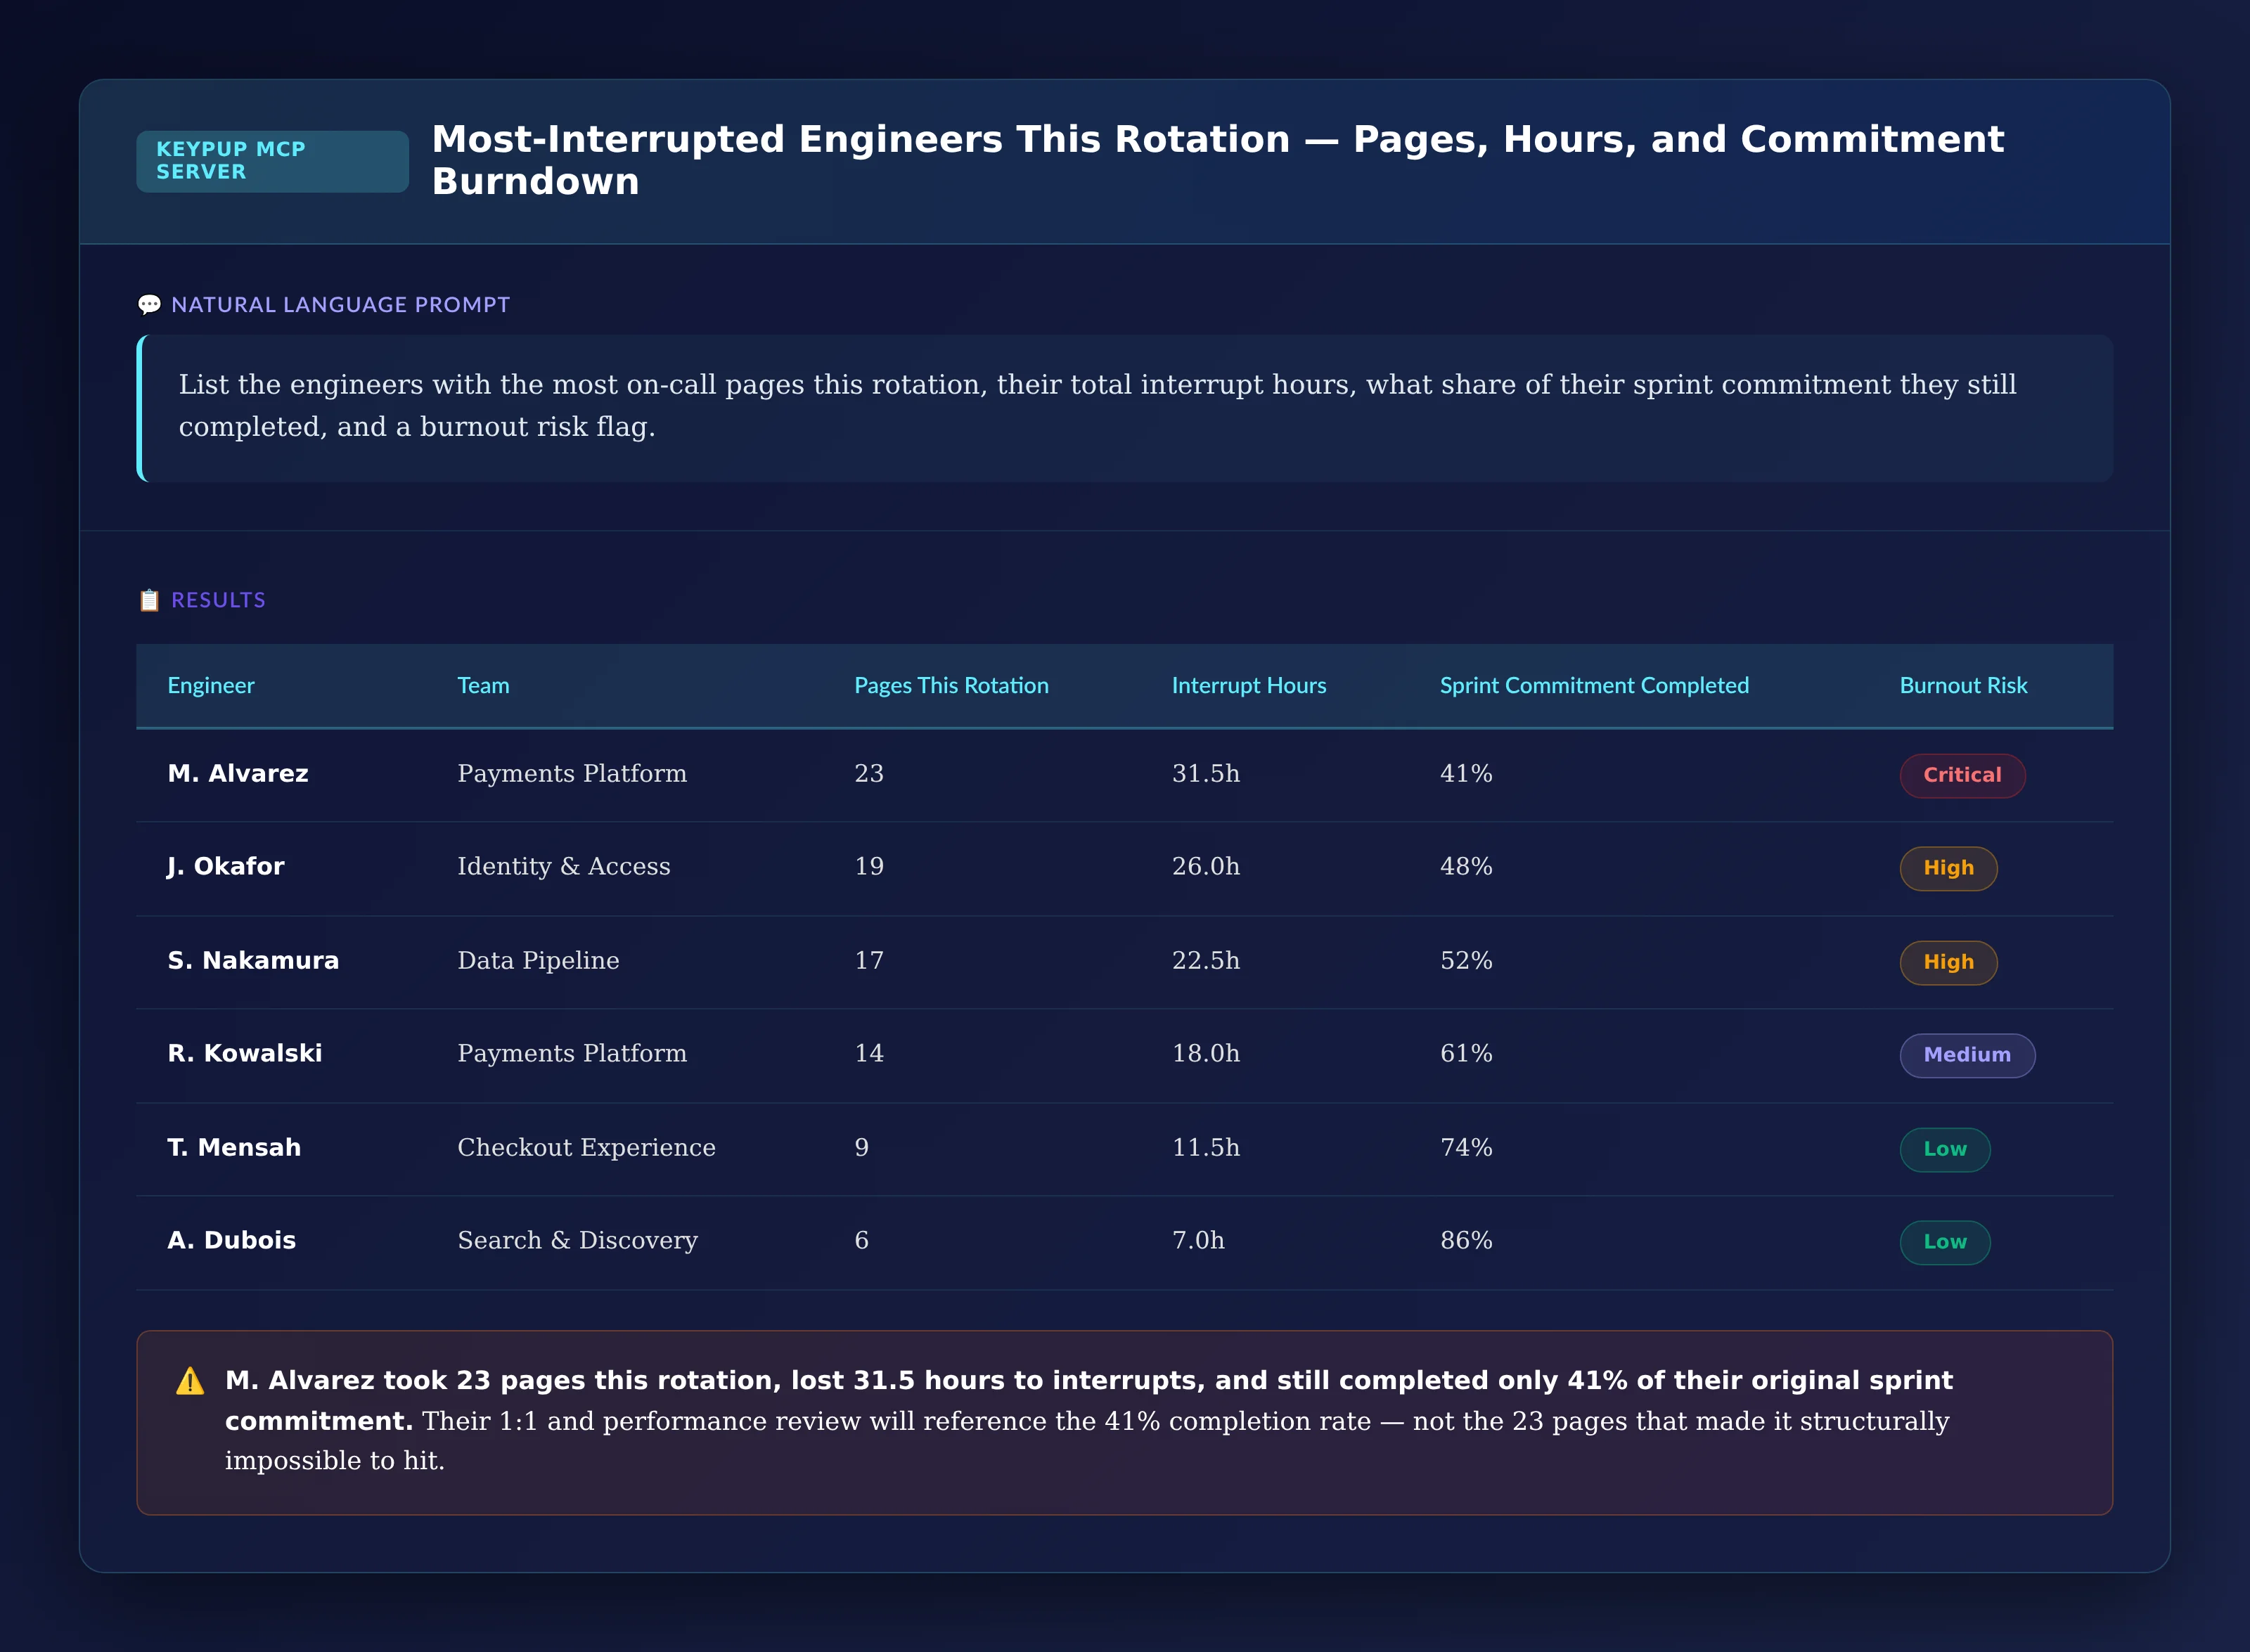
List the engineers with the most on-call pages this rotation, their
total interrupt hours, what share of their sprint commitment they
still completed, and a burnout risk flag.
Output: Most-Interrupted Engineers This Rotation — Pages, Hours, and Commitment Burndown
Engineer
Team
Pages This Rotation
Interrupt Hours
Sprint Commitment Completed
Burnout Risk
M. Alvarez
Payments Platform
23
31.5h
41%
Critical
J. Okafor
Identity & Access
19
26.0h
48%
High
S. Nakamura
Data Pipeline
17
22.5h
52%
High
R. Kowalski
Payments Platform
14
18.0h
61%
Medium
T. Mensah
Checkout Experience
9
11.5h
74%
Low
A. Dubois
Search & Discovery
6
7.0h
86%
Low
Key Insight: M. Alvarez took 23 pages this rotation, lost 31.5 hours to interrupts, and still completed only 41% of their original sprint commitment. Their 1:1 and performance review will reference the 41% completion rate — not the 23 pages that made it structurally impossible to hit.
6. Giving Leadership a Standing View of Which Teams Are Over-Rotation
Once the individual pattern is confirmed, leadership needs an ongoing, team-level view to prioritize reliability investment and staffing where the interrupt tax is heaviest.
MCP Prompt:
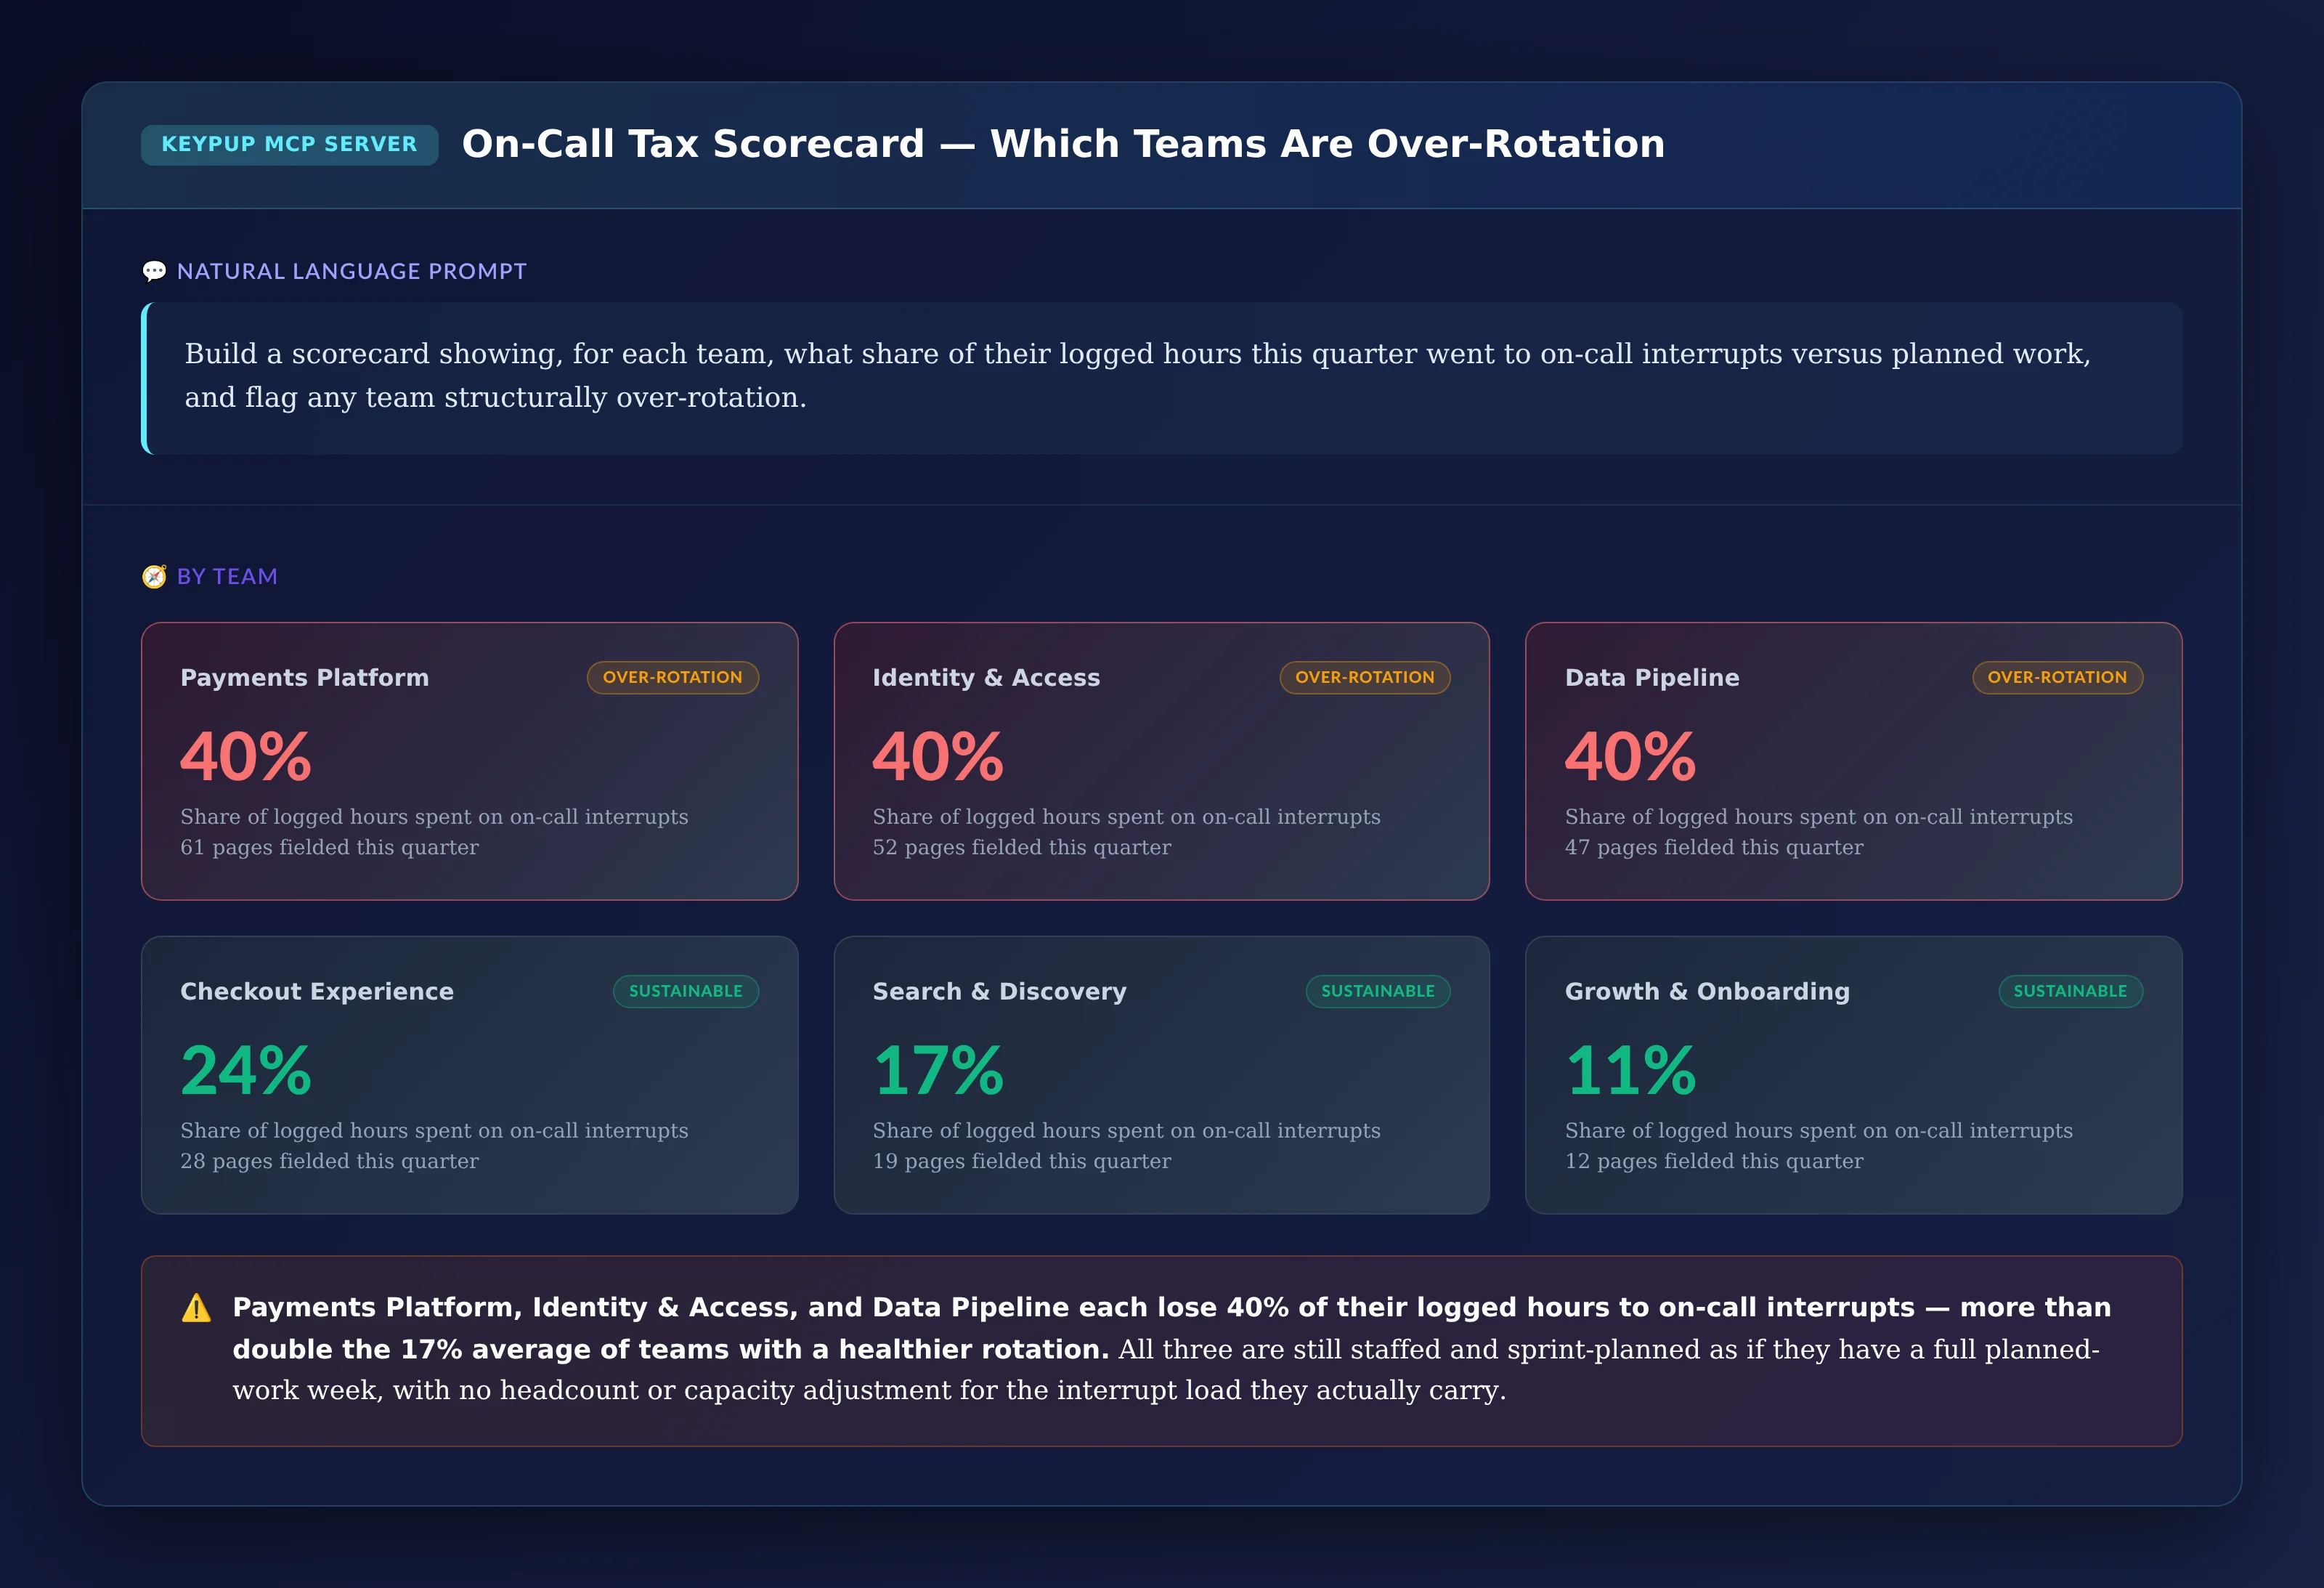
Build a scorecard showing, for each team, what share of their logged
hours this quarter went to on-call interrupts versus planned work,
and flag any team structurally over-rotation.
Output: On-Call Tax Scorecard — Which Teams Are Over-Rotation
Key Insight: Payments Platform, Identity & Access, and Data Pipeline each lose 40% of their logged hours to on-call interrupts — more than double the 17% average of teams with a healthier rotation. All three are still staffed and sprint-planned as if they have a full planned-work week, with no headcount or capacity adjustment for the interrupt load they actually carry.
The Technical Implementation: How Keypup MCP Sees Interrupt Time
Linking Incident and Escalation Activity Back to the Sprint
Keypup MCP correlates incident response activity — whether logged as a formal incident ticket, a PagerDuty event, or an unplanned hotfix pull request — against the sprint and the engineer who handled it, so interrupt time is attributed to the person and team who actually absorbed it, not left as an invisible gap in their completed story points.
Decomposing Logged Hours by Work Type, Not Just Ticket Status
Rather than treating all logged time as equally "sprint work," Keypup MCP splits each engineer's total logged hours into planned committed work and on-call interrupt time, so the true cost of a heavy rotation is visible even when the engineer's own commitment percentage looks like an estimation or execution problem.
Rotation-Aware Capacity and Burnout Tracking
Because interrupt load varies dramatically between on-call and off-rotation weeks, Keypup MCP tracks pages, interrupt hours, and commitment completion per rotation cycle, and surfaces engineers trending toward burnout risk automatically — instead of requiring a manager to notice the pattern after several quiet, overloaded sprints.
Real-World Impact: Enterprise Case Studies
Case Study 1: Global Payments Technology Provider
Before Keypup MCP:
Sprint commitment accuracy on the Payments Platform team had fallen below 55% for three consecutive quarters, with leadership repeatedly citing "estimation issues" in planning reviews
No visibility into how much of the shortfall was driven by the team's on-call rotation versus genuine scope or estimation problems
Individual performance conversations referenced low commitment percentages without any context for the interrupt load driving them
After Keypup MCP:
On-call interrupt hours were isolated as the primary driver, showing commitment accuracy tracked almost exactly inversely with interrupt volume across eight sprints
Sprint capacity planning was adjusted per rotation, reducing committed story points for whichever engineer was on-call that week instead of applying a flat capacity assumption
Commitment accuracy on the team recovered to 78% within two quarters, once planning finally reflected the capacity that was actually available
"We spent three quarters telling the same team to 'estimate better.' The moment we overlaid interrupt hours on the commitment-accuracy chart, the story changed instantly — it wasn't an estimation problem, it was a capacity-planning problem that nobody had the data to see. We fixed the planning model in one sprint once we finally had the number."
— VP Engineering, Global Payments Technology Provider
Case Study 2: Enterprise Identity and Access Management Vendor
Before Keypup MCP:
The Identity & Access team had the lowest sprint completion rate in the engineering org for over a year, and was quietly viewed as an underperforming team in leadership reviews
Two senior engineers on that team had unusually high attrition risk flagged in engagement surveys, with no clear operational explanation
Nobody had connected the team's on-call page volume to either the completion rate or the attrition risk, because the two data sets lived in entirely separate systems
After Keypup MCP:
Interrupt hours and page counts were correlated directly to individual commitment completion and retention risk, showing the two highest-attrition-risk engineers were also the two most frequently paged
A dedicated on-call reliability sprint was funded to address the highest-volume alert sources, directly justified by the downstream interrupt-hours data rather than a general request for "more headcount"
Page volume per rotation dropped by over 30% within one quarter, and sprint commitment accuracy on the team improved to match the org average for the first time in over a year
"We'd been treating this as a performance management problem for a year. It was actually a reliability investment problem wearing a performance-management disguise. Once we could show leadership the exact number of hours this specific team was losing to interrupts, funding the fix took one conversation instead of another four quarters of the same story."
— Director of Engineering, Enterprise Identity and Access Management Vendor
Implementation: Getting Started with Keypup MCP
1. Connect Your Issue Tracker, Git Activity, and Incident Data Together
Interrupt-tax attribution only works once Keypup MCP can see incident tickets, hotfix pull requests, and sprint commitments in one place — connect your incident management system alongside your existing Git and project-tracker integrations.
2. Stop Reporting Commitment Accuracy as a Single, Undifferentiated Number
Report planned sprint hours and on-call interrupt hours as two separate numbers for every rotation engineer, so a heavy on-call week never gets misread as a sudden drop in estimation or execution quality.
3. Query in Natural Language, Per Engineer or Per Team
No manual spreadsheet reconciliation between PagerDuty and the sprint board required. Just ask:
"How much of this engineer's missed commitment was interrupt time versus actual slippage?"
"Which team is carrying the heaviest on-call tax this quarter?"
"Show me page volume and interrupt hours for anyone flagged as burnout risk"
"Is our commitment accuracy decline correlated with rising interrupt hours?"
4. Automate Recurring Root-Cause Reporting
Schedule recurring queries for:
Quarterly capacity decomposition into planned work and on-call interrupt time, by team and by individual
Most-interrupted engineer tracking per rotation, with an automatic burnout risk flag
Commitment-accuracy versus interrupt-volume trend lines, ahead of every planning retro
Standing on-call tax scorecards ahead of reliability-investment and headcount conversations
The Bottom Line: Capacity Planning Needs to See the Interrupts
A capacity model that only counts committed tickets will always misattribute the cost of on-call interrupts to whichever engineer happened to be carrying the pager that week — not occasionally, but every single rotation, in every enterprise running production systems. Fixing it requires:
✅ Decomposing logged hours into planned work and on-call interrupt time, for every rotation engineer ✅ Attributing interrupt load to the person and team who actually absorbed it, not leaving it as an unexplained gap in completed work ✅ Correlating interrupt volume against commitment accuracy over time, so the decline reads as structural, not anecdotal ✅ Flagging burnout risk from page volume and interrupt hours, before it shows up in an attrition conversation instead ✅ Maintaining a standing on-call tax scorecard, to fund reliability investment and staffing where the data actually points
The Keypup MCP Server turns "why do we keep missing our sprint goals" from a recurring estimation-blame exercise into a precise answer — planned work, interrupt tax, or both — giving engineering leaders the data to fix the actual bottleneck instead of asking already-overloaded engineers to simply estimate better.
Get Started
Ready to stop measuring commitment accuracy with a number that's silently hiding your entire on-call interrupt load?
Start Free Trial — Connect your engineering stack in minutes and start separating planned sprint work from on-call interrupt time.
Request Demo — See how enterprise engineering leaders use Keypup MCP to quantify and fix the on-call interrupt tax.
View MCP Documentation — Technical details for engineering teams implementing Keypup MCP across Git, issue-tracker, and incident data.
Keywords: on-call interrupt tax, sprint commitment accuracy, unplanned work metrics, incident response capacity planning, engineering burnout risk, DORA metrics on-call, MCP server incident tracking, enterprise reliability investment, interrupt-driven work analytics, production incident SDLC impact
Ready to Transform Your Analytics?
Join teams already using AI to make data-driven decisions faster than
ever.
Cycle time keeps climbing even though the backlog looks "normal." The hidden cause is concurrent WIP per engineer. See what Reddit engineers say about ticket-juggling, and how Keypup MCP exposes the context-switching tax hiding inside your sprint data.
Your AI coding assistant bill is easy to read. How your engineers actually use those tools is not. Discover Keypup's AI Usage dataset and AI Usage & Monitoring Dashboard, what engineers on Reddit are saying about AI adoption metrics, and how to query AI usage in plain English through the Keypup MCP Server.
Every enterprise SDLC has issues that span two or more teams — and every one of them quietly loses days waiting on an API contract, a review, or a shared environment slot that no single team's dashboard ever shows as blocked. Discover how Keypup MCP measures the hidden cross-team dependency tax, names the teams causing the most downstream drag, and turns "why does this always take longer than it should" into a precise, fundable staffing conversation.