The Vulnerability Remediation Tax: How Unattributed Security Patch Work Is Wrecking Your Velocity Metrics
Every enterprise engineering org absorbs CVE patching, dependency upgrades, and vendor-driven security fixes as "just part of the job" — and none of it shows up on a roadmap. When sprint velocity drops, leadership reads it as a productivity problem. Discover how Keypup MCP surfaces the hidden vulnerability remediation tax, separates it from real engineering decline, and gives leadership the data to staff for it instead of penalizing teams for it.
Liam Davis
•13 min read
Table of Contents
TL;DR: Enterprise engineering teams absorb a constant, invisible stream of vulnerability remediation work — CVE patching, forced dependency upgrades, vendor security advisories — that never appears on any roadmap and is rarely tracked as its own category of effort. When "velocity" drops because a team spent a third of its capacity upgrading a package with a critical CVE instead of shipping features, standard dashboards read it as a productivity decline. Leadership asks engineering to move faster; nobody asks why the backlog of unpatched critical vulnerabilities is growing. The Keypup MCP Server decomposes reported velocity into feature work and vulnerability remediation, tracks CVE backlog age and SLA breaches by team, and quantifies exactly how much capacity security work is consuming — turning a recurring "why is engineering slower" accusation into a precise, defensible staffing conversation.
Ask an engineering manager at a large bank, insurer, or SaaS platform why last quarter's velocity dropped 40%, and the honest answer is rarely "the team got worse at writing code." It's usually: three critical CVEs landed in a core dependency the same month, and someone had to drop everything to upgrade, test, and ship the fix before the remediation SLA clock ran out — with nothing on the sprint board to show for it except a lower burndown number.
The Friction: Security Work That Doesn't Exist on Any Dashboard
Standard sprint and DORA-style dashboards are built around planned work: stories, epics, story points committed at sprint planning. Vulnerability remediation almost never gets planned that way. A CVE alert fires, a dependency scanner flags a critical package, a vendor issues a security advisory — and engineering absorbs the work reactively, mid-sprint, without it ever being logged as a distinct category of effort.
Security work arrives as an interrupt, not a backlog item. CVEs don't respect sprint boundaries. A critical vulnerability disclosed on day three of a two-week sprint doesn't wait for planning — it gets pulled in immediately, displacing whatever was already committed.
It's logged inconsistently, if at all. Some teams create a ticket for the CVE fix; others just do the work inside an existing ticket, a hotfix branch, or an ad-hoc pull request with no link back to the vulnerability that caused it. Either way, the effort is invisible to any rollup that counts committed story points.
Dependency upgrades are rarely "just" the patch. A forced upgrade of a core library to fix one CVE routinely breaks three unrelated things downstream — deprecated APIs, changed defaults, incompatible peer dependencies — turning a "5-minute patch" into days of regression testing that has nothing to do with the original vulnerability.
Standard velocity metrics can't tell the difference. A sprint with 20 story points of features delivered and a sprint with 12 story points of features plus 30 hours of unlogged CVE remediation both just show up as "velocity," with no way to see that the second sprint actually did more total work.
The result: teams get systematically penalized in velocity terms for doing exactly the security work leadership says it wants, because none of that work is visible in the metric leadership actually reads.
Why This Matters: Penalizing the Behavior You're Asking For
The Misdiagnosis Problem
When velocity drops, the reflexive response is to ask engineering to move faster, add more testing rigor, or explain the "productivity decline" in a QBR. None of that addresses the actual driver — a critical CVE in a payment library that consumed three engineers for a week. Teams get pressured to speed up a process that was never slow; it was just carrying a load nobody counted.
The Backlog-Growth Problem
Without a clear view of how much capacity security work is consuming, there's no forcing function to actually staff for it. Remediation work keeps landing on whichever team happens to own the affected service, competing silently with their roadmap every single sprint — and the CVE backlog quietly grows in the corners nobody is measuring.
The Trust Problem
When engineering explains a slow quarter by pointing to "a lot of security patching," without data to back it up, it reads as an excuse — even when it's true. Leadership has no way to independently verify the claim, so the explanation gets discounted, and the same defensive conversation repeats every quarter with no new information on either side.
The Enterprise Discussion: What Engineers Are Actually Saying
This exact frustration is a recurring theme wherever engineers at large, security-conscious enterprises compare notes on sprint metrics and vulnerability management.
Staff Engineer, Fintech Platform Team (r/ExperiencedDevs)
"Our velocity chart shows a cliff in March. What actually happened is three critical CVEs hit our logging library, our auth library, and a transitive dependency of both, all in the same two weeks. We shipped every one of those fixes inside SLA. None of it was a Jira ticket with story points — it was 'drop everything, patch, test, ship' three separate times. Leadership saw the velocity number and asked what went wrong with the team."
"We track feature velocity religiously and track security patching basically nowhere. Last retro, someone did the math and our team spent close to 30% of the quarter on CVE remediation and forced dependency bumps that broke unrelated things. Nobody upstream had any idea that number was that high, because it was never in a report — it was just 'stuff we did between the stories that were actually tracked.'"
The pattern holds: the security work is real, substantial, and completely absent from the metric everyone uses to judge the team. Engineers already know exactly how much time a bad CVE quarter costs them — what's missing is a way to put that number in front of leadership before the QBR, instead of explaining it defensively after the fact.
How Keypup MCP Solves the Vulnerability Remediation Tax
The Keypup Model Context Protocol (MCP) Server treats vulnerability remediation as its own first-class category of engineering effort — decomposing reported velocity into feature work and security work, tracking CVE backlog age and SLA status, and quantifying exactly which teams are carrying the heaviest security load, all through natural-language prompts against your existing GitHub, Jira, and dependency data.
1. Decomposing Total Capacity Into Feature Work vs. Security Work
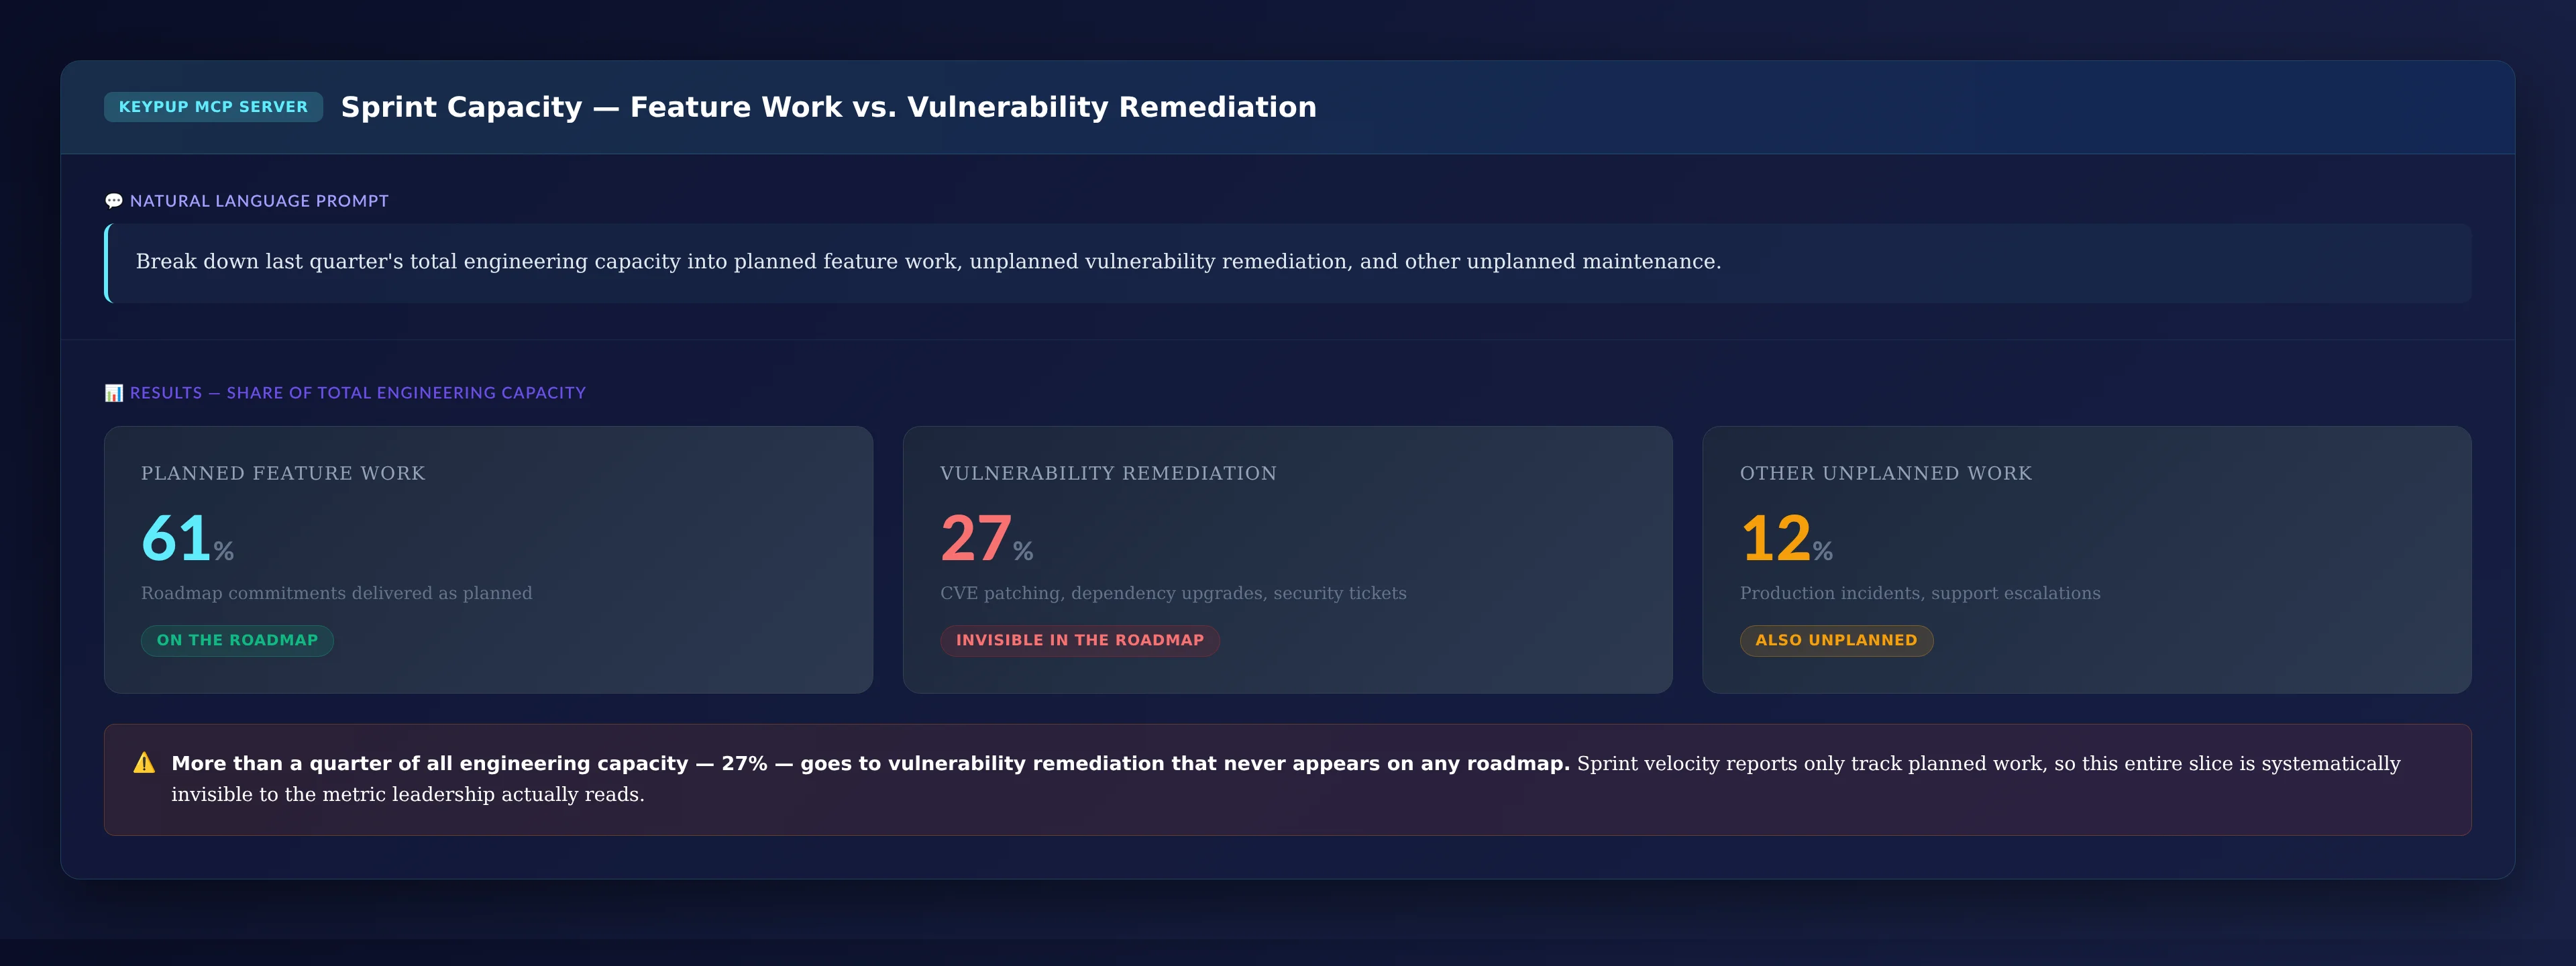
Before anything else, leadership needs to see how much of last quarter's capacity actually went to security work versus the roadmap.
MCP Prompt:
Break down our total engineering capacity for the last quarter into
planned feature work, unplanned vulnerability remediation, and other
unplanned maintenance.
Output: Sprint Capacity — Feature Work vs. Vulnerability Remediation
Key Insight: More than a quarter of all engineering capacity — 27% — goes to vulnerability remediation that never appears on any roadmap, yet it's routinely absent from the metric leadership reviews every quarter.
2. Breaking Down Where Remediation Hours Actually Go
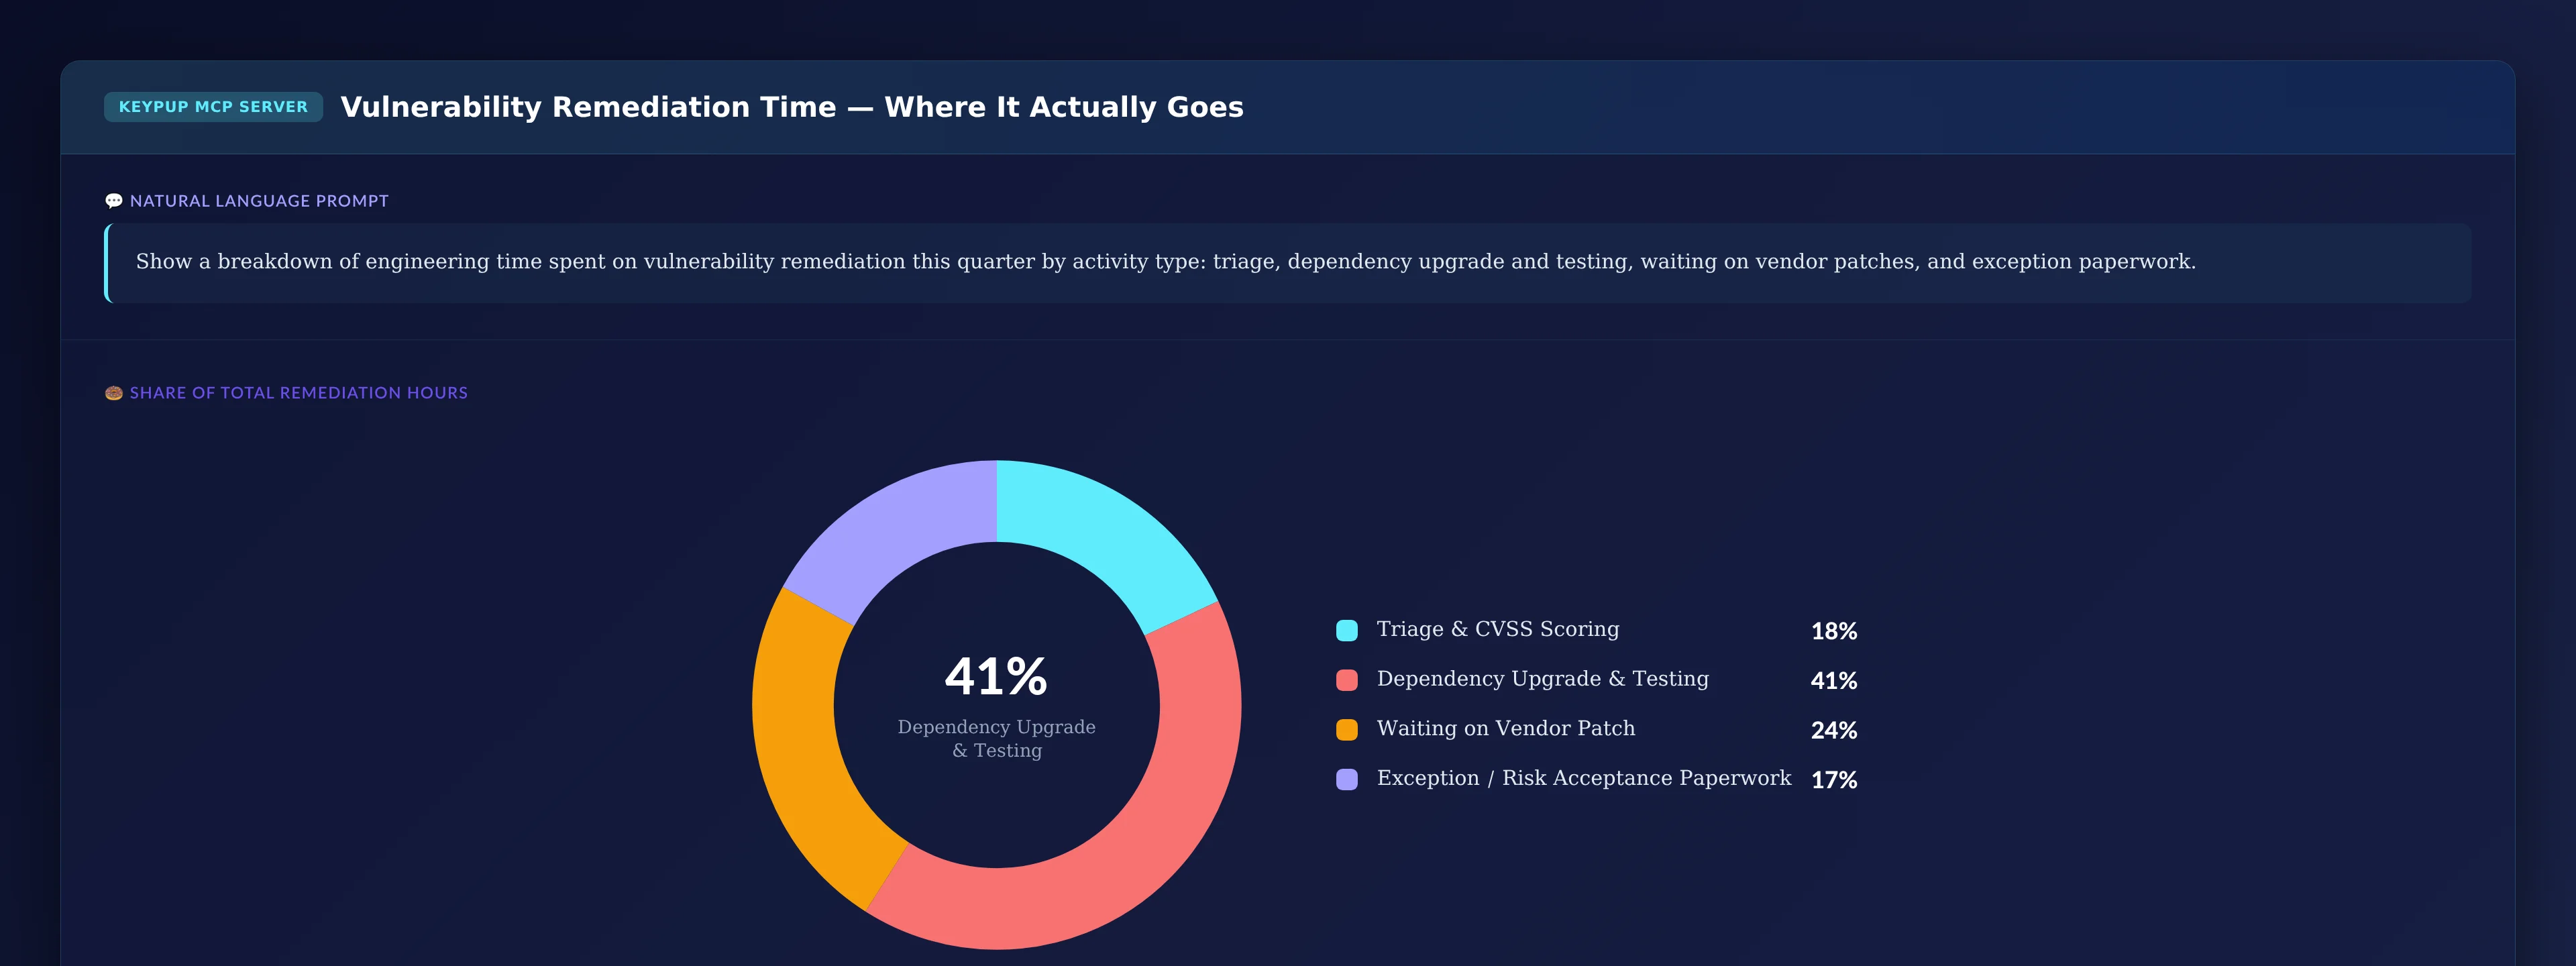
Once security work is visible as its own category, the next question is what's actually consuming those hours.
MCP Prompt:
Show a breakdown of engineering time spent on vulnerability remediation
this quarter by activity type: triage, dependency upgrade and testing,
waiting on vendor patches, and exception paperwork.
Output: Vulnerability Remediation Time — Where It Actually Goes
Key Insight: Only 18% of remediation time is triage — the rest is upgrade engineering, vendor waiting, and compliance paperwork. Treating "security work" as a single undifferentiated bucket hides that most of the cost is forced dependency upgrades, not analysis.
3. Ranking Teams by Open Critical CVE Backlog Age
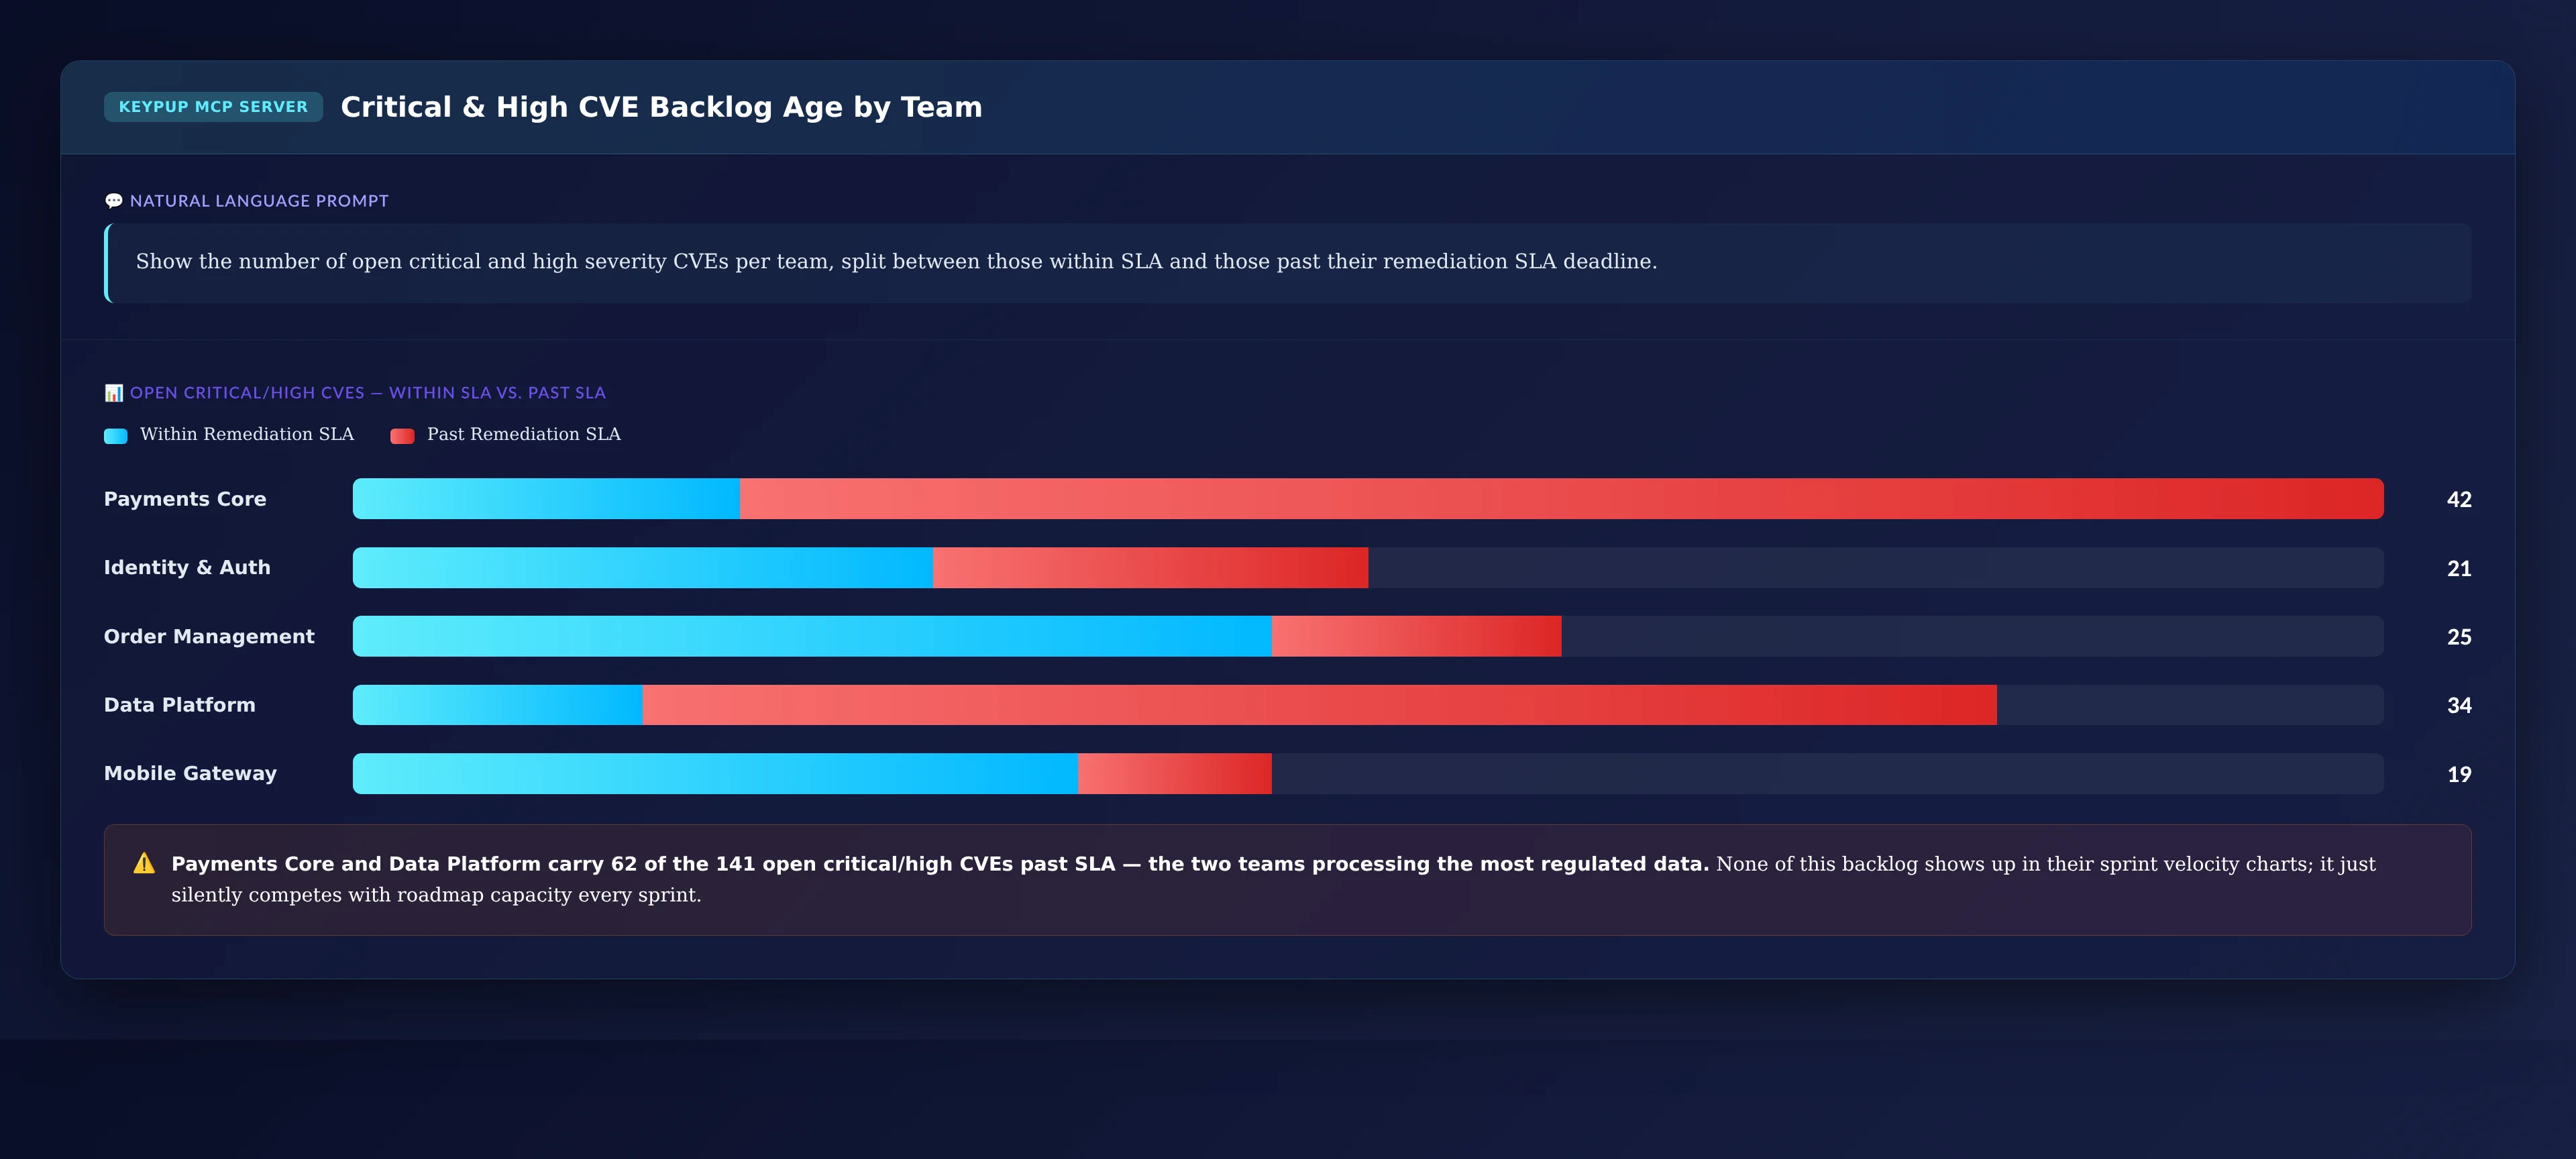
With remediation cost established, leadership needs to know exactly where the backlog is concentrated and how much of it is breaching SLA.
MCP Prompt:
Show the number of open critical and high severity CVEs per team,
split between those within SLA and those past their remediation SLA
deadline.
Output: Critical & High CVE Backlog Age by Team
Key Insight: Payments Core and Data Platform carry 62 of the 141 open critical/high CVEs past SLA — the two teams processing the most regulated data. None of this backlog shows up in their sprint velocity charts; it just silently competes with roadmap capacity every sprint.
4. Quantifying the Engineering Cost of Specific Open CVEs
For a governance or audit conversation, leadership needs the receipts on exactly which vulnerabilities are consuming the most engineering time.
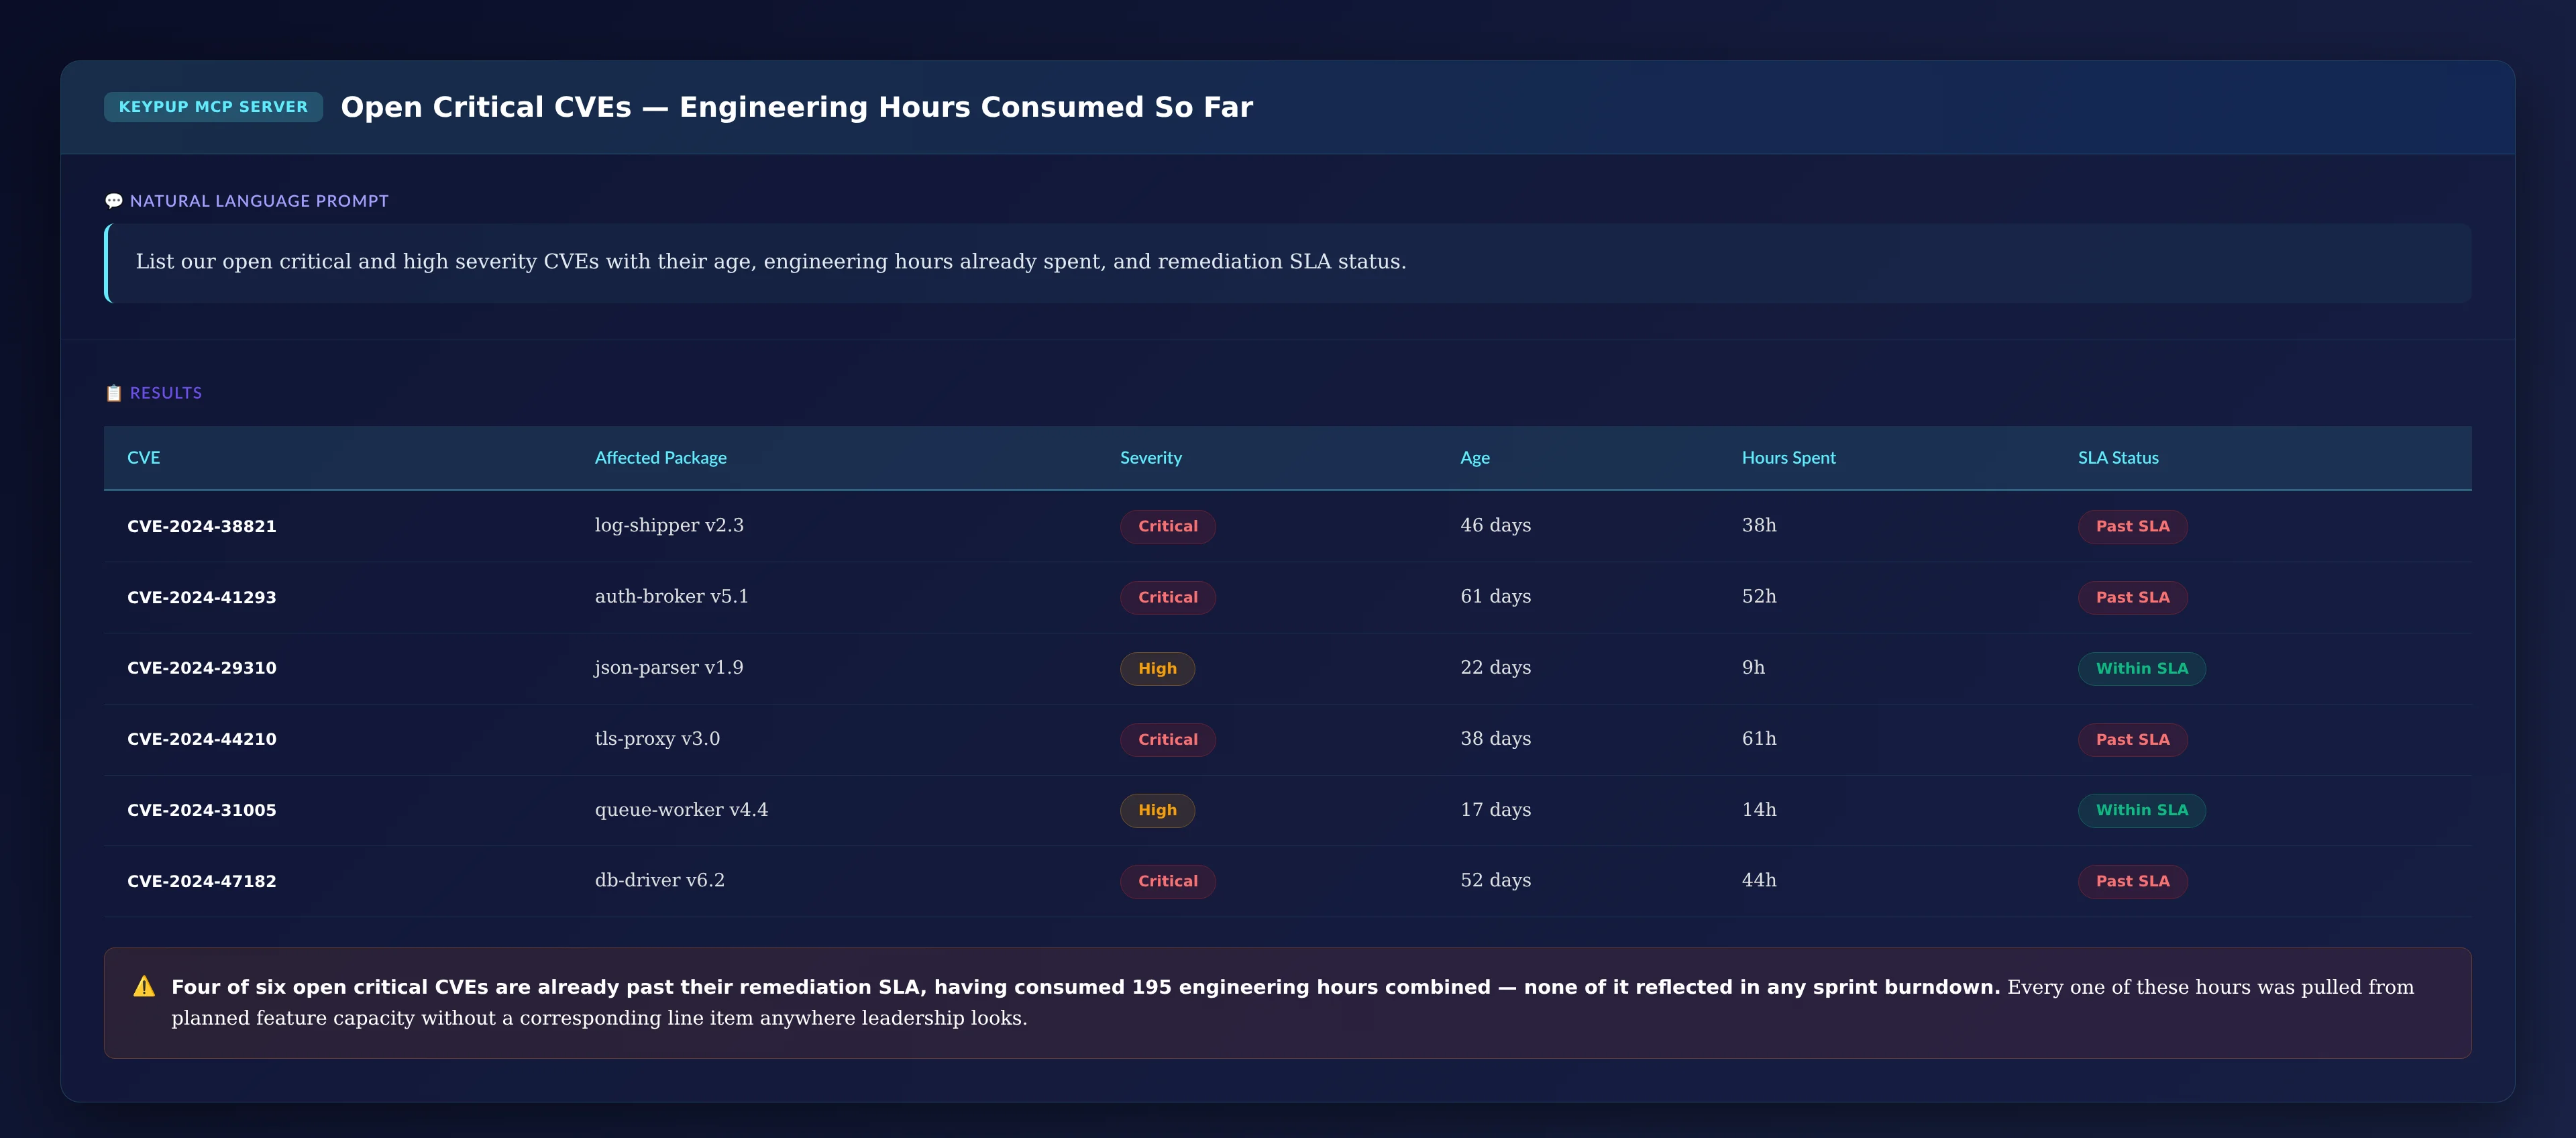
MCP Prompt:
List our open critical and high severity CVEs with their age,
engineering hours already spent, and remediation SLA status.
Output: Open Critical CVEs — Engineering Hours Consumed So Far
CVE
Affected Package
Severity
Age
Hours Spent
SLA Status
CVE-2024-38821
log-shipper v2.3
Critical
46 days
38h
Past SLA
CVE-2024-41293
auth-broker v5.1
Critical
61 days
52h
Past SLA
CVE-2024-29310
json-parser v1.9
High
22 days
9h
Within SLA
CVE-2024-44210
tls-proxy v3.0
Critical
38 days
61h
Past SLA
CVE-2024-31005
queue-worker v4.4
High
17 days
14h
Within SLA
CVE-2024-47182
db-driver v6.2
Critical
52 days
44h
Past SLA
Key Insight: Four of six open critical CVEs are already past their remediation SLA, having consumed 218 engineering hours combined — none of it reflected in any sprint burndown. Every one of those hours was pulled from planned feature capacity without a corresponding line item anywhere leadership looks.
5. Proving the Reported Velocity Drop Tracks Security Load, Not Engineering Decline
A single quarter's decomposition is useful. A trend across sprints proves the "velocity decline" leadership flagged is systemic and security-driven, not a change in team output.
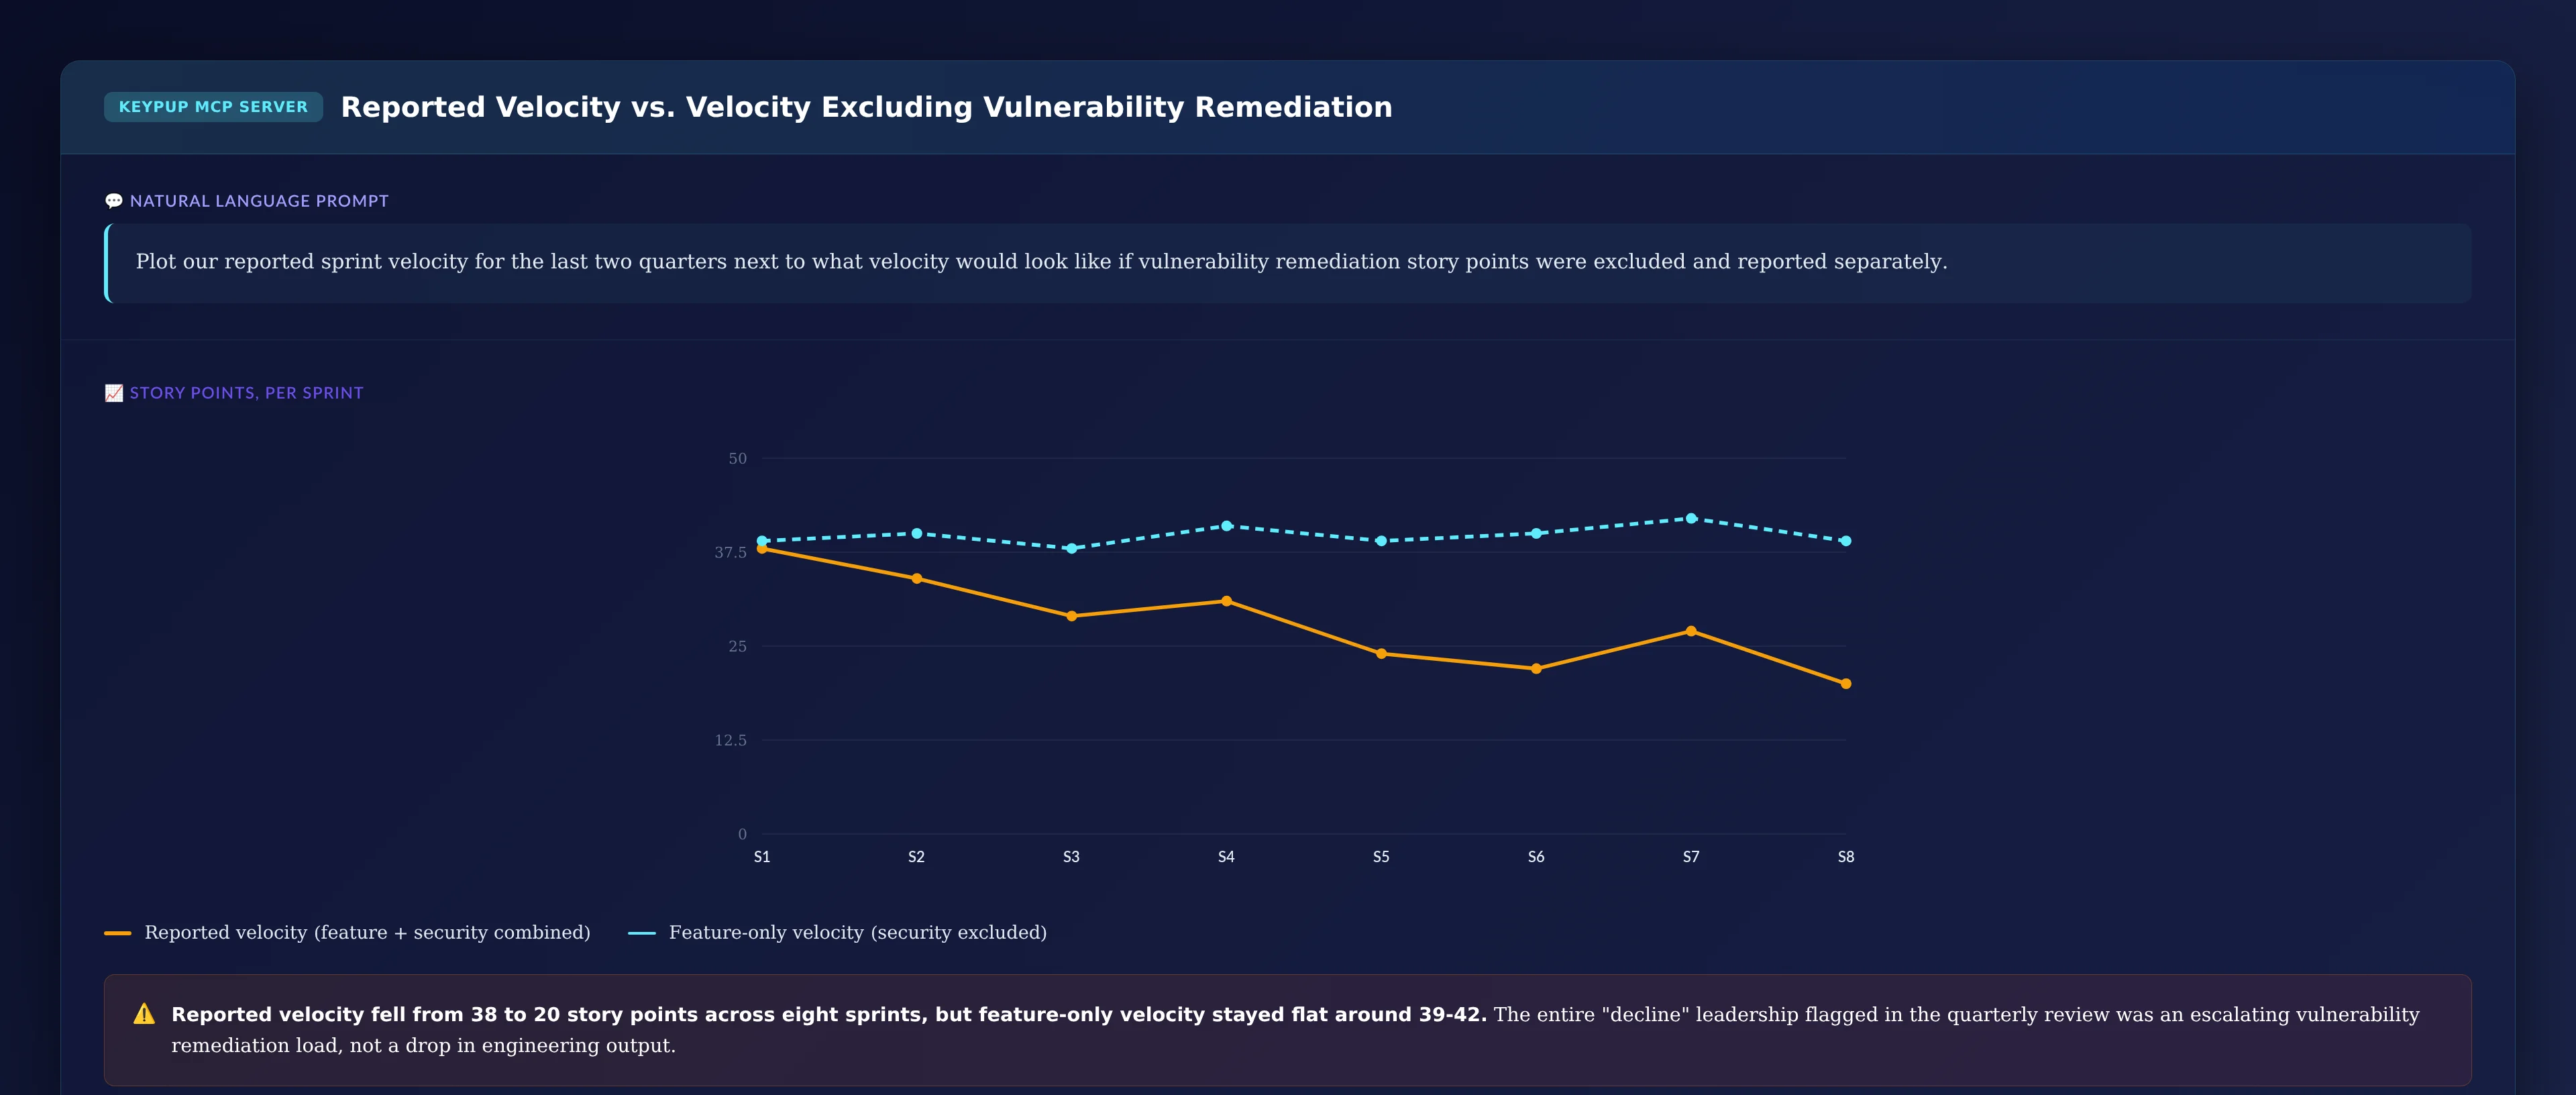
MCP Prompt:
Plot our reported sprint velocity for the last two quarters next to
what velocity would look like if vulnerability remediation story
points were excluded and reported separately.
Output: Reported Velocity vs. Velocity Excluding Vulnerability Remediation
Key Insight: Reported velocity fell from 38 to 20 story points across eight sprints, but feature-only velocity stayed flat around 39-42. The entire "decline" leadership flagged in the quarterly review was an escalating vulnerability remediation load, not a drop in engineering output.
6. Giving Leadership a Standing View of Which Teams Carry the Heaviest Security Load
Once the pattern is confirmed, leadership needs an ongoing view of which teams are actually absorbing the remediation tax, to target staffing where it's needed.
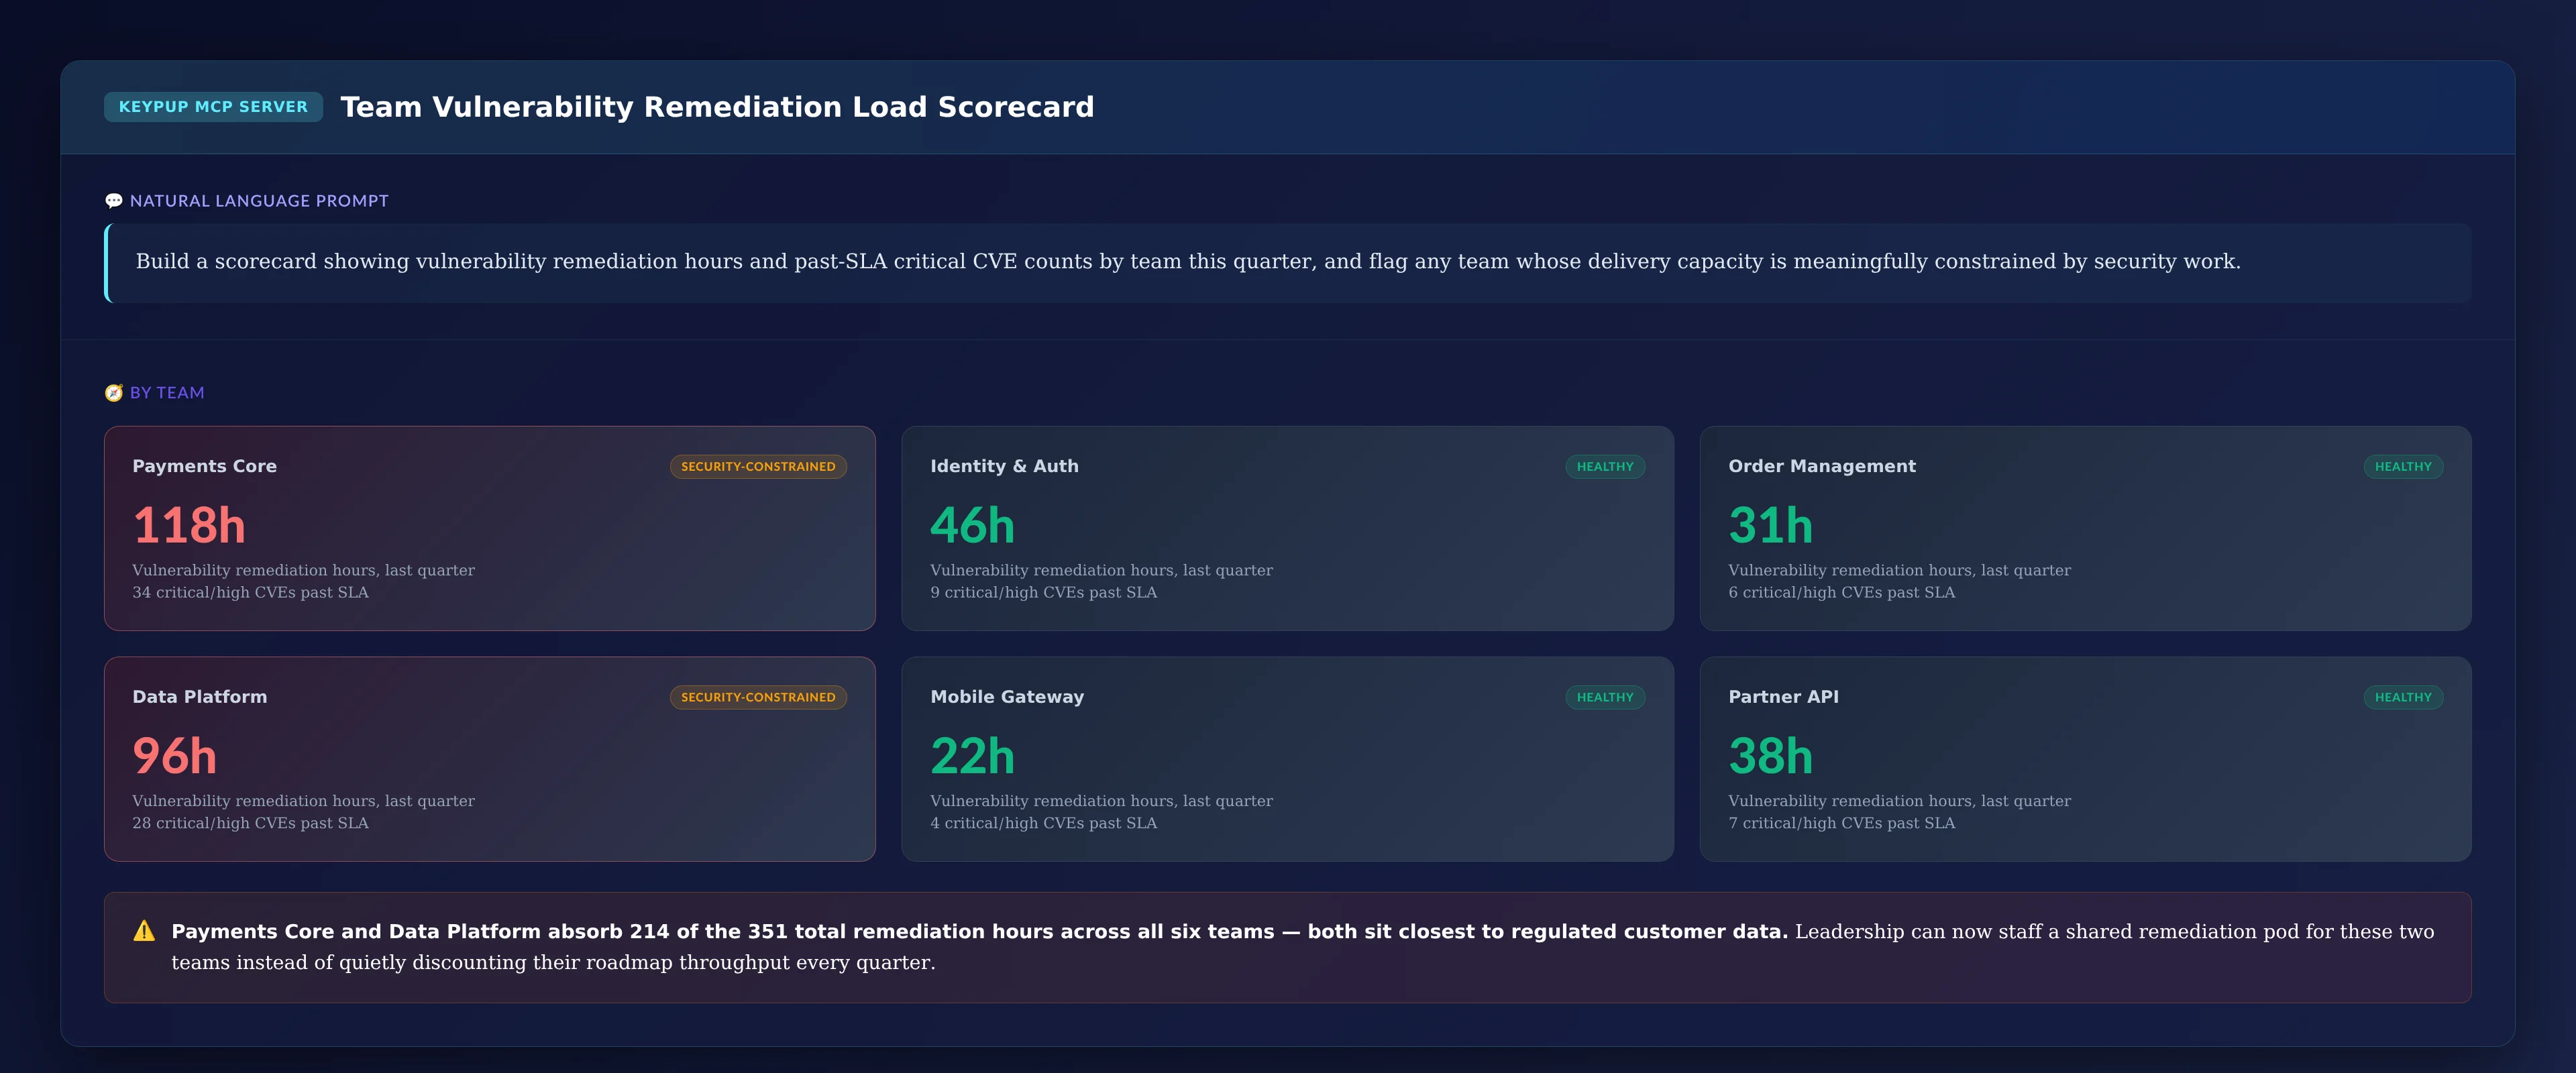
MCP Prompt:
Build a scorecard showing vulnerability remediation hours and
past-SLA critical CVE counts by team this quarter, and flag any team
whose delivery capacity is meaningfully constrained by security work.
Output: Team Vulnerability Remediation Load Scorecard
Key Insight: Payments Core and Data Platform absorb 214 of the 351 total remediation hours across all six teams — both sit closest to regulated customer data. Leadership can now staff a shared remediation pod for these two teams instead of quietly discounting their roadmap throughput every quarter.
The Technical Implementation: How Keypup MCP Separates Security Signal From Velocity Noise
Cross-Referencing Commits and Tickets Against CVE Data
Keypup MCP links pull requests, commits, and dependency manifest changes back to the CVE or security advisory that triggered them — even when the work was never logged in a dedicated ticket — so remediation effort is captured whether or not a team followed a formal process for it.
Effort Attribution by Category, Not Just Status
Rather than treating every closed ticket as equivalent "velocity," Keypup MCP tags effort by category — feature work, vulnerability remediation, other unplanned maintenance — so a sprint's true total output is visible even when the roadmap-visible portion of it dropped.
SLA-Aware Backlog Tracking
Because remediation SLA deadlines vary by severity and regulatory context, Keypup MCP tracks each open CVE against its specific SLA clock and surfaces breaches automatically, instead of requiring a manual audit before every compliance review.
Real-World Impact: Enterprise Case Studies
Case Study 1: Regional Digital Bank
Before Keypup MCP:
Sprint velocity had fallen nearly 40% over two quarters, with leadership repeatedly pressing the payments team to explain the "productivity slide" in quarterly reviews
No visibility into how much of that drop was CVE remediation on a core payments library versus an actual change in team output
The critical CVE backlog had quietly grown to over 30 open items past SLA, with no reporting surfacing it until an external audit flagged it
After Keypup MCP:
Vulnerability remediation was isolated as the actual driver, showing feature-only velocity had stayed essentially flat across the entire period
A dedicated security remediation rotation was staffed for the payments team, based on the hours-consumed data, instead of asking the existing team to simply "go faster"
Reported velocity recovered within one quarter, and the critical CVE backlog past SLA dropped by more than half once remediation had dedicated capacity instead of competing with the roadmap
"We spent two quarters defending a velocity number we couldn't actually explain with data. The moment we could show the board that feature velocity never moved and CVE remediation hours had tripled, the conversation changed completely — from 'why is this team slower' to 'why don't we staff for the security load we already know is coming.'"
— VP Engineering, Regional Digital Bank
Case Study 2: Enterprise SaaS Platform
Before Keypup MCP:
Vulnerability remediation was scattered across ad-hoc pull requests and hotfix branches with no consistent tracking, so nobody could say with confidence how much capacity it consumed
Two teams were quietly absorbing the majority of dependency-upgrade fallout because they owned the most widely shared internal libraries, with no data to justify additional headcount
Security and engineering leadership had different numbers for "how much time we spend on CVEs" going into every budget cycle, because neither side had a shared source of truth
After Keypup MCP:
Remediation hours were attributed automatically to the CVEs and commits that generated them, giving security and engineering leadership the same numbers for the first time
The two teams absorbing the most dependency-upgrade fallout were identified and given a shared platform remediation pod, funded directly from the hours data
Time-to-remediate for critical CVEs improved by over 30% once the two most-affected teams had dedicated capacity instead of squeezing remediation between roadmap commitments
"Before this, 'how much time do we spend on security patching' was a debate every planning cycle, with security and engineering each guessing a different number. Now it's just a query. That single change ended more budget arguments than anything else we did that year."
— Director of Platform Engineering, Enterprise SaaS Platform
Implementation: Getting Started with Keypup MCP
1. Connect Your Dependency and Vulnerability Data First
Before decomposing any velocity metric, make sure your CVE and dependency scanning data (Dependabot, Snyk, or equivalent) is connected alongside your Git and issue tracker data — attribution only works once remediation work can be linked back to the vulnerability that caused it.
2. Stop Reporting a Single Undifferentiated "Velocity"
Report feature velocity and vulnerability remediation load as two separate numbers, every sprint, so a security-heavy sprint never gets misread as a slow one.
3. Query in Natural Language, Across Every Team
No manual spreadsheet reconciliation required. Just ask:
"How much of our velocity drop last quarter was vulnerability remediation?"
"Which team has the oldest open critical CVE backlog right now?"
"Show me engineering hours spent on CVE remediation this month, by team"
"Which team's delivery capacity is most constrained by security work?"
4. Automate Recurring Root-Cause Reporting
Schedule recurring queries for:
Quarterly capacity decomposition into feature work, remediation, and other unplanned maintenance
CVE backlog age and SLA breach tracking, to justify remediation staffing where it's actually needed
Reported vs. feature-only velocity trend lines, ahead of every QBR
Standing team remediation-load scorecards ahead of budget and headcount conversations
The Bottom Line: A Velocity Metric Needs to Know What It's Actually Measuring
A metric that treats all closed tickets as equivalent will always misattribute the cost of vulnerability remediation to engineering output — not occasionally, but every time a serious CVE lands, in every enterprise carrying real security obligations. Fixing it requires:
✅ Treating vulnerability remediation as its own first-class category of engineering effort, not an invisible tax on velocity ✅ Reporting feature velocity and security work separately, every sprint, in every dashboard ✅ Tracking CVE backlog age and SLA status by team, not just in aggregate ✅ Quantifying the size of the remediation load over time, so leadership sees it's systemic, not anecdotal ✅ Maintaining a standing view of which teams carry the heaviest security load, to staff for it correctly
Keypup MCP turns "why did velocity drop this quarter" from a recurring, productivity-shaped accusation into a precise answer — feature work, remediation, or both — giving engineering leaders the data to staff for the security obligations they already have instead of asking teams to outrun a CVE backlog nobody agreed to make invisible.
Get Started
Ready to stop measuring engineering velocity with a number that's silently absorbing your entire vulnerability remediation load?
Start Free Trial — Connect your engineering stack in minutes and start separating feature velocity from vulnerability remediation load.
Request Demo — See how enterprise engineering leaders use Keypup MCP to quantify and staff for the vulnerability remediation tax.
View MCP Documentation — Technical details for engineering teams implementing Keypup MCP across CVE and dependency data sources.
Acquiring a company means acquiring its engineering org — and its deployment frequency, its review culture, and its three-day-old Bitbucket habit. Here's how to measure the integration gap instead of guessing at it.
Keypup's MCP server now connects directly to ChatGPT and Claude, letting engineering leaders ask plain-language questions about DORA metrics, cycle time, throughput, and team performance and get instant, formatted answers — charts, tables, and KPIs included. This guide walks through how both integrations work, the concrete benefits over traditional dashboards, and five real prompt-and-output examples spanning delivery velocity, quality, cycle time, and team performance.
Enterprise releases don't move straight from commit to production — they queue through Integration, QA, UAT, Staging, and Pre-Prod, shared environments too expensive to replicate per team. Contention creates massive queues while staging drift causes builds to fail for reasons that have nothing to do with code quality. Standard SDLC analytics blame engineering for the resulting spike in Time to Release. Discover how Keypup MCP separates real code defects from environment queue wait and configuration drift, so leadership stops penalizing teams for infrastructure problems.