The Post-Acquisition Engineering Gap: Why Your DORA Metrics Break the Moment Two Orgs Merge
Acquiring a company means acquiring its engineering org — and its deployment frequency, its review culture, and its three-day-old Bitbucket habit. Here's how to measure the integration gap instead of guessing at it.
TL;DR: When an engineering org acquires another, the integration plan almost never includes a shared definition of "done," a shared Git platform, or a shared answer to "how fast do we actually ship." Six months in, most leadership teams are still guessing whether the acquired org is catching up or quietly dragging down every blended metric on the board deck. The Keypup MCP Server turns that guess into a number — comparing DORA metrics, cycle time, tooling fragmentation, and cost per feature between the two orgs, on the same scale, from day one.
Key Point 1: DORA metrics measured separately, not blended, are the only way to see whether integration is actually converging the two orgs or just averaging over the gap.
Key Point 2: Tooling fragmentation (multiple Git platforms, multiple issue trackers) is usually the first hidden cost — before culture, before process, before headcount decisions.
Key Point 3: Cost per shipped feature reveals the real financial drag of an unintegrated acquisition long before a full platform migration is even scoped.
Every acquisition comes with a 100-day integration plan for finance, for HR, for sales territories. Almost none of them come with a 100-day integration plan for engineering — beyond "get everyone into Slack" and "figure out the org chart." Six months later, someone in the board meeting asks why the combined engineering org's average lead time for changes went up instead of down, and nobody has a good answer, because nobody was measuring the two orgs separately in the first place.
The Problem: You Inherited an Engineering Org, Not Just a Product
When Company A acquires Company B, leadership evaluates the product roadmap, the customer base, the revenue synergies. What gets far less scrutiny — until it's already a live problem — is that Company B's engineering org runs on a completely different Git platform, ships on a completely different cadence, and defines "code review" in a way that would be unrecognizable to Company A's engineers.
Different Git platforms, different issue trackers. One org runs GitHub and Jira. The other runs Bitbucket, or a GitLab instance nobody at the parent company has admin access to yet.
Different deployment cadences. One org deploys multiple times a day. The other ships a release every two to four weeks, because that's what its infrastructure and its culture were built around.
Different definitions of "shipped." One org's "done" means merged and deployed. The other's means merged, sitting in a staging branch, waiting for a manual release manager to cut a build.
A blended metric that hides both orgs. Averaging the two orgs' cycle times into a single "combined engineering velocity" number for the board deck doesn't show integration progress — it just makes the acquirer's org look worse and the acquired org look better than either actually is.
This is a distinct problem from the tooling fragmentation and platform fatigue that come with organic multi-team growth. In an acquisition, the gap didn't emerge slowly inside one culture — it was imported wholesale from a completely different one, on day one, with no ramp-up period.
The Developer Discussion: Nobody Warns You About This Part
Engineers who've lived through a post-acquisition integration describe the same disorienting first few months, regardless of which side of the deal they were on.
"Nobody tells you that 'we got acquired' actually means 'you now have to learn a second company's entire branching strategy, review culture, and CI setup, while also still shipping your own roadmap.' Six months in and I still don't know if our 'cycle time' number in the all-hands deck includes the other org or not. I've asked twice."
"The worst part wasn't the technical migration, it was that leadership kept comparing our deployment frequency to the parent company's like we were the same team with the same infrastructure. We were on a completely different Git platform with a manual release process they didn't even know existed until month four. Every 'why is your velocity lower' conversation started from a number that was never apples-to-apples in the first place."
The frustration isn't with the acquisition itself — it's with being measured against a standard nobody explained, using a blended metric that was never designed to separate the two orgs in the first place. That's exactly the gap a proper measurement approach needs to close before any culture or process conversation can even start.
Measuring the Gap With Keypup MCP: Five Views Into a Post-Acquisition Integration
The five examples below walk through how Keypup MCP Server surfaces the actual state of a post-acquisition engineering integration — not a single blended number, but a side-by-side comparison across DORA metrics, cycle time trends, tooling fragmentation, velocity convergence, and cost per feature. Each one answers a specific question a leadership team should be asking in the first two quarters after close.
1. Are the Two Orgs' DORA Metrics Actually Comparable — Or Wildly Apart?
Before any conversation about "catching up" can happen, leadership needs the two orgs' core delivery metrics side by side, not blended into one number that hides which org is driving the average.
Prompt to the Keypup platform
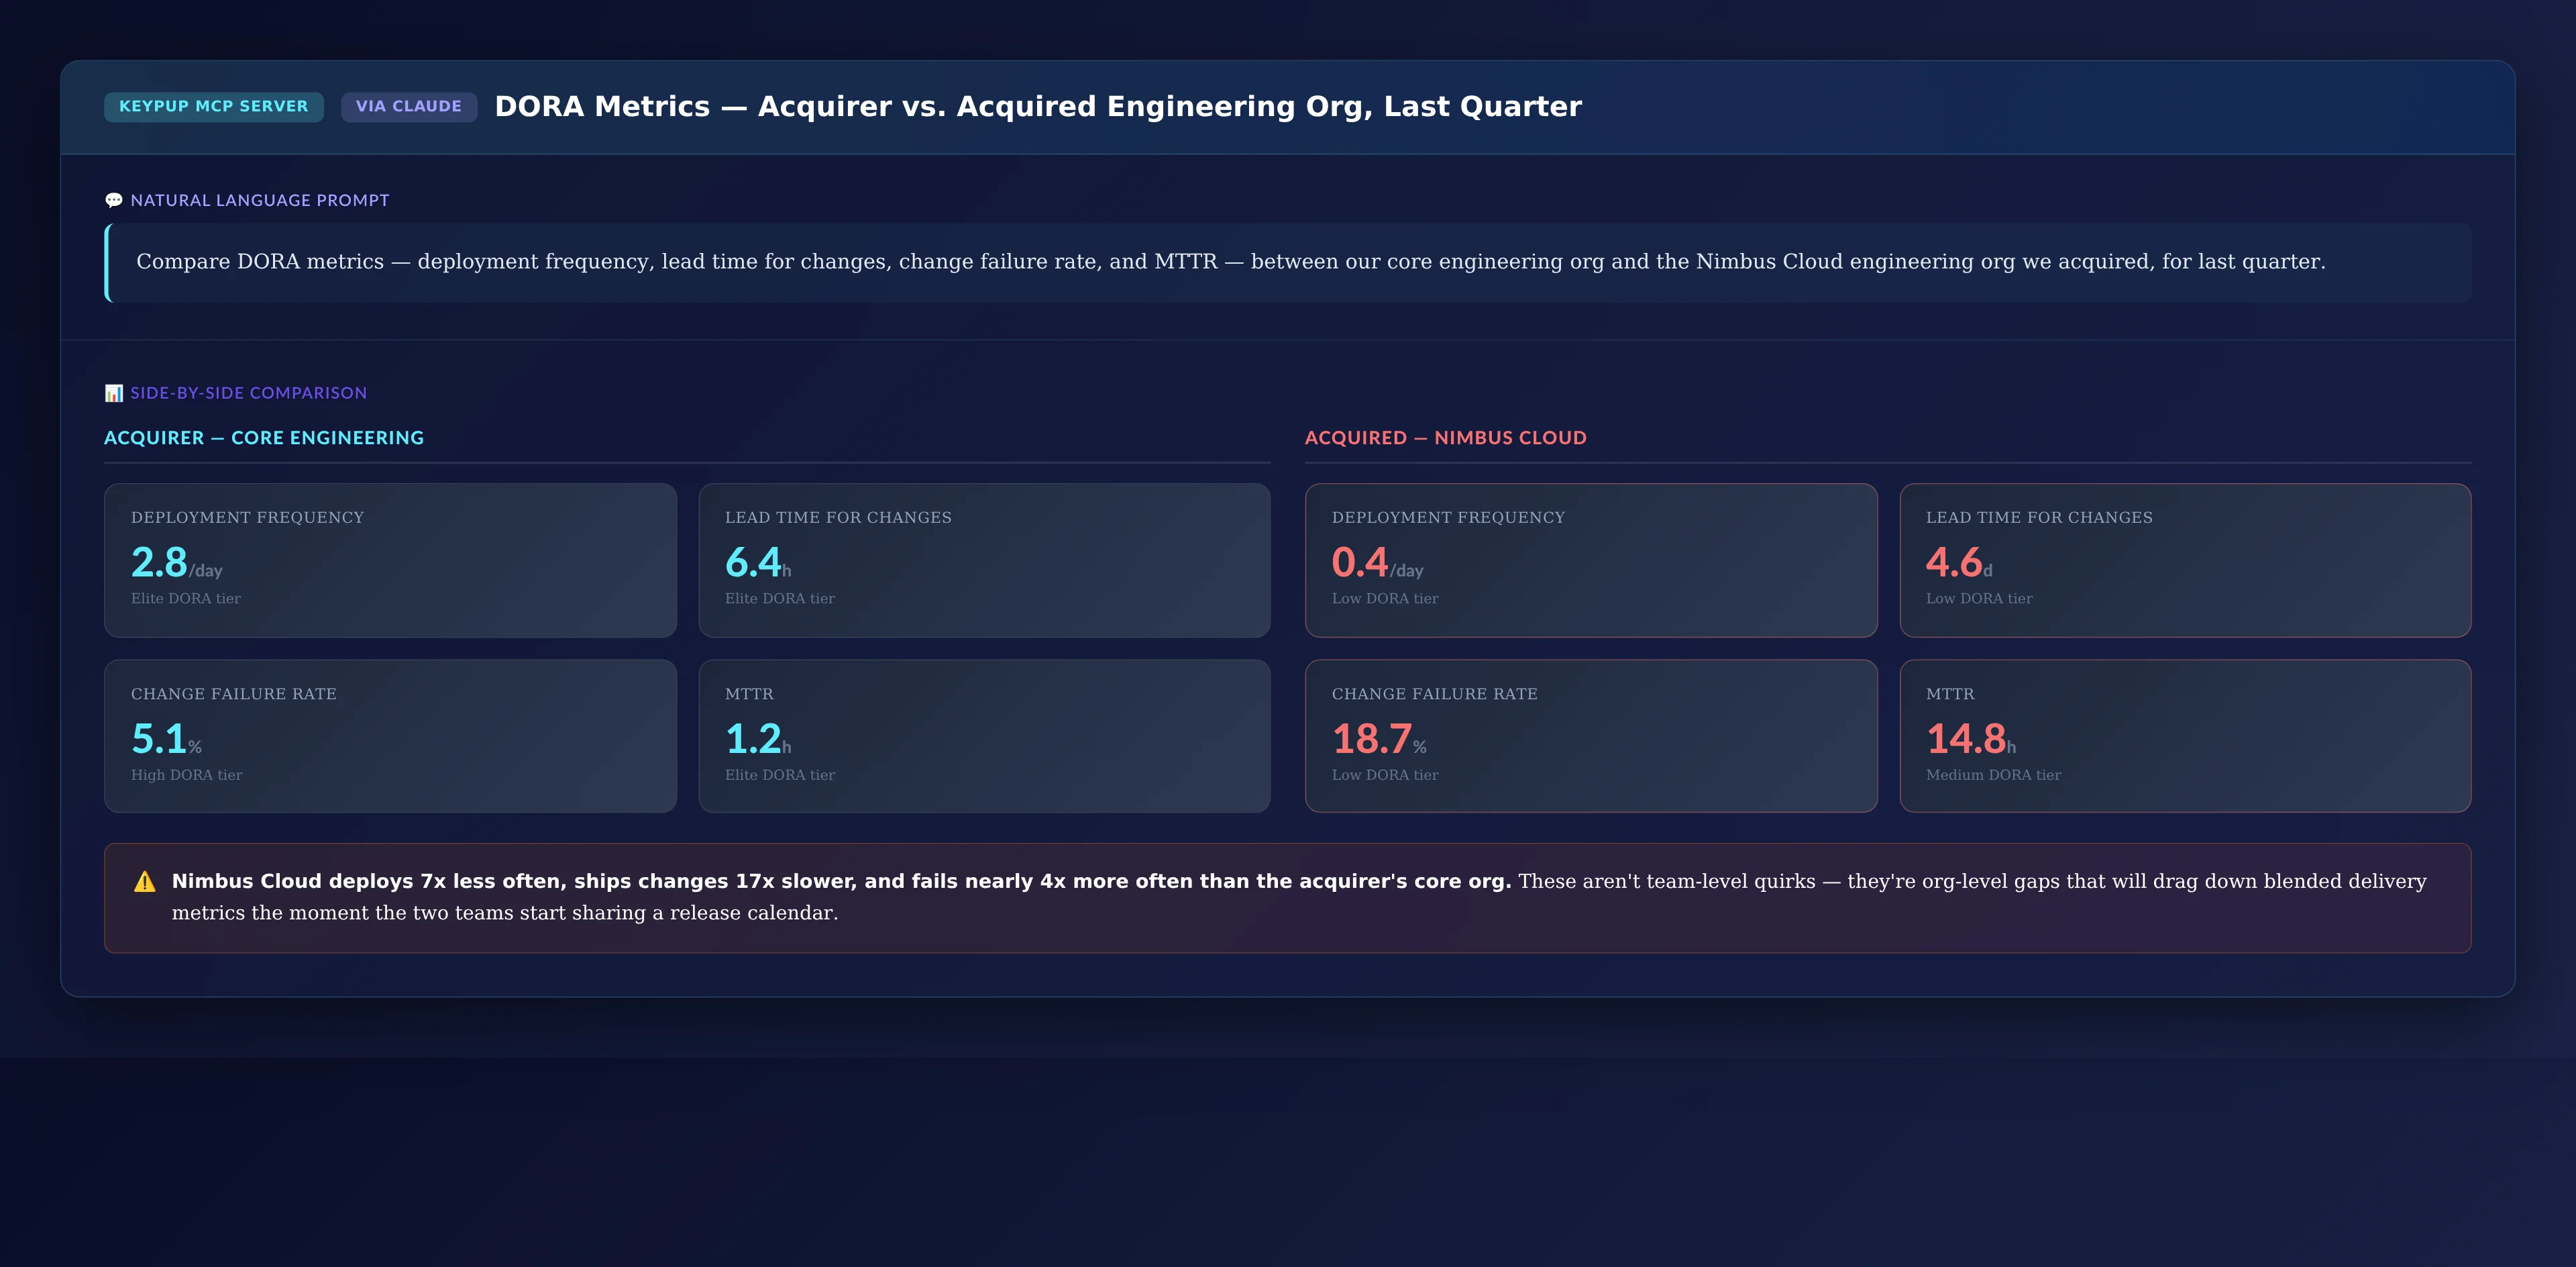
Compare DORA metrics — deployment frequency, lead time for changes, change failure rate, and MTTR — between our core engineering org and the Nimbus Cloud engineering org we acquired, for last quarter.
Analysis from Keypup AI
Key Insights 📊
Nimbus Cloud deploys 0.4 times per day against the core org's 2.8, ships changes in 4.6 days against 6.4 hours, and fails changes at 18.7% against 5.1%. Every DORA metric points the same direction: this is not a team-level performance gap, it's an org-level infrastructure and process gap.
⚠️ Bottlenecks and Problem Areas
The change failure rate gap (18.7% vs. 5.1%) is the most operationally dangerous of the four, because it's the one most likely to surface as a customer-facing incident the moment the two orgs start sharing a release calendar or a shared codebase.
💡 Recommendations
Report these four metrics separately for both orgs in every leadership review until they converge — never blend them into a single "combined engineering" number. A blended number this early in an integration measures nothing except how much bigger the acquirer's org is.
🚀 Priority Actions
Set explicit quarterly DORA convergence targets for Nimbus Cloud, not just "improve."
Freeze any shared release train between the two orgs until change failure rate closes to within 2x.
Assign a named engineering integration lead accountable for tracking this gap monthly, separate from the general integration PMO.
2. Is Cycle Time Actually Converging, or Just Looking Better on Paper?
A single snapshot of cycle time tells you where the gap is today. A trend across the integration timeline tells you whether the gap is closing — and how fast.
Prompt to the Keypup platform
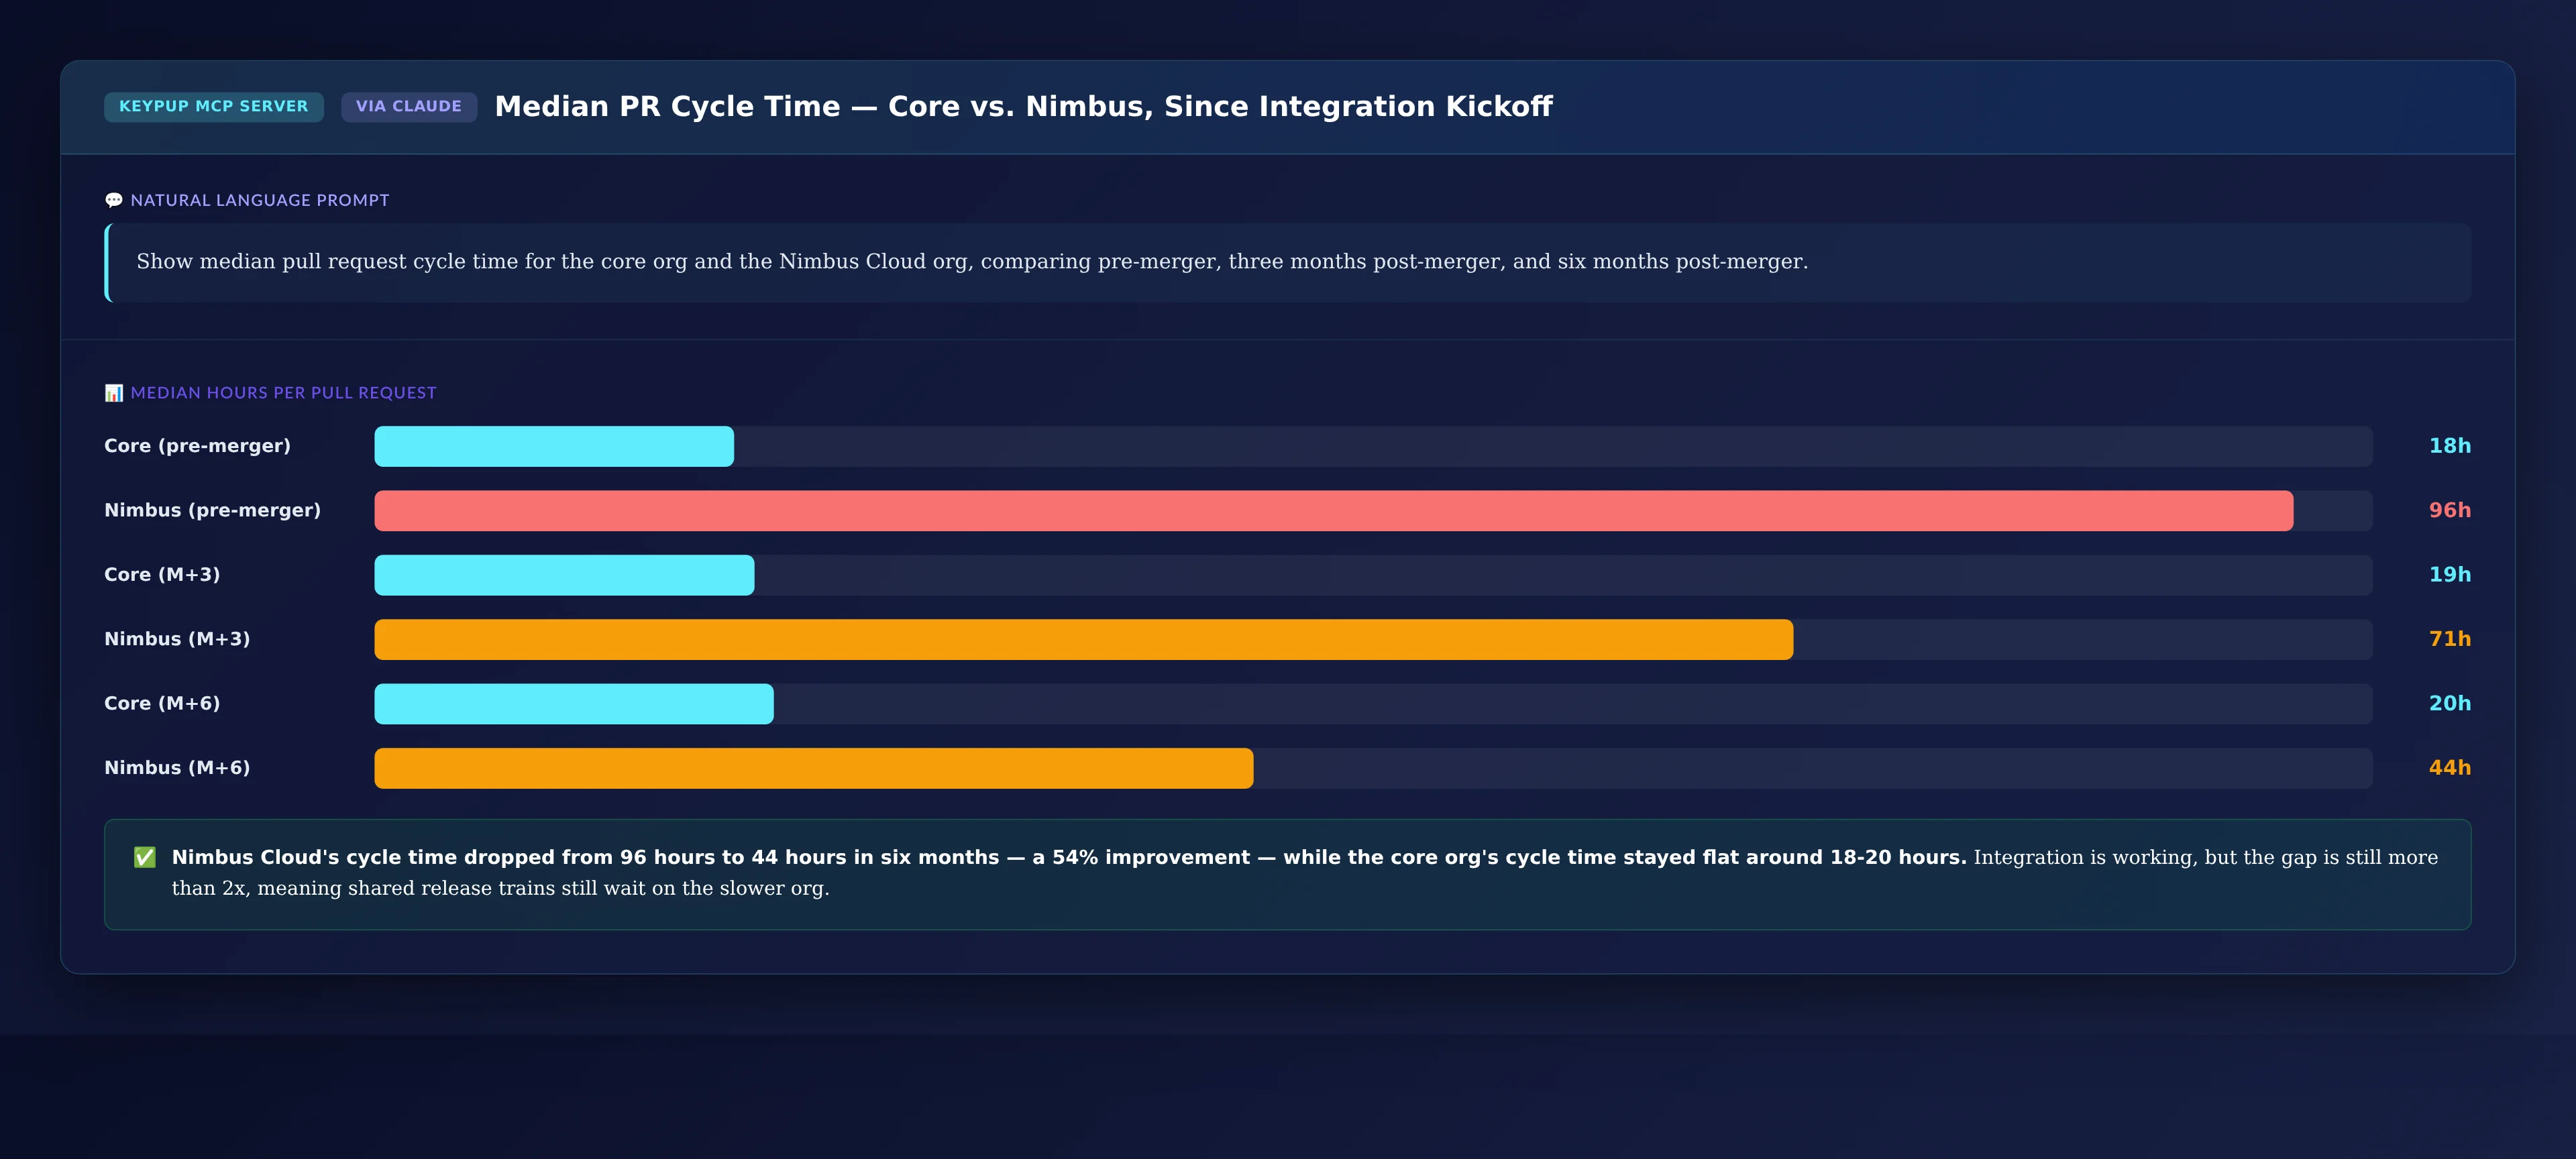
Show median pull request cycle time for the core org and the Nimbus Cloud org, comparing pre-merger, three months post-merger, and six months post-merger.
Analysis from Keypup AI
Key Insights 📊
Nimbus Cloud's median PR cycle time dropped from 96 hours pre-merger to 44 hours at six months — a 54% improvement. The core org's cycle time held essentially flat around 18-20 hours across the same window, meaning Nimbus is closing the gap without the core org needing to slow down to meet it.
⚠️ Bottlenecks and Problem Areas
44 hours is still more than double the core org's baseline. Any cross-org pull request, or any shared release train that depends on both orgs merging on the same day, is still effectively gated by Nimbus's slower cycle time.
💡 Recommendations
Extrapolate the current convergence rate rather than treating "improving" as sufficient on its own. At this pace, Nimbus reaches parity with the core org in roughly three additional months — a concrete number for the steering committee instead of a qualitative "getting better."
🚀 Priority Actions
Set a numeric cycle time parity target with a date, not an open-ended "continue improving."
Interview Nimbus's engineers about what specifically changed between month 0 and month 6 — replicate whatever process fix drove the 54% drop.
Delay any shared release train commitment until cycle time closes to within 1.5x of the core org's baseline.
3. How Fragmented Is Tooling Across the Combined Org, Right Now?
Before comparing cultures or processes, leadership needs a hard count of how many different platforms the combined engineering org is actually running on — because every other cross-org metric has to be normalized across whatever that number turns out to be.
Prompt to the Keypup platform
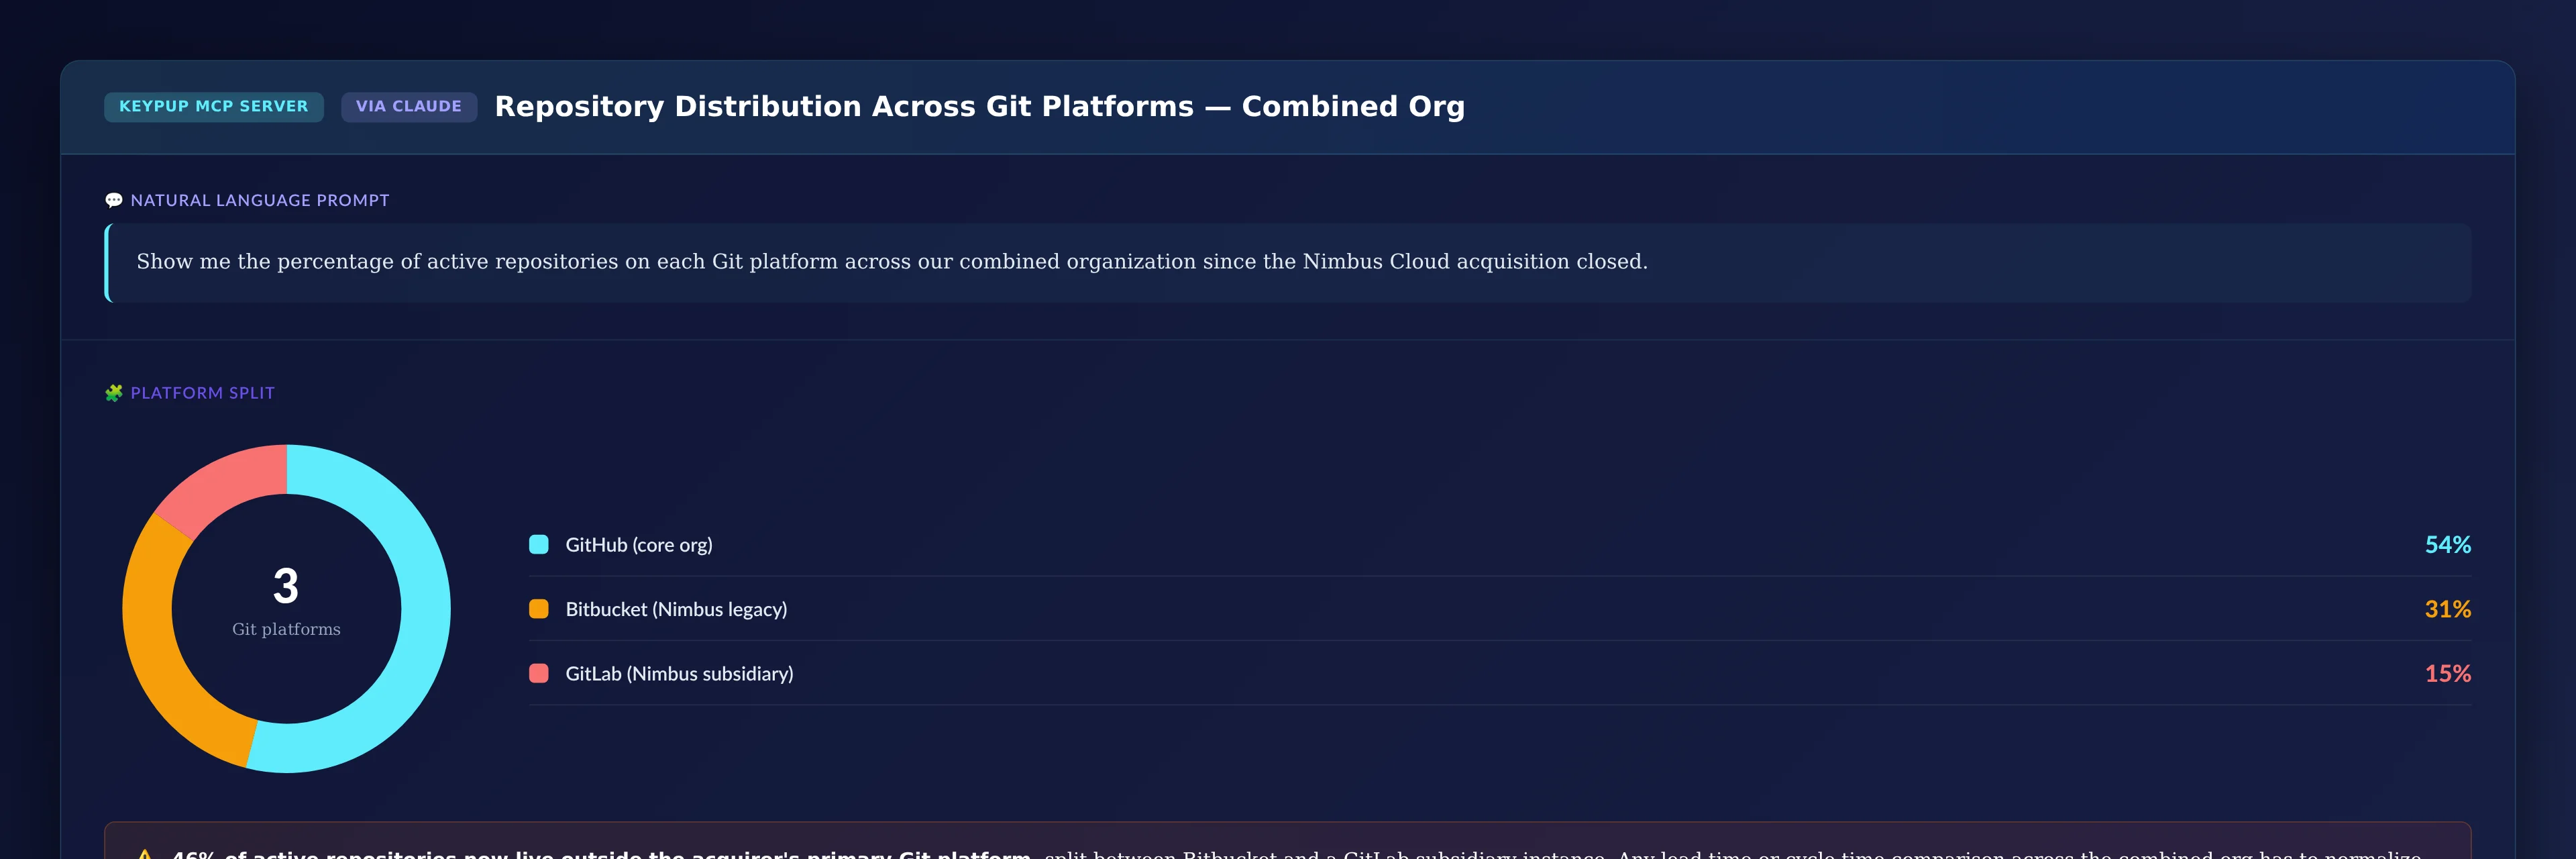
Show me the percentage of active repositories on each Git platform across our combined organization since the Nimbus Cloud acquisition closed.
Analysis from Keypup AI
Key Insights 📊
46% of active repositories now sit outside the acquirer's primary Git platform — split between a Bitbucket instance inherited from Nimbus Cloud directly and a GitLab instance from a smaller subsidiary Nimbus had itself acquired two years earlier. This is a two-layer fragmentation problem, not a single migration.
⚠️ Bottlenecks and Problem Areas
Any lead time, cycle time, or deployment frequency comparison across the combined org currently has to reconcile data models across three separate Git platforms before the numbers mean anything. Without that reconciliation, "combined org velocity" is not a real metric — it's an average of incompatible measurements.
💡 Recommendations
Treat platform consolidation as a prerequisite for trustworthy combined-org reporting, not a nice-to-have cleanup task for later. Every quarter this stays at 46% fragmented is another quarter of board-level metrics built on an unreliable foundation.
🚀 Priority Actions
Sequence the GitLab subsidiary migration first — it's the smallest slice and the easiest proof of concept for the larger Bitbucket migration.
Stand up unified reporting across all three platforms in parallel with migration, so leadership isn't blind during the transition.
Set a hard deadline for single-platform consolidation and track fragmentation percentage as its own board-level metric until it hits zero.
4. Is the Velocity Gap Actually Closing, and How Fast?
Cycle time and DORA metrics show operational health. A normalized velocity index tracked monthly shows whether the acquired org's output is actually catching up to the acquirer's — the single number a steering committee usually wants most.
Prompt to the Keypup platform
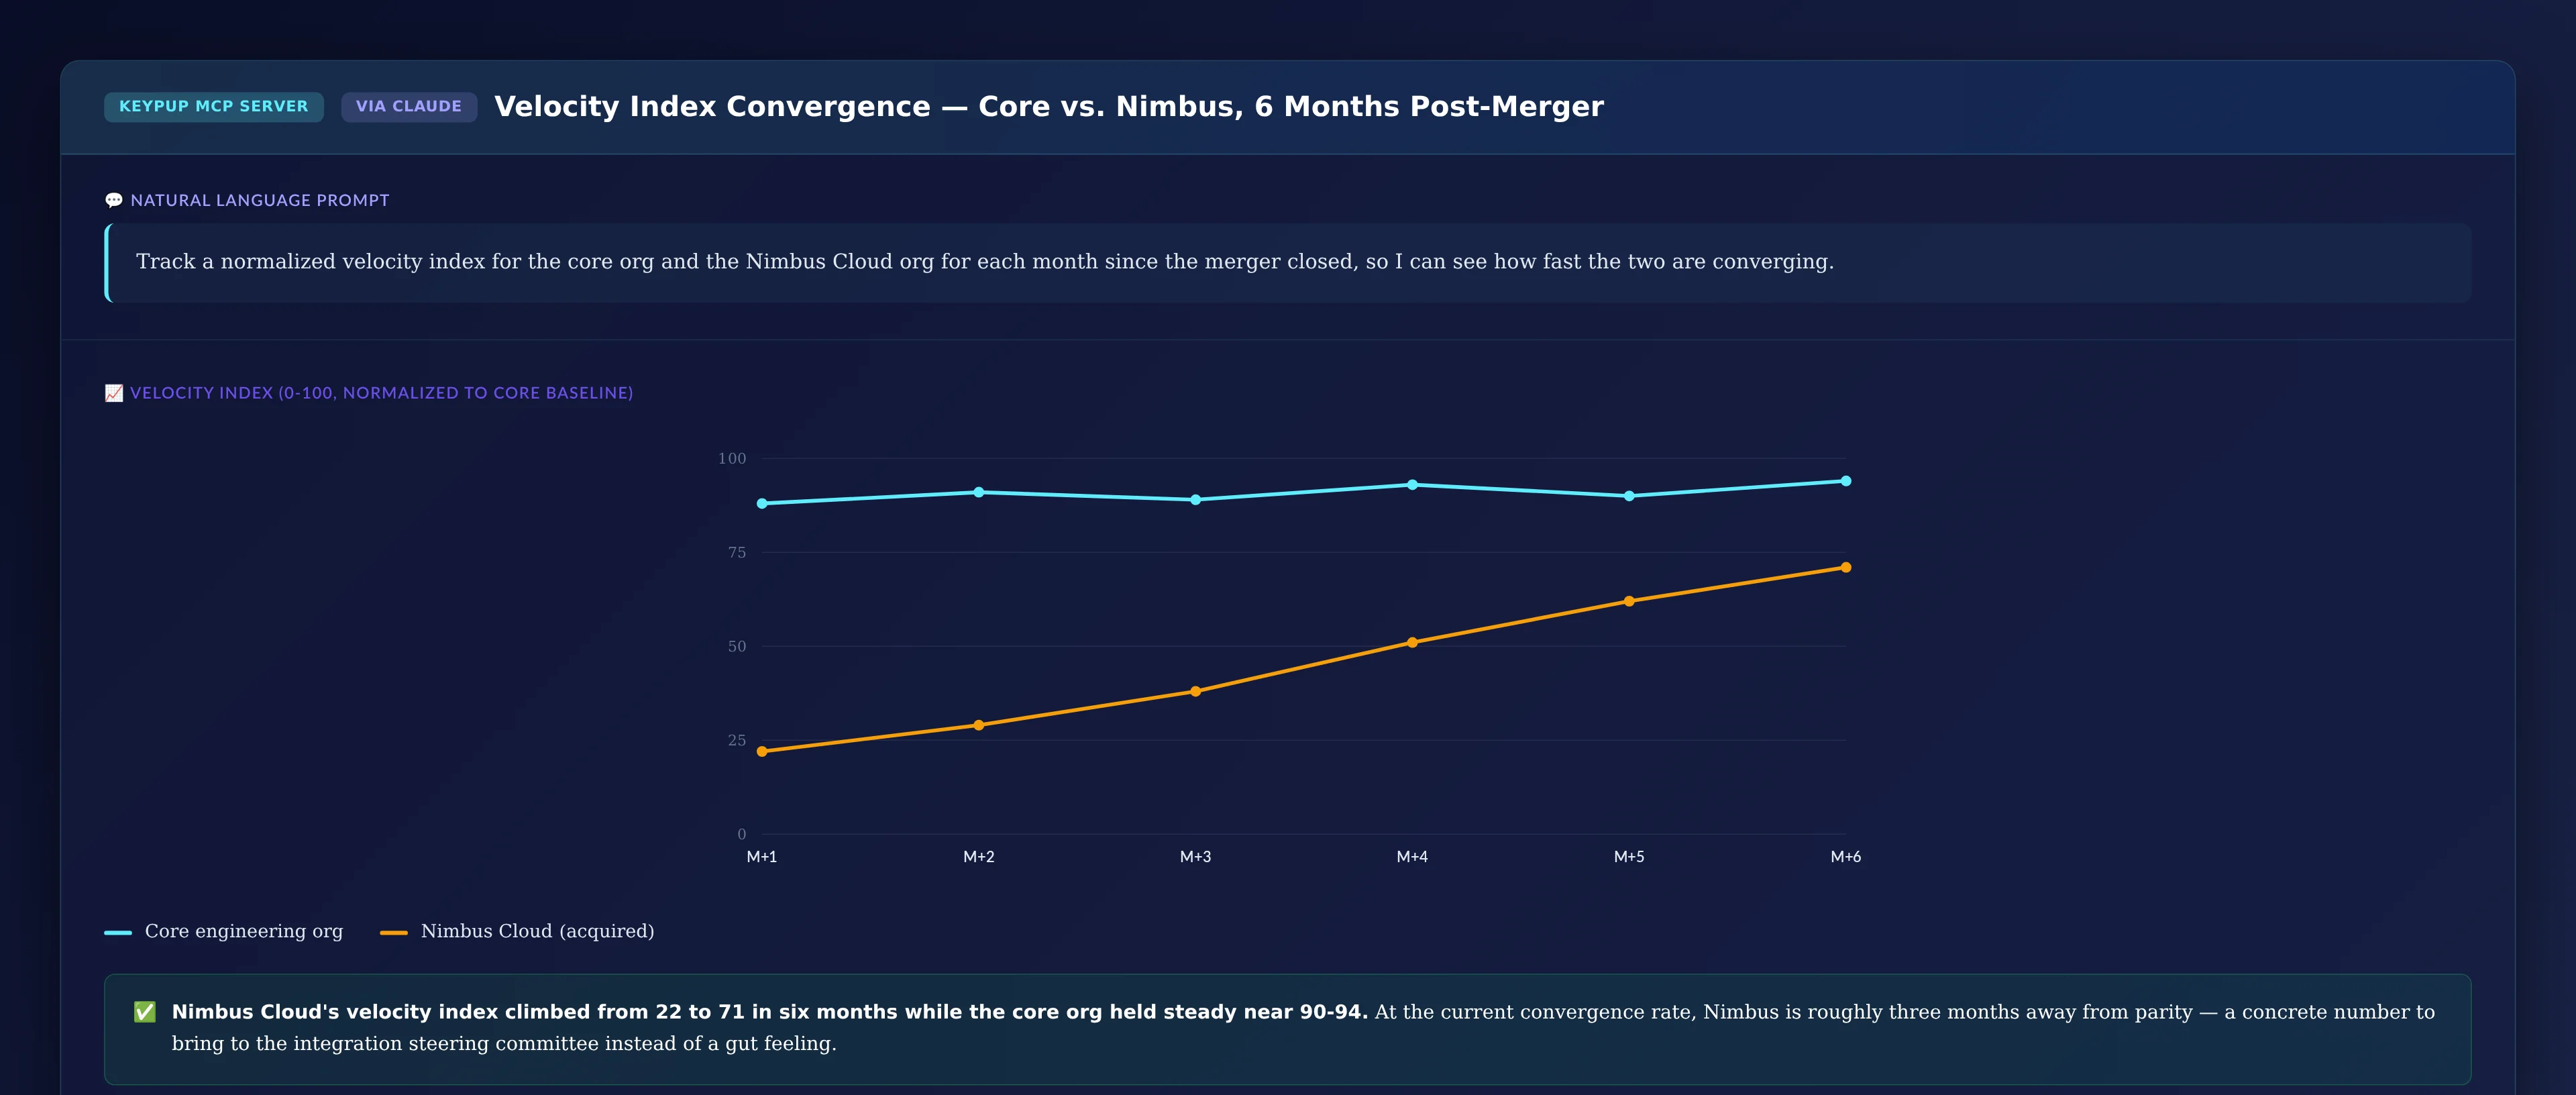
Track a normalized velocity index for the core org and the Nimbus Cloud org for each month since the merger closed, so I can see how fast the two are converging.
Analysis from Keypup AI
Key Insights 📊
Nimbus Cloud's velocity index climbed from 22 to 71 over six months — more than tripling — while the core org held steady in the high 80s to low 90s the entire time. The convergence trend is real, consistent, and month-over-month positive, not a one-time spike.
⚠️ Bottlenecks and Problem Areas
A 71 vs. a low-90s baseline still leaves roughly a 20-point gap. Whatever caused the early acceleration (months 2-4 show the steepest climb) has slowed slightly in the most recent month, which is worth investigating before assuming the trend continues linearly.
💡 Recommendations
Use the monthly convergence rate to set a data-backed, rather than aspirational, full-parity date for the next board update — roughly three months out at the current trajectory, not "sometime next year."
🚀 Priority Actions
Investigate what drove the deceleration in the most recent month before it becomes a pattern.
Share the convergence chart directly with Nimbus's engineering leadership as a morale and progress signal — the improvement is real and worth recognizing.
Re-run this comparison monthly and flag any month where the gap widens instead of narrows.
5. What Is the Blended Squad Actually Costing, Per Feature?
Once teams start mixing — a shared squad with engineers from both orgs — cost per shipped feature reveals whether integration is paying off yet, or whether it's still adding overhead without adding output.
Prompt to the Keypup platform
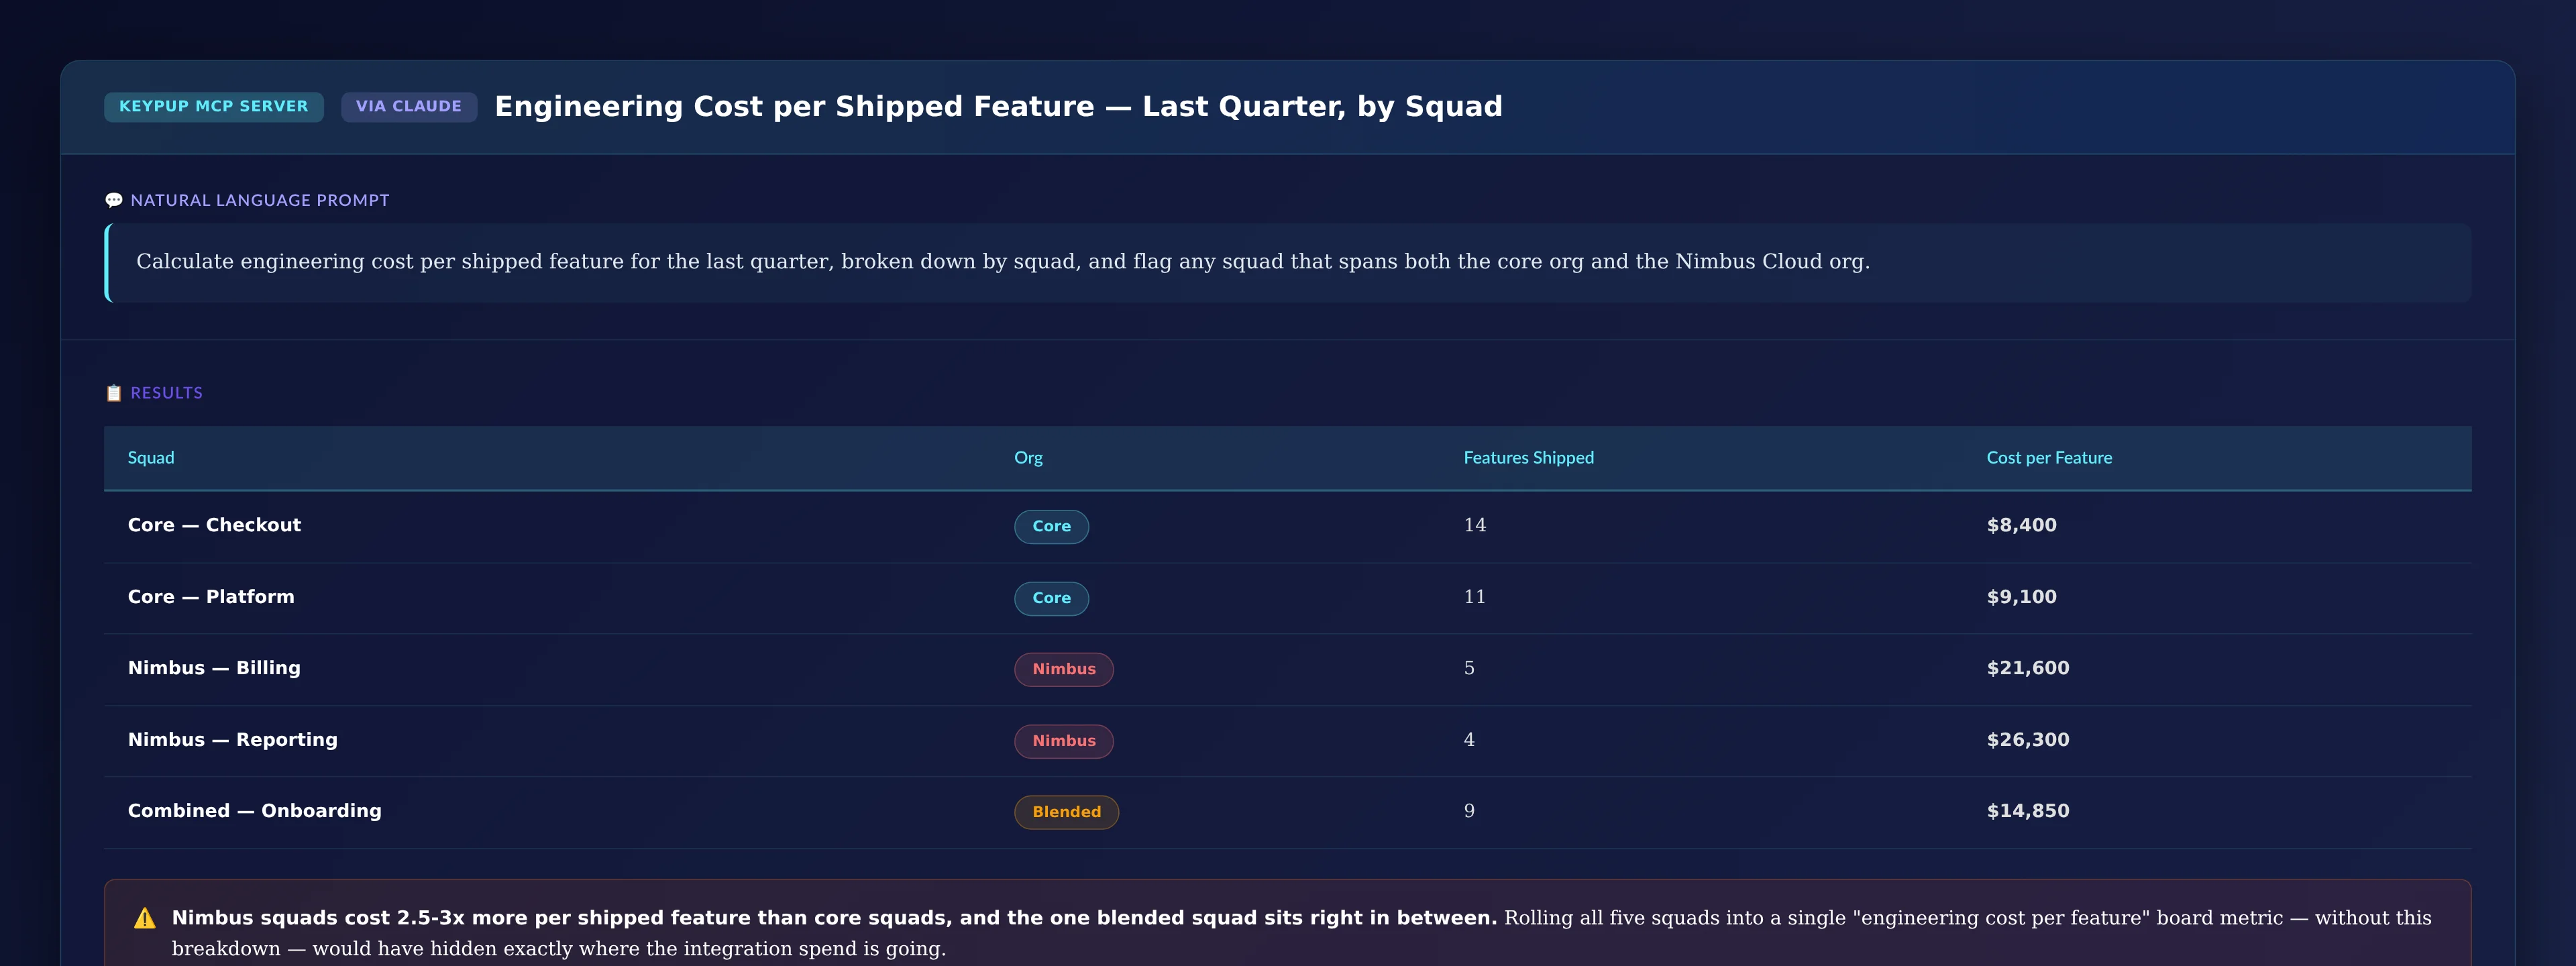
Calculate engineering cost per shipped feature for the last quarter, broken down by squad, and flag any squad that spans both the core org and the Nimbus Cloud org.
Analysis from Keypup AI
Key Insights 📊
Nimbus Cloud squads cost 2.5 to 3 times more per shipped feature than core org squads ($21,600-$26,300 vs. $8,400-$9,100). The one blended squad, mixing engineers from both orgs, lands almost exactly in the middle at $14,850 — neither as efficient as the core org nor as expensive as pure Nimbus squads.
⚠️ Bottlenecks and Problem Areas
Rolling all five squads into a single "engineering cost per feature" number for the board deck — without this breakdown — would have hidden exactly where the integration spend is concentrated, and made it impossible to tell whether blending teams is actually helping.
💡 Recommendations
Treat the blended squad's mid-point cost as an early signal that team-blending accelerates convergence faster than parallel-but-separate teams do. Use it as evidence for or against expanding the blended-squad model to more of Nimbus Cloud's org.
🚀 Priority Actions
Track the blended squad's cost per feature monthly to confirm the mid-point trend holds rather than drifting toward the more expensive end.
Pilot one additional blended squad next quarter and compare its convergence rate to this one.
Report cost per feature by squad, not by org average, in every post-acquisition financial review.
Why Blended Metrics Are the Wrong First Step
The instinct after an acquisition is to fold the two engineering orgs into a single reporting structure as fast as possible — one combined dashboard, one combined velocity number, one combined DORA scorecard. That instinct is understandable and almost always premature.
A blended average hides which org is driving it. A "combined 1.6 deployments per day" tells leadership nothing about whether that's the core org at 2.8 dragged down by Nimbus at 0.4, or two orgs both genuinely averaging 1.6.
It removes the ability to measure convergence. If the two orgs are never measured separately, there's no way to show the board that the gap from month 1 to month 6 actually narrowed — the story just becomes "our numbers are fine," which isn't the same as "integration is working."
It punishes the acquirer's org unfairly. Every quarter the acquired org's metrics stay well below baseline, the blended number drags the acquirer's previously elite-tier metrics down with it — creating pressure on the wrong team to "fix" a problem that isn't theirs.
It hides where integration spend should actually go. Cost per feature broken out by squad, as shown above, only means anything when it isn't averaged across squads with wildly different starting points.
The fix isn't complicated, but it does require discipline: measure both orgs separately, on the same set of metrics, on the same cadence, for as long as it takes to see real convergence — and only blend the numbers once that convergence is actually complete.
FAQ: Measuring Engineering Integration After an Acquisition
How long should we measure the two orgs separately before blending metrics?
Until DORA metrics and cycle time close to within roughly 1.5-2x of each other, not a fixed calendar deadline. Some integrations converge in two quarters; others, especially with heavy tooling fragmentation, take three to four.
What's the single most important metric to track first?
Change failure rate. It's the metric most likely to become a customer-facing incident the moment the two orgs start sharing infrastructure, a release calendar, or a codebase — and it's often the widest gap of the four DORA metrics in the first quarter post-close.
Should we force the acquired org onto our Git platform immediately?
Not immediately, but sequence it early. Trying to run cross-org comparisons across two or three different Git platforms indefinitely means every velocity or cycle time number needs manual reconciliation before anyone can trust it.
How do we know if a blended squad is actually working?
Track its cost per shipped feature and cycle time against both orgs' baselines separately. A blended squad landing between the two baselines, and trending toward the acquirer's baseline over time, is a strong signal the model is working.
What if the acquired org's metrics never fully converge?
That's a legitimate finding, not a failure of the measurement approach — some gaps are structural (different customer base, different regulatory environment, different codebase age) and won't close through process alone. The goal is knowing that early, not hoping it resolves itself.
Does Keypup integrate directly with the acquired org's separate tools during the transition?
Yes — Keypup connects to GitHub, GitLab, Bitbucket, and Azure DevOps for Git repositories, and Jira, GitHub Projects, Trello, and ClickUp for project tracking, so both orgs' existing tools can be measured on the same platform before any migration is complete.
Who should own tracking this gap — the integration PMO or engineering leadership?
Engineering leadership, with visibility shared into the broader integration PMO. The PMO tracks the overall deal timeline; engineering leadership needs the operational detail to make weekly decisions about release trains, shared squads, and platform sequencing.
How often should leadership see this comparison?
Monthly for the first two quarters, then quarterly once the trend is stable and the gap is meaningfully closing. Waiting for a single post-integration retrospective misses the window to course-correct while it still matters.
The Bottom Line
Acquiring a company means acquiring its engineering org's entire delivery reality — its Git platform, its release cadence, its definition of "done," and its DORA metrics, whatever they happen to be on day one. Pretending the two orgs are already one team, measured on one blended dashboard, doesn't accelerate integration. It just hides how far apart they actually are, and how fast — or slowly — that gap is closing. Measuring both orgs separately, on the same metrics, from the day the deal closes, is what turns "integration is going fine" from a hope into a number leadership can actually act on.
Keywords: post-acquisition engineering integration, M&A DORA metrics comparison, engineering org merger integration, acquired engineering team velocity, Keypup MCP server acquisition analytics, blended engineering metrics risk, engineering cost per feature acquisition, tooling fragmentation post-merger, Git platform consolidation acquisition, engineering integration cycle time convergence
Ready to Transform Your Analytics?
Join teams already using AI to make data-driven decisions faster than
ever.
Every enterprise engineering org absorbs CVE patching, dependency upgrades, and vendor-driven security fixes as "just part of the job" — and none of it shows up on a roadmap. When sprint velocity drops, leadership reads it as a productivity problem. Discover how Keypup MCP surfaces the hidden vulnerability remediation tax, separates it from real engineering decline, and gives leadership the data to staff for it instead of penalizing teams for it.
Keypup's MCP server now connects directly to ChatGPT and Claude, letting engineering leaders ask plain-language questions about DORA metrics, cycle time, throughput, and team performance and get instant, formatted answers — charts, tables, and KPIs included. This guide walks through how both integrations work, the concrete benefits over traditional dashboards, and five real prompt-and-output examples spanning delivery velocity, quality, cycle time, and team performance.
Enterprise releases don't move straight from commit to production — they queue through Integration, QA, UAT, Staging, and Pre-Prod, shared environments too expensive to replicate per team. Contention creates massive queues while staging drift causes builds to fail for reasons that have nothing to do with code quality. Standard SDLC analytics blame engineering for the resulting spike in Time to Release. Discover how Keypup MCP separates real code defects from environment queue wait and configuration drift, so leadership stops penalizing teams for infrastructure problems.