Pre-Production Environment Contention and Staging Drift: Why "Time to Release" Is Lying to You
Enterprise releases don't move straight from commit to production — they queue through Integration, QA, UAT, Staging, and Pre-Prod, shared environments too expensive to replicate per team. Contention creates massive queues while staging drift causes builds to fail for reasons that have nothing to do with code quality. Standard SDLC analytics blame engineering for the resulting spike in Time to Release. Discover how Keypup MCP separates real code defects from environment queue wait and configuration drift, so leadership stops penalizing teams for infrastructure problems.
TL;DR: Standard SDLC analytics treat the path from commit to production as one continuous pipeline. In large enterprises, it isn't — every release candidate has to navigate a gauntlet of shared pre-production environments (Integration, QA, UAT, Staging, Pre-Prod) that are too expensive to fully replicate per team. Contention for those shared environments creates multi-day queues, and "environment drift" — staging configuration silently diverging from production — causes builds to fail for reasons that have nothing to do with the release candidate. When "Time to Release" spikes, management assumes the code was buggy. The Keypup MCP Server separates actual coding time from environment queue wait and drift troubleshooting time, and traces every build failure back to its real root cause — so releases stop getting measured against a metric that's mostly measuring infrastructure scarcity.
Ask a developer at a large bank, insurer, or telco why their last release took eleven days, and you'll rarely hear about a hard bug. You'll hear about three days waiting for a UAT slot, and two more chasing a config mismatch nobody on the team introduced.
The Friction: A Pipeline That Isn't Actually a Pipeline
Standard SDLC dashboards model software delivery as a single continuous flow: commit, build, test, release. That model assumes every team can spin up its own full-fidelity test environment on demand. Large enterprises can't — replicating legacy mainframes, multi-tenant databases, and third-party integration endpoints per team is prohibitively expensive, so a limited number of shared pre-production environments serve every team at once.
Environments are scarce, shared infrastructure — not steps in a pipeline. Integration, QA, UAT, Staging, and Pre-Prod are usually single shared clusters serving five, six, sometimes a dozen teams simultaneously. A release candidate doesn't move through them on demand; it waits in line behind whoever got there first.
Contention creates queues that look like delivery problems. When six teams need the same UAT slot to run end-to-end tests against a shared legacy mainframe test double, someone is always waiting — often for days — with nothing to do but wait.
Environment drift silently breaks builds that aren't broken. Staging and UAT configurations drift out of sync with production over time — stale feature flags, outdated schema versions, expired certificates, out-of-date test data snapshots. A release candidate can fail its pre-release build for reasons that have zero relationship to the quality of its code.
Standard analytics can't tell the difference. A build failure is a build failure, whether it's a null pointer exception or a certificate that expired in a staging environment nobody's job it is to maintain. "Time to Release" balloons either way, and the dashboard reports it identically.
The result is a metric that faithfully reports queue length and configuration entropy while being read, almost universally, as a verdict on engineering quality.
Why This Matters: Punishing Teams for Infrastructure Scarcity
The Misdiagnosis Problem
When leadership sees "Time to Release" spike, the instinctive response is to ask engineering to move faster or write more tests. Neither addresses the actual cause — a queue for a shared UAT cluster, or a staging environment two schema versions behind production. Teams get pressured to fix a problem they don't control.
The Invisible-Work Problem
Days spent waiting for an environment slot, or troubleshooting a configuration mismatch that turns out to be nobody's code defect, don't show up anywhere as "work." They just show up as a longer release — indistinguishable, on paper, from a team that spent those days writing bad code.
The Investment Problem
Without a metric that separates queue wait and drift from actual engineering effort, there's no data-backed case for what would actually fix the problem: a dedicated environment slot, better environment configuration management, or investment in environment-as-code. The budget conversation never happens because the dashboard never surfaces the real cause.
The Enterprise Discussion: What Engineers Are Actually Saying
This exact frustration is a recurring theme wherever engineers at large, tightly regulated enterprises compare notes on release pipelines.
Senior Engineer, Insurance Platform Team (r/ExperiencedDevs)
"Our 'Time to Release' dashboard doesn't have a concept of 'waiting for an environment.' It just has one continuous clock that starts at first commit. Last release, three days of that clock was six teams fighting over the one UAT cluster that has access to the mainframe test double. Leadership saw the number and asked why my team's velocity had dropped."
DevOps Lead, Regional Bank (r/devops)
"We failed a pre-release build twice last sprint because staging's TLS trust chain was out of date — a config problem, zero to do with the release candidate. Both failures got logged as 'build failed' with no distinction from an actual defect. On paper it looks like our code quality is slipping. In reality nobody owns keeping staging in sync with prod, so it drifts, and we pay for it every release."
The pattern holds: the actual cause is rarely a mystery to the engineers living it — it's invisible only to the metric. Nobody needs to investigate why a release was slow; they already know. What's missing is a way to make that knowledge show up in the numbers automatically, every time, instead of relying on a developer to explain it after the fact in a status meeting.
How Keypup MCP Solves Environment Contention and Staging Drift
The Keypup Model Context Protocol (MCP) Server separates the three things a "Time to Release" number actually contains — coding time, shared environment queue wait, and configuration drift troubleshooting — and traces every pre-release build failure back to its true root cause, whether that's a release candidate defect or an environment problem no developer could have prevented.
1. Decomposing Time to Release Into What It Actually Measures
Before anything else, leadership needs to see how much of the reported number is even about code.
MCP Prompt:
Break down our average Time to Release for the last quarter into
actual coding time, shared environment queue wait time, and
environment drift troubleshooting time.
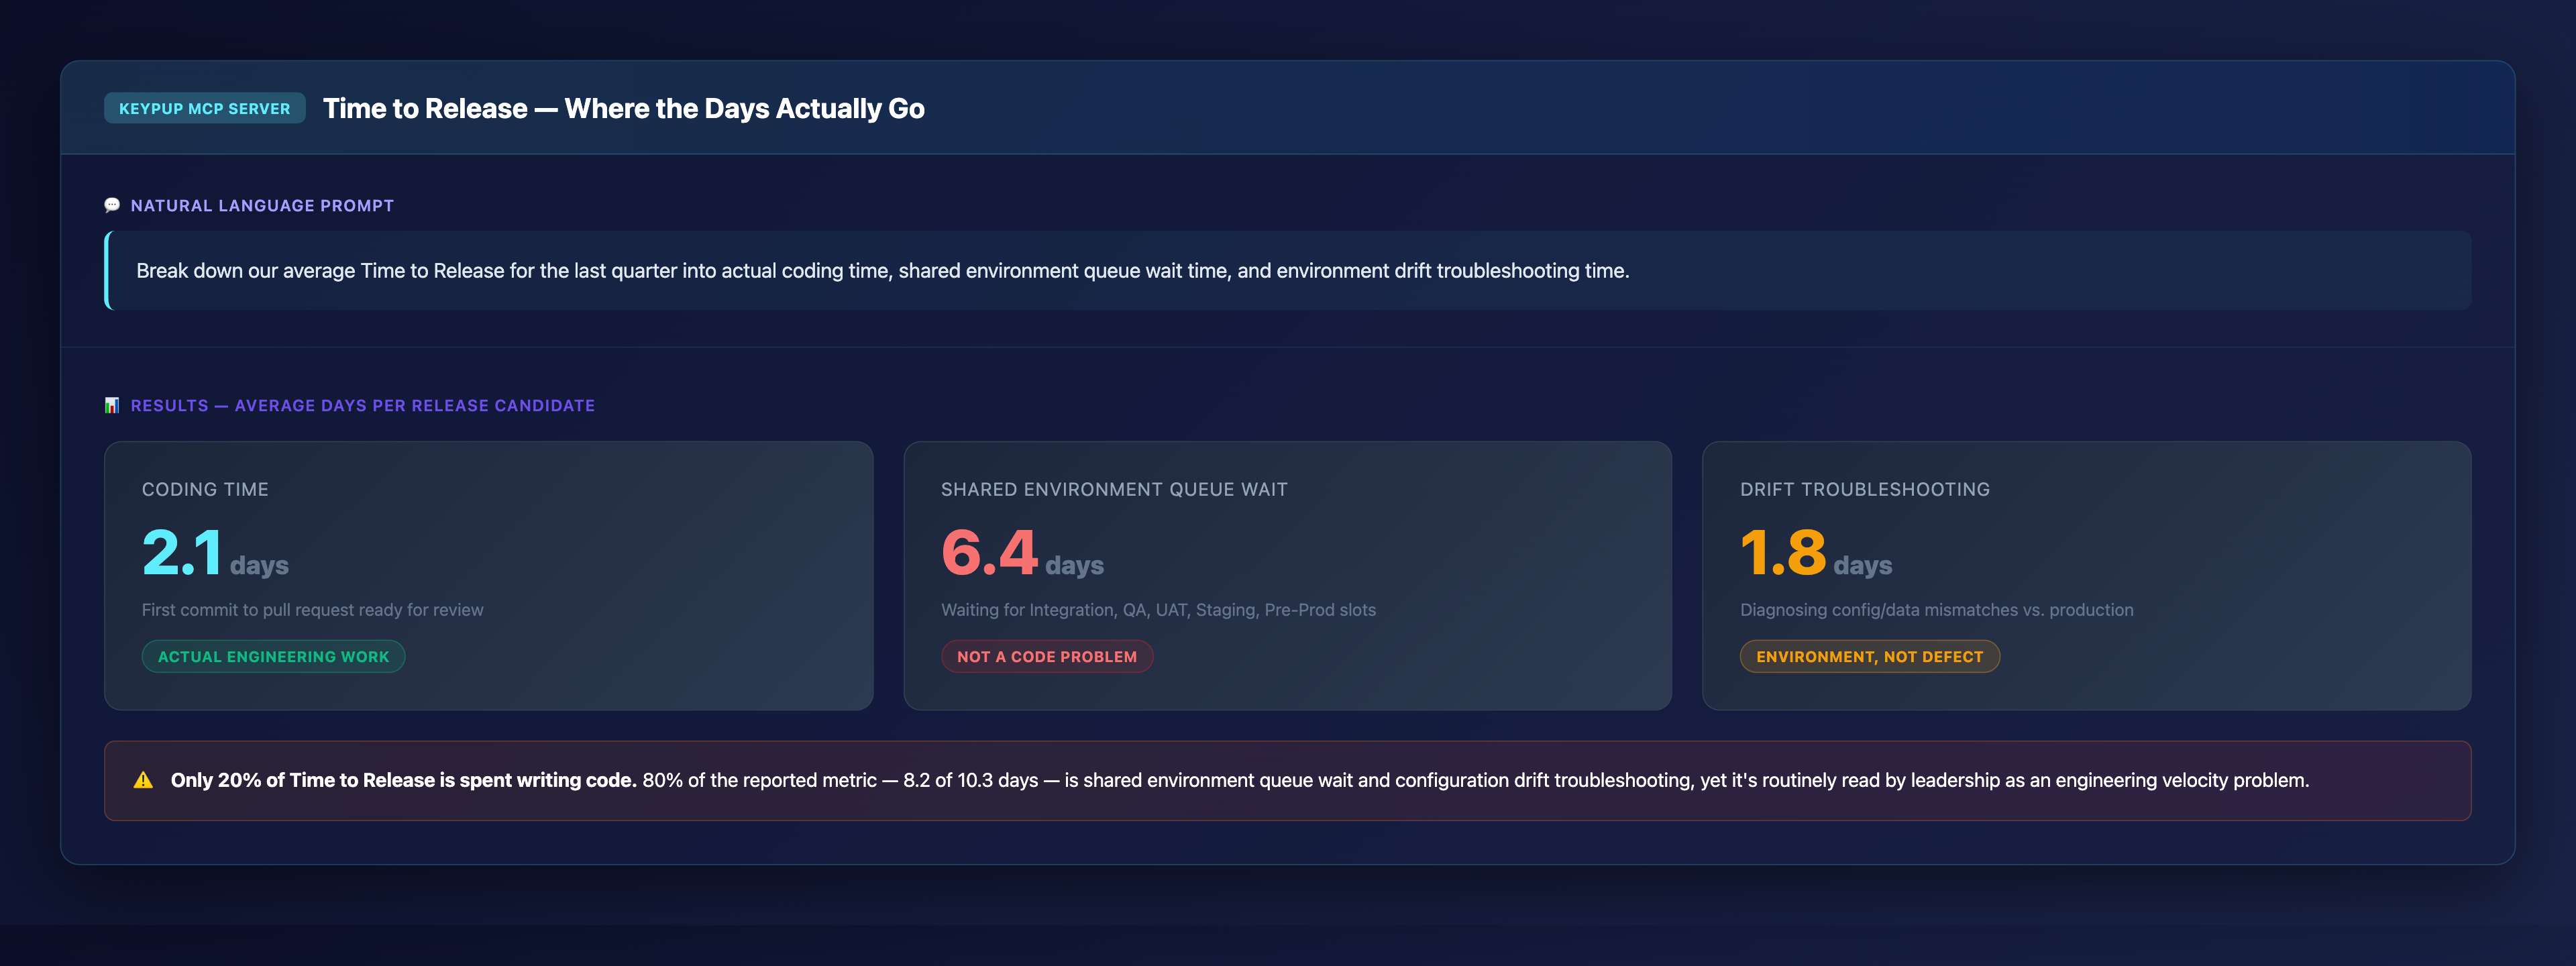
Output: Time to Release — Where the Days Actually Go
Key Insight: Only 20% of Time to Release is spent writing code. 80% of the reported metric — 8.2 of 10.3 days — is shared environment queue wait and configuration drift troubleshooting, yet it's routinely read by leadership as an engineering velocity problem.
2. Ranking the Shared Environments by How Much They Actually Cost
Once queue wait is visible as its own number, the next question is which environment is the actual bottleneck.
MCP Prompt:
Show average queue wait time in hours for each shared
pre-production environment over the last month.
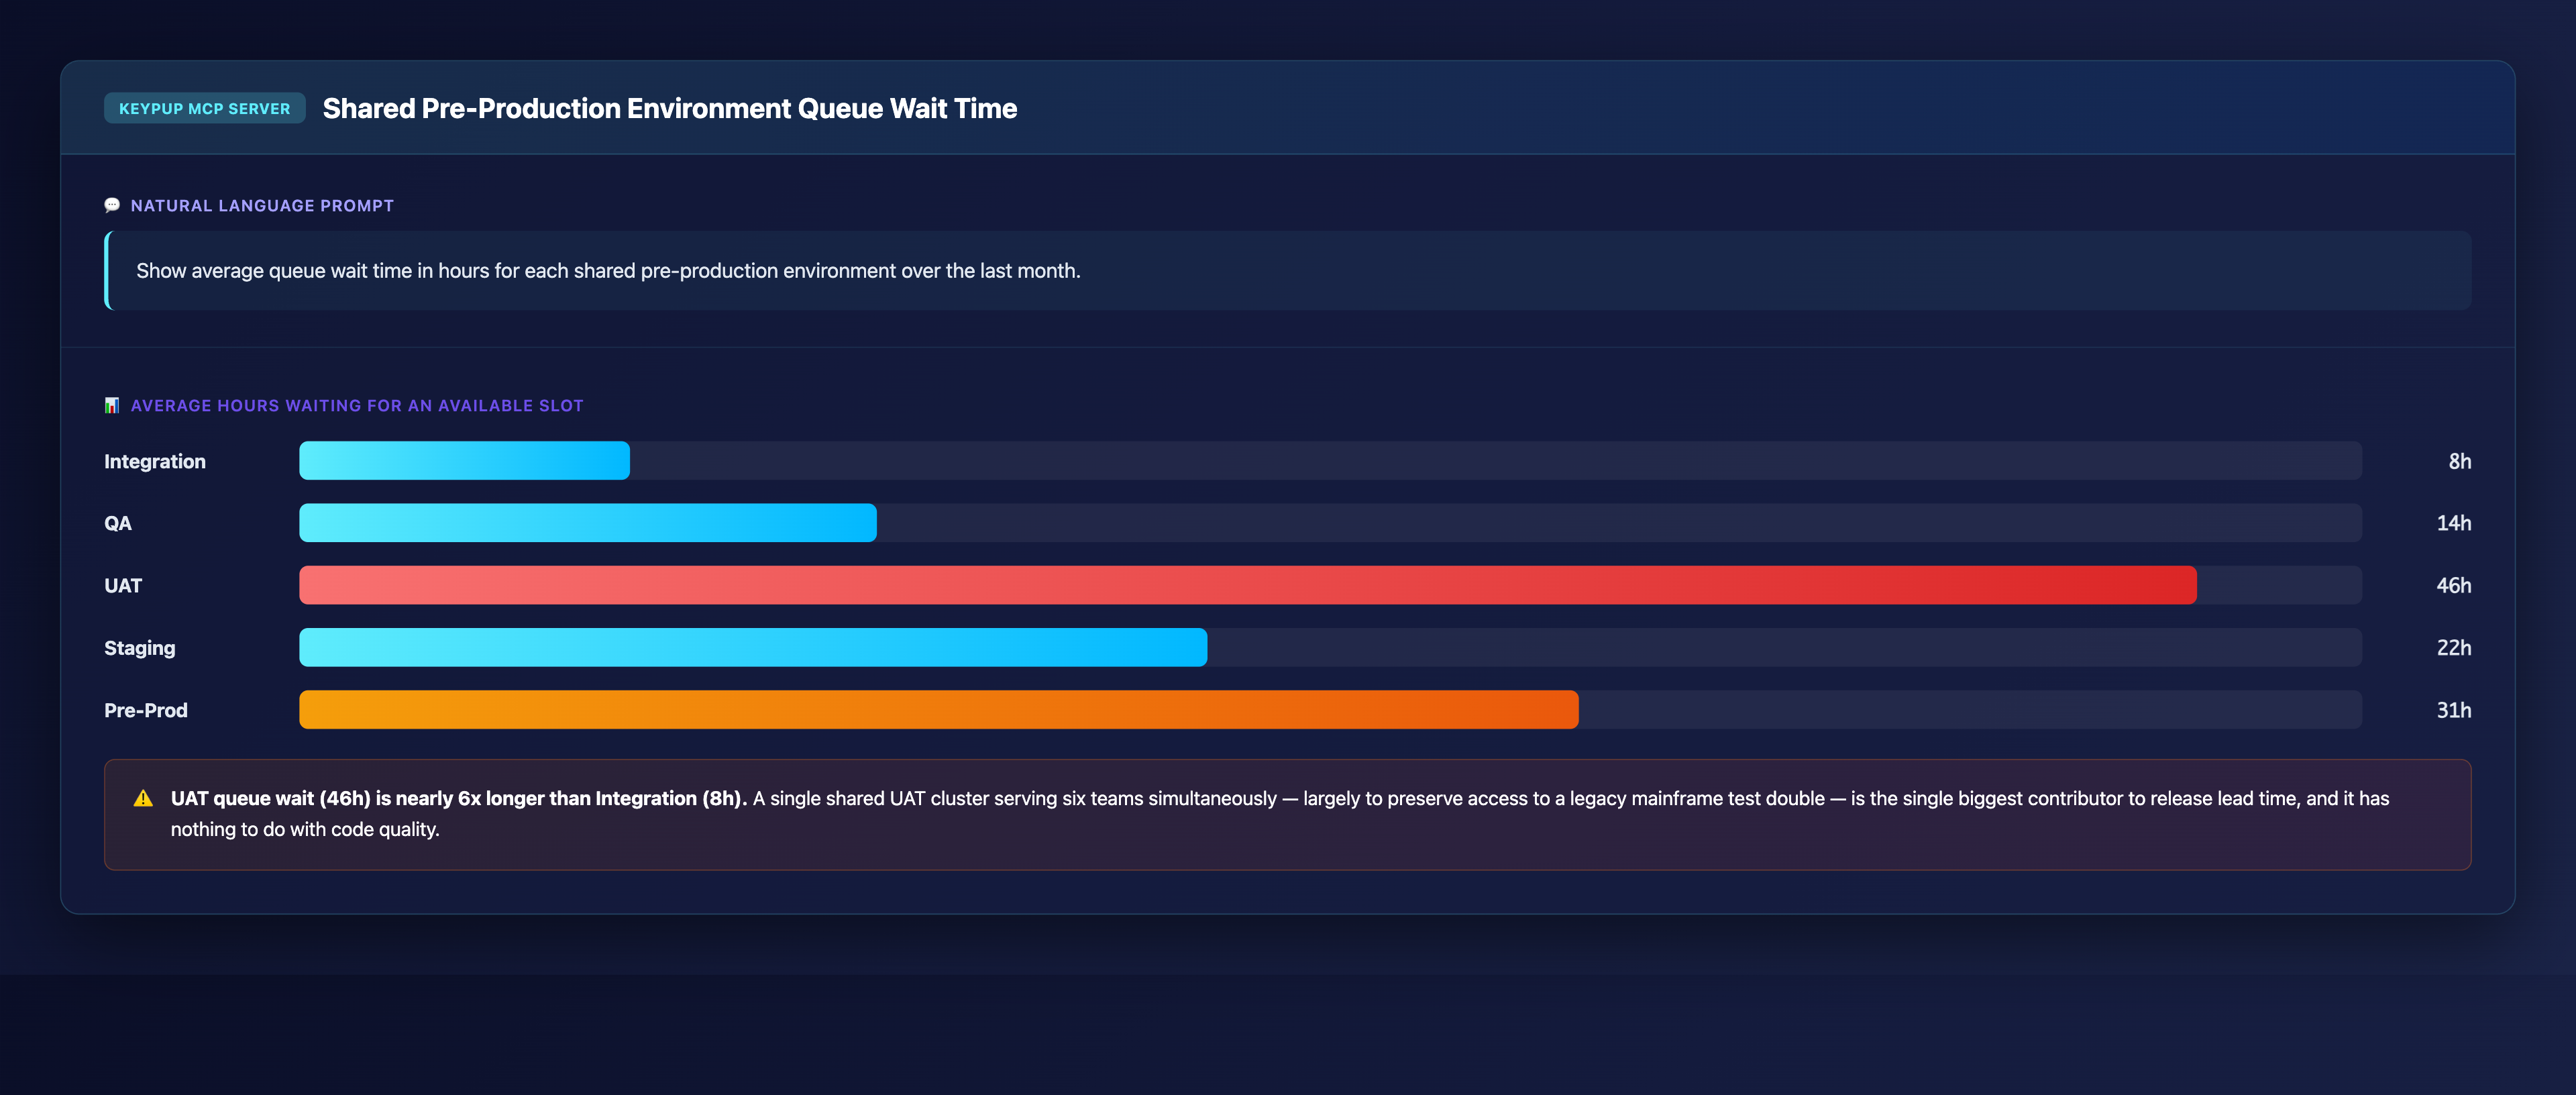
Output: Shared Pre-Production Environment Queue Wait Time
Key Insight: UAT queue wait (46h) is nearly 6x longer than Integration (8h). A single shared UAT cluster serving six teams simultaneously — largely to preserve access to a legacy mainframe test double — is the single biggest contributor to release lead time, and it has nothing to do with code quality.
3. Separating Real Defects From Configuration Drift, Build by Build
For every failed pre-release build, the question that actually matters is: was this the release candidate's fault?
MCP Prompt:
For the last six failed builds prior to release, show whether
the failure was caused by a defect in the release candidate or
by environment configuration drift.
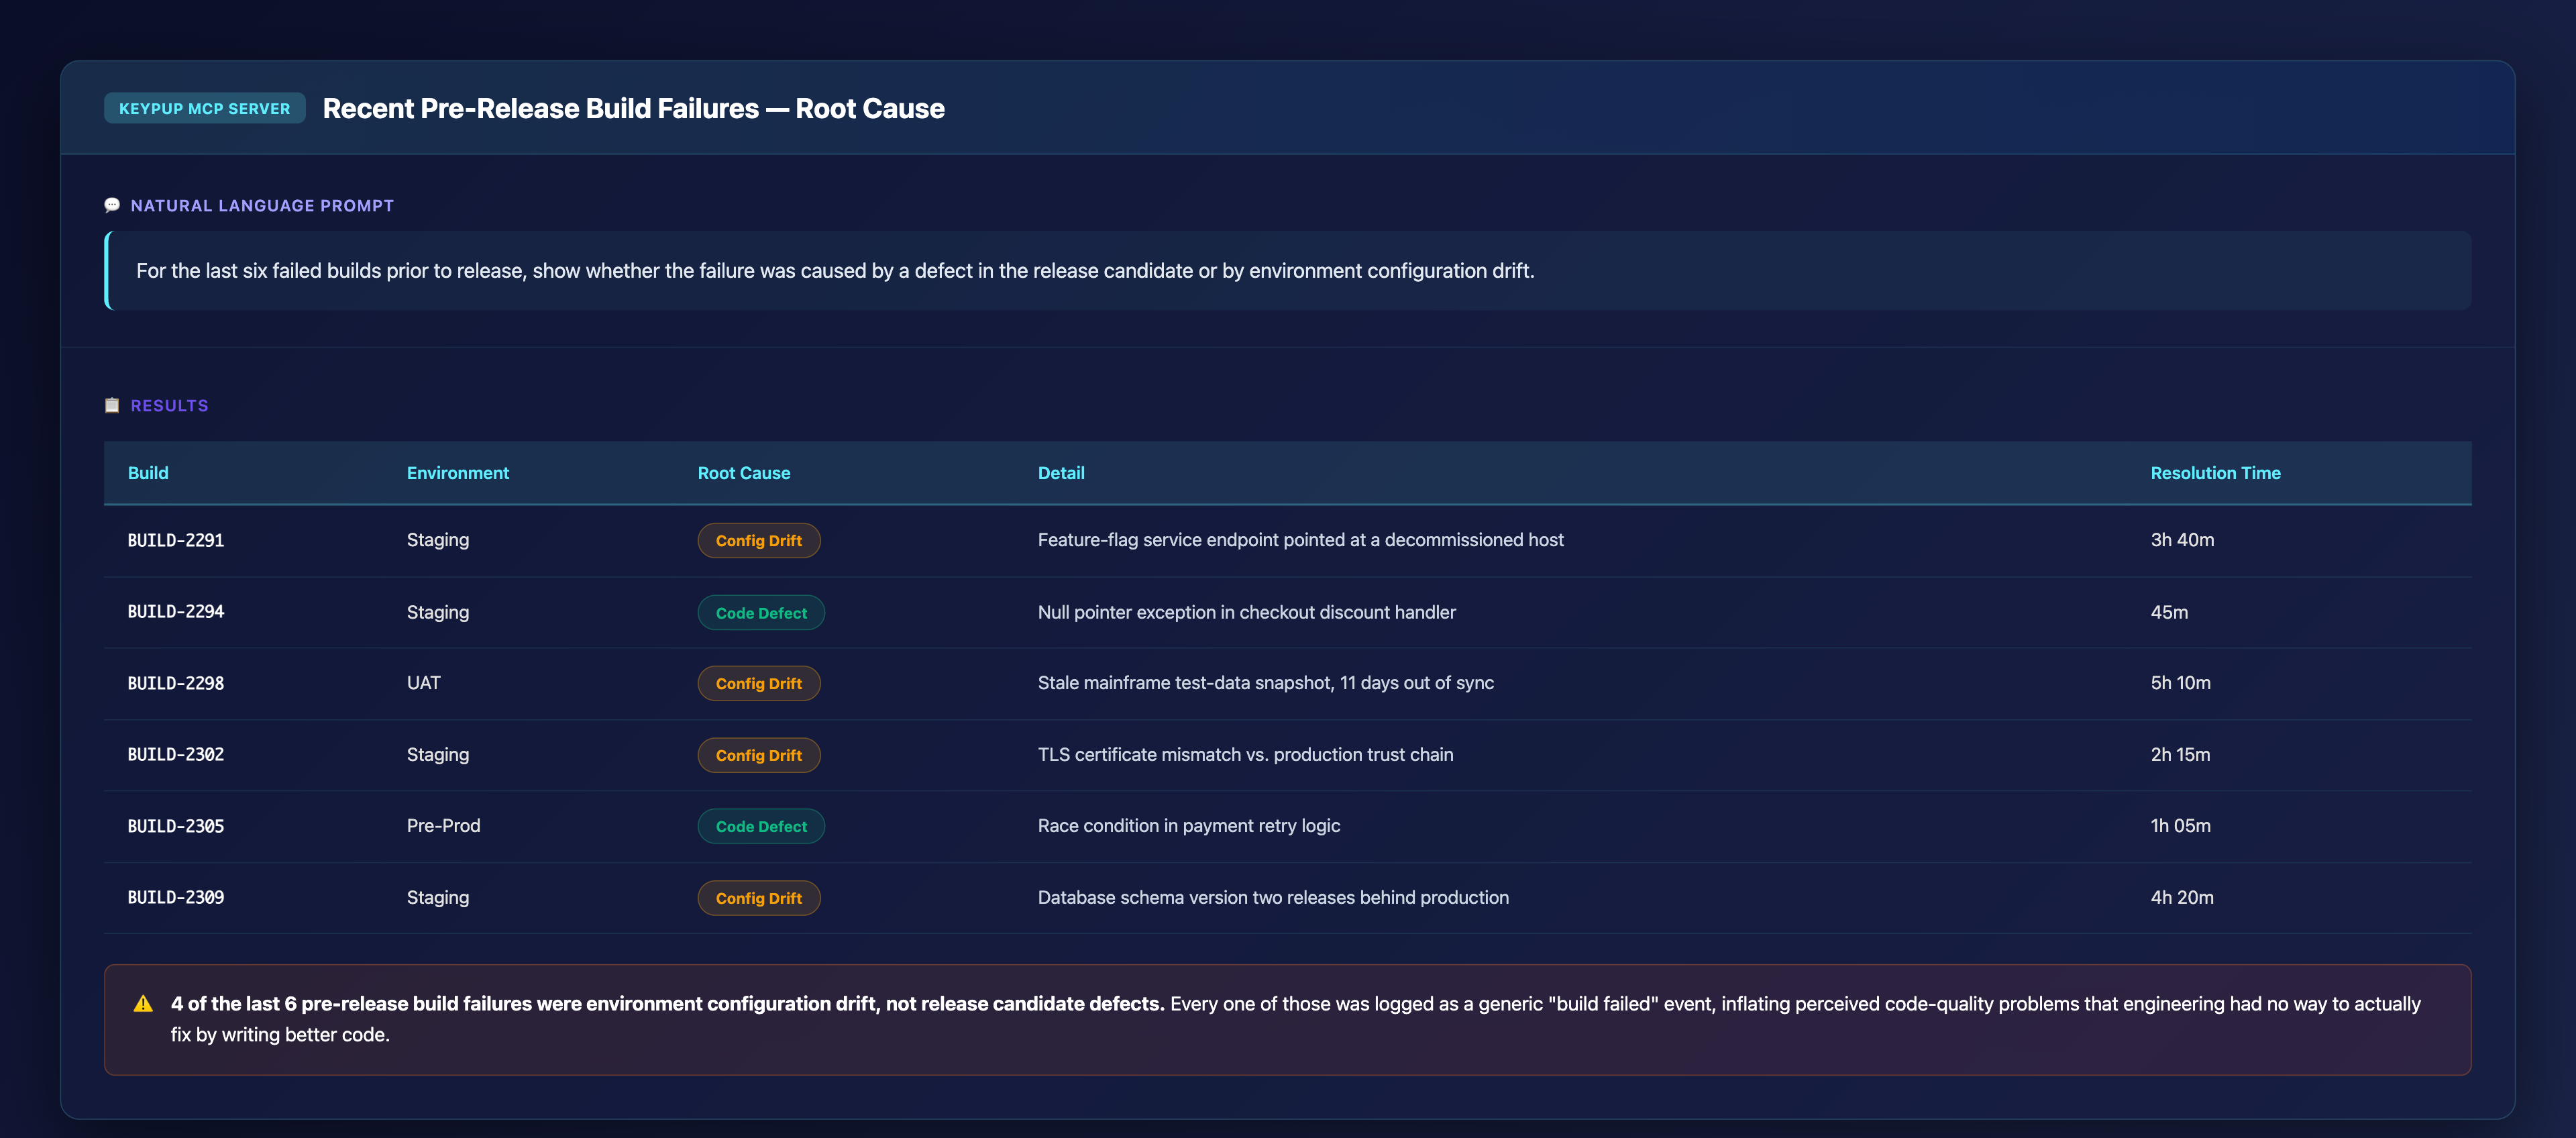
Output: Recent Pre-Release Build Failures — Root Cause
Build
Environment
Root Cause
Detail
Resolution Time
BUILD-2291
Staging
Config Drift
Feature-flag service endpoint pointed at a decommissioned host
3h 40m
BUILD-2294
Staging
Code Defect
Null pointer exception in checkout discount handler
45m
BUILD-2298
UAT
Config Drift
Stale mainframe test-data snapshot, 11 days out of sync
5h 10m
BUILD-2302
Staging
Config Drift
TLS certificate mismatch vs. production trust chain
2h 15m
BUILD-2305
Pre-Prod
Code Defect
Race condition in payment retry logic
1h 05m
BUILD-2309
Staging
Config Drift
Database schema version two releases behind production
4h 20m
Key Insight: 4 of the last 6 pre-release build failures were environment configuration drift, not release candidate defects. Every one of those was logged as a generic "build failed" event, inflating perceived code-quality problems that engineering had no way to actually fix by writing better code.
4. Proving the Reported Metric Tracks Infrastructure, Not Engineering Output
A single quarter's decomposition is useful. A trend across months proves the gap is systemic, not a one-off.
MCP Prompt:
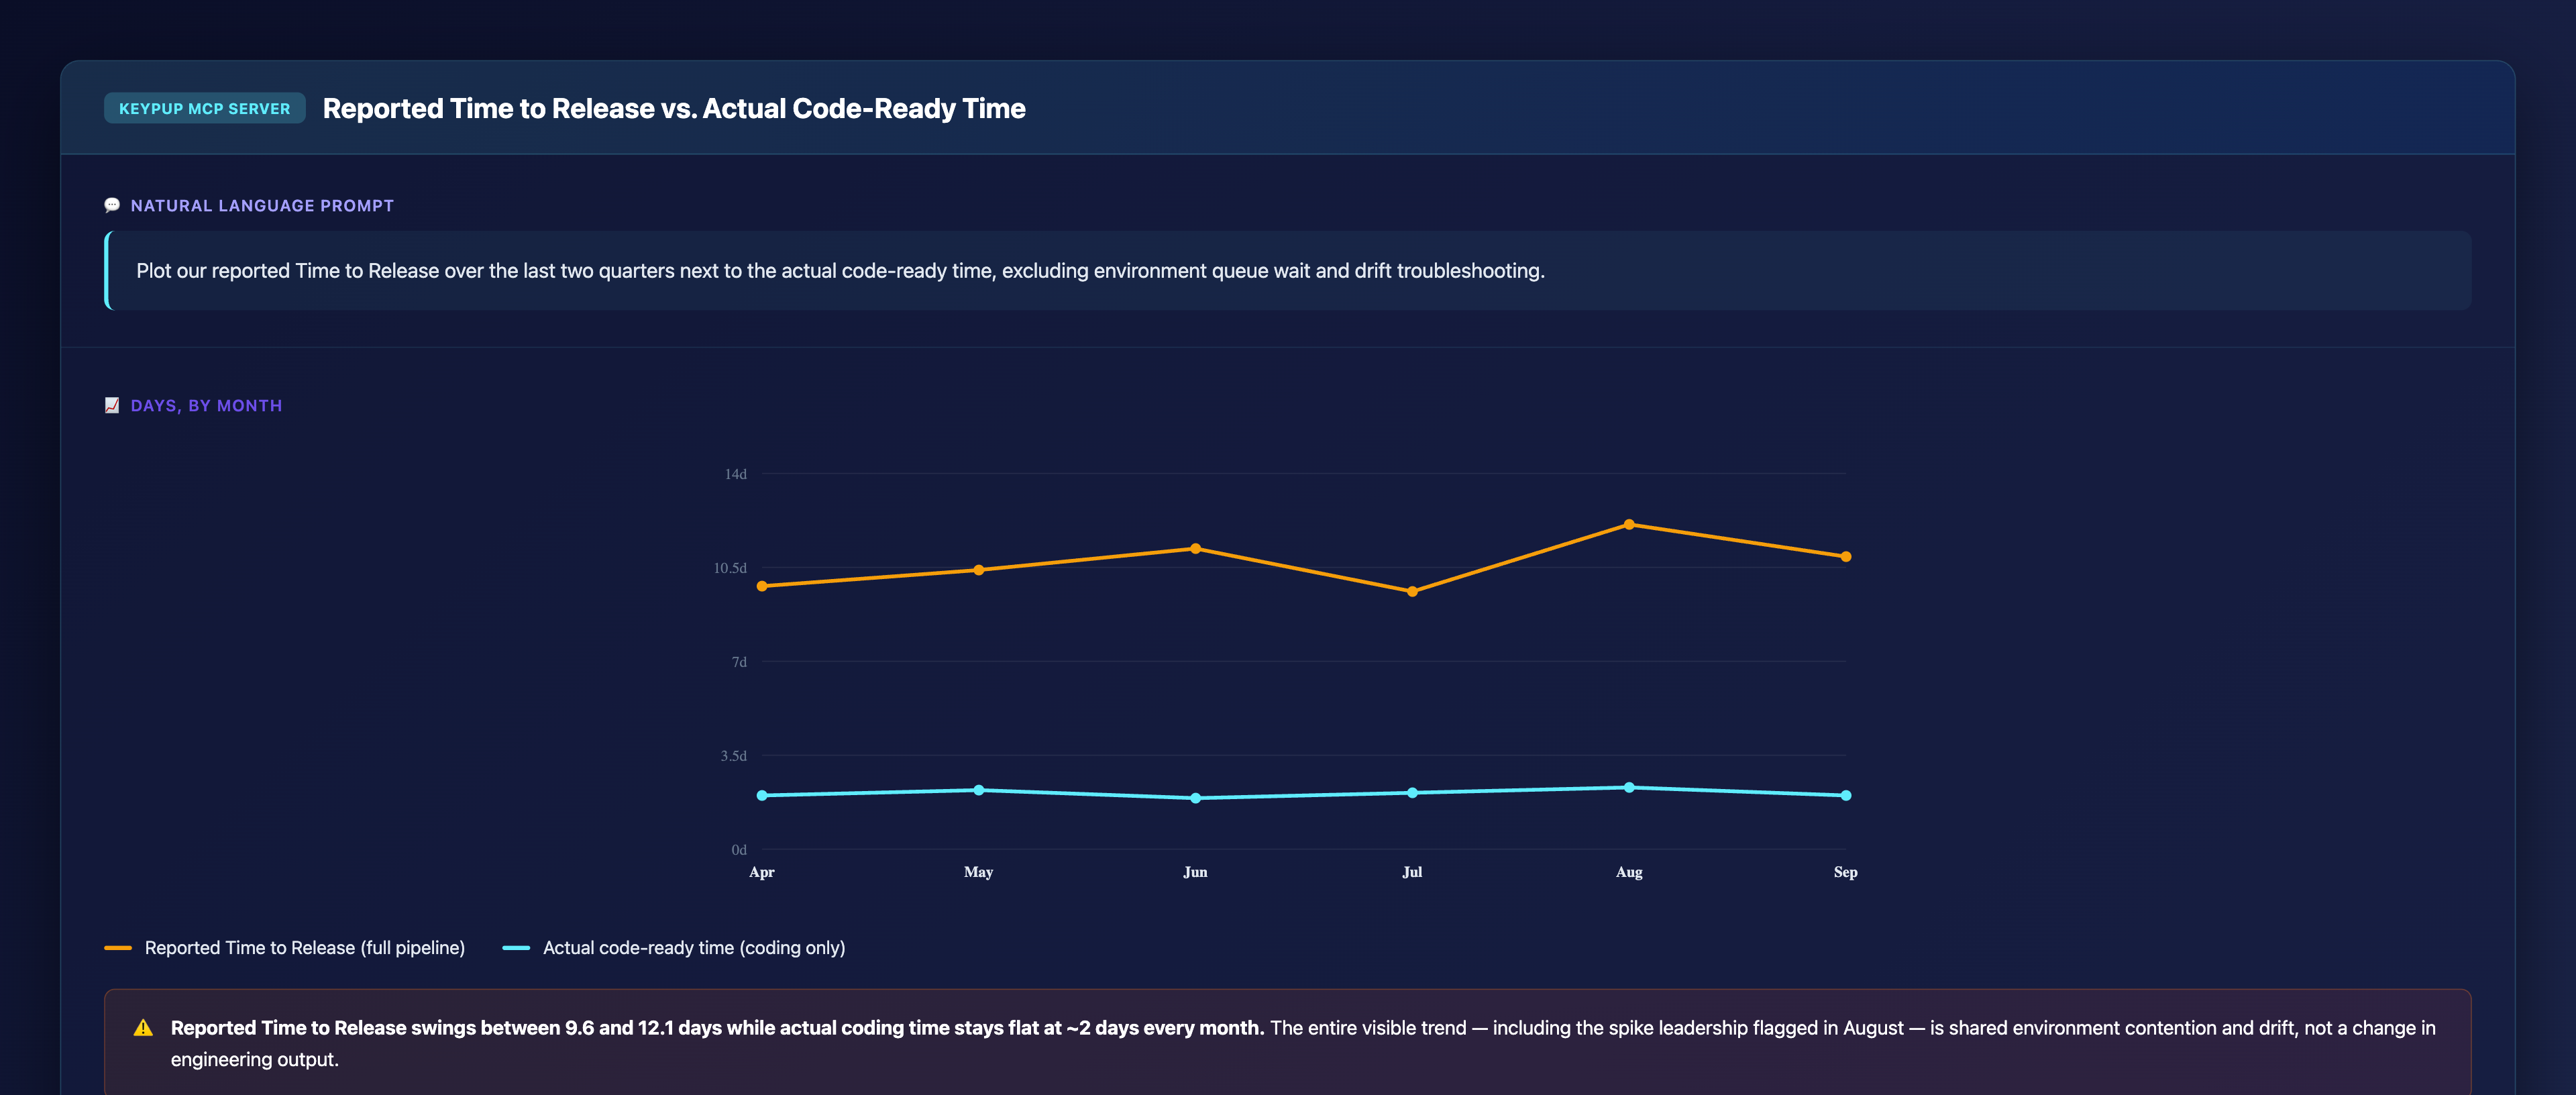
Plot our reported Time to Release over the last two quarters
next to the actual code-ready time, excluding environment queue
wait and drift troubleshooting.
Output: Reported Time to Release vs. Actual Code-Ready Time
Key Insight: Reported Time to Release swings between 9.6 and 12.1 days while actual coding time stays flat at ~2 days every month. The entire visible trend — including the spike leadership flagged in August — is shared environment contention and drift, not a change in engineering output.
5. Giving Leadership a Standing View of Who's Absorbing the Contention
Once the pattern is confirmed, leadership needs an ongoing view of which teams are actually bearing the cost, to target infrastructure investment where it's needed.
MCP Prompt:
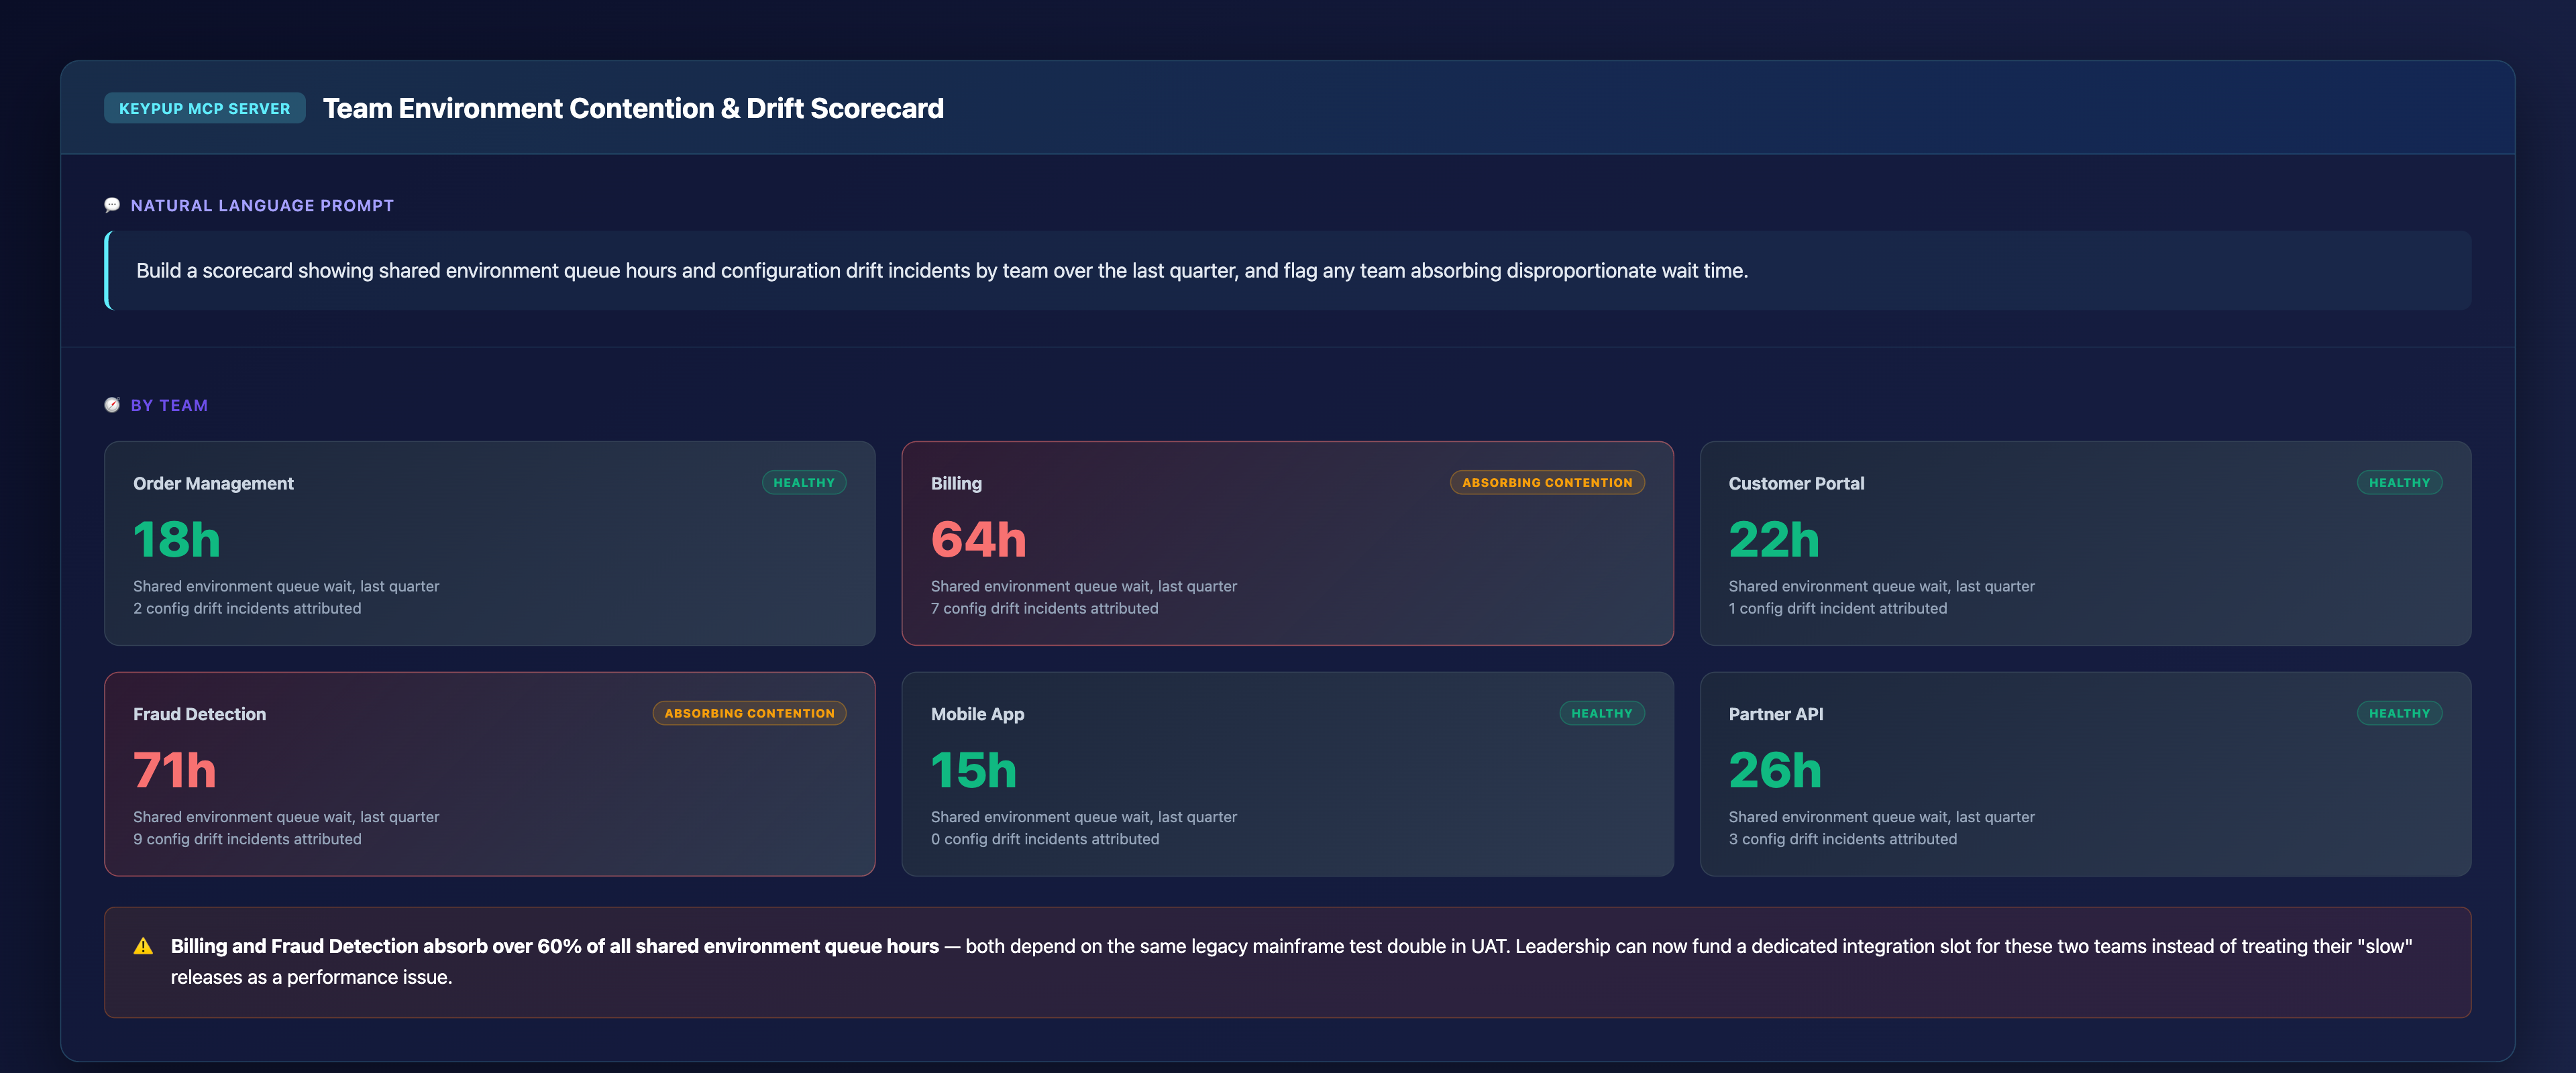
Build a scorecard showing shared environment queue hours and
configuration drift incidents by team over the last quarter, and
flag any team absorbing disproportionate wait time.
Output: Team Environment Contention & Drift Scorecard
Key Insight: Billing and Fraud Detection absorb over 60% of all shared environment queue hours — both depend on the same legacy mainframe test double in UAT. Leadership can now fund a dedicated integration slot for these two teams instead of treating their "slow" releases as a performance issue.
The Technical Implementation: How Keypup MCP Separates Signal From Infrastructure Noise
Environment-Aware Time Tracking
Keypup MCP tracks the specific state transitions of a release candidate — code complete, queued for an environment, actively testing, blocked on drift remediation — instead of a single undifferentiated clock from commit to release, so queue wait and coding time are never conflated.
Build Failure Classification
When a pre-release build fails, Keypup MCP cross-references the failure against known environment configuration state (feature flags, certificates, schema versions, test data freshness) to distinguish a release candidate defect from an environment mismatch, rather than logging every failure as an undifferentiated "build failed" event.
Shared Resource Contention Modeling
Because Integration, QA, UAT, Staging, and Pre-Prod are modeled as shared, capacity-constrained resources rather than pipeline stages, Keypup MCP can attribute queue wait to the teams actually competing for the same slot — surfacing contention hotspots before they turn into a quarter of misattributed "velocity" complaints.
Real-World Impact: Enterprise Case Studies
Case Study 1: Regional Insurance Carrier
Before Keypup MCP:
"Time to Release" had crept from 8 to 12 days over two quarters, with leadership repeatedly asking engineering to explain the "velocity decline"
No visibility into how much of that time was spent waiting for the shared UAT environment versus actually writing code
Two teams dependent on the same legacy claims-processing mainframe test double absorbed the majority of the queue, with no data to justify additional environment capacity
After Keypup MCP:
Environment queue wait was isolated as the actual driver, showing coding time had stayed flat at ~2 days across the entire period
A second UAT slot was funded and provisioned specifically for the two most contended teams, based on the queue-hours data
Reported Time to Release fell by 35% in the following quarter, driven entirely by reduced queue wait rather than any change in engineering practice
"We spent two quarters asking engineering to explain a velocity problem that didn't exist. Once we could see the queue-wait number separately from coding time, the fix was obvious — we needed a second UAT slot, not a performance improvement plan."
— VP Engineering, Regional Insurance Carrier
Case Study 2: National Telecom Provider
Before Keypup MCP:
Repeated staging build failures were logged identically to real defects, and were used as a factor in a team's quarterly reliability review
Nobody owned staging environment configuration drift specifically, so certificates, schema versions, and feature flags silently diverged from production over months
Developers routinely spent half a day or more troubleshooting failures that turned out to be environment mismatches, with no record of that time anywhere
After Keypup MCP:
Root-cause classification showed the majority of that team's "build failures" were configuration drift, not code defects, correcting an inaccurate reliability review
A dedicated environment configuration owner was assigned based on the drift-incident data, closing the gap that had gone unowned for over a year
Drift-related build failures dropped by more than half within one quarter once staging was brought back into sync and monitored against production configuration
"The build failure count never lied — it just didn't tell us what we needed to know. Once we could see 'config drift' as its own category, we stopped reviewing a team's reliability based on a staging certificate nobody had renewed."
— Director of Platform Engineering, National Telecom Provider
Implementation: Getting Started with Keypup MCP
1. Map Your Shared Pre-Production Environments First
Before decomposing any metric, make sure every shared environment (Integration, QA, UAT, Staging, Pre-Prod) is identified as a distinct, capacity-constrained resource in your analytics — attribution only works once the shared resources are mapped.
2. Stop Reporting a Single Undifferentiated "Time to Release"
Report coding time, environment queue wait, and drift troubleshooting time as three separate numbers, every time, so nobody has to guess which one actually moved.
3. Query in Natural Language, Across Every Environment
No manual investigation required. Just ask:
"How much of our Time to Release is environment queue wait versus actual coding time?"
"Which shared environment has the longest queue this month?"
"Show me the last 10 build failures and whether they were code defects or configuration drift"
"Which team is absorbing the most shared environment contention this quarter?"
4. Automate Recurring Root-Cause Reporting
Schedule recurring queries for:
Monthly Time to Release decomposition by team, split into coding, queue wait, and drift
Environment queue wait ranking, to justify capacity investment where it's actually needed
Automatic classification of every pre-release build failure as defect or drift
Standing team contention scorecards ahead of quarterly reliability and performance reviews
The Bottom Line: A Pipeline Metric Needs to Know It Isn't a Pipeline
A metric that treats commit-to-production as one continuous flow will always misattribute the cost of shared, scarce pre-production infrastructure to engineering output — not occasionally, but every release, in every enterprise with legacy environments too expensive to fully replicate. Fixing it requires:
✅ Modeling shared environments as capacity-constrained resources, not pipeline stages ✅ Reporting coding time, queue wait, and drift separately, every time, in every dashboard ✅ Classifying every build failure as defect or drift instead of one undifferentiated status ✅ Quantifying the size of the gap over time, so leadership sees it's systemic, not anecdotal ✅ Maintaining a standing view of which teams absorb the most contention, to target investment correctly
Keypup MCP turns "why did this release take so long" from a recurring, code-quality-shaped accusation into a precise answer — coding time, queue wait, or drift — giving engineering leaders the data to fund the actual fix instead of asking teams to move faster through a queue they never controlled.
Get Started
Ready to stop measuring engineering velocity with a number that's mostly measuring environment scarcity?
Start Free Trial — Connect your engineering stack in minutes and start separating coding time from environment queue wait and configuration drift.
Request Demo — See how enterprise engineering leaders use Keypup MCP to separate real code defects from pre-production infrastructure contention.
View MCP Documentation — Technical details for engineering teams implementing Keypup MCP across shared pre-production environments.
Keywords: pre-production environment contention, staging drift metrics, Time to Release root cause, shared UAT environment queue, environment configuration drift, enterprise release pipeline analytics, DORA metrics shared infrastructure, MCP server build failure classification, environment queue wait time, legacy mainframe test environment scheduling
Ready to Transform Your Analytics?
Join teams already using AI to make data-driven decisions faster than
ever.
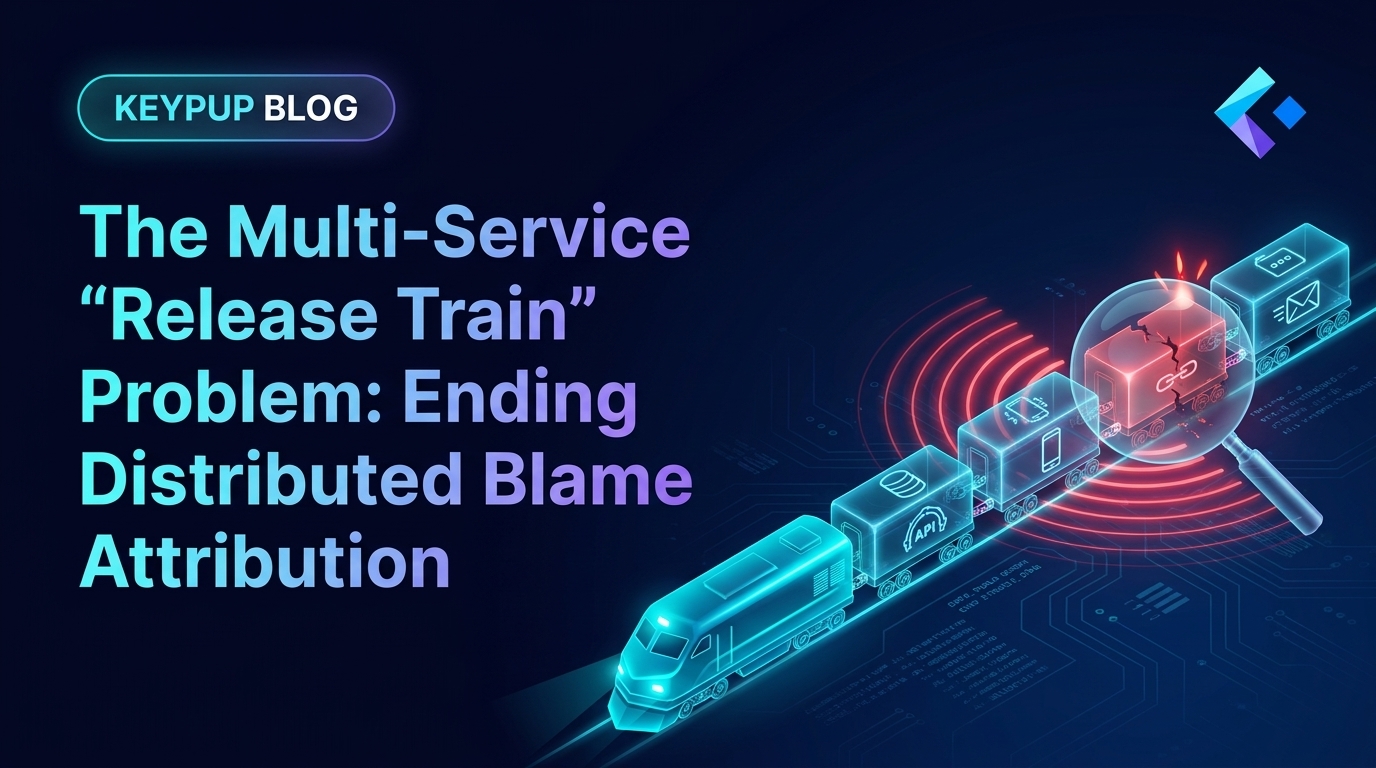
Enterprises with tightly coupled systems can't release one microservice at a time — dozens of teams get bundled onto synchronized "release trains" across shared databases and legacy message buses. When a train fails, standard SDLC dashboards flag every participating team with a Change Failure, even the ones whose code was completely stable. When one team's late pull request delays the whole train, nobody's metrics capture it. Discover how Keypup MCP performs root-cause attribution across repository boundaries, ending the finger-pointing that per-team dashboards can't resolve.
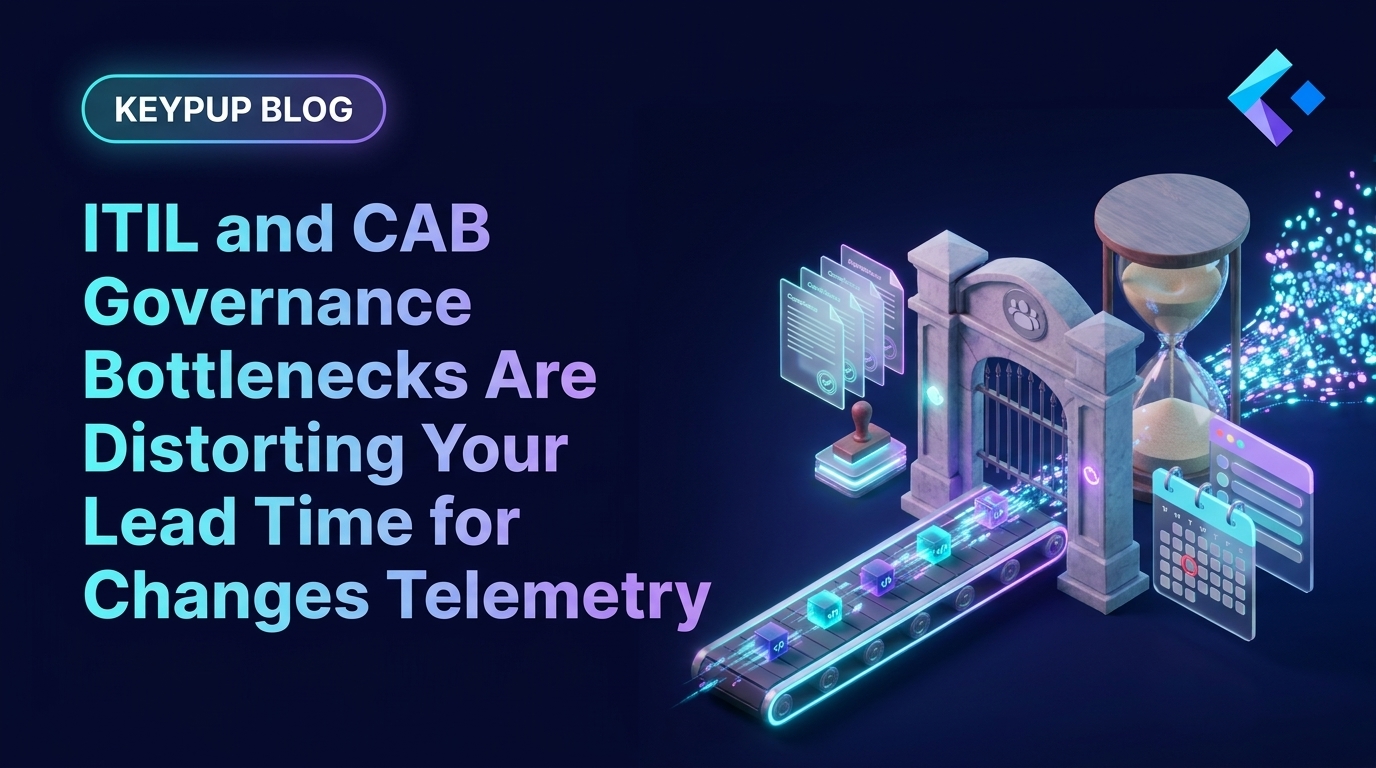
In regulated enterprises — finance, healthcare, telecom — code can be written, tested, and merged in three hours, then sit for two to three weeks waiting on a Change Advisory Board slot. DORA's Lead Time for Changes can't tell the difference between active engineering work and passive bureaucratic wait, so executive dashboards flag a "velocity problem" that doesn't exist. Discover how Keypup MCP decomposes Lead Time into engineering-controlled time versus CAB queue wait, exposes SLA-breaching change categories, and gives engineering leadership the receipts to stop absorbing blame for a compliance calendar.
Centralizing SDLC data across ten business units exposes a governance vacuum long before it delivers insight: seven competing "story point" scales, four business units with no named data owner, and a workflow taxonomy nobody was ever assigned to define. This isn't a GDPR problem — it's a political and technical negotiation over who owns what data, and who is accountable when a poorly maintained JIRA board quietly skews a portfolio-wide metric. Discover how Keypup MCP makes data ownership, definition consistency, and governance maturity measurable across every business unit.