Keypup MCP Server + ChatGPT and Claude: Conversational Engineering Analytics, No Dashboards Required
Keypup's MCP server now connects directly to ChatGPT and Claude, letting engineering leaders ask plain-language questions about DORA metrics, cycle time, throughput, and team performance and get instant, formatted answers — charts, tables, and KPIs included. This guide walks through how both integrations work, the concrete benefits over traditional dashboards, and five real prompt-and-output examples spanning delivery velocity, quality, cycle time, and team performance.
TL;DR: Keypup's MCP Server now connects directly to both ChatGPT and Claude, turning your engineering analytics into a conversation instead of a dashboard. Ask a plain-language question — "what's our change failure rate by team this quarter?" — and get back instant, formatted answers: charts, tables, KPIs, and AI-generated recommendations. No SQL, no custom dashboards, no waiting on an analyst. This article walks through how both integrations work, why engineering leaders are switching from static dashboards to conversational analytics, and five real examples spanning delivery velocity, quality, cycle time, and team performance.
Ask most engineering leaders how they get an answer to "how's the team doing this quarter," and the honest answer is still: open a dashboard, filter it, maybe export a CSV, or ping someone on the data team. Keypup's MCP server collapses that whole process into a single sentence typed into a tool you probably already have open — ChatGPT or Claude.
The Old Way: Dashboards, Filters, and Waiting
Traditional engineering analytics platforms are built around dashboards — powerful, but only if you already know which dashboard to open, which filters to apply, and how to interpret what you're looking at. Every new question that isn't pre-built into a dashboard means either learning a query language, requesting a custom report, or waiting for someone else to build it.
Every new question is a new dashboard request. "What's our change failure rate?" is easy if someone already built that widget. "What's our change failure rate by team, filtered to only bugs, for teams with more than 10 PRs this month?" usually isn't — and now it's a ticket in someone's backlog.
Context resets every time. A dashboard doesn't remember that you just asked about Q2. Every follow-up question means re-navigating filters from scratch.
The answer is a number, not a next step. Most dashboards show you what happened. They rarely tell you what it means or what to do about it.
The Model Context Protocol (MCP) changes the interface, not just the plumbing: instead of a dashboard responding to filters, an AI assistant responds to a conversation — and it already knows how to ask good follow-up questions.
The Developer Discussion: Why Chat-First Analytics Is Catching On
This shift mirrors a broader pattern engineers have been describing across developer communities as AI assistants get wired into more of the toolchain.
"I used to have four different dashboard tabs pinned just to answer 'how are we doing' in a leadership sync. Now I just ask Claude the actual question I have in my head, in my actual words, and it goes and gets the number. The bar to get an answer went from 'open five things and cross-reference them' to 'type one sentence.'"
Engineering Manager, mid-market SaaS (r/devops)
"The thing nobody tells you about internal analytics dashboards is that 90% of the value is in the 10% of questions that are follow-ups — 'ok but what about last quarter,' 'ok but just for my team.' A static dashboard makes every one of those a new click-through. Chatting with an assistant that already has the context is just a completely different speed of getting to an answer."
The underlying want isn't complicated: engineers and engineering leaders would rather ask a question in plain language than learn where a metric lives in a dashboard hierarchy. That's exactly the gap Keypup's MCP integrations with ChatGPT and Claude are built to close.
Two Integrations, One MCP Server
Keypup's MCP server exposes the same underlying engineering analytics — DORA metrics, cycle time, throughput, quality, team performance, OKR progress, and financial reconciliation — through the Model Context Protocol, connectable to either ChatGPT or Claude depending on where your team already works.
ChatGPT Integration
Keypup is available directly in the ChatGPT app directory. Once connected, you invoke it explicitly with @Keypup or by selecting Keypup from the context list, and it responds inline with formatted charts, tables, and recommendations — all inside the same ChatGPT conversation you're already having.
Setup is four steps:
Install the MCP Server — add Keypup's MCP server to ChatGPT (online or desktop) with a simple setup command, or find the Keypup app directly in the ChatGPT app directory.
Connect Your Data — authenticate with your Keypup account to give ChatGPT access to your engineering metrics.
Ask Questions — start chatting in natural language about your team's performance and metrics.
Get Instant Insights — receive formatted results with charts, tables, and actionable recommendations.
Claude Integration
Claude (Desktop and Claude Code) connects to Keypup as a custom MCP connector, authenticated via OAuth with dynamic client registration — no API keys to copy around, just a standard sign-in flow.
Setup is four steps:
Open Claude or Claude Code — launch wherever you want to use Keypup analytics.
Add Custom MCP Server — in Claude's settings, add a custom MCP connector pointing to https://hq.keypup.io/mcp.
Authenticate with OAuth — Claude opens a browser for you to sign in to Keypup and authorize access, using OAuth with dynamic client registration (DCR) for secure authentication.
Start Asking Questions — once authenticated, Keypup's tools become available in Claude, ready to answer questions about your engineering data.
What You Can Ask
Both integrations expose the same six categories of engineering questions — the difference is only which assistant you're talking to.
Delivery & Velocity — "How many PRs did we merge last month?" · "What's our deployment frequency this quarter?" · "Show me story points completed per sprint"
Quality & Stability — "What's our change failure rate?" · "How many bugs were opened vs. closed?" · "Show me test coverage trends"
Cycle Time & Efficiency — "What's the average PR cycle time?" · "How long are issues stuck in review?" · "Show me lead time by team"
Team Performance — "Which teams have the highest velocity?" · "Show me workload distribution" · "Compare team performance across quarters"
Business & OKRs — "What's our progress on Q2 objectives?" · "Show me key results by initiative" · "Which teams are on track with their OKRs?"
Financial Reconciliation — "What's the total cost of features shipped last quarter?" · "Show me engineering cost per project" · "Calculate ROI on team investments"
How Keypup MCP Answers These Questions — Five Real Examples
The five examples below show the actual variety of output Keypup MCP returns — KPI cards, bar charts, tables, line charts, and leaderboards — across both ChatGPT and Claude, all from single, plain-language prompts.
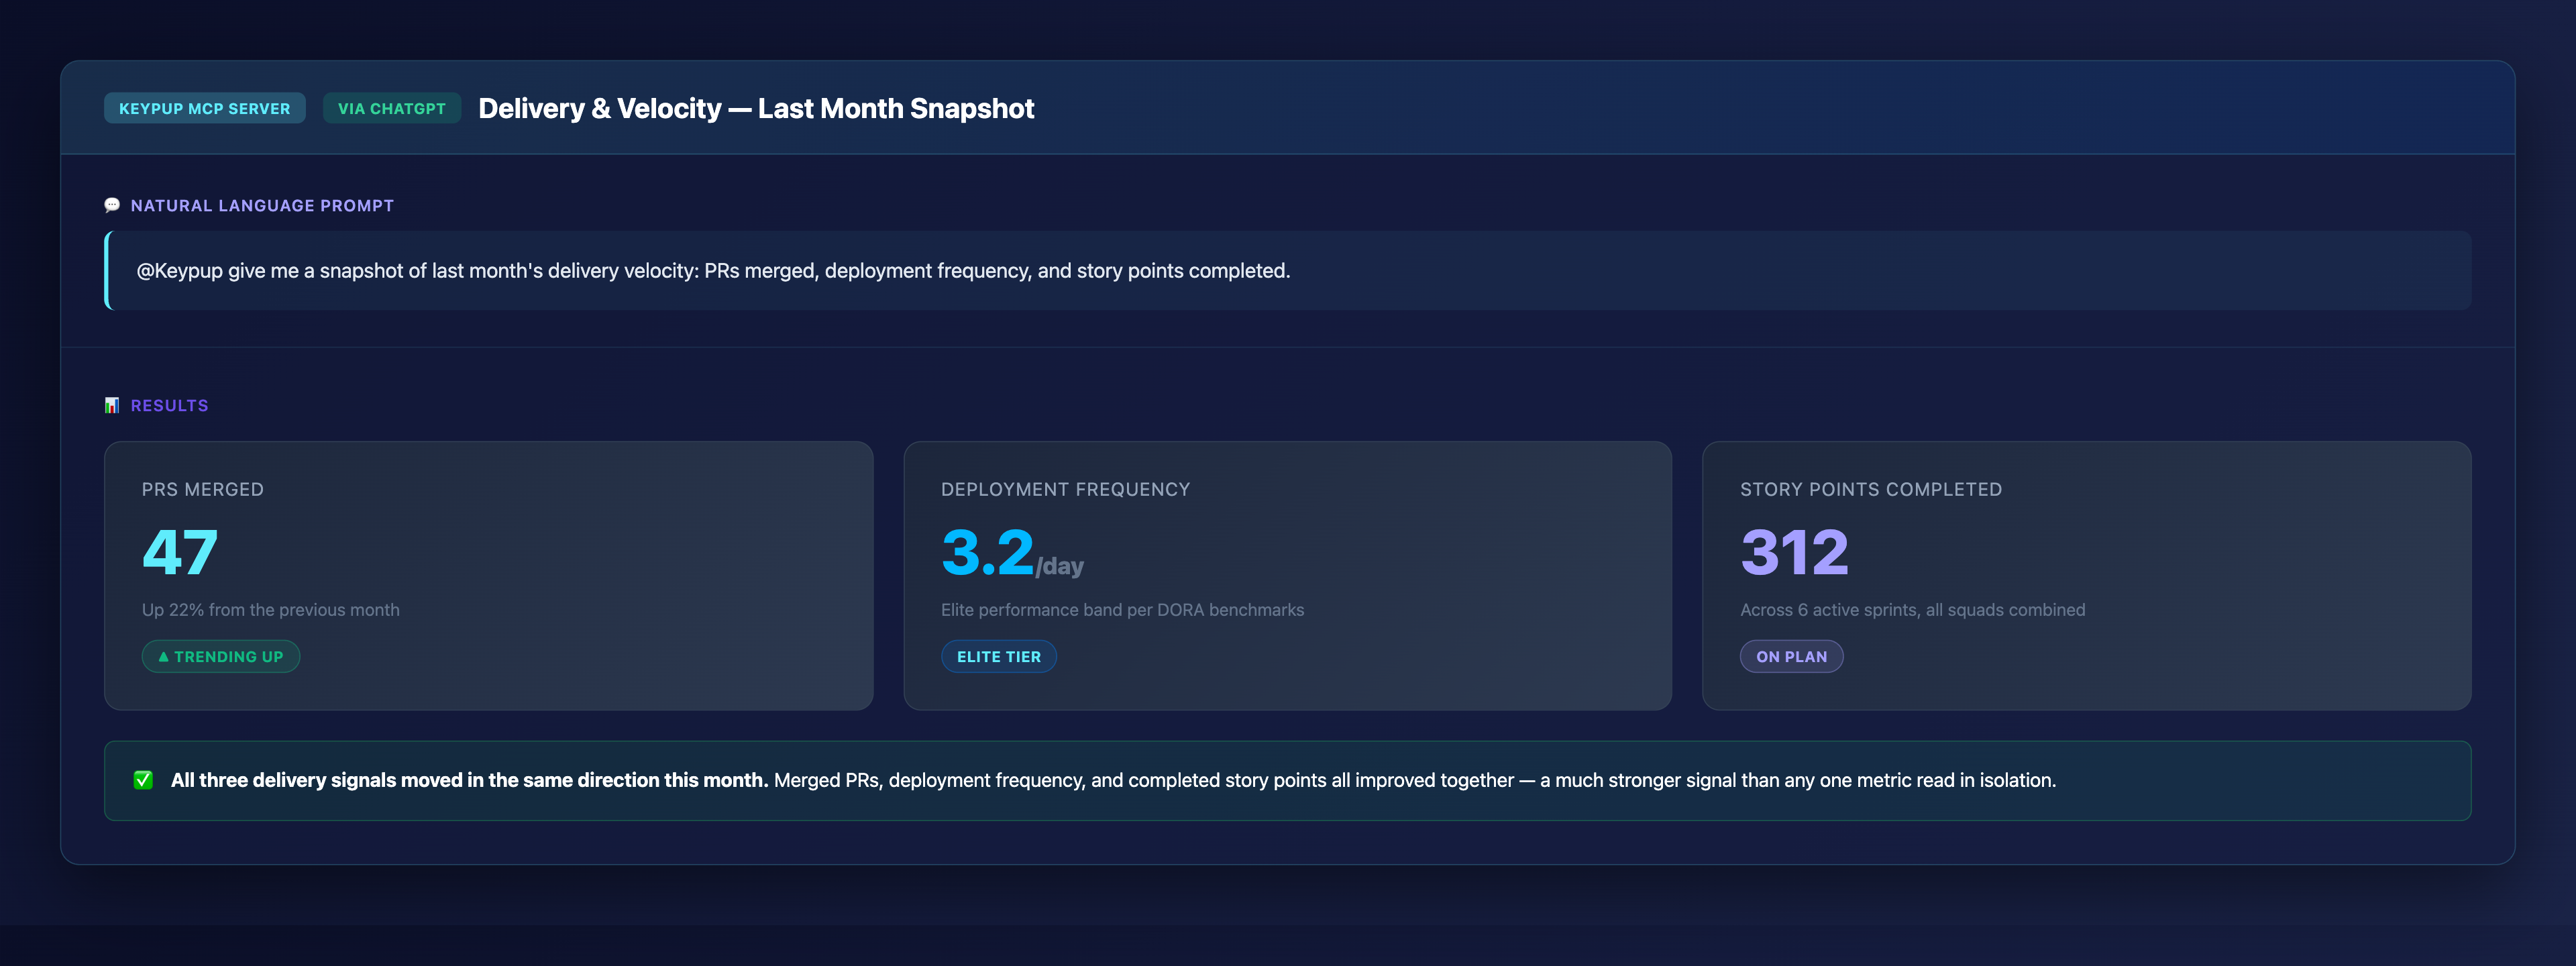
1. A Multi-Metric Delivery Snapshot in One Question
MCP Prompt (via ChatGPT):
@Keypup give me a snapshot of last month's delivery velocity: PRs merged,
deployment frequency, and story points completed.
Output: Delivery & Velocity — Last Month Snapshot
Key Insight: All three delivery signals moved in the same direction this month. Merged PRs, deployment frequency, and completed story points all improved together — a much stronger signal than any one metric read in isolation.
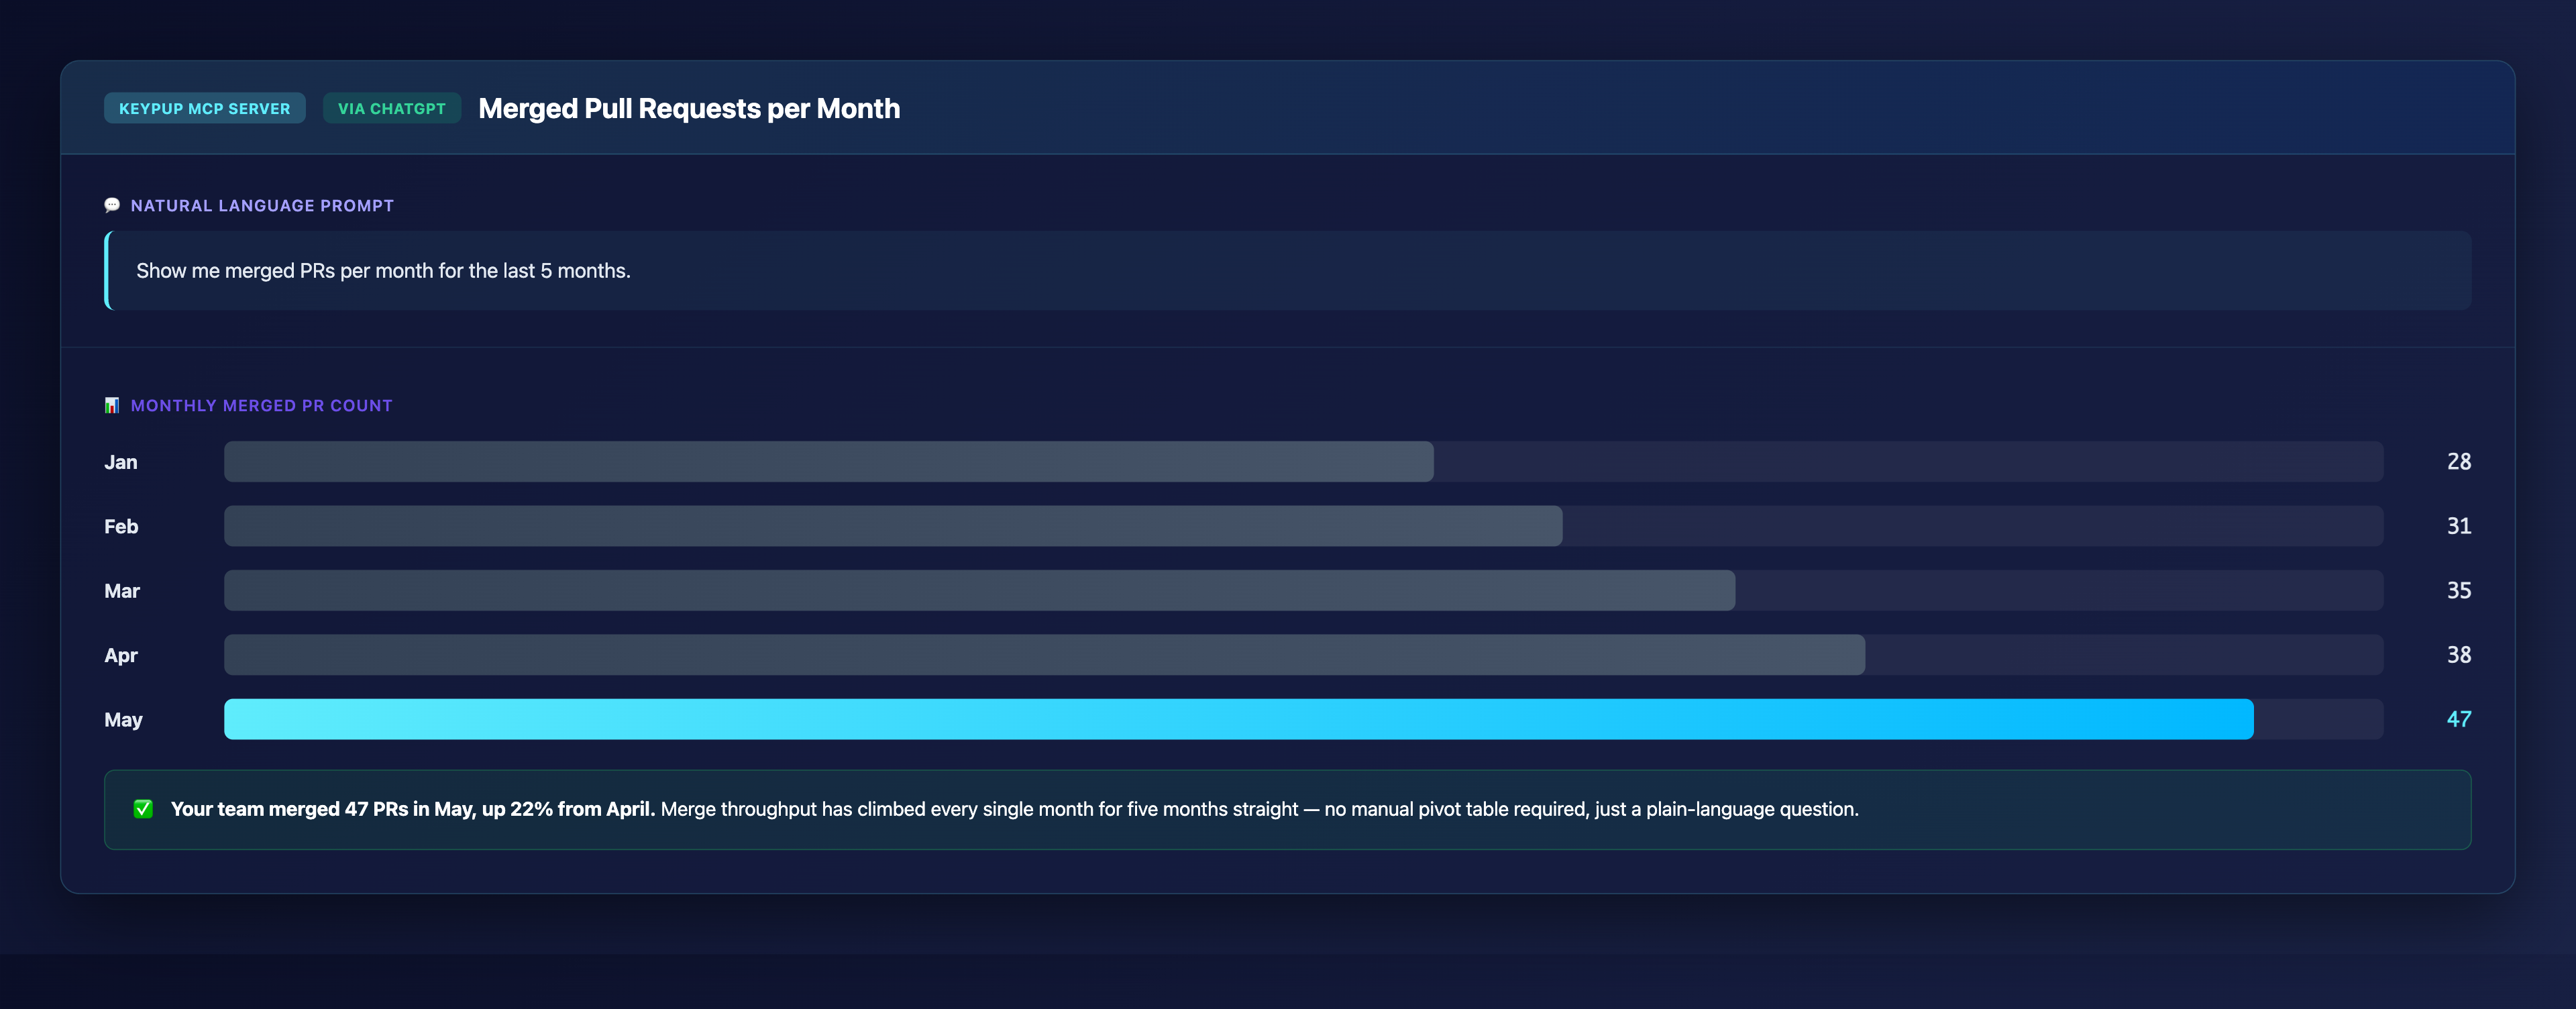
2. A Trend Question Answered With a Single Sentence
MCP Prompt (via ChatGPT):
Show me merged PRs per month for the last 5 months.
Output: Merged Pull Requests per Month
Key Insight: Your team merged 47 PRs in May, up 22% from April. Merge throughput has climbed every single month for five months straight — no manual pivot table required, just a plain-language question.
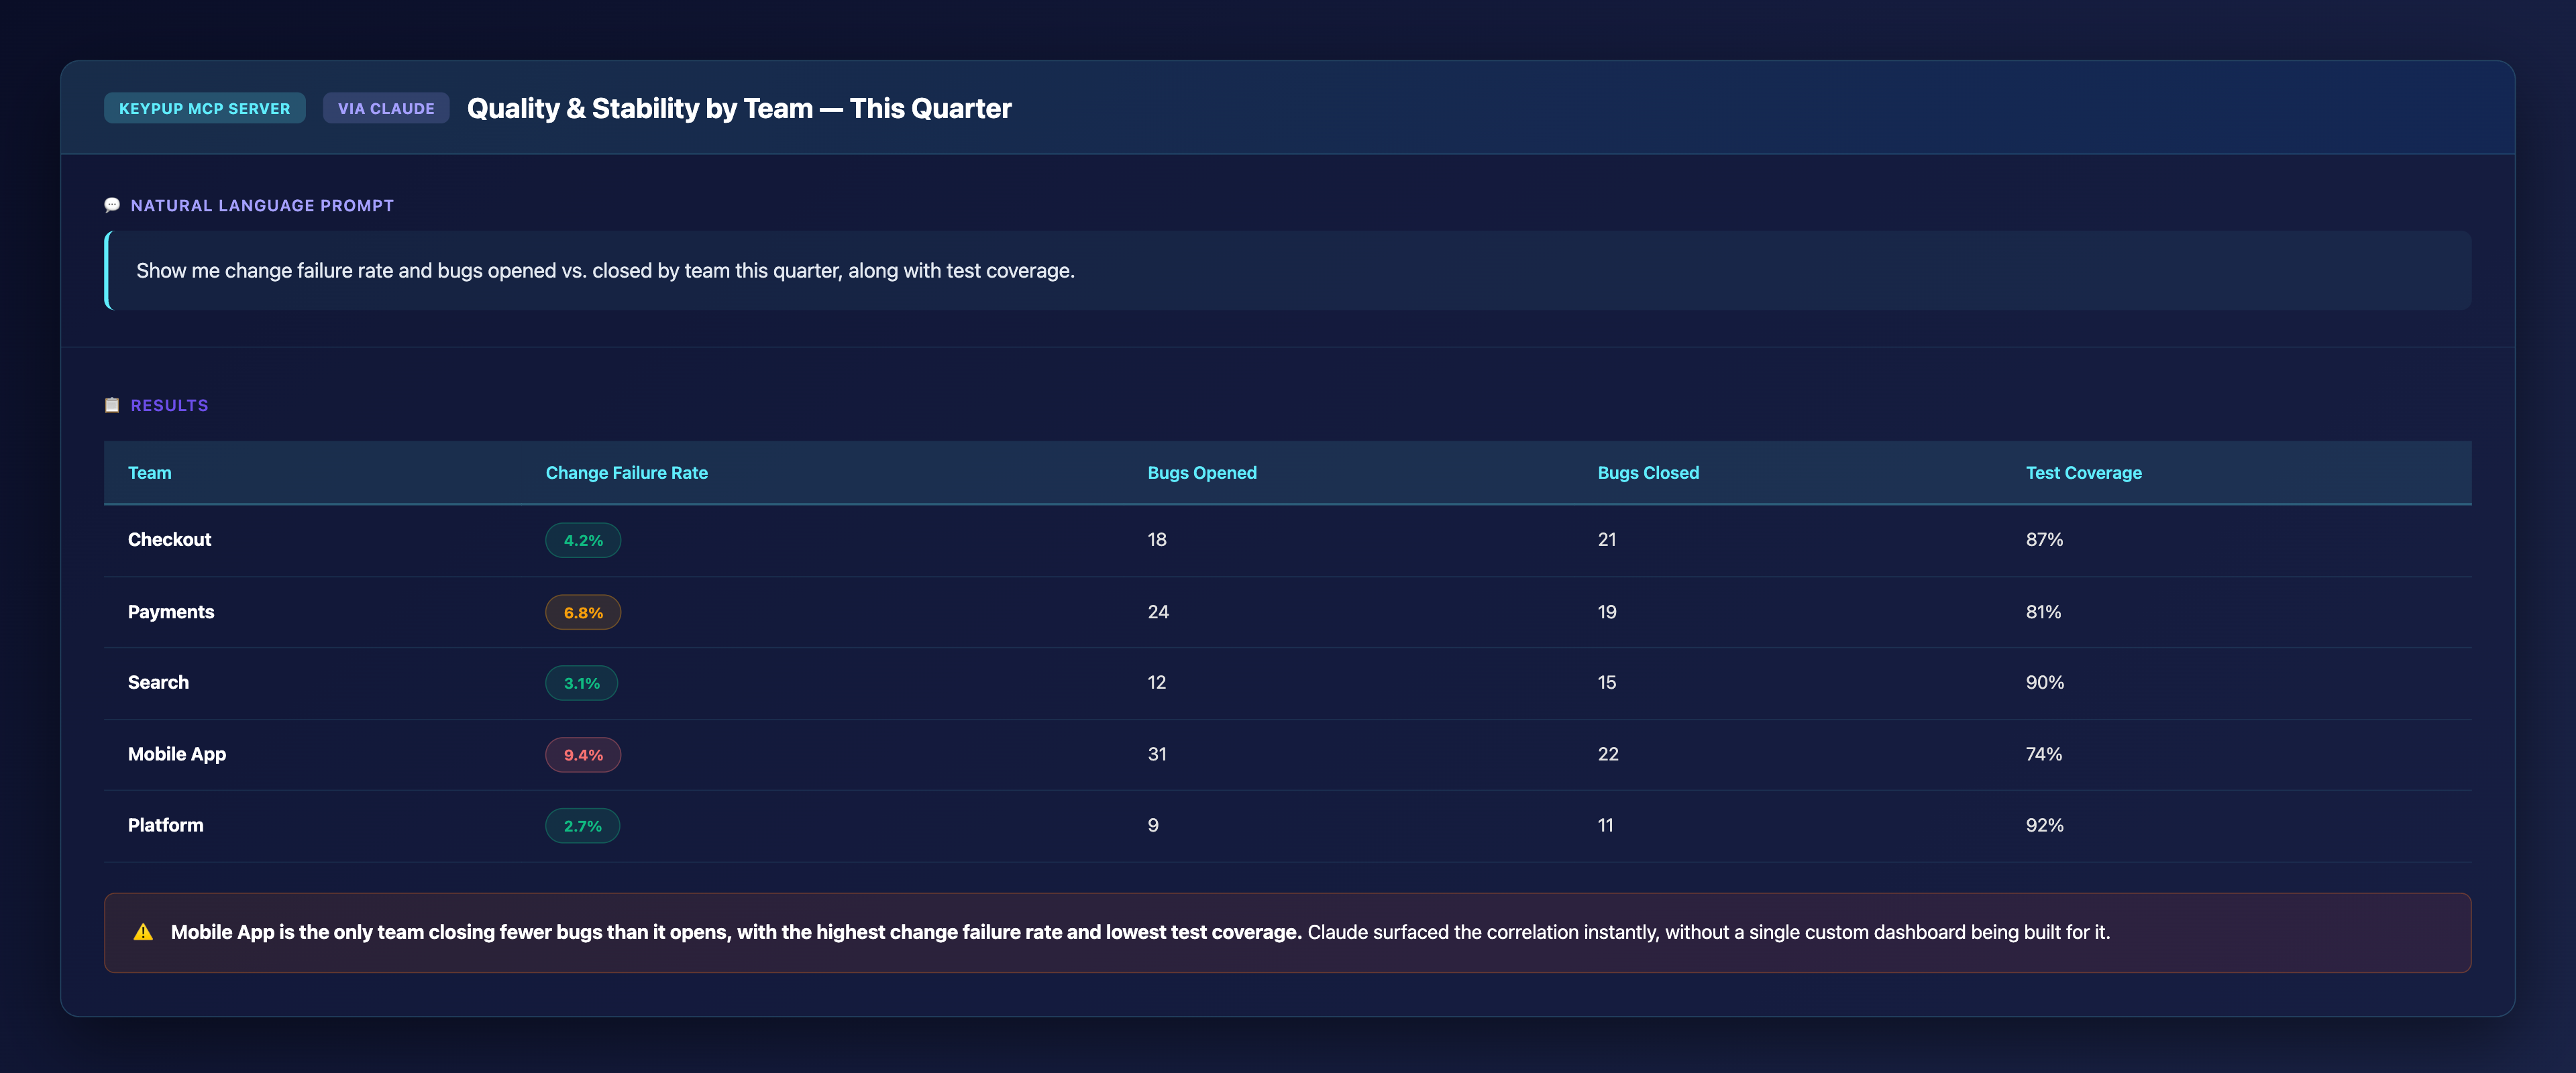
3. A Cross-Team Quality Comparison, No Custom Dashboard Needed
MCP Prompt (via Claude):
Show me change failure rate and bugs opened vs. closed by team this
quarter, along with test coverage.
Output: Quality & Stability by Team — This Quarter
Team
Change Failure Rate
Bugs Opened
Bugs Closed
Test Coverage
Checkout
4.2%
18
21
87%
Payments
6.8%
24
19
81%
Search
3.1%
12
15
90%
Mobile App
9.4%
31
22
74%
Platform
2.7%
9
11
92%
Key Insight: Mobile App is the only team closing fewer bugs than it opens, with the highest change failure rate and lowest test coverage. Claude surfaced the correlation instantly, without a single custom dashboard being built for it.
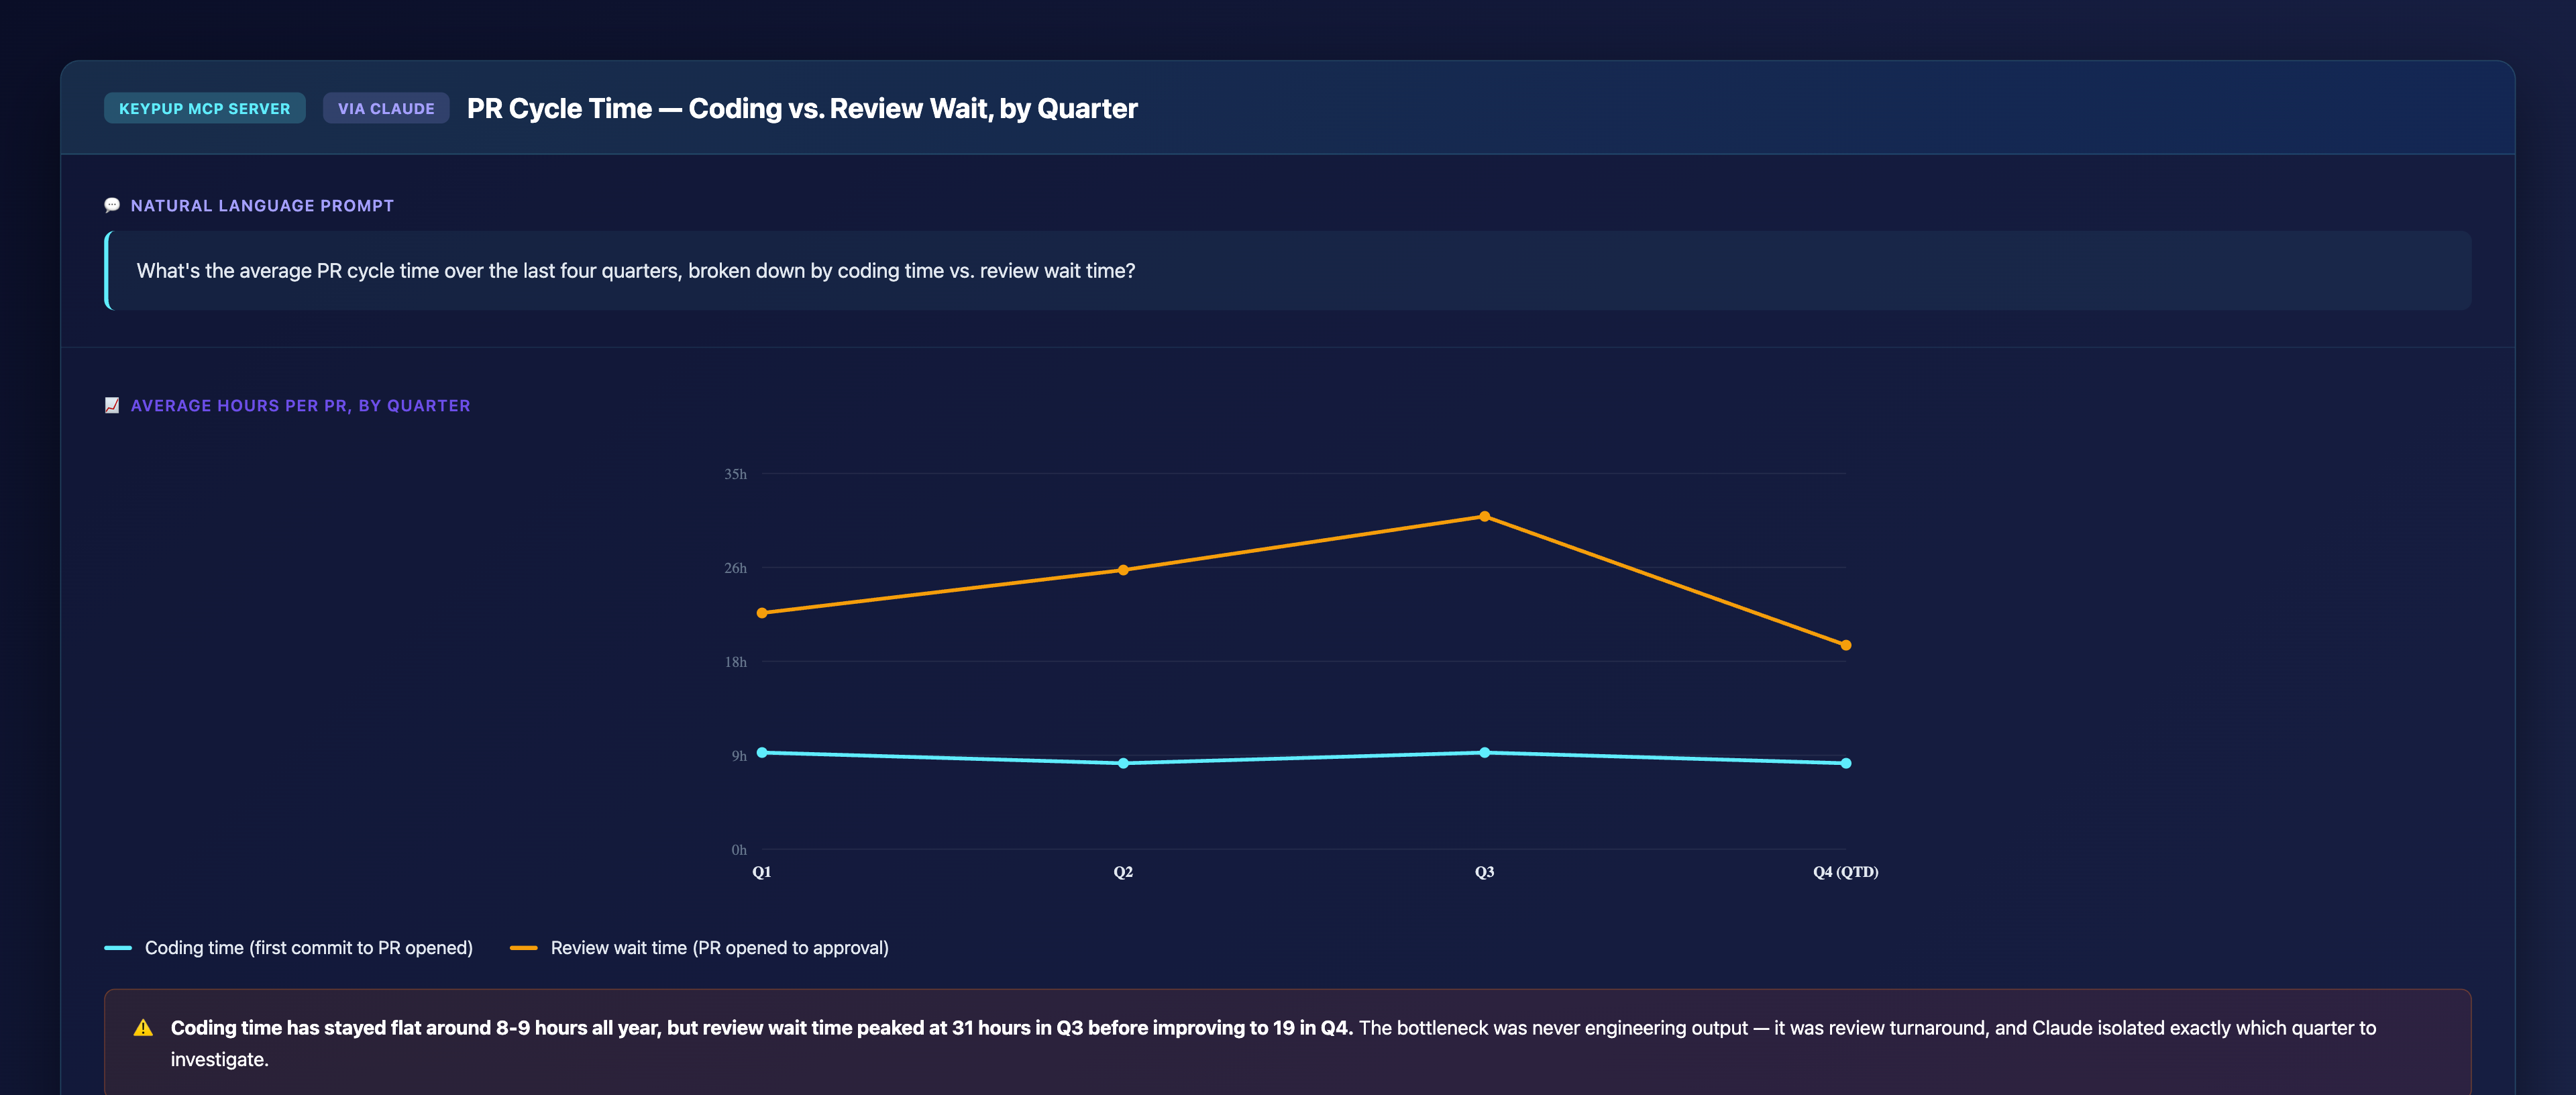
4. Isolating Exactly Where a Bottleneck Lives Over Time
MCP Prompt (via Claude):
What's the average PR cycle time over the last four quarters, broken
down by coding time vs. review wait time?
Output: PR Cycle Time — Coding vs. Review Wait, by Quarter
Key Insight: Coding time has stayed flat around 8-9 hours all year, but review wait time peaked at 31 hours in Q3 before improving to 19 in Q4. The bottleneck was never engineering output — it was review turnaround, and Claude isolated exactly which quarter to investigate.
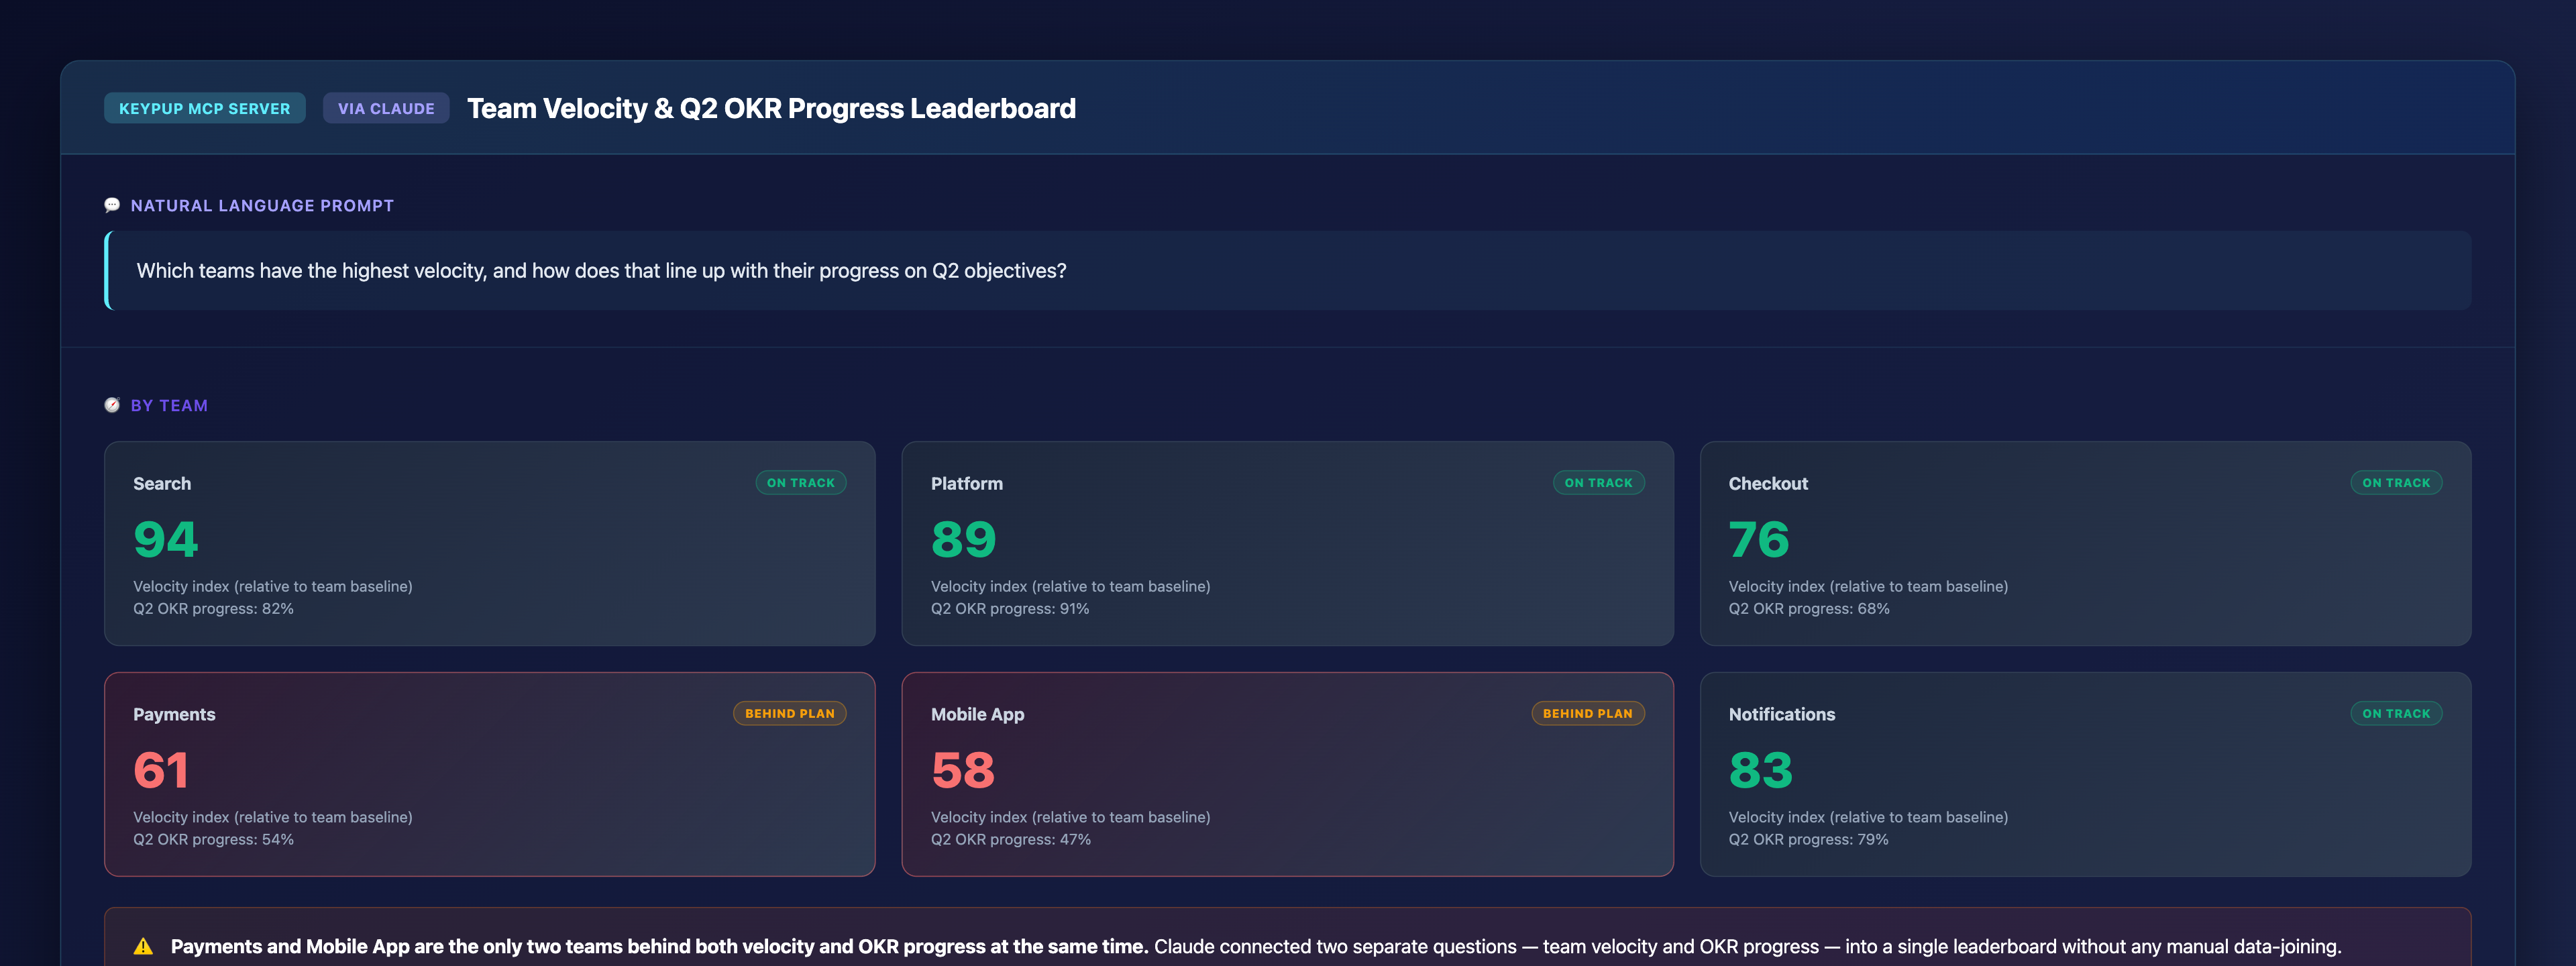
5. Joining Two Different Questions Into One Leaderboard
MCP Prompt (via Claude):
Which teams have the highest velocity, and how does that line up with
their progress on Q2 objectives?
Output: Team Velocity & Q2 OKR Progress Leaderboard
Key Insight: Payments and Mobile App are the only two teams behind both velocity and OKR progress at the same time. Claude connected two separate questions — team velocity and OKR progress — into a single leaderboard without any manual data-joining.
Why Use MCP With ChatGPT and Claude
No Learning Curve — ask questions in plain English, no need to learn query languages, SQL, or complex dashboards.
Instant Answers — get insights in seconds, not minutes, with no waiting for reports or custom queries to be built.
Context-Aware — both assistants remember your conversation, so you can follow up, compare time periods, and dive deeper without restating context.
Flexible Queries — build custom metrics on the fly, filtering, grouping, and aggregating data however the question requires.
Secure Access — ChatGPT's integration uses encrypted, authenticated MCP communication; Claude's uses OAuth with dynamic client registration for a secure sign-in flow with no API keys to manage.
AI-Powered Insights — get more than a number: trends, recommendations, and actionable advice generated alongside every answer.
What Engineering Leaders Are Saying
Keypup customers already relying on conversational, AI-assisted analytics describe the same shift in how quickly they can act on their engineering data.
"We increased our YoY productivity by 45% and Keypup helped us identify our pain points and change the game faster. Their support is the best – they helped us understand which metrics would suit our needs, built dashboards for us, and explained them in detail to us. With Keypup I can now say that we really manage our Engineering teams."
"I was genuinely impressed with Keypup, not only because of the ease and speed of integration with our tools but also because it provided immediate access to DORA and other key customizable metrics. The standout was the customer support — they swiftly provided a personalized dashboard that enabled me to comprehend and compute real-time metrics with remarkable ease."
— Murilo Oliveira, Head of Engineering, Juntos Somos Mais
Implementation: Getting Started With Both Integrations
1. Pick the Assistant Your Team Already Uses
If your team lives in ChatGPT, start there — the Keypup app is directly discoverable in the ChatGPT app directory. If your team is standardized on Claude or Claude Code, add Keypup as a custom MCP connector instead. Both expose the same underlying metrics.
2. Authenticate Once, Query Indefinitely
ChatGPT and Claude each connect to your Keypup account through a one-time authentication step — a simple sign-in for ChatGPT, OAuth with dynamic client registration for Claude. From that point on, every conversation has access to your engineering data.
3. Start With the Questions You Already Ask in Meetings
The fastest way to see the value is to type the exact question you'd normally ask a teammate or an analyst — "what's our deployment frequency this quarter," "which teams are behind on Q2 OKRs" — and let the assistant return the formatted answer directly.
4. Let Follow-Up Questions Do the Rest
Because both assistants retain conversation context, the second and third questions — "now break that down by team," "what about last quarter" — resolve without restating any filters, unlike navigating a dashboard from scratch each time.
The Bottom Line: Analytics Should Meet You Where You Already Work
Dashboards aren't going away, but they were never built to answer the question you think of in the moment, in your own words, with a natural follow-up. Keypup's MCP integrations with ChatGPT and Claude close that gap:
✅ Ask in plain English — no query language, no dashboard navigation required ✅ Get instant, formatted answers — KPIs, charts, and tables, not just raw numbers ✅ Keep full conversation context — follow-up questions build on what was already asked ✅ Choose the assistant your team already uses — ChatGPT or Claude, same underlying metrics ✅ Authenticate securely — encrypted MCP communication, OAuth with dynamic client registration for Claude
Whether your team lives in ChatGPT or Claude, Keypup's MCP server turns engineering analytics from something you have to go find into something you simply ask.
Get Started
Ready to ask your engineering metrics a question instead of building another dashboard?
Start Free Trial — Connect your engineering stack in minutes and start querying it from ChatGPT or Claude today.
Request Demo — See Keypup's MCP integrations with ChatGPT and Claude live, with your own use cases.
View MCP Documentation — Technical setup details for both the ChatGPT and Claude integrations.
Keywords: Keypup MCP server, ChatGPT engineering analytics integration, Claude MCP integration, Model Context Protocol engineering metrics, conversational engineering analytics, natural language DORA metrics, AI assistant engineering dashboards, OAuth MCP connector, ChatGPT Claude developer productivity, MCP server natural language queries
Ready to Transform Your Analytics?
Join teams already using AI to make data-driven decisions faster than
ever.
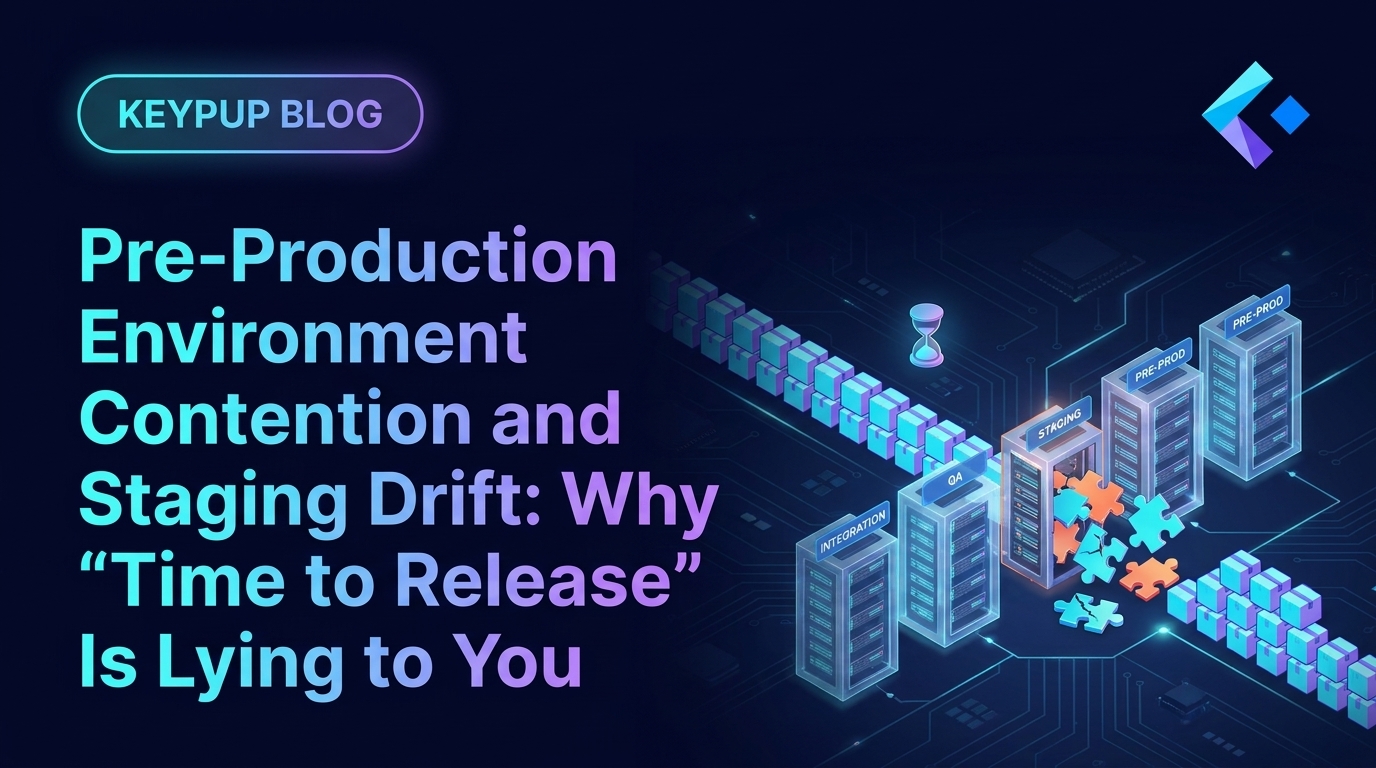
Enterprise releases don't move straight from commit to production — they queue through Integration, QA, UAT, Staging, and Pre-Prod, shared environments too expensive to replicate per team. Contention creates massive queues while staging drift causes builds to fail for reasons that have nothing to do with code quality. Standard SDLC analytics blame engineering for the resulting spike in Time to Release. Discover how Keypup MCP separates real code defects from environment queue wait and configuration drift, so leadership stops penalizing teams for infrastructure problems.
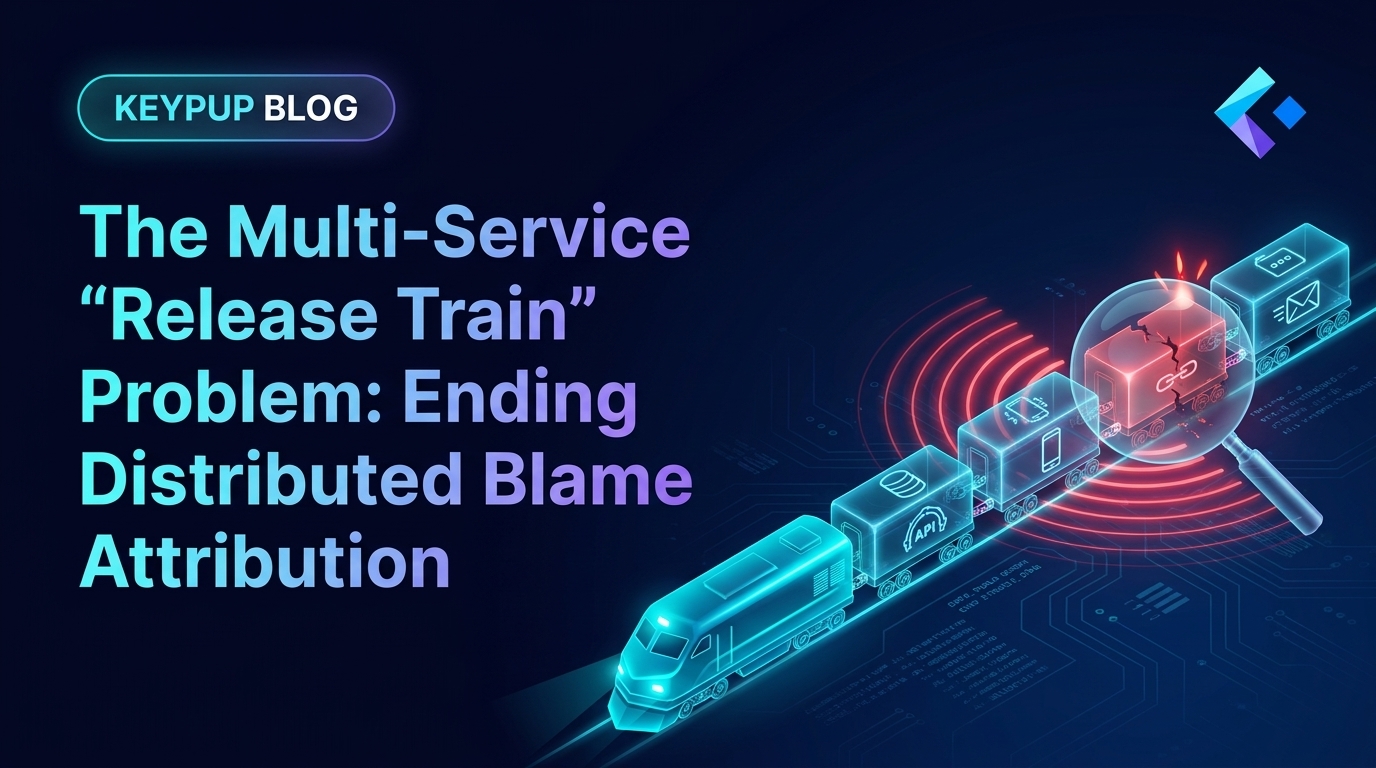
Enterprises with tightly coupled systems can't release one microservice at a time — dozens of teams get bundled onto synchronized "release trains" across shared databases and legacy message buses. When a train fails, standard SDLC dashboards flag every participating team with a Change Failure, even the ones whose code was completely stable. When one team's late pull request delays the whole train, nobody's metrics capture it. Discover how Keypup MCP performs root-cause attribution across repository boundaries, ending the finger-pointing that per-team dashboards can't resolve.
In regulated enterprises — finance, healthcare, telecom — code can be written, tested, and merged in three hours, then sit for two to three weeks waiting on a Change Advisory Board slot. DORA's Lead Time for Changes can't tell the difference between active engineering work and passive bureaucratic wait, so executive dashboards flag a "velocity problem" that doesn't exist. Discover how Keypup MCP decomposes Lead Time into engineering-controlled time versus CAB queue wait, exposes SLA-breaching change categories, and gives engineering leadership the receipts to stop absorbing blame for a compliance calendar.