The Thinking vs. Typing Gap: Why Your Best Engineers Look Unproductive and How to Measure What Really Matters
Lines of code don't measure architectural thinking, code review depth, or mentoring. Discover how Keypup's MCP Server reveals the invisible glue work that automated metrics miss—and why your most valuable engineers often appear least productive.
TL;DR: Traditional engineering metrics count what's easy to measure—commits, lines of code, PRs merged—but miss the high-value work that happens between keystrokes.
The Problem: Your most impactful engineers often look least productive because thinking, reviewing, mentoring, and system design leave minimal traces in git logs
The Gap: Automated analytics capture typing (code changes) but not thinking (architectural decisions, deep reviews, knowledge transfer, debugging investigations)
The Cost: Organizations inadvertently punish thoughtful engineering by rewarding output volume over outcome quality
The Solution: Keypup's MCP Server makes glue work visible through context-aware queries that reveal review depth, mentoring impact, knowledge distribution, and collaborative problem-solving
The Insight: High-performing teams show specific patterns in how knowledge flows, how reviews happen, and how problems get solved—patterns invisible to conventional metrics
Introduction: The Engineer Who Never Codes
Sarah is a Staff Engineer at a mid-sized SaaS company. In the past month, she:
Spent 15 hours in deep code review, leaving detailed feedback that prevented three architectural mistakes
Mentored two junior engineers through complex debugging sessions, teaching them system architecture along the way
Designed a solution for a thorny distributed systems problem, documenting the tradeoffs in a 20-page technical spec
Investigated a subtle performance regression that took four days to reproduce and understand
Participated in six architecture review meetings, asking the critical questions that saved weeks of rework
Her contribution is enormous. Her commit count for the month? Seven. Her lines of code? 342.
According to most engineering analytics dashboards, Sarah had a "slow month." According to her team, she prevented disasters and accelerated everyone else.
This is the thinking vs. typing gap—the fundamental mismatch between what automated metrics measure and what actually creates value in software engineering.
u/architect_reality from r/ExperiencedDevs
"I had my worst performance review ever the same quarter I prevented a multi-million dollar architectural mistake. My commit velocity was down because I spent three weeks researching, prototyping, and documenting why we shouldn't build what the exec team wanted. The system never measured that I saved the company from itself."
Understanding Glue Work in Software Engineering
The term "glue work" was popularized by Tanya Reilly to describe the critical but often invisible work that holds teams and projects together. In software engineering, glue work includes:
High-Value Activities That Leave Minimal Traces
Deep Code Review:
Asking questions that reveal hidden assumptions
Suggesting better architectural approaches
Teaching patterns through review comments
Preventing technical debt before it ships
System Design and Architecture:
Researching technology options
Prototyping approaches
Writing design documents
Modeling system behavior
Debugging and Investigation:
Reproducing elusive bugs
Tracing through complex systems
Reading source code of dependencies
Understanding system behavior under edge cases
Knowledge Transfer and Mentoring:
Pairing with junior engineers
Explaining system context
Documenting tribal knowledge
Teaching debugging techniques
Collaborative Problem Solving:
Participating in architecture discussions
Providing context in planning meetings
Unblocking teammates
Coordinating across teams
Why Automated Metrics Miss This Work
Traditional engineering analytics focus on artifacts (commits, PRs, lines changed) rather than activities (thinking, collaborating, investigating, teaching). The result is a massive blind spot:
What Metrics Capture:
✅ Commits pushed
✅ Pull requests opened
✅ Lines of code added/removed
✅ Issues closed
✅ Deploy frequency
What Metrics Miss:
❌ Hours spent in thoughtful code review
❌ Quality and depth of review feedback
❌ Time investigating complex bugs
❌ Mentoring and knowledge transfer
❌ Architectural design and research
❌ Preventing problems before they occur
u/senior_eng_blues from r/programming
"The engineers who get promoted are the ones who ship visible features. The engineers who should get promoted are the ones who make everyone else better—but that's nearly impossible to measure with standard metrics. We optimize for the wrong thing because it's easier to count."
The Cost of Invisibility
When glue work remains invisible, organizations inadvertently create perverse incentives that damage engineering culture and system quality.
1. Rewarding Volume Over Thoughtfulness
Engineers learn that thoughtful, careful work is less valued than rapid output. This leads to:
Superficial code reviews ("LGTM" without real engagement)
Rush to implement without proper design
Avoiding complex but important refactoring
Skipping documentation and knowledge sharing
u/tech_lead_burnout from r/cscareerquestions
"I stopped doing thorough code reviews because they weren't reflected in my metrics. My manager kept asking why my 'contribution' was down. Spending 3 hours on a review that prevents a production incident doesn't show up in dashboards, but churning out features does. Guess which behavior gets rewarded?"
2. Penalizing Senior Engineers
As engineers grow in seniority, their value increasingly comes from:
Strategic thinking over tactical execution
Force multiplication through mentoring
Risk mitigation through careful review
System design over feature implementation
Yet metrics often show them as "less productive" than junior engineers who write more code but create less impact.
3. Creating False Productivity Signals
Teams learn to game metrics:
Breaking changes into many small PRs to inflate counts
Avoiding complex, important work that doesn't produce visible output
Creating "busy work" that generates commits but not value
Optimizing for metric performance rather than actual outcomes
4. Losing Institutional Knowledge
When glue work is invisible, organizations fail to:
Recognize who holds critical system knowledge
Identify mentoring relationships
Understand how knowledge flows through teams
Plan for succession and knowledge transfer
How Keypup MCP Server Makes Glue Work Visible
Keypup's MCP Server integration brings a fundamentally different approach: instead of just counting artifacts, it enables context-aware analysis that reveals the thinking behind the typing.
By combining multiple data dimensions and enabling natural language queries, the MCP Server surfaces patterns that indicate high-value glue work.
Example 1: Measuring Review Quality and Depth
Code review is thinking-heavy work. Not all reviews are equal—a thoughtful review that asks critical questions and teaches patterns is far more valuable than a quick "LGTM."
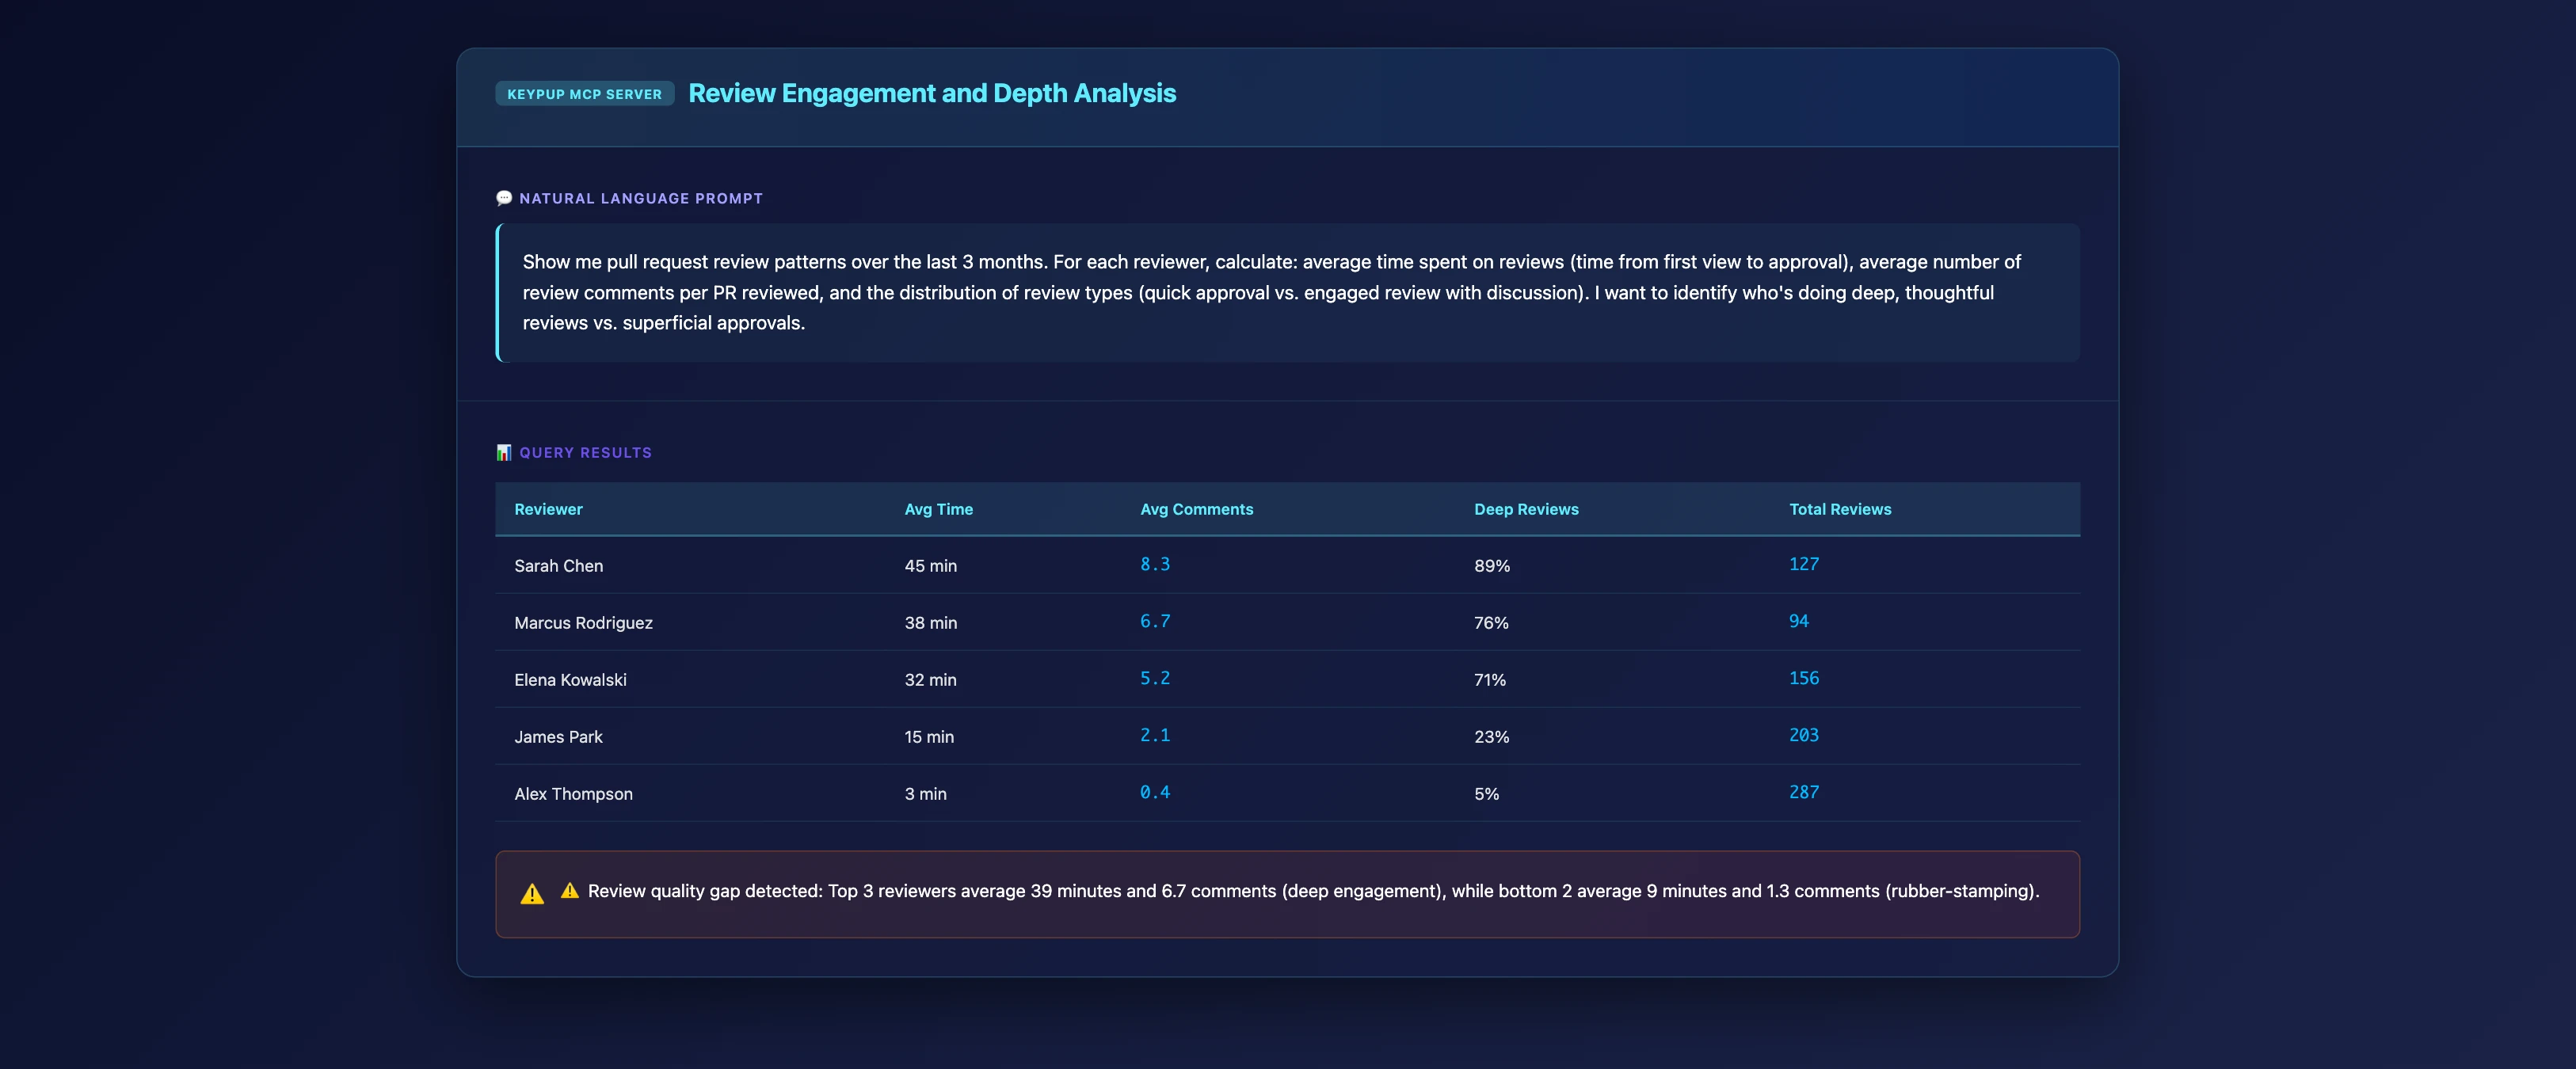
MCP Prompt: Analyze Review Engagement and Depth
Show me pull request review patterns over the last 3 months. For each reviewer, calculate: average time spent on reviews (time from first view to approval), average number of review comments per PR reviewed, and the distribution of review types (quick approval vs. engaged review with discussion). I want to identify who's doing deep, thoughtful reviews vs. superficial approvals.
What This Reveals
Key Insights 📊
Quality Differentiation: Senior engineers averaging 45 minutes per review with 8.3 substantive comments are doing fundamentally different work than those averaging 3 minutes with 0.4 comments
Hidden Value: Engineers with "low commit counts" but high review engagement are acting as force multipliers—their value comes from making others better
Teaching Indicators: Long reviews with many comments often indicate mentoring through feedback
Knowledge Concentration: If only 2-3 people do deep reviews, knowledge isn't distributing
Burnout Risk: Reviewers spending 10+ hours/week in deep review need support—this is exhausting, valuable work
💡 Recommendations
Recognize and reward engineers doing high-engagement reviews in performance evaluations
Set expectations: meaningful reviews take time and that's okay
Rotate review responsibilities to distribute knowledge and prevent burnout
Track review depth as a key contribution metric alongside code output
🚀 Priority Actions
Identify your top 3 "deep reviewers" and ensure they're recognized for this work
Set minimum review time expectations for complex changes (e.g., 15+ min for architectural changes)
Create review quality rubrics that value thoughtful engagement
Balance review load across the team to prevent burnout
Example 2: Uncovering Mentoring and Knowledge Transfer
Mentoring happens through pairing, code review, architecture discussions, and problem-solving help. These interactions are scattered across tools and rarely measured systematically.
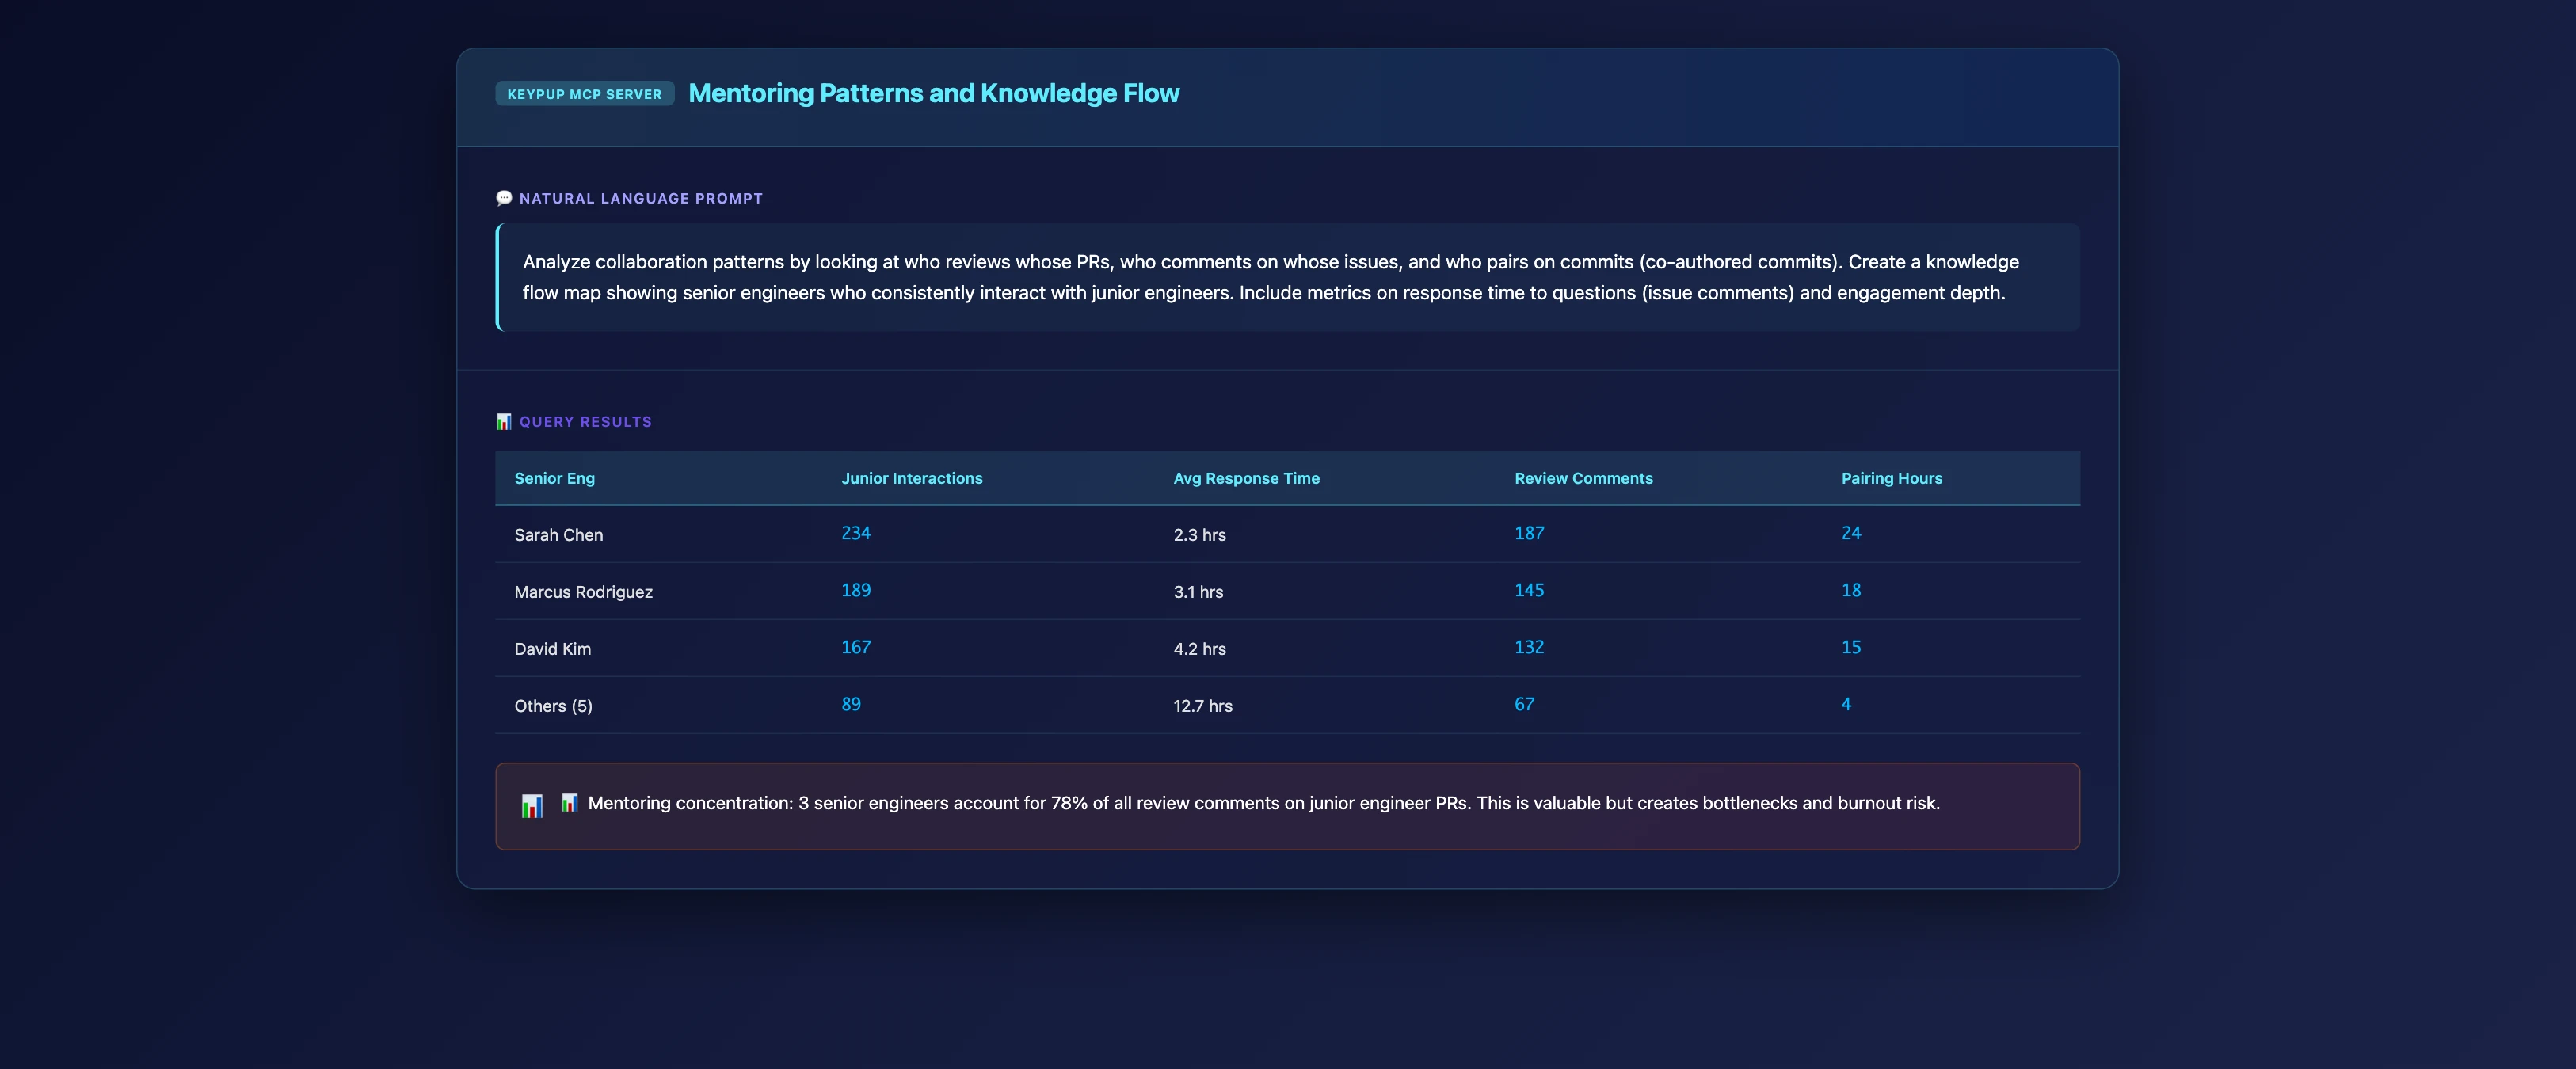
MCP Prompt: Identify Mentoring Patterns and Knowledge Flow
Analyze collaboration patterns by looking at who reviews whose PRs, who comments on whose issues, and who pairs on commits (co-authored commits). Create a knowledge flow map showing senior engineers who consistently interact with junior engineers. Include metrics on response time to questions (issue comments) and engagement depth.
What This Reveals
Key Insights 📊
Informal Mentoring Structure: Even without formal mentorship programs, clear patterns emerge of who teaches whom
Knowledge Bottlenecks: If 3 senior engineers handle 78% of junior engineer reviews, they're critical mentoring infrastructure
Mentoring Concentration: Heavy mentoring load on few individuals creates burnout and single points of failure
Isolation Patterns: Junior engineers receiving minimal review engagement or slow responses are at risk
Unrecognized Labor: Mentoring time often appears as "low productivity" in standard metrics
💡 Recommendations
Explicitly recognize mentoring contribution in performance reviews and promotion criteria
Distribute mentoring responsibility more evenly across senior engineers
Set response time SLAs for questions from junior engineers
Create formal mentorship pairs to make implicit support explicit
🚀 Priority Actions
Thank your heavy mentors—their work is invisible but invaluable
Identify junior engineers with minimal senior engagement and assign explicit mentors
Add "mentoring impact" as a promotion criterion for senior+ roles
Track mentoring time as billable contribution, not "overhead"
Example 3: Revealing Investigation and Debugging Effort
Some of the most valuable engineering work is understanding complex systems, reproducing bugs, and tracing through intricate code paths. This work generates minimal commits but prevents disasters.
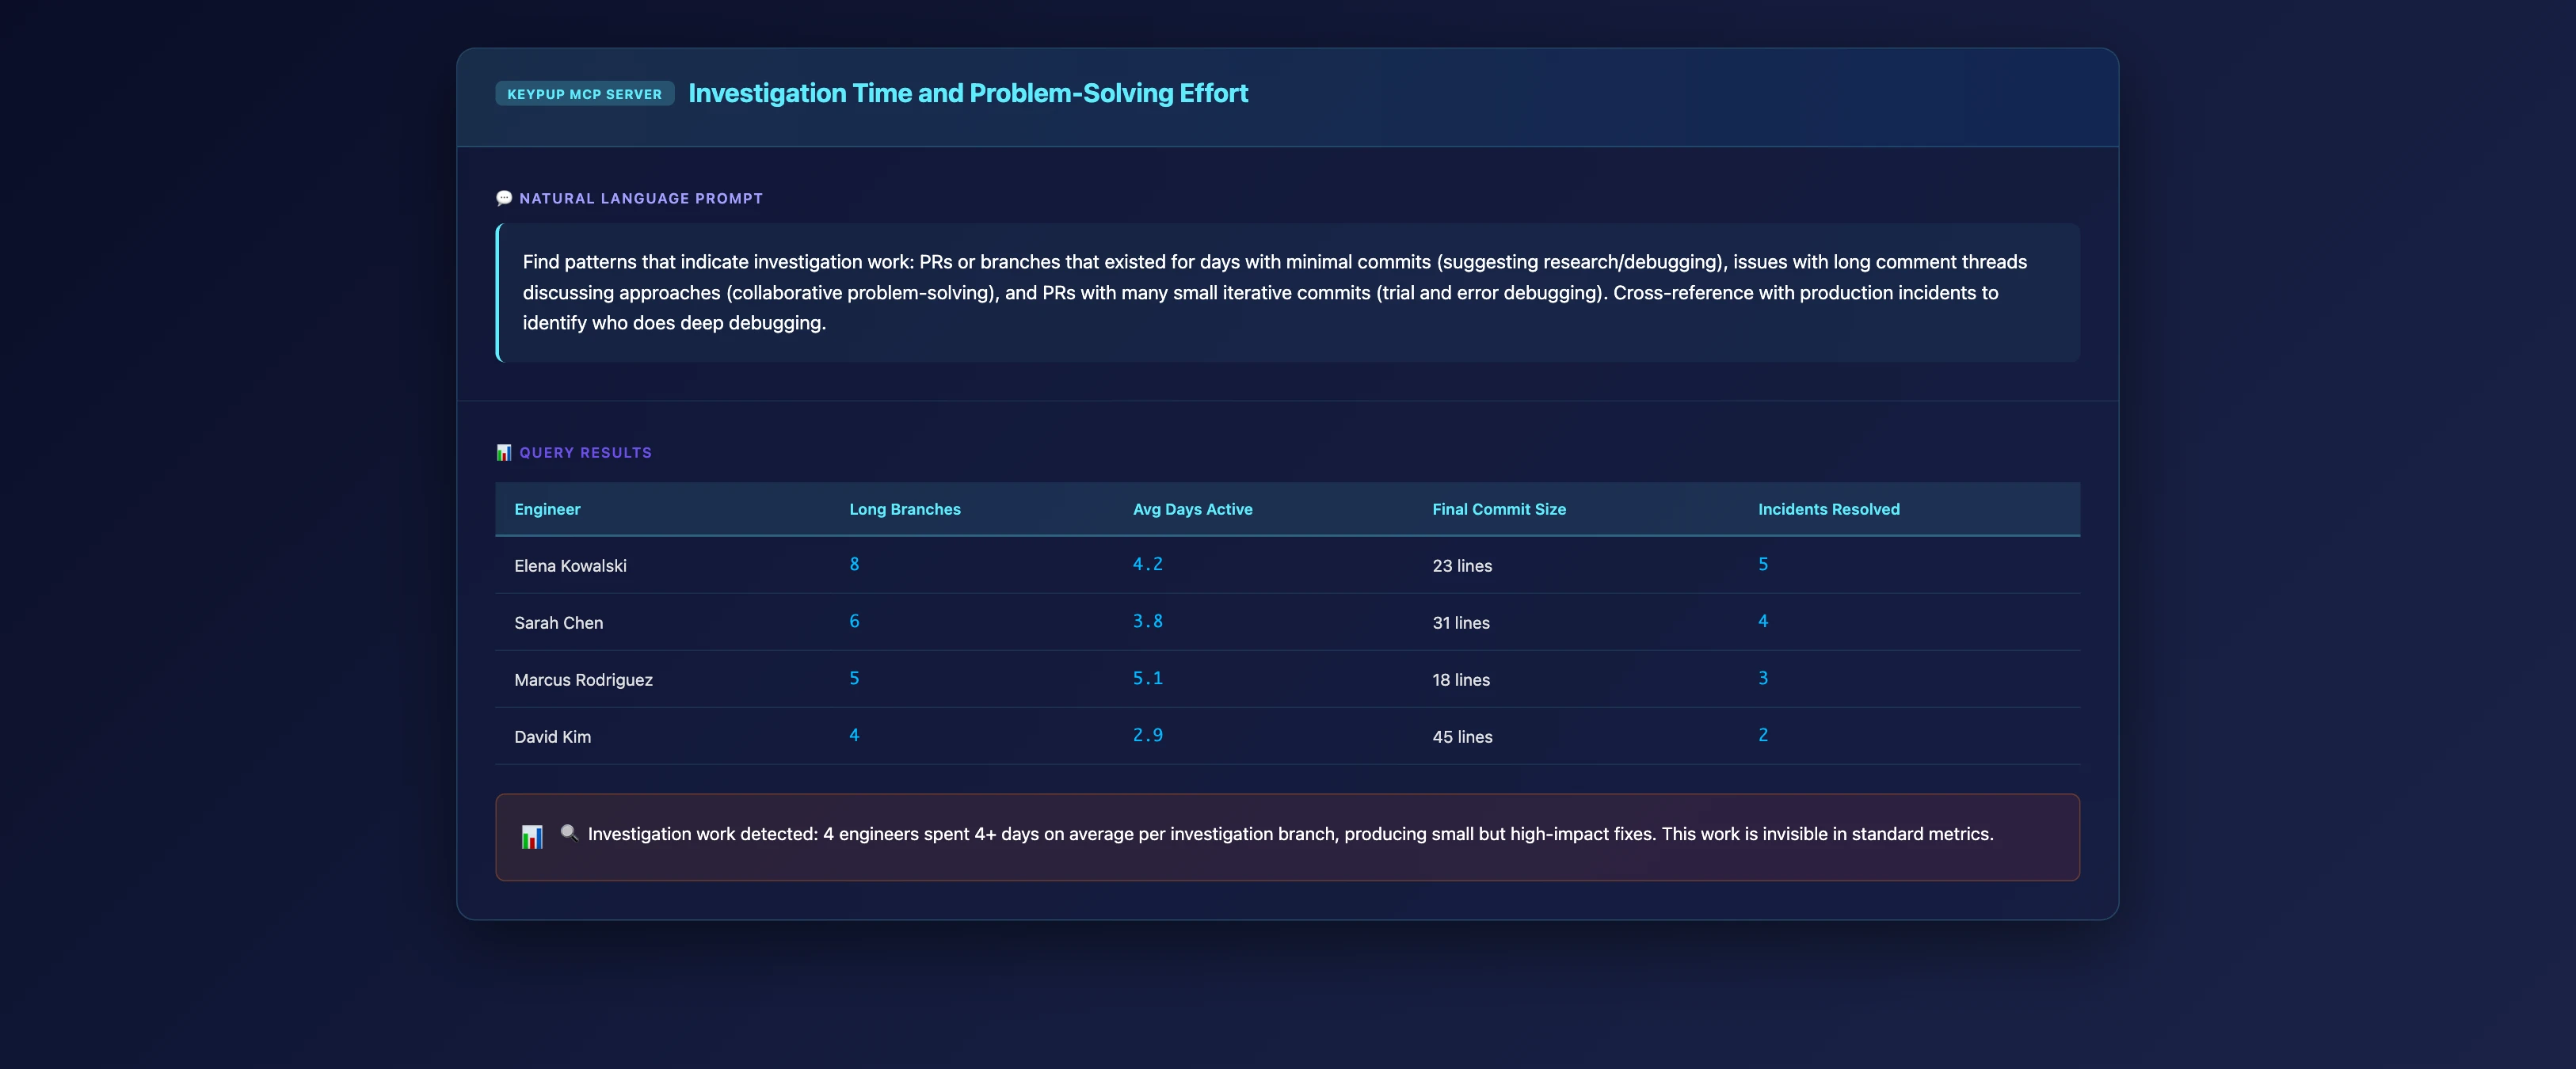
MCP Prompt: Track Investigation Time and Problem-Solving Effort
Find patterns that indicate investigation work: PRs or branches that existed for days with minimal commits (suggesting research/debugging), issues with long comment threads discussing approaches (collaborative problem-solving), and PRs with many small iterative commits (trial and error debugging). Cross-reference with production incidents to identify who does deep debugging.
What This Reveals
Key Insights 📊
Thinking Time Is Real Work: Branches active for days with minimal commits indicate deep investigation, not procrastination
High-Leverage Fixes: Small code changes after long investigation often have massive impact
Problem-Solving Depth: Long issue comment threads show collaborative debugging and system exploration
⚠️ Bottlenecks and Problem Areas
Invisible Effort: Engineers doing deep debugging appear "unproductive" by commit metrics
Knowledge Gaps: If only 1-2 engineers can debug complex issues, system knowledge isn't distributed
Burnout Risk: Constant firefighting and deep debugging is mentally exhausting
💡 Recommendations
Recognize investigation time as legitimate, high-value work
Document findings from deep debugging sessions to distribute knowledge
Track time-to-resolution for complex issues, not just commit frequency
Celebrate engineers who solve hard problems, regardless of commit count
🚀 Priority Actions
Identify engineers who consistently solve complex, ambiguous problems
Create "investigation success" metrics: problem solved per week, not code per day
Allocate dedicated time for deep work and debugging
Document system behavior learnings from debugging sessions
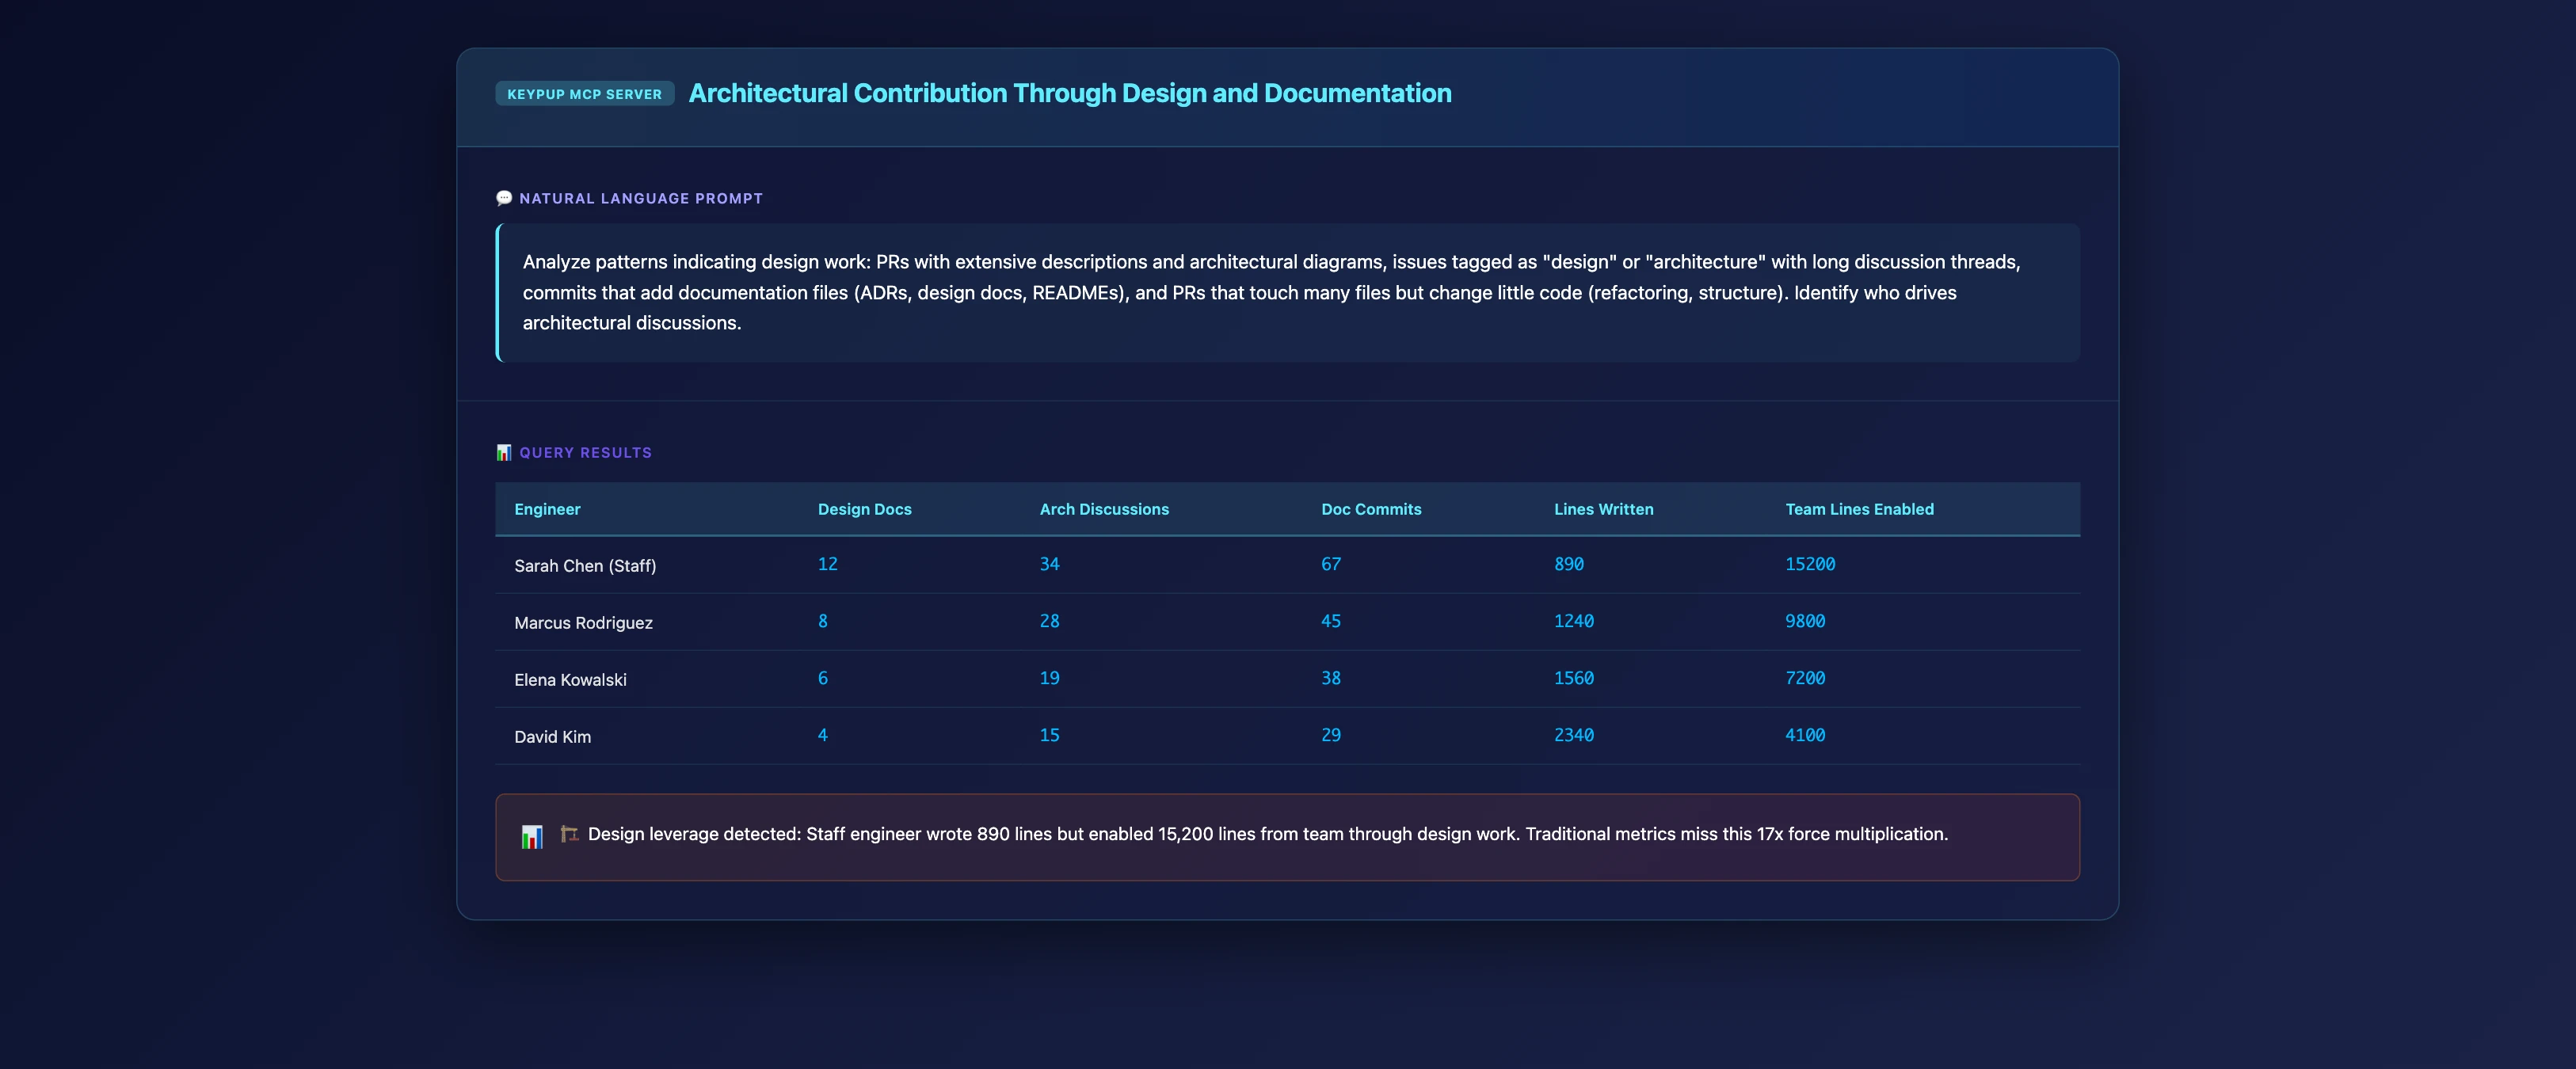
Example 4: Measuring Architectural Contribution and Design Work
System design, architecture decisions, and technical research generate documents, discussions, and prototypes—but often minimal production code.
MCP Prompt: Identify Architectural Contribution Through Discussion and Documentation
Analyze patterns indicating design work: PRs with extensive descriptions and architectural diagrams, issues tagged as "design" or "architecture" with long discussion threads, commits that add documentation files (ADRs, design docs, READMEs), and PRs that touch many files but change little code (refactoring, structure). Identify who drives architectural discussions.
The thinking vs. typing gap exists because we measure what's easy to count rather than what actually matters. Lines of code are tangible; thoughtful system design is nebulous. Commits are discrete; mentoring is continuous. Features shipped are visible; disasters prevented are invisible.
But just because something is hard to measure doesn't mean it's less valuable. In fact, in mature engineering organizations, the hardest-to-measure work—deep review, mentoring, architecture, debugging, knowledge transfer—is often the most valuable work.
Keypup's MCP Server integration doesn't solve this problem with a single metric. Instead, it enables the nuanced, context-aware analysis required to surface patterns that indicate high-value glue work. It makes the invisible visible—not through crude proxies, but through intelligent queries that understand how real engineering teams function.
The question isn't whether your engineers are being thoughtful, collaborative, and strategic. The question is whether your measurement systems can see it.
System legibility for glue work starts here.
Frequently Asked Questions
How do you measure "thinking time" objectively?
You can't measure thinking directly, but you can measure its artifacts and patterns: long-lived branches with few commits (investigation), extensive review comments (deep engagement), documentation commits (knowledge transfer), participation in design discussions. The MCP Server aggregates these signals to reveal patterns.
Won't engineers game these metrics too?
Any metric can be gamed, but glue work metrics are harder to fake than simple output metrics. It's easy to inflate commit counts; it's hard to fake sustained mentoring relationships or consistently thoughtful code reviews. The key is using multiple signals and patterns rather than single metrics.
How do you balance individual vs. team metrics?
The shift is from measuring individuals in isolation to understanding their impact on team outcomes. Ask: "Does this engineer make the team better?" rather than "How much did this individual produce?" The MCP Server enables both individual pattern analysis and team-level impact measurement.
What if senior engineers don't want glue work visible?
Some engineers worry that making their work visible will create expectations for even more glue work. The goal isn't to add more work—it's to recognize and value the work already happening. Visibility enables better load balancing and ensures glue work is distributed fairly.
How often should we run these analyses?
Monthly for ongoing monitoring, quarterly for deeper reviews, and always before performance evaluation cycles. The goal is continuous visibility, not occasional audits. Glue work patterns are most meaningful when tracked over time.
Can this work for small teams?
Yes, but patterns are clearer with 8+ engineers. In very small teams (< 5 people), everyone's glue work is relatively visible without formal measurement. The invisibility problem scales with team size and organizational complexity.
How do we change promotion criteria to include glue work?
Start by explicitly adding categories like "team enablement," "knowledge transfer," "technical leadership," and "force multiplication" to your engineering ladder. Use MCP Server analyses as evidence during promotion discussions. Make glue work count equally to shipping features.
What if our metrics show almost no one does glue work?
That's a cultural red flag. Either glue work genuinely isn't happening (unsustainable), or it's happening but engineers have learned to hide it because it's not valued. Create explicit space and recognition for glue work, then re-measure in 3 months.
Ready to Transform Your Analytics?
Join teams already using AI to make data-driven decisions faster than
ever.
Velocity looks fine, until your best engineers quit. Learn what engineering leaders on Reddit say about after-hours commits, weekend work and burnout at enterprise scale, and how Keypup MCP uses commit, review and merge timestamps to measure how much work happens outside working hours, where it concentrates, who is overloaded without naming anyone, and what it costs in skipped reviews.
Your median cycle time looks healthy, yet every release still ends in merge conflicts, rebases and big-bang reviews. Learn what engineering leaders on Reddit say about long-lived branches and the trunk-based vs GitFlow debate at enterprise scale, and how Keypup MCP uses pull request dates, target branches, commits, reviews and mergeability to measure branch lifetime, find where branches live longest and land aging work before it drifts into conflict.
Compare the 6 best engineering metrics tools for multi-team benchmarking in 2026 — Keypup, LinearB, Swarmia, Jellyfish, Faros and Appfire Flow — on cross-team benchmarking, org-level rollups, DORA Metrics, Git-to-ticketing linking, custom KPIs, AI capabilities and data security. See how to compare teams on equal terms and find where your delivery process is broken.