TL;DR: "When a measure becomes a target, it ceases to be a good measure." Goodhart's Law perfectly describes what happens when you use git analytics for individual performance reviews: developers game the system, split PRs artificially, inflate story points, and focus on metrics over value. Keypup's MCP Server fixes this by providing contextual benchmarking that recognizes mentoring, architecture work, and team contributions—transforming metrics from surveillance into culture-building insights.
The Metric Gaming Epidemic
You rolled out git analytics. You can finally see who's merging PRs, who's reviewing code, who's closing tickets. Data-driven performance management, right?
Three months later, your senior engineer submits 47 PRs in a sprint (last quarter's average: 8). Your junior dev's story point velocity tripled overnight. Your architect who used to mentor everyone now has zero PRs for two weeks.
Congratulations: Your team is gaming your metrics.
This isn't malice—it's survival. When metrics become performance targets, rational engineers optimize for the target, not the outcome. Welcome to Goodhart's Law in action.
The Reddit Reality Check
"My manager started tracking 'PRs merged per sprint' after reading some productivity blog. Guess what happened? I now split every feature into 5-7 micro-PRs. Each one is technically mergeable but makes no sense in isolation. Code review became a joke because reviewers can't understand context across 6 PRs. Velocity looks great on the dashboard. Product quality tanked. But hey, my performance review was stellar because I 'increased output by 300%.'"
"We introduced story point tracking tied to bonuses. Within two sprints, every ticket mysteriously became 8 or 13 points. What used to be '2 points: add a validation field' became '8 points: implement comprehensive validation framework with full test coverage.' Same work, inflated estimates. Planning became a negotiation game instead of capacity planning. Nobody trusts the process anymore."
"I spend 60% of my time on architecture reviews, design docs, mentoring juniors, and unblocking other teams. My git stats look pathetic: 3 PRs last month, mostly documentation updates. Meanwhile, a dev who cranks out features (ignoring tech debt, skipping reviews, writing zero docs) has 5x my 'productivity metrics.' Guess who got the better performance rating? I'm looking for a new job."
"Pro tip I learned from a colleague: If your company tracks LOC (lines of code), write verbose code. Expand one-liners. Add comments for obvious things. Split imports across multiple lines. My 'productivity' doubled and management thinks I'm a rockstar. Actual value delivered? Same as before, just more noise. The game is the game."
Sound familiar? This isn't hypothetical—it's happening in thousands of engineering teams right now.
Understanding Goodhart's Law: Why Metrics Break When They Become Targets
Goodhart's Law (economist Charles Goodhart, 1975): "When a measure becomes a target, it ceases to be a good measure."
Applied to software development:
- As an indicator: "Our team merged 127 PRs this quarter" → Useful signal about activity
- As a target: "Each developer must merge 12+ PRs per sprint or face review consequences" → Metric becomes meaningless, behavior gets distorted
The Gaming Playbook: How Developers Respond
When individual performance metrics become evaluation criteria, rational engineers employ these strategies:
1. PR Inflation: Death by a Thousand Micro-Commits
- Split logical features into 5-10 tiny PRs
- Each PR is "technically valid" but incomprehensible in isolation
- Code review quality collapses (reviewers can't see the full picture)
- Merge counts soar, actual throughput stays flat or decreases
2. Story Point Manipulation: Anchoring Bias as Strategy
- Systematically overestimate every ticket during planning
- What was "2 points" last quarter becomes "5 points" this quarter (same work)
- Velocity metrics look impressive, predictability becomes impossible
- Planning meetings turn into negotiation theater
3. Low-Hanging Fruit Prioritization: Avoiding Hard Problems
- Cherry-pick simple, high-visibility tasks
- Avoid complex architectural work (risky, time-consuming, hard to quantify)
- Dodge debugging and firefighting (unpredictable, doesn't show in metrics)
- Ignore tech debt (no immediate metric benefit)
4. Shadow Work Evasion: Making Invisible Work Stay Invisible
- Stop mentoring juniors (no git commits)
- Skip architecture reviews (no PR count)
- Avoid pair programming (only one person gets commit credit)
- Minimize documentation (not tracked as "output")
- Refuse cross-team coordination (time-consuming, no personal metric gain)
5. Quality Sacrifice: The Race to the Bottom
- Skip thorough testing (takes time, reduces PR throughput)
- Rush code reviews to keep review count high
- Ignore refactoring opportunities (doesn't count as "new work")
- Write just enough code to close the ticket, not code that lasts
The Organizational Costs
The damage extends far beyond distorted metrics:
Trust Erosion:
- Engineers perceive metrics as surveillance, not support
- Team members compete instead of collaborate
- Junior devs learn to game instead of grow
- Psychological safety collapses
Quality Degradation:
- Technical debt compounds (nobody wants to fix it—no metric credit)
- Code review becomes rubber-stamping (reviewers are also optimizing for metrics)
- Documentation disappears (takes time, doesn't boost stats)
- Architecture coherence fragments (everyone optimizes locally)
Knowledge Silos:
- Seniors stop mentoring (time spent mentoring = lower personal metrics)
- Juniors don't pair program (both participants' individual stats suffer)
- Cross-team collaboration dies (coordination overhead with no personal benefit)
- Institutional knowledge stops flowing
Talent Flight:
- Your best people leave (they're often the ones doing invisible high-value work)
- Metric-optimizers stay (they've learned to thrive in the system)
- New hires learn gaming behavior from day one
- Culture becomes toxic
Why Individual Performance Metrics Fail: The Missing Context Problem
Raw individual metrics fail for one fundamental reason: Software development is a team sport embedded in a complex system.
The Context That Disappears
When you measure an individual in isolation, you lose:
1. Role Differentiation
- Architect: 3 PRs/month, but each one unblocks 10 other engineers
- Junior Dev: 15 PRs/month, but each needs 3 hours of mentoring and 2 rounds of rework
- Senior Dev (mentoring): 8 PRs/month, but enables 2 juniors to deliver 30 PRs combined
- DevOps Engineer: 6 PRs/month, but they're infrastructure changes that 50 engineers depend on
Who's more "productive"? Isolated metrics say junior dev. Reality says architect.
2. Work Type Complexity
Not all PRs are created equal:
- Refactoring a legacy authentication system: 1 PR, 3 weeks, touches 200 files, prevents 6 months of future pain
- Adding a button to the UI: 1 PR, 2 hours, 15 lines changed
- Debugging a race condition in production: 1 PR, 4 days, changes 5 lines but requires deep system understanding
Counting PRs treats these as equivalent. They're not.
3. Team Contribution Patterns
High-value activities that don't show in individual git stats:
- Mentoring: Teaching juniors, pairing on complex problems, career guidance
- Architecture: Design docs, technical RFCs, system modeling
- Coordination: Cross-team planning, dependency management, stakeholder communication
- Quality assurance: Thorough code reviews, testing strategy, refactoring advocacy
- Incident response: On-call rotation, debugging production issues, post-mortems
- Tooling improvements: Developer experience work, CI/CD optimization, documentation
These are essential. They're also invisible to "PRs per week" metrics.
4. Career Stage and Growth Mode
- Ramping engineer (first 3 months): Low output is expected and healthy
- Mentored junior (learning mode): Lower individual output, but growing capability
- Knowledge transfer (pre-departure or role change): Deliberately focusing on documentation and mentoring
- Innovation phase (R&D, prototyping): Lots of experimentation, little merged code
Measuring everyone with the same yardstick ignores career context.
The Right Way: Contextual Benchmarking with Keypup MCP
The solution isn't to abandon metrics—it's to use them contextually and collaboratively, not punitively.
Keypup MCP provides a different approach: Benchmark individuals within their team and role context, accounting for the full spectrum of contribution.
Principle 1: Individuals in Context, Not Isolation
Instead of: "Alice merged 4 PRs this sprint (team average: 9), therefore Alice is underperforming."
Use contextual analysis:
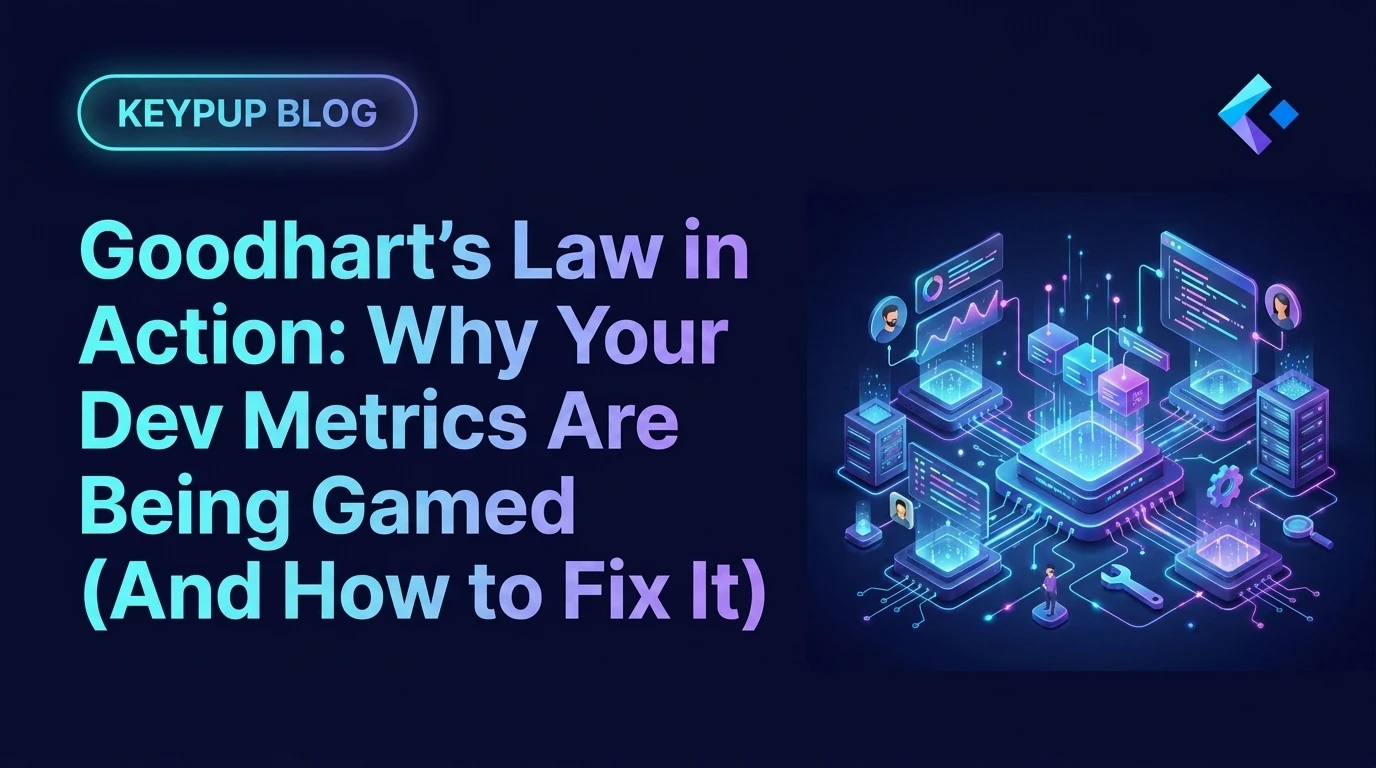
Contextual Individual Contribution Analysis
Analyze Alice's contribution to the team over the last sprint. Include: PR activity, code review participation, issue resolution, mentoring indicators (PR guidance, pair programming patterns), architecture work (design docs, RFCs), cross-team coordination (external PR reviews, dependency management), and on-call/incident response. Compare her contribution mix to the team's needs and her role expectations.
What you discover:
- Alice merged 4 PRs (below team average)
- But: Alice led 23 code reviews with an average 2.1x thoroughness score vs. team baseline
- Alice pair-programmed with juniors on 8 occasions (team lead)
- Alice authored 2 architecture RFCs that unblocked 3 other team members
- Alice was on-call lead for 3 critical incidents (resolved in avg 34 minutes)
Conclusion: Alice's contribution profile is "senior tech lead"—high leverage, team-multiplier activities. Her value is higher than raw PR count suggests, not lower.
Principle 2: Comparative Analysis Across Similar Roles and Contexts
Don't compare:
- Junior dev to senior architect
- Feature team engineer to platform engineer
- Developer in "growth/learning mode" to developer in "independent delivery mode"
Do compare:
- Similar roles across teams (accounting for team dynamics)
- Same person's trajectory over time (growth curve)
- Role-adjusted benchmarks (expected patterns for that career stage)
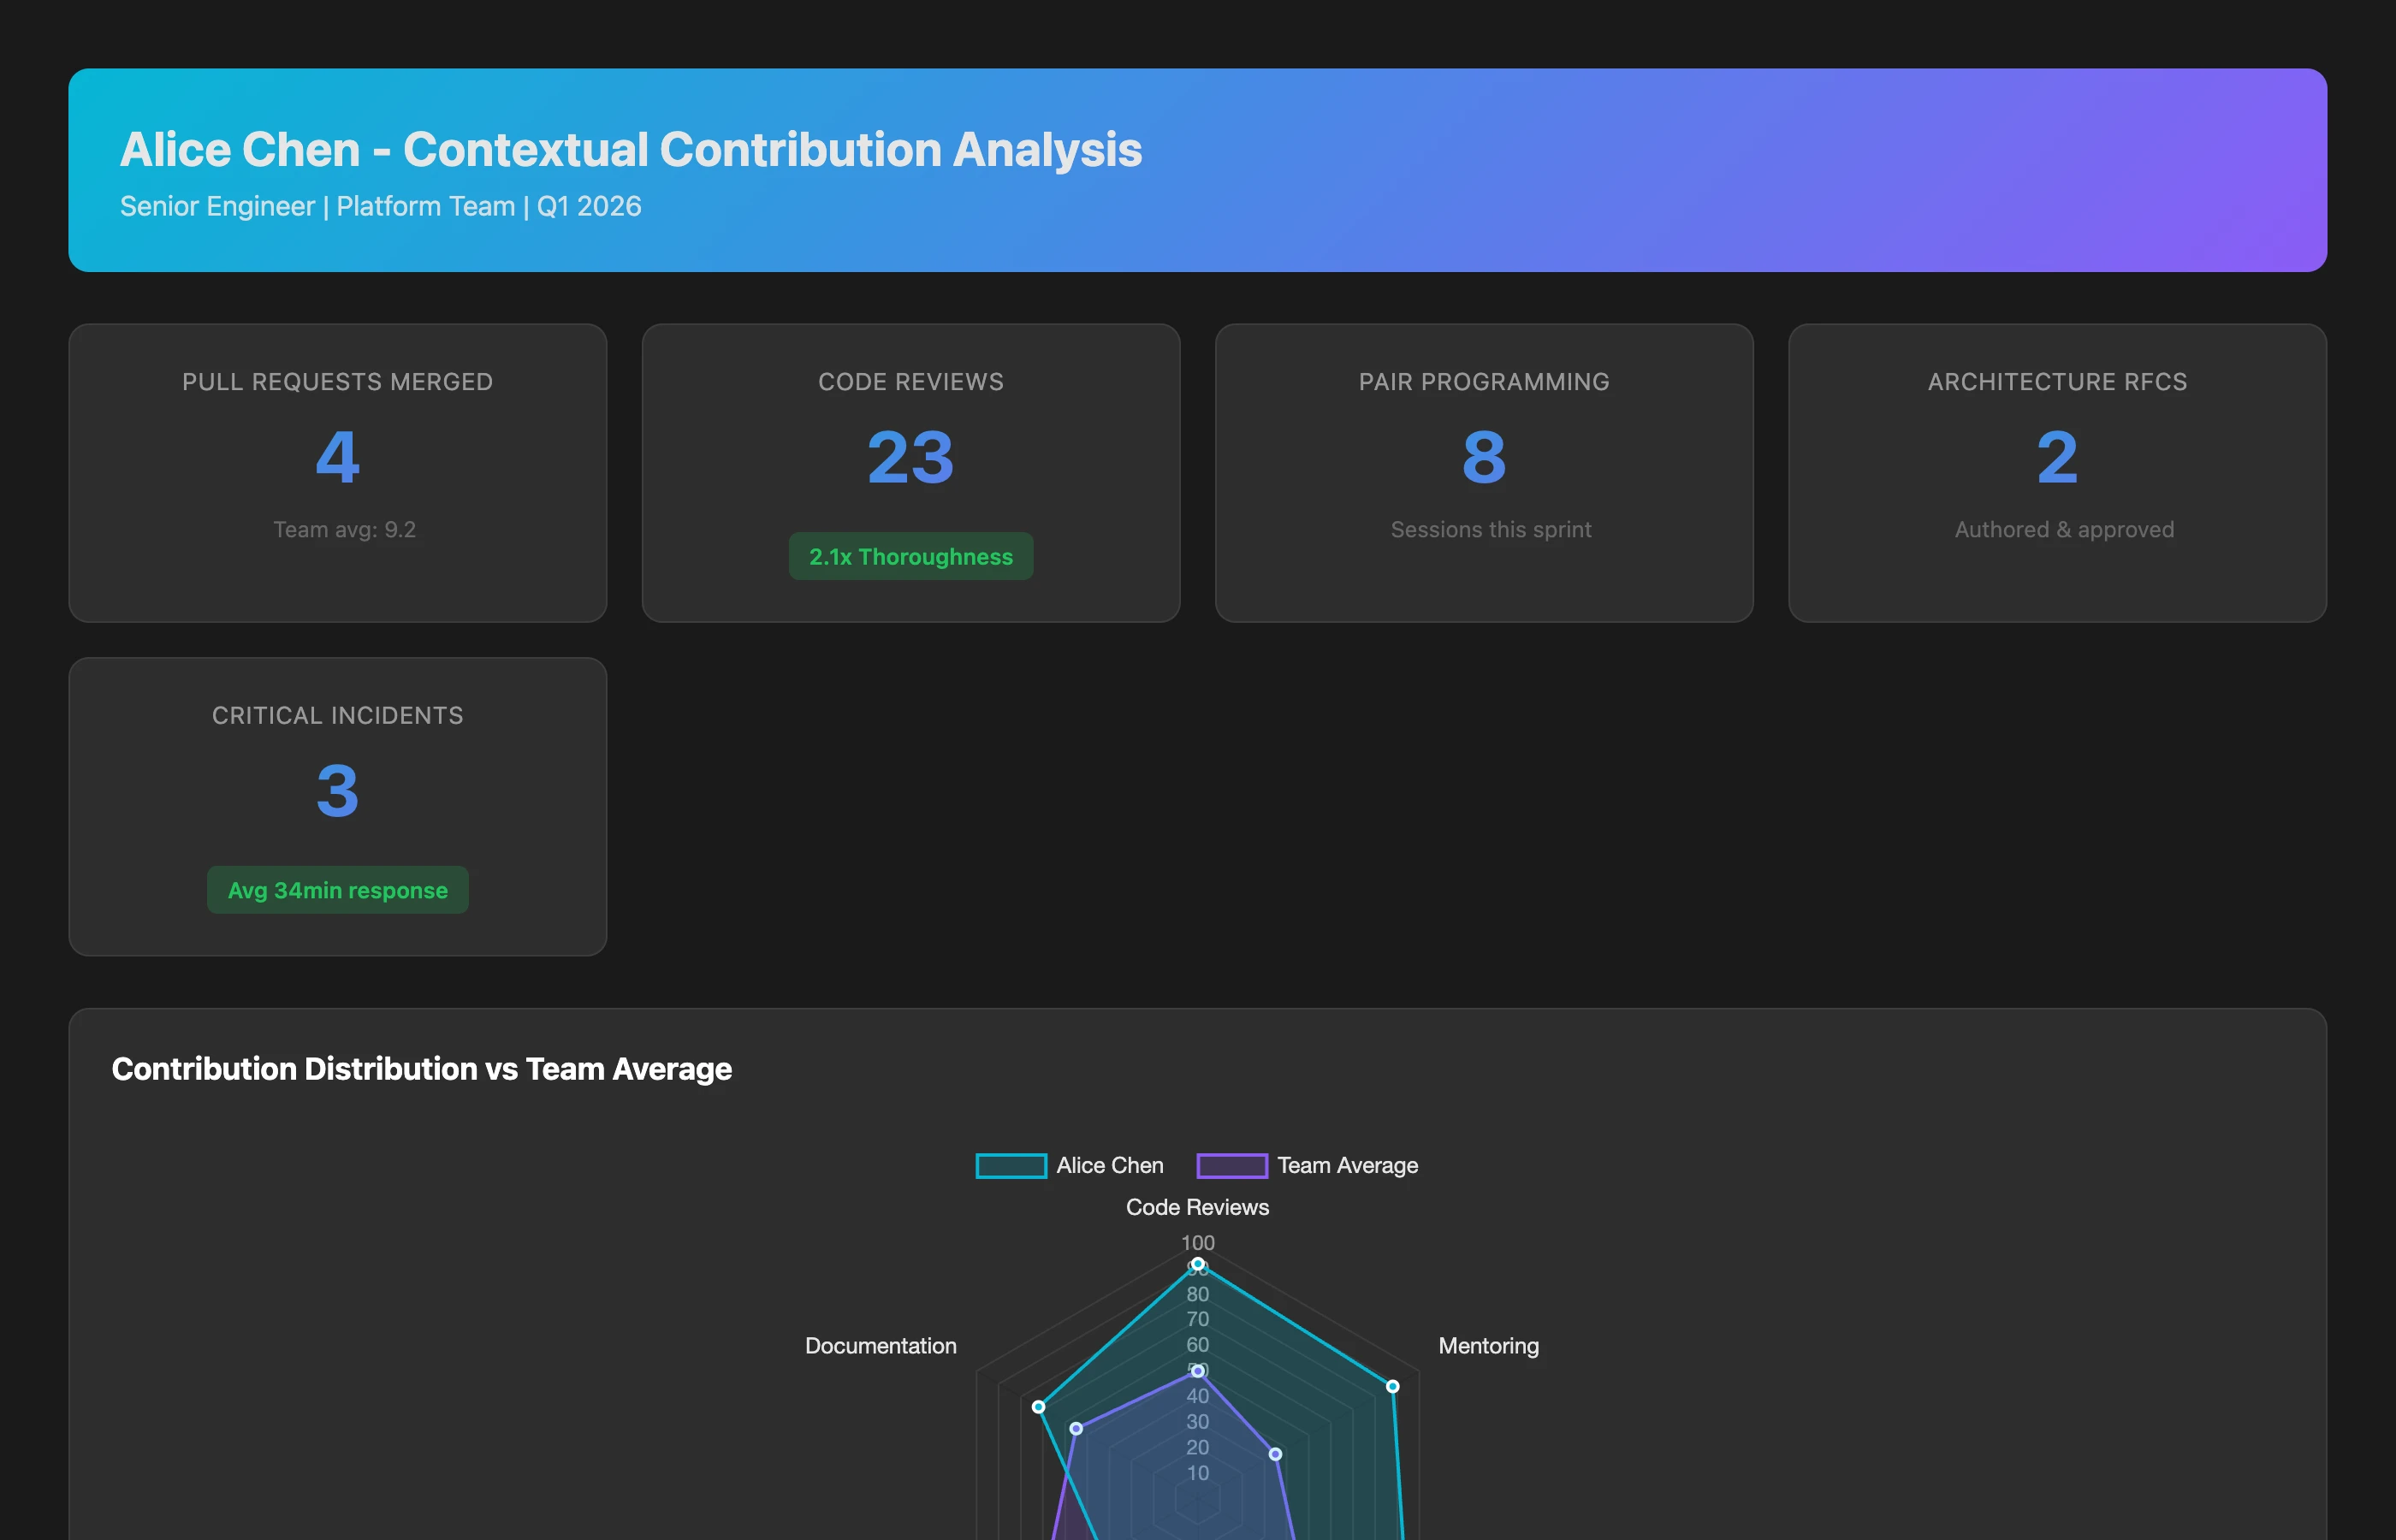
Role-Adjusted Benchmarking Analysis
Compare the contribution patterns of all mid-level engineers (L3/L4 equivalent) across our engineering organization over the last quarter. Segment by: primary responsibilities (feature development, infrastructure, tooling), team composition (ratio of senior to junior members), and work complexity (legacy refactoring vs greenfield development). Identify patterns and outliers, accounting for role context.
What you discover:
- Feature teams: Higher PR velocity (11/sprint avg), lower mentoring time (3%), greenfield work
- Platform teams: Lower PR velocity (6/sprint avg), higher cross-team coordination (12% of time), infrastructure complexity
- Legacy refactoring teams: Lowest PR velocity (4/sprint), highest debugging time (22%), each PR touches 40+ files on average
Conclusion: Comparing a platform engineer's 6 PRs/sprint to a feature engineer's 11 PRs/sprint is meaningless. Context matters.
Principle 3: Recognize and Quantify Invisible Work
Make shadow work visible:
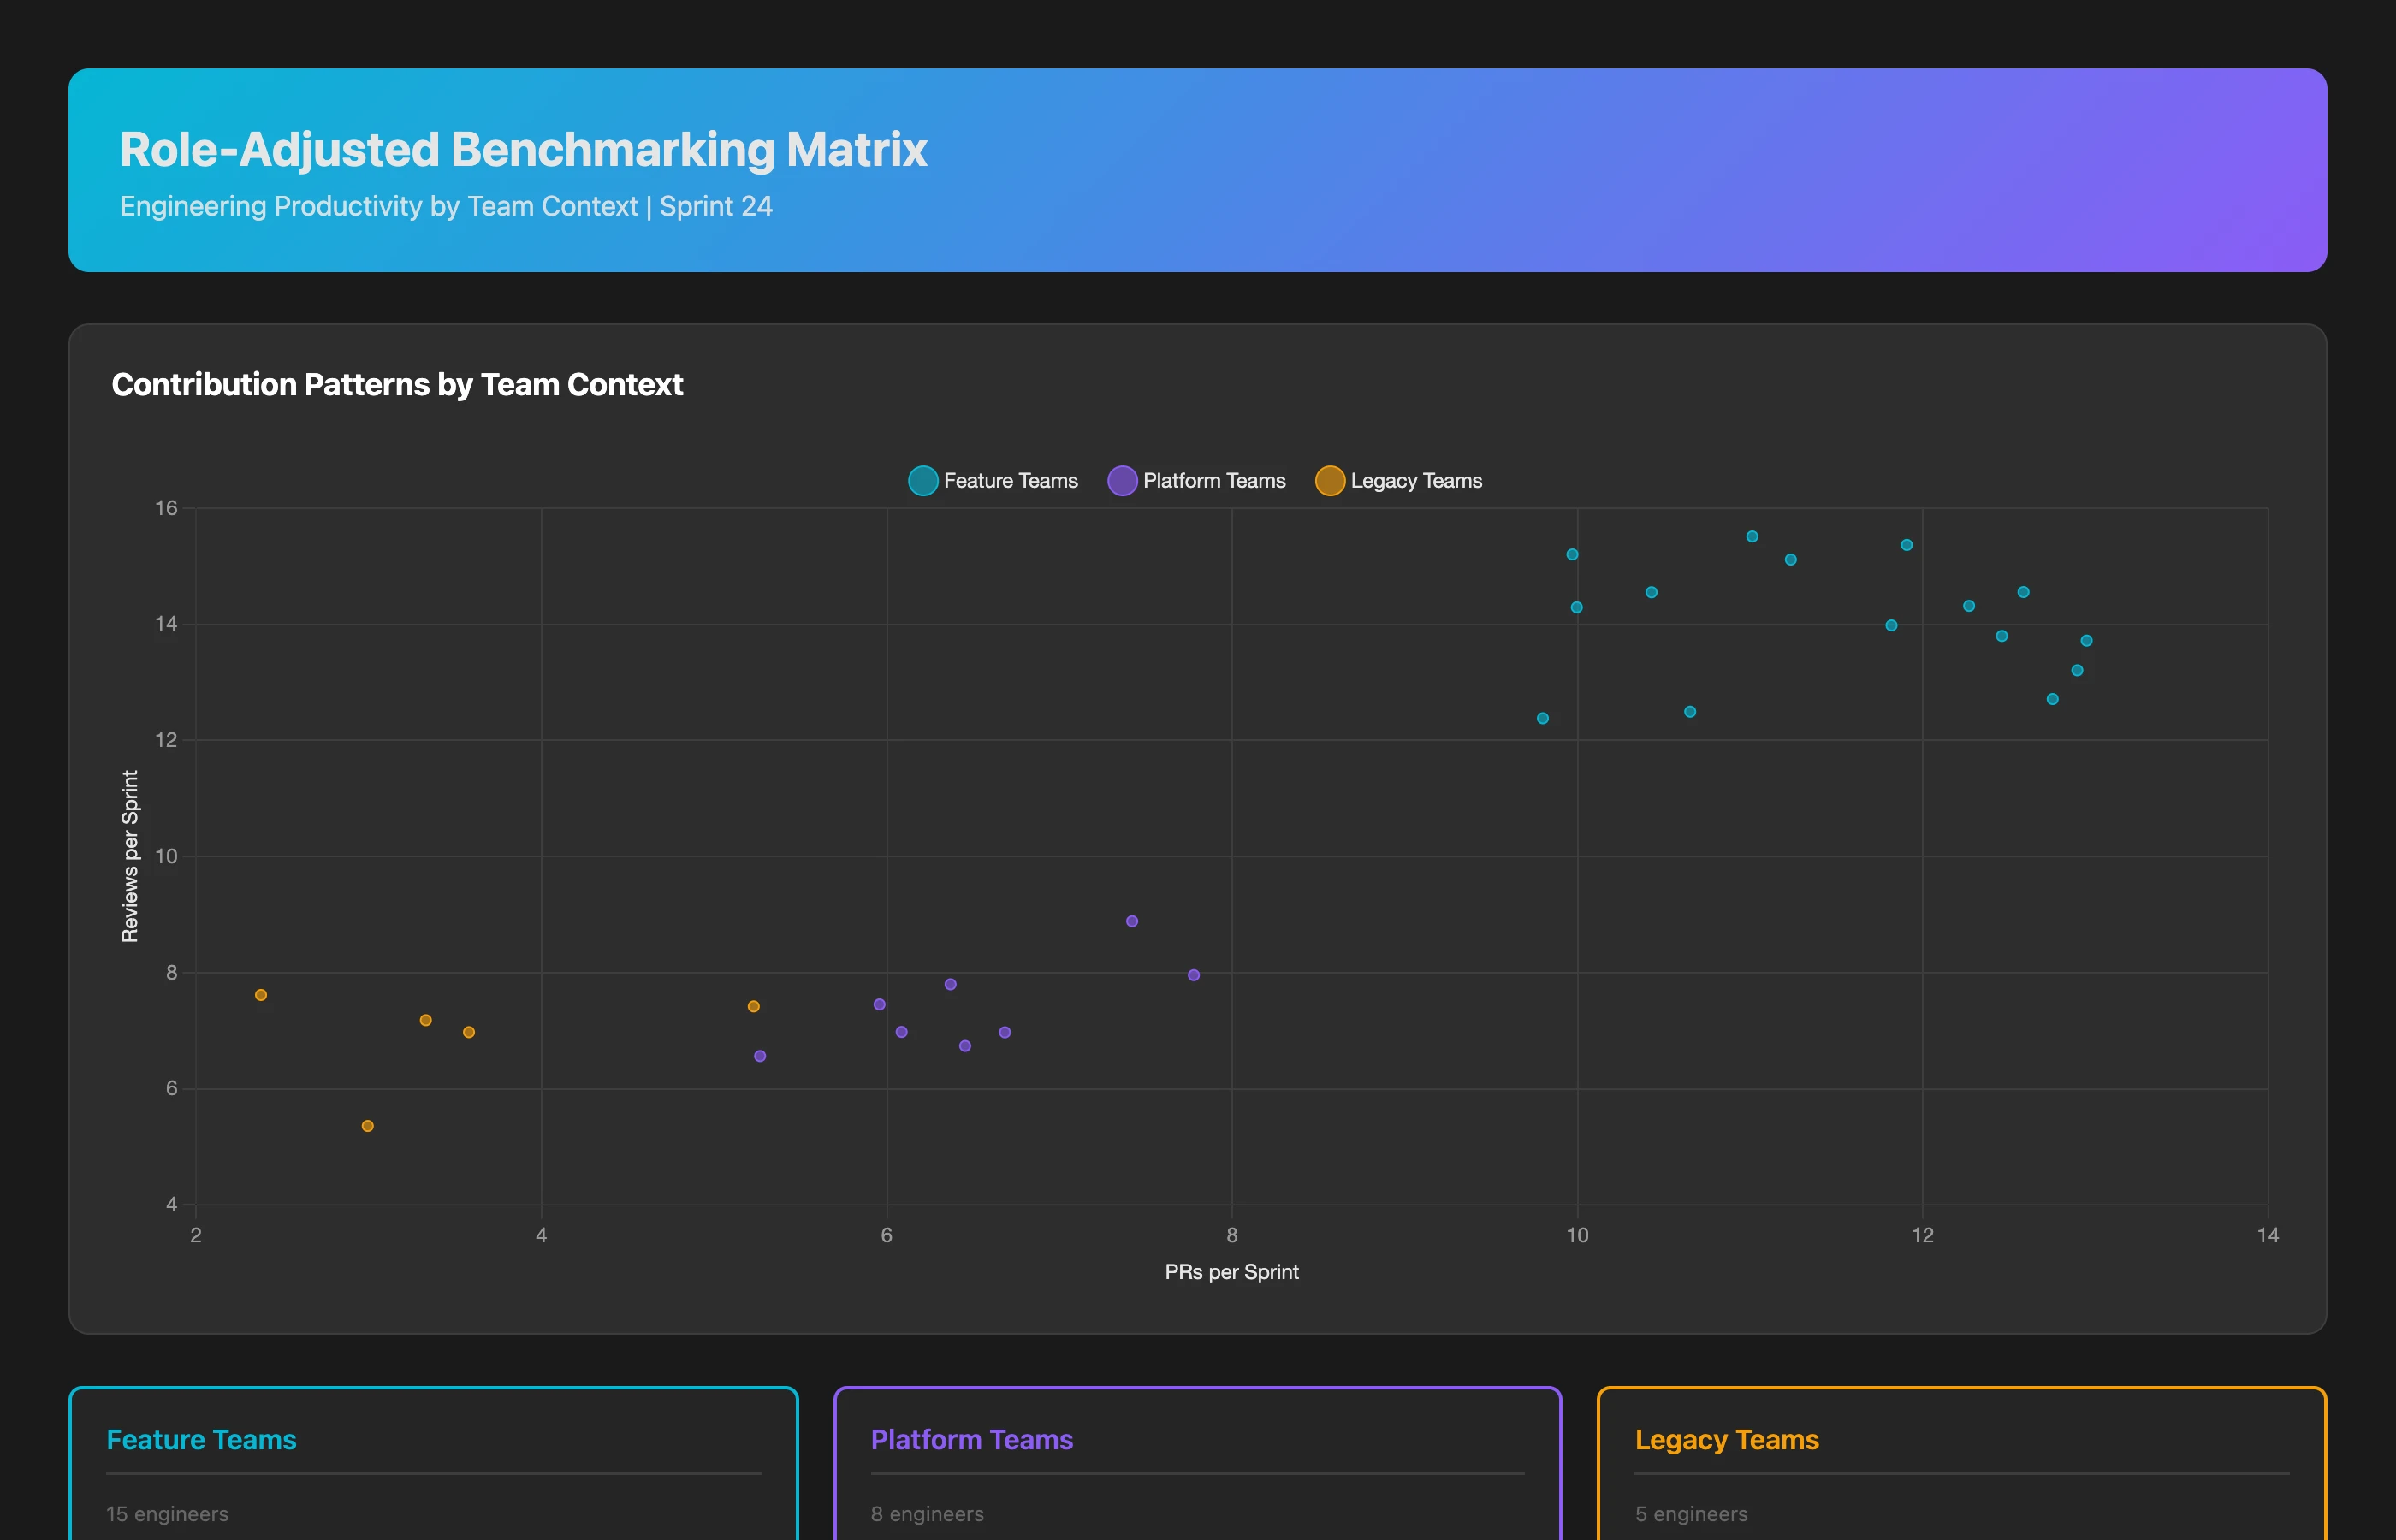
Shadow Work Quantification Analysis
For each team member over the last quarter, quantify time spent on activities that don't produce direct git commits: code review thoroughness and frequency, mentoring patterns (pair programming sessions, PR guidance to juniors), architecture contributions (design doc authorship, RFC participation), incident response (on-call participation, debugging time), documentation (README updates, technical writing), and cross-team coordination (external reviews, dependency management). Compare individual patterns to team needs.
What you discover:
- Sarah (architect): 25% time on own PRs, 75% on reviews/architecture/coordination → Expected senior/architect pattern
- Mark (senior engineer): 40% own work, 35% mentoring juniors, 15% code reviews, 10% incidents → Team multiplier, high leverage
- Emily (junior, 6 months tenure): 80% own work, 20% learning/pairing → Expected growth pattern
- Team average: 55% visible work (git commits), 45% invisible work (reviews/mentoring/coordination)
Conclusion: Traditional metrics capture only 55% of actual team contribution. The other 45% is essential but invisible.
Principle 4: Track Growth and Development, Not Just Output
Measure trajectory, not snapshots:
Individual Growth Trajectory Analysis
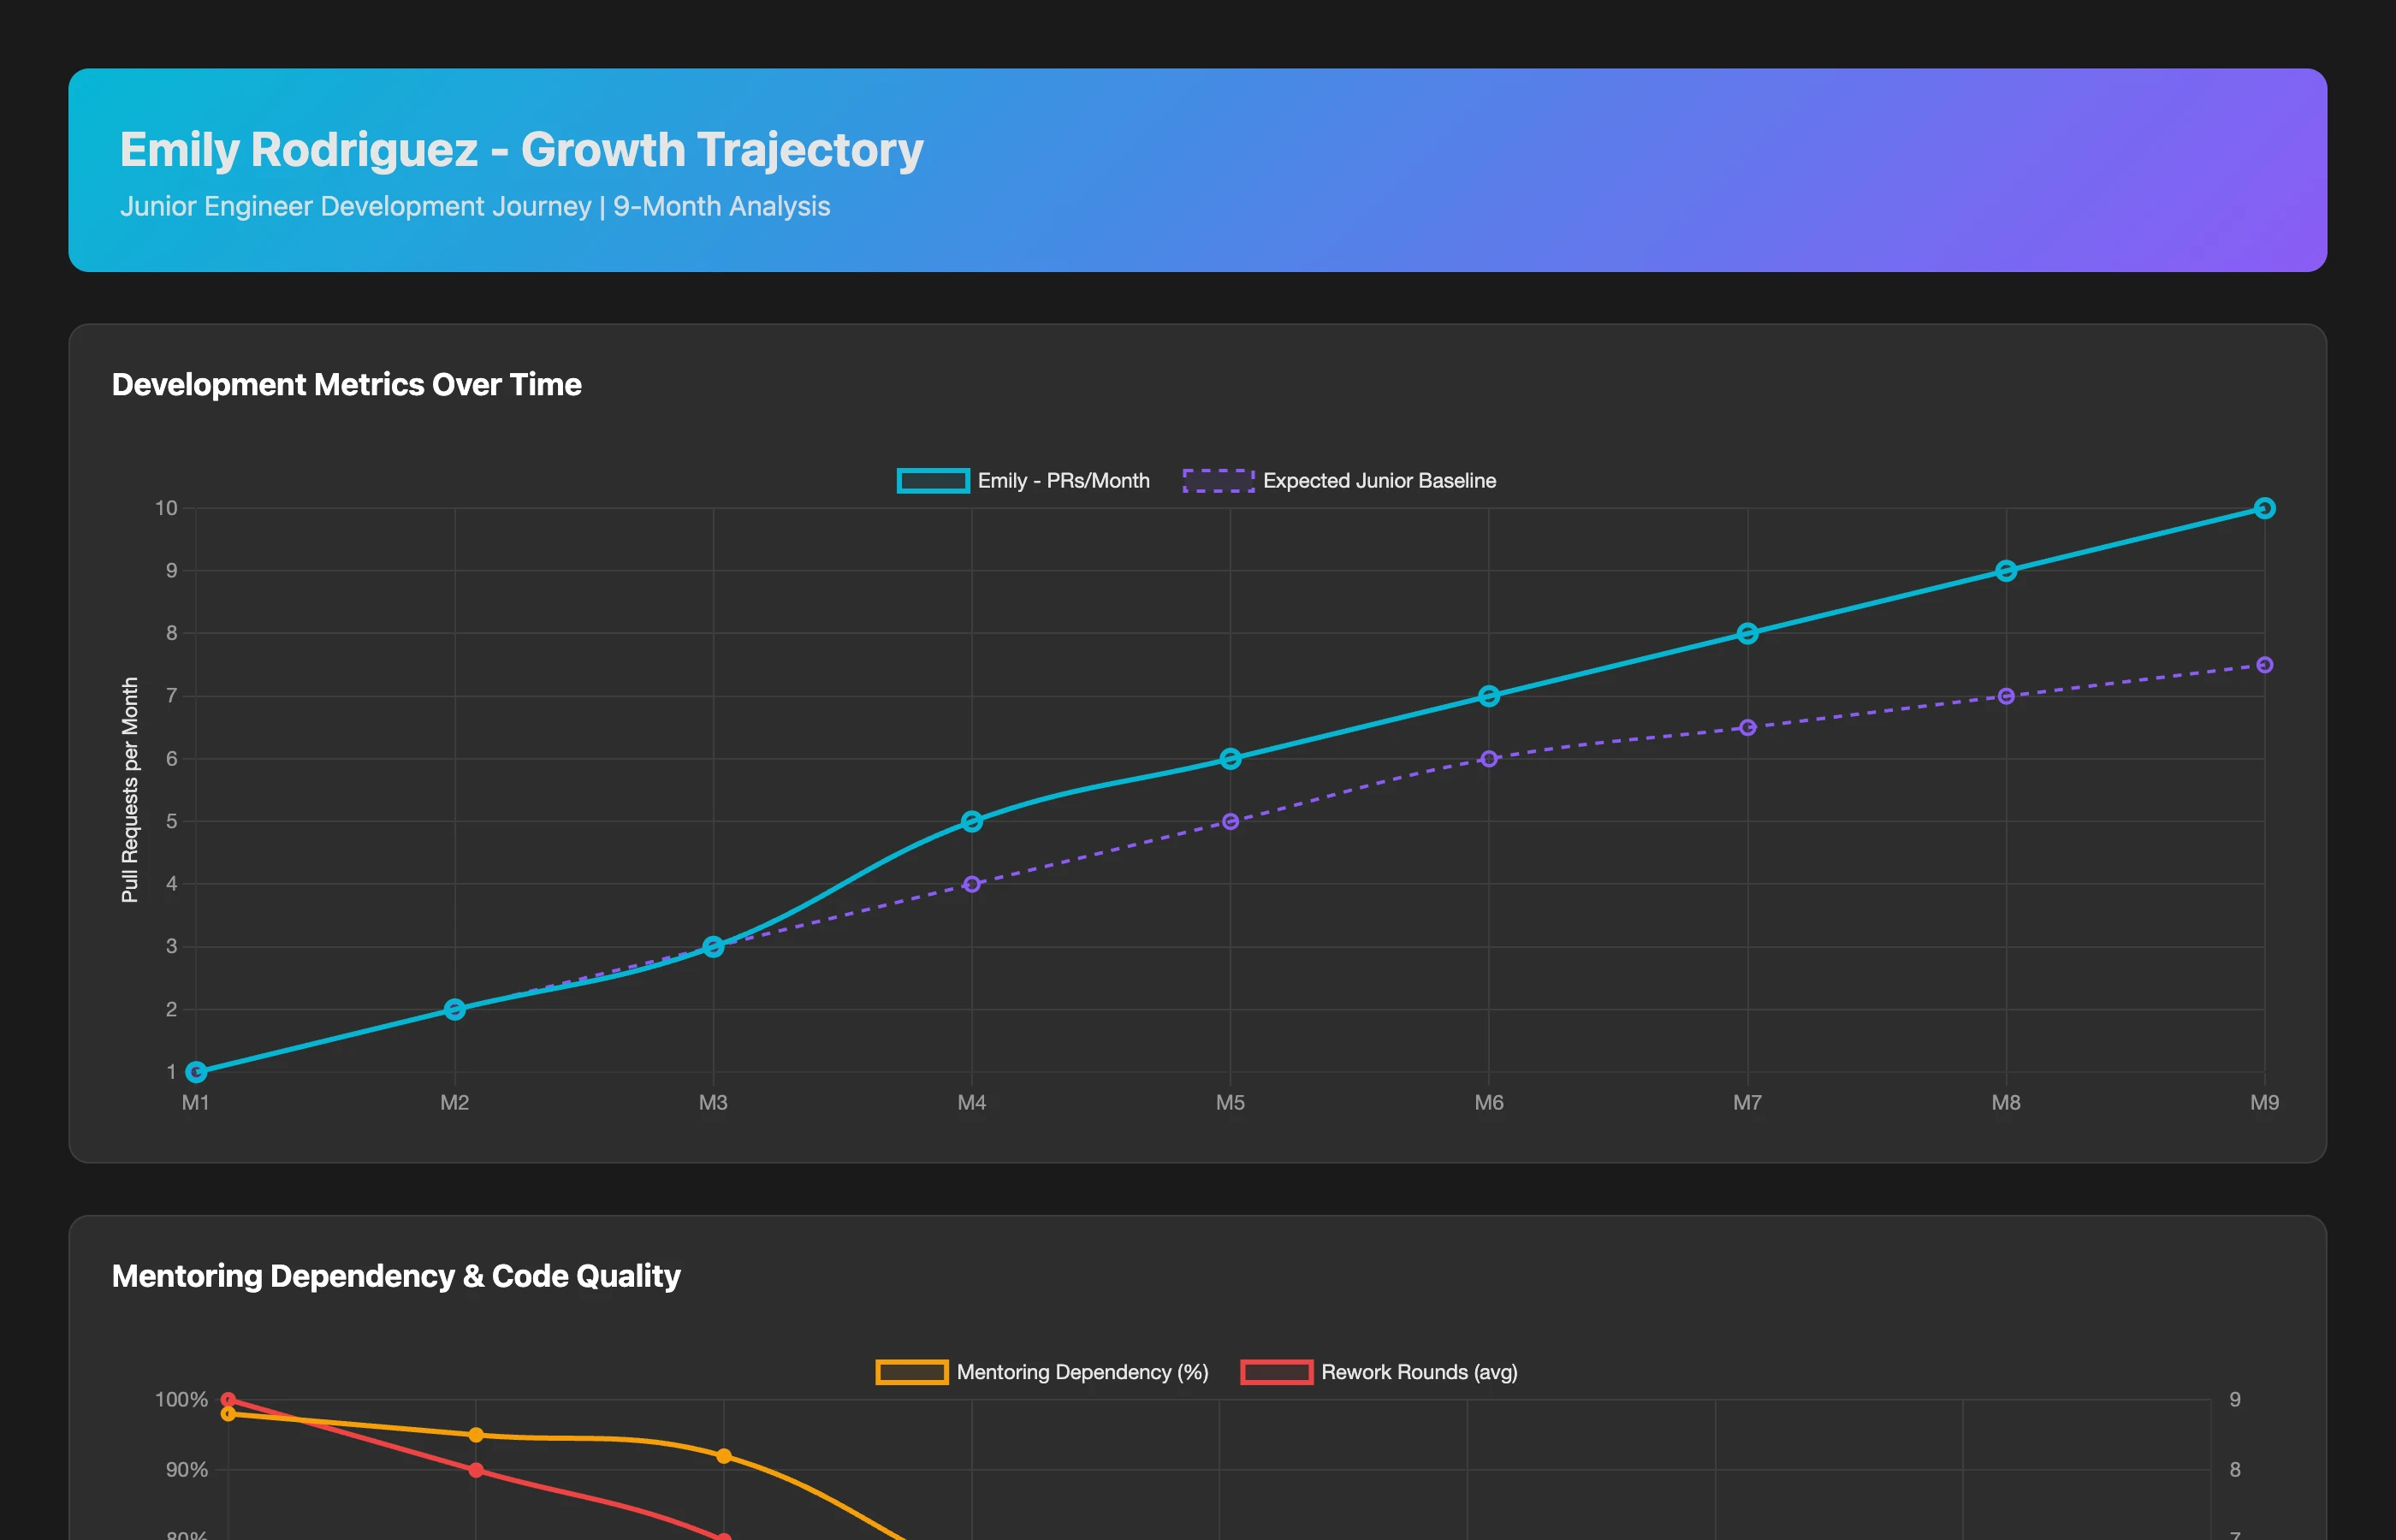
Analyze Emily's (junior engineer, hired 9 months ago) growth trajectory across: PR complexity (lines changed, files touched, system areas), code quality (review feedback trends, rework rates), independence level (questions asked, mentoring sessions needed), review participation (reviews given, review quality), and expanded scope (new repositories contributed to, cross-team work). Compare her 9-month journey to team expectations and typical junior engineer growth curves.
What you discover:
- Month 1-3 (onboarding): 2 PRs/month, heavy mentoring dependency, 8 review rounds average (lots of learning)
- Month 4-6 (developing): 6 PRs/month, 60% mentoring-assisted, 3 review rounds average (gaining independence)
- Month 7-9 (emerging confidence): 9 PRs/month, 30% mentoring-assisted, 1.2 review rounds, started reviewing others' code
- Trajectory: Accelerating growth, on track to full independence by month 12
Conclusion: Emily is developing ahead of schedule. Her current "lower" absolute output is expected and healthy. Penalizing her for not matching senior engineers would be absurd.
Principle 5: Detect Genuine Gaming Patterns (vs. Legitimate Variation)
Use metrics to identify gaming behavior, not punish legitimate patterns:
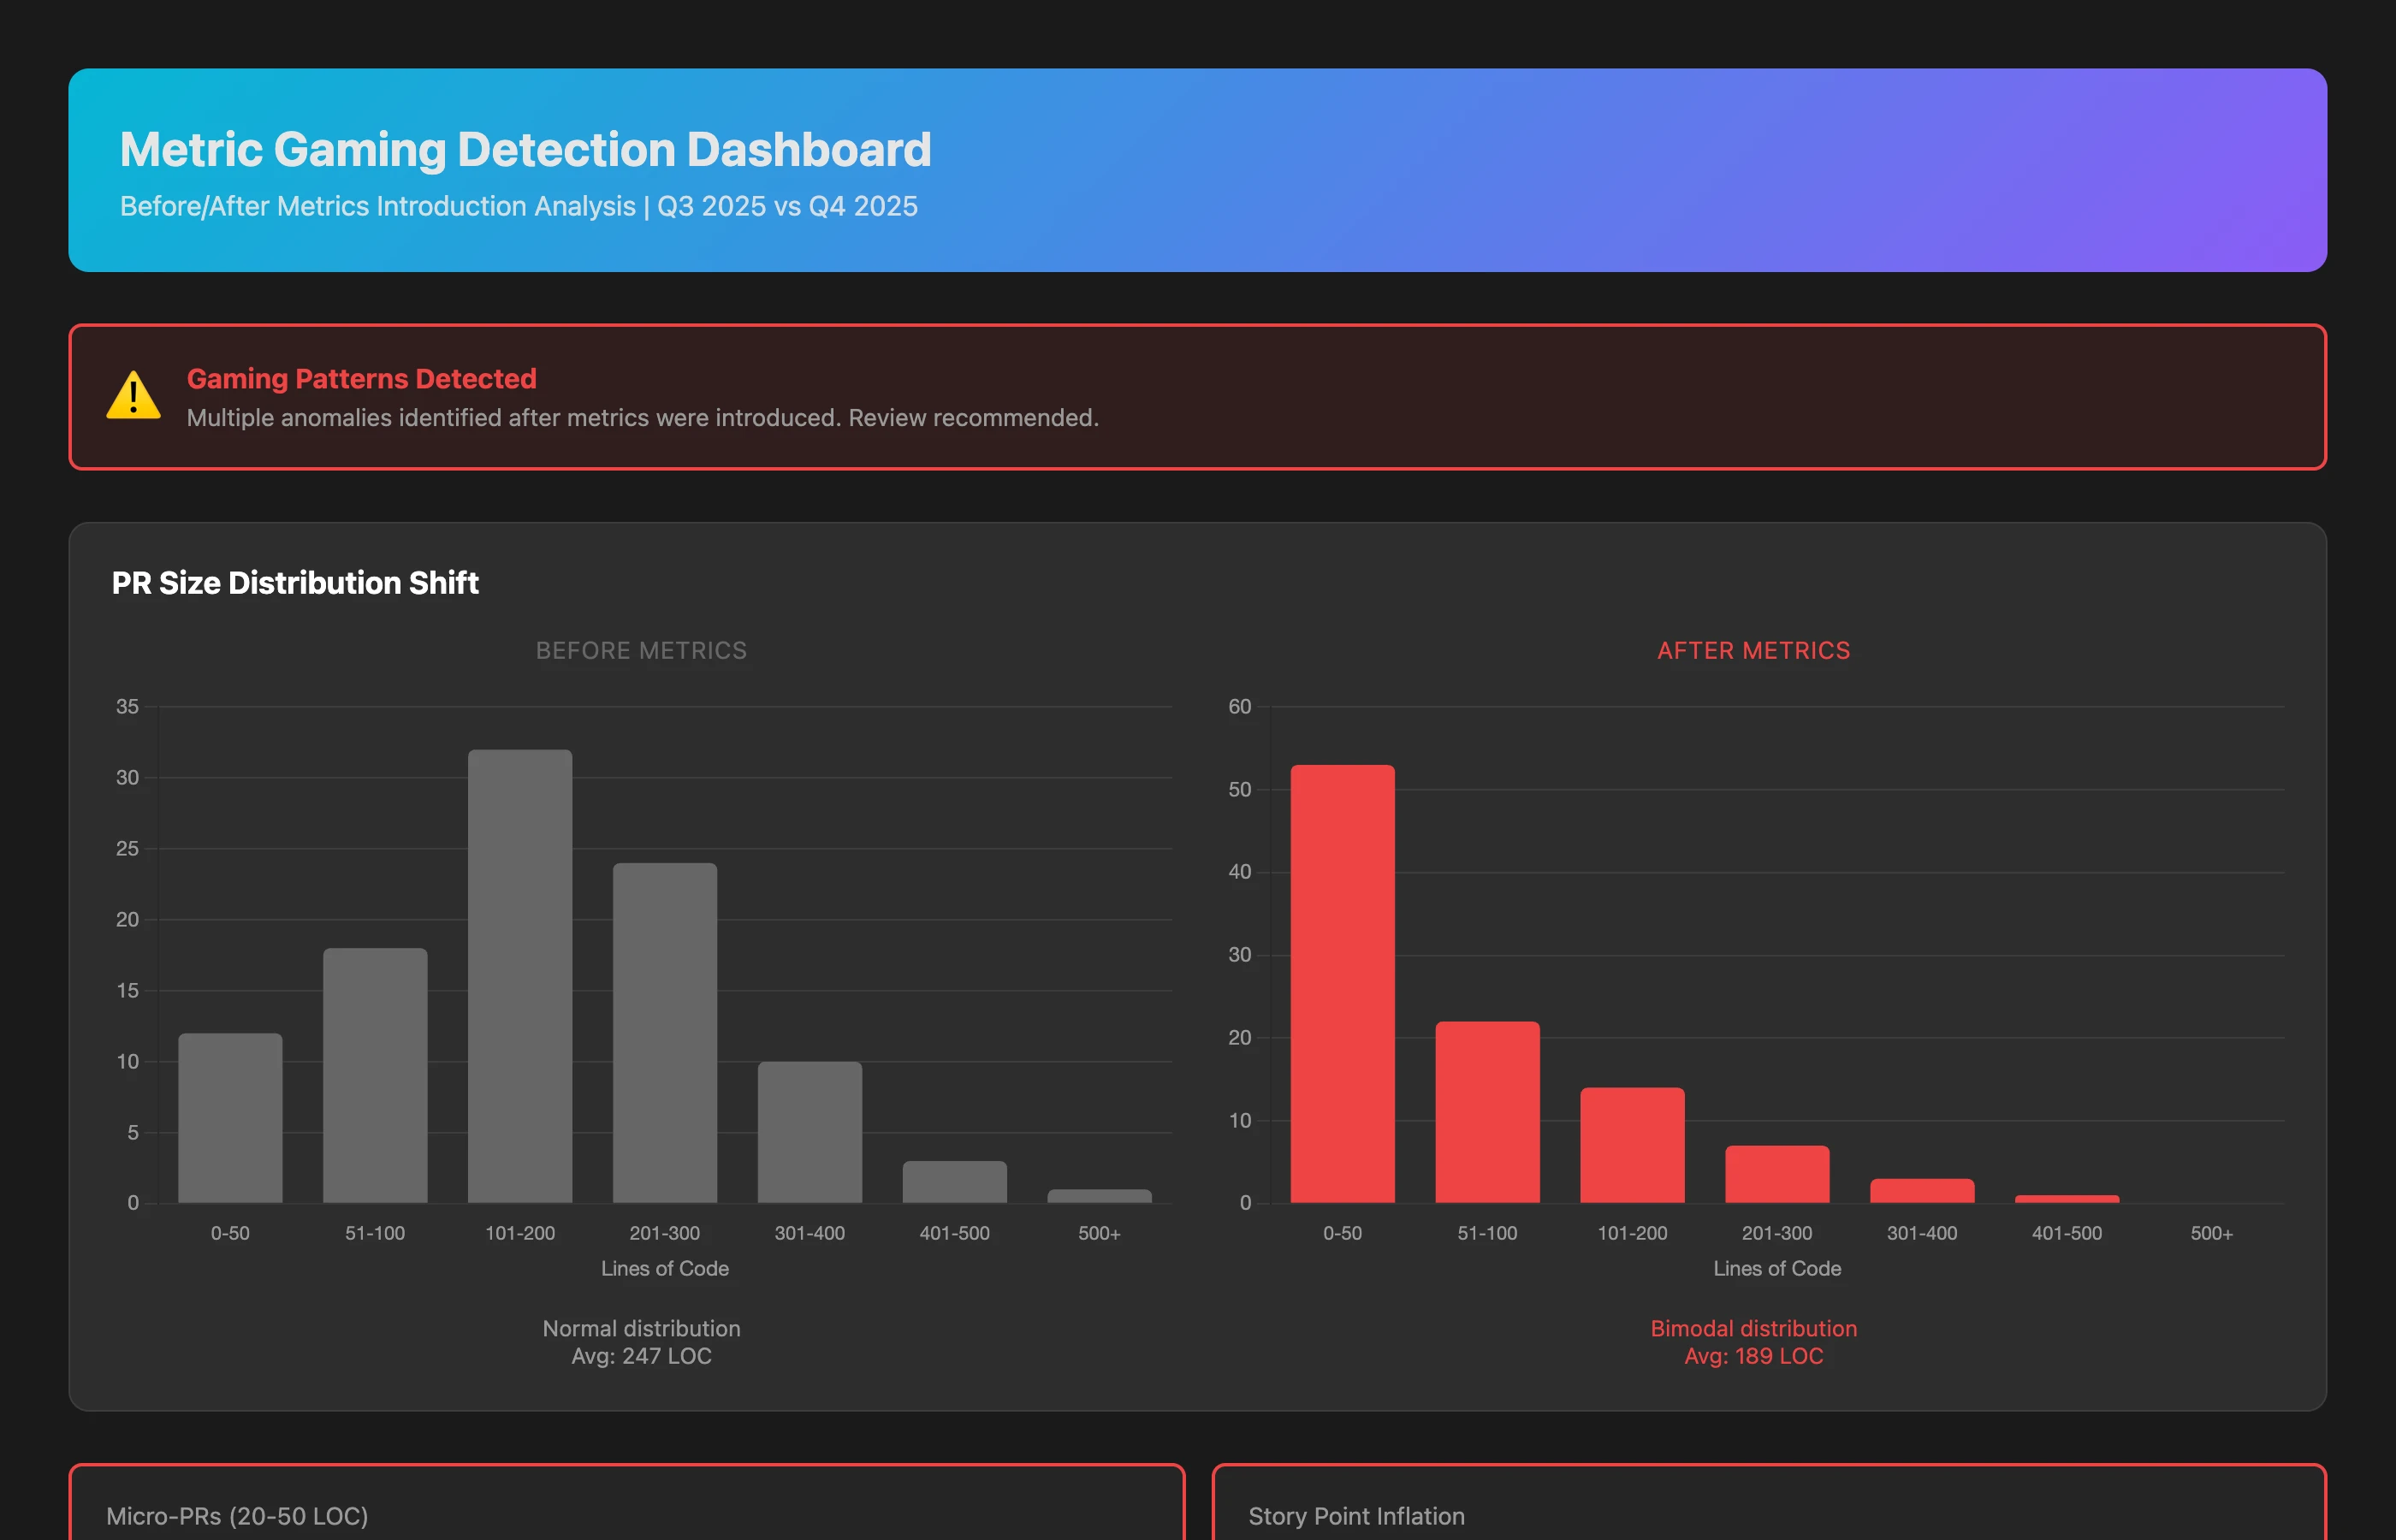
Metric Gaming Detection Analysis
Analyze our team's PR patterns over the last two quarters for indicators of metric gaming: sudden changes in PR size distribution (many micro-PRs where larger PRs were typical), story point inflation patterns (same work types consistently estimated higher), low-hanging fruit bias (avoiding complex issues after metrics tracking began), review quality degradation (review time vs PR complexity), and coordination avoidance (reduced pair programming, fewer cross-team reviews). Flag statistical anomalies and interview team members to understand context.
What you discover:
- PR size distribution shifted: Pre-metrics: normal distribution around 247 lines. Post-metrics: bimodal with spike at 20-50 lines (+340% in micro-PRs)
- Story point inflation: Same issue types (e.g., "add API endpoint") averaged 3.8 points Q1, now 6.2 points Q2 (+63% inflation)
- Review time collapsed: Despite PR complexity staying constant, review time per PR dropped 45% (reviewers rushing to maintain metric targets)
- Coordination reduced: Pair programming frequency down 62%, cross-team reviews down 38%
Conclusion: These are statistical signatures of gaming behavior. This isn't individual failure—it's a systemic response to misaligned incentives.
Principle 6: Celebrate Non-Coding Excellence
Recognize and reward activities that don't produce commits:
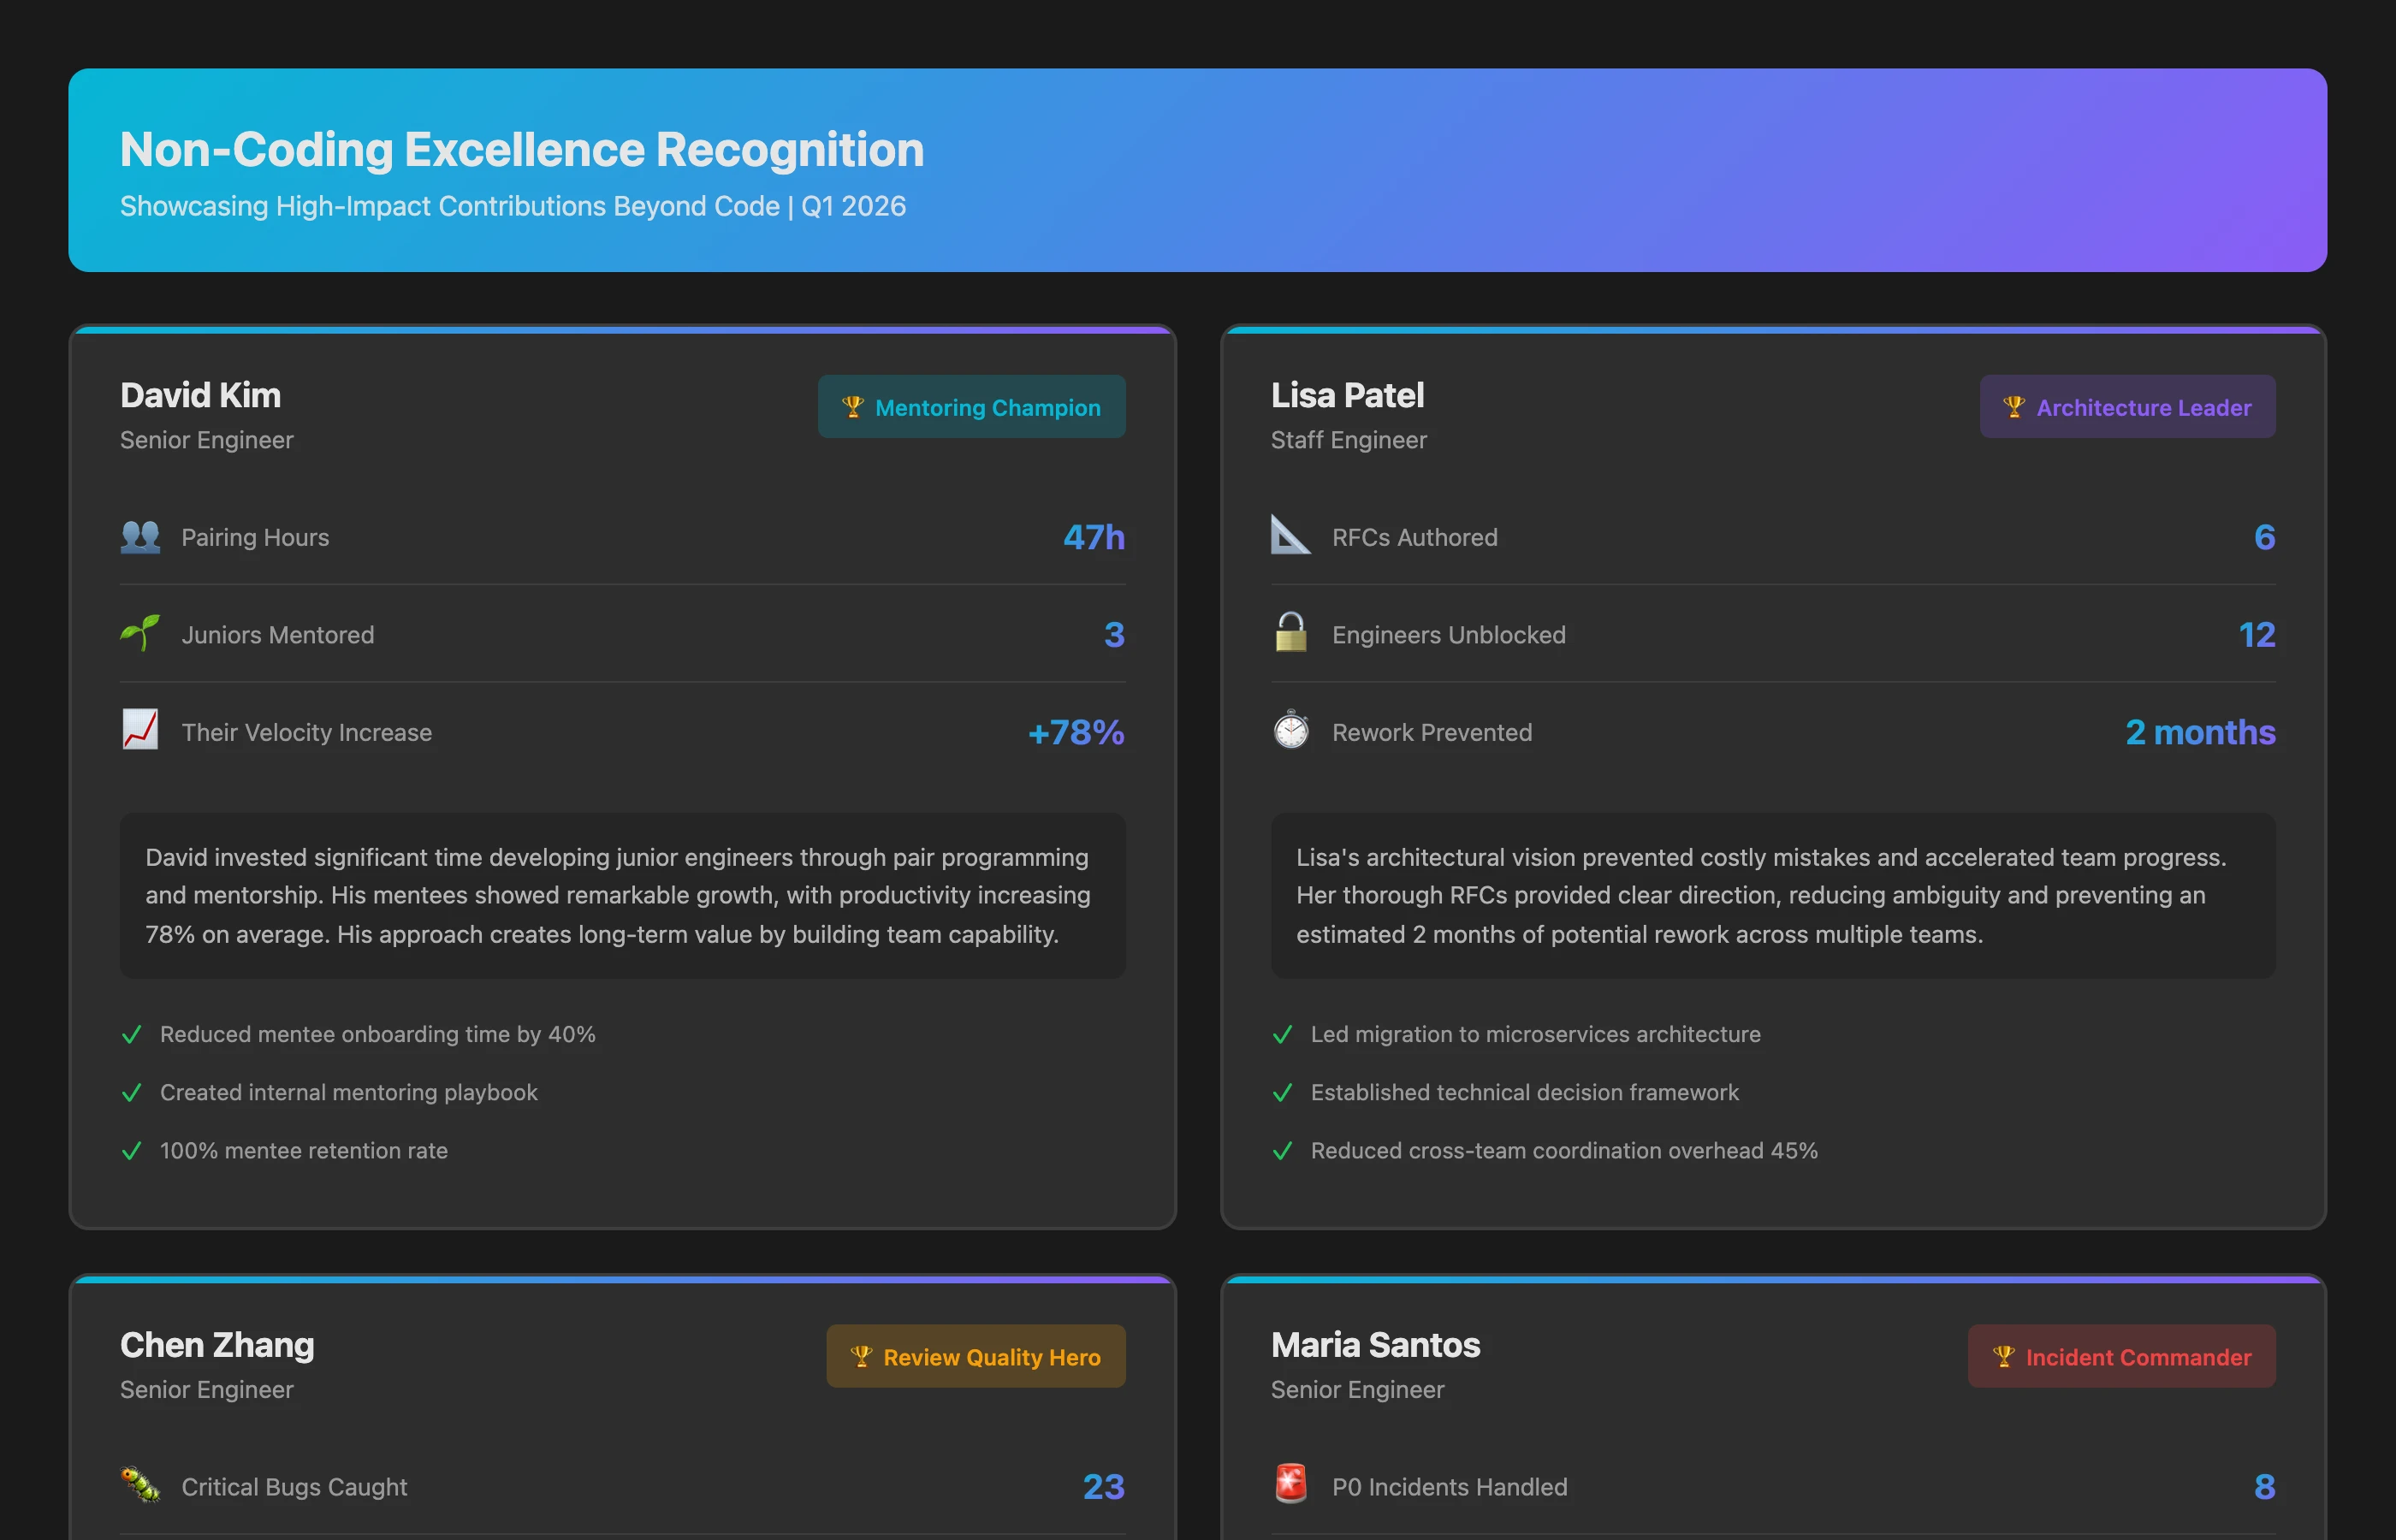
Non-Coding Excellence Recognition Analysis
Identify team members who excel in high-value, low-visibility activities over the last quarter: mentoring effectiveness (junior engineers' growth curves, pairing hours), architecture leadership (RFC authorship, design influence, technical decision quality), code review quality (thoroughness, bug detection, knowledge sharing), incident heroics (on-call response time, problem resolution, post-mortem quality), and culture building (team health contributions, cross-team collaboration, onboarding support). Quantify impact where possible.
What you celebrate:
- David (Mentoring Champion): Paired with 3 junior engineers for 47 hours, their combined velocity increased 78%, all passed probation early
- Lisa (Architecture Leader): Authored 6 technical RFCs, unblocked 12 engineers, prevented estimated 2 months of rework
- Chen (Review Quality Hero): Caught 23 critical bugs during code review, average review depth 3.2x team baseline
- Maria (Incident Commander): Led resolution of 8 P0 incidents with average response time 28 minutes, wrote exemplary post-mortems
Conclusion: These contributions are more valuable than raw PR counts for many roles. Recognizing them explicitly prevents talent flight.
Implementation: Building a Culture of Contextual Performance
Step 1: Commit to Context-First Evaluation (Leadership Buy-In)
The Pledge (from leadership to teams):
"We will never use isolated git metrics (PR counts, LOC, commits) as the sole or primary basis for individual performance evaluation, promotion decisions, or bonus calculations. We recognize that software development value comes from a complex mix of coding, mentoring, architecture, coordination, and quality work. We commit to evaluating contribution holistically and contextually."
This pledge must be:
- Public: Announced to entire engineering organization
- Written: Documented in performance review guidelines
- Enforced: Managers who violate it are corrected
- Repeated: Reinforced quarterly in all-hands and 1:1s
Without this pledge, any metric system will be perceived as surveillance and gamed accordingly.
Step 2: Define Role-Based Contribution Profiles
Create clear expectations for different roles:
Junior Engineer (L1-L2):
- Primary focus: Learning and independent execution
- Expected pattern: High mentoring dependency early, rapid growth curve, 70-80% time on own work
- Success indicators: Trajectory (improving complexity, reducing rework), curiosity, collaboration
Mid-Level Engineer (L3-L4):
- Primary focus: Independent delivery, emerging mentorship
- Expected pattern: 60-70% own work, 20-30% reviews/mentoring, 10% coordination
- Success indicators: Consistent quality, scope expansion, beginning to unblock others
Senior Engineer (L5-L6):
- Primary focus: Team leverage, mentorship, technical leadership
- Expected pattern: 40-50% own work, 30-40% mentoring/reviews, 20% architecture/coordination
- Success indicators: Team velocity improvement, junior growth, architectural influence
Staff+ Engineer (L7+):
- Primary focus: Organizational leverage, strategy, cross-team impact
- Expected pattern: 20-30% own work, 70-80% leverage activities (architecture, mentoring, coordination)
- Success indicators: Multi-team impact, strategic technical decisions, organizational culture building
Step 3: Implement Collaborative Review Conversations
Performance reviews become collaborative reflection, not top-down judgment:
Quarterly Self-Reflection (engineer-driven):
Engineer answers via MCP queries:
Self-Reflection: My Contribution Pattern
Show me my contribution breakdown over the last quarter: coding work (PRs, complexity, scope), review participation (quantity, quality), mentoring activities (pairing, guidance, onboarding support), architecture contributions (RFCs, design input), incident work, and coordination. How does this align with my role expectations and career goals? What do I want to shift next quarter?
Manager Review (context-adding):
Manager runs comparative analysis:
Manager Context: Team Contribution Alignment
Compare [Engineer]'s contribution pattern to role expectations, team needs, and similar roles across the organization. Identify: strengths (where they excel or exceed expectations), growth areas (skills to develop), misalignments (doing too much/too little of certain activities), and opportunities (where team needs their unique strengths).
Collaborative Conversation:
- Engineer shares self-reflection insights
- Manager adds organizational context and comparative data
- Together, identify growth areas and alignment opportunities
- Set goals for next quarter (not just "more PRs"—holistic contribution goals)
Step 4: Celebrate Visible and Invisible Contributions Equally
Public Recognition Patterns:
- "Mentorship MVP": Quarterly award for highest-impact mentoring (measured by mentee growth)
- "Architecture Hero": Recognition for RFCs and design work that unblocked teams
- "Review Quality Champion": Award for thorough, educational code reviews
- "Firefighter Award": Recognition for incident response excellence
- "Cross-Team Collaborator": Highlight engineers who coordinate across silos
Make invisible work visible by celebrating it as much as shipped features.
Step 5: Monitor for Gaming Signals and Course-Correct
Use MCP to detect gaming behavior early:
Gaming Behavior Early Detection
Monitor for statistical anomalies that suggest gaming: sudden shifts in PR size distribution, story point inflation patterns, reduced review quality, decreased pair programming, avoidance of complex issues, and coordination reduction. Alert when patterns cross thresholds. Flag for investigation and team conversation, not punishment.
Response to Gaming Signals:
- Investigate: Is this gaming, or legitimate change? (New project, team composition shift, role change)
- Team conversation: If gaming suspected, discuss as team (not punish individuals)
- Incentive audit: What caused this response? What metric or pressure is driving behavior?
- Course-correct: Remove perverse incentives, clarify expectations, reaffirm context-first evaluation
Step 6: Iterate Based on Team Feedback
Quarterly retrospective on metrics and performance process:
Questions for the team:
- Do you feel metrics are used fairly and contextually?
- Are you tempted to game any metrics? Which ones and why?
- What valuable work do you do that feels unrecognized?
- How can we better measure and recognize your contributions?
Treat your performance system as a product that needs user feedback and iteration.
Case Study: From Gaming to Culture Building
Company: MedTech SaaS (127 engineers)
Initial State: Individual metrics used for performance reviews, heavy gaming behavior
Timeline: 18-month transformation
Before (Month 0): The Gaming Era
Symptoms:
- PRs/month used as performance proxy
- Engineers splitting features into 5-10 micro-PRs
- Senior engineers avoiding mentoring (hurt their individual stats)
- Code review quality collapsed (everyone optimizing for speed)
- Tech debt exploded (no one wanted to take on refactoring work)
- Turnover spiked: 3 senior engineers quit in 6 months (all cited "metric obsession" in exit interviews)
Intervention (Month 1-3): The Pledge and Reset
Actions:
- Leadership pledge: CEO and VPE publicly committed to context-first evaluation
- Metric freeze: Stopped using individual PR counts in performance reviews
- Role profiles: Defined expected contribution patterns for each level
- MCP implementation: Deployed Keypup MCP for contextual analysis
- Manager training: Taught contextual evaluation with 20 hours of workshops
Transition (Month 4-9): Building New Habits
Changes:
- Performance reviews became collaborative (self-reflection + manager context)
- Started celebrating non-coding excellence (quarterly awards for mentoring, architecture, reviews)
- Implemented gaming detection (caught 2 cases early, addressed with team conversations, not punishment)
- Team retrospectives on metrics every quarter
6-Month Progress Check: Gaming Behavior Reduction
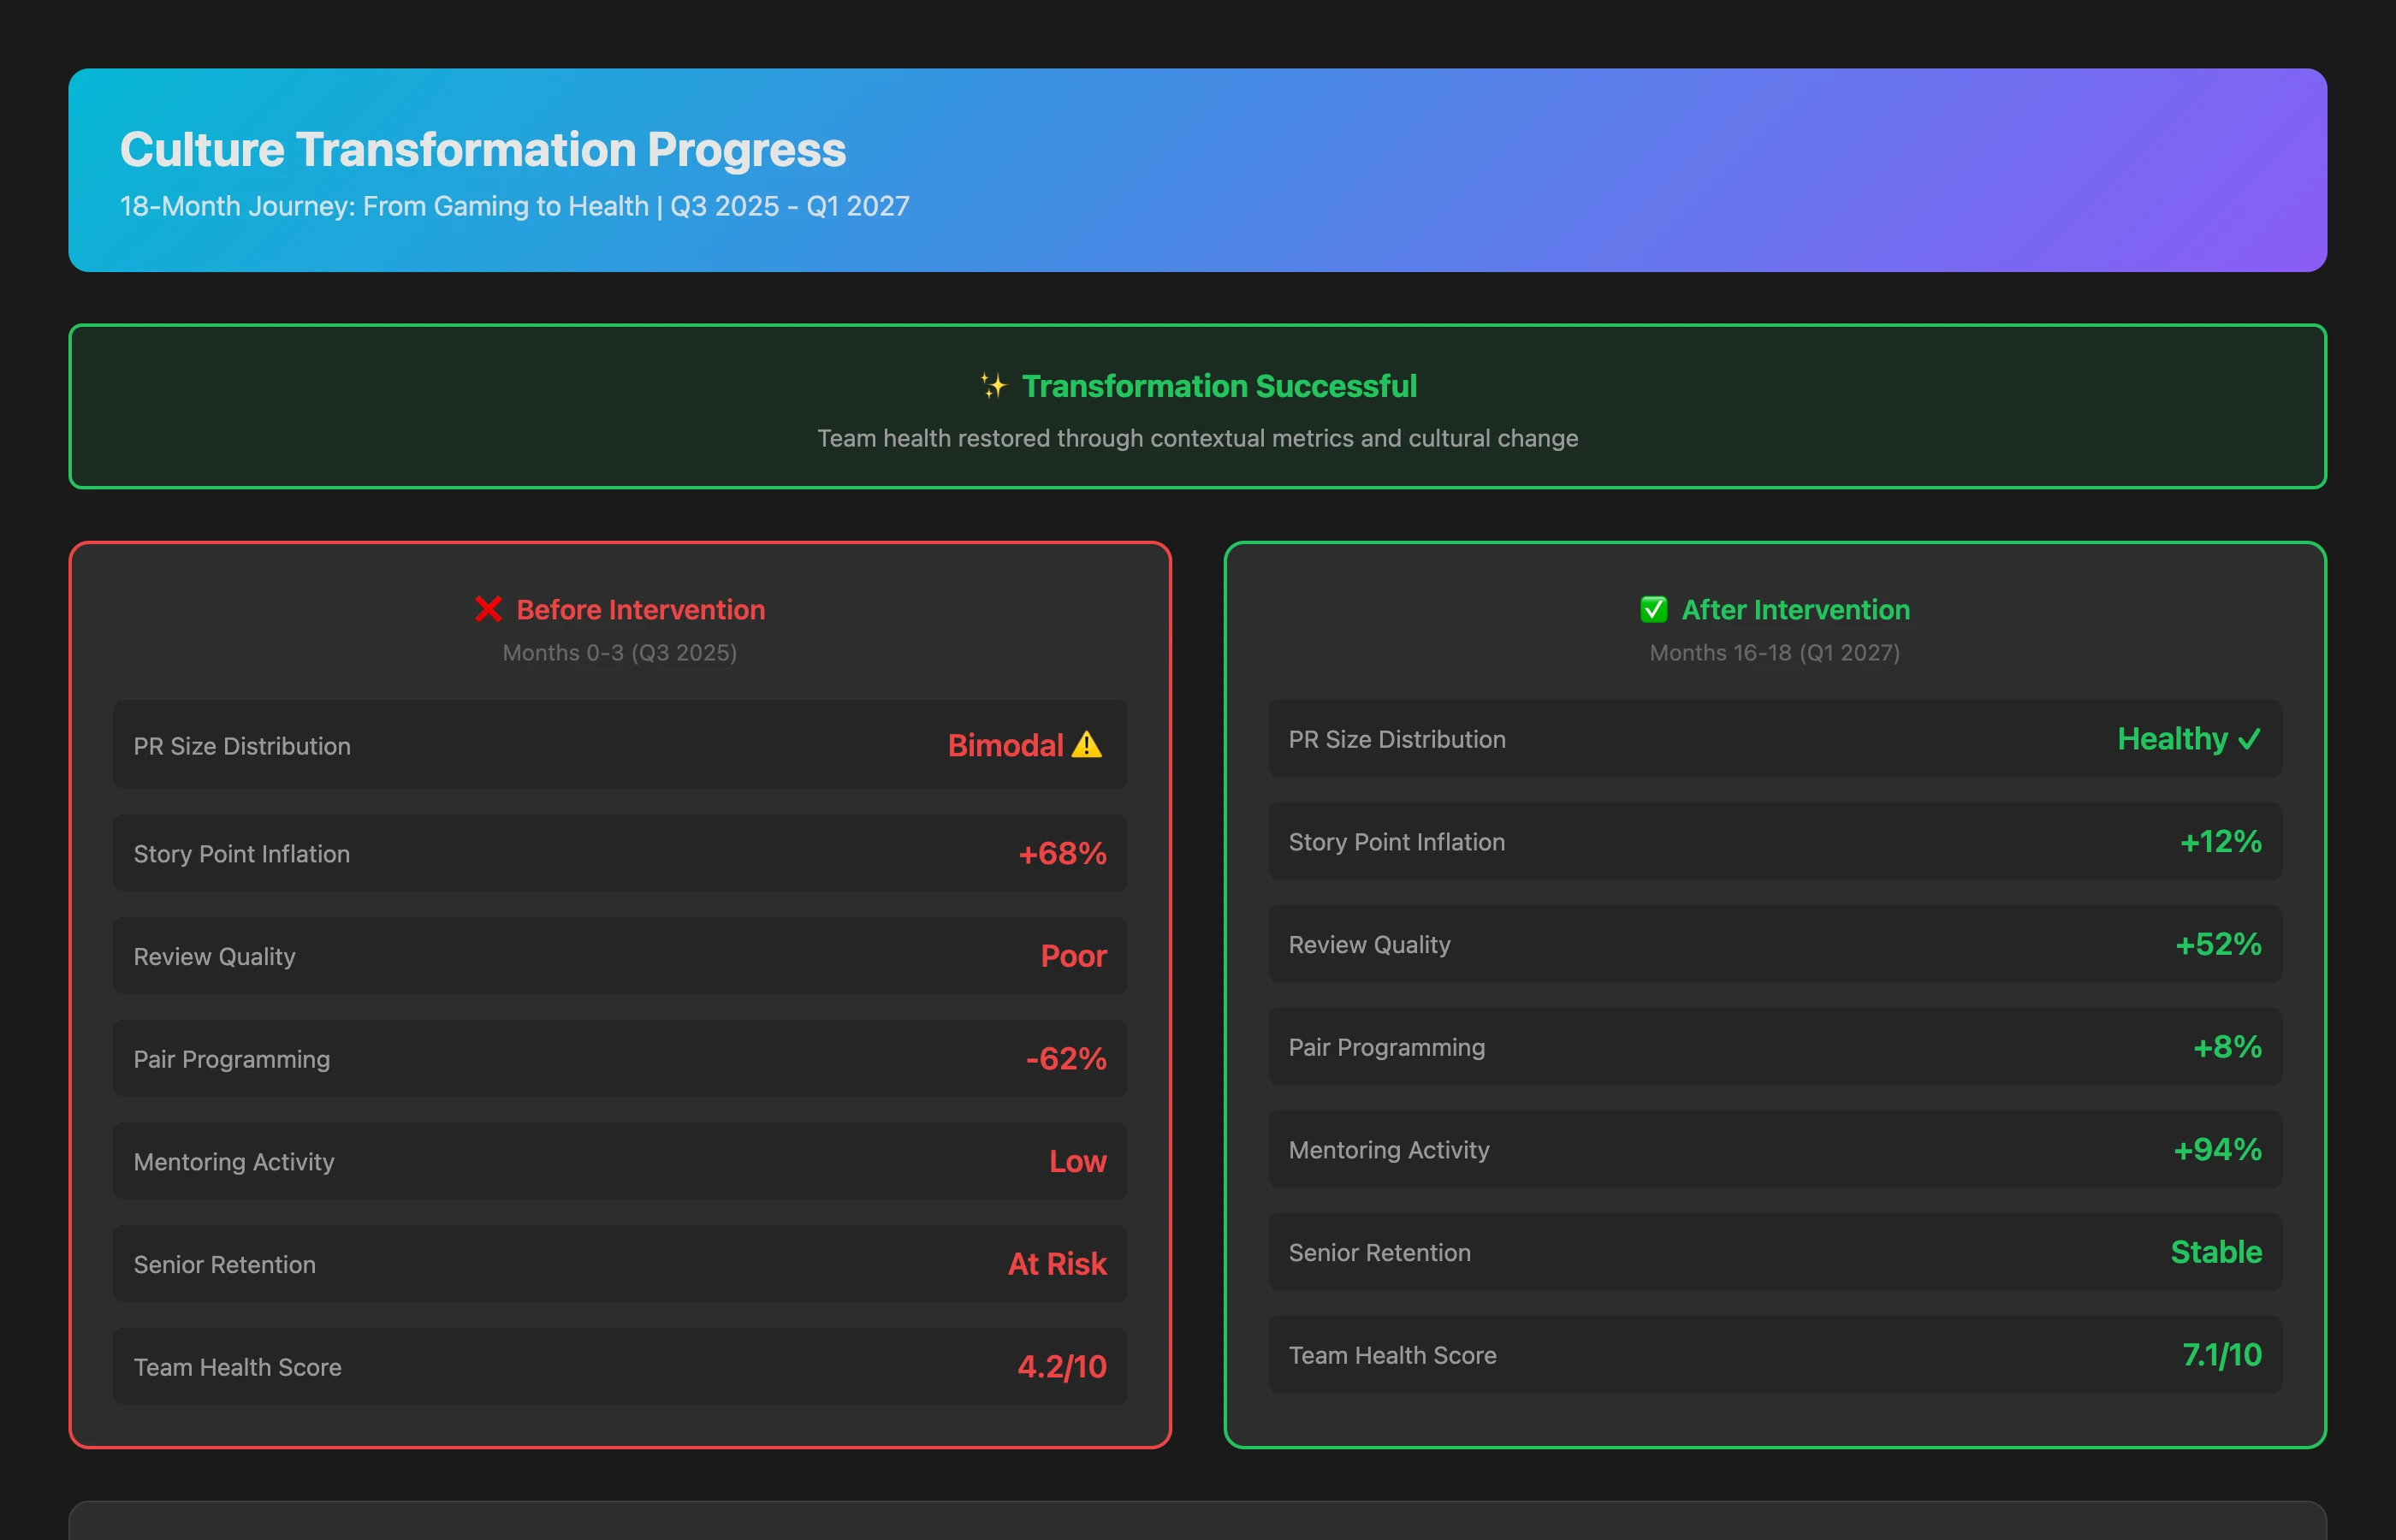
Compare team behaviors across Month 0-3 (before intervention) vs Month 4-9 (after intervention): PR size distribution, story point inflation, review quality metrics, pair programming frequency, mentoring activity, senior engineer retention, and team health survey scores. Quantify changes and identify patterns.
Outcomes (Month 12-18): Culture Shift
Quantitative results:
- PR gaming reduced 87%: Size distribution returned to normal curve
- Story point inflation dropped 79%: Estimates became realistic again
- Review quality improved 52%: Time invested in reviews increased, bug detection improved
- Mentoring surged 94%: Senior engineers re-engaged with juniors
- Turnover reversed: Zero senior engineer departures in 12 months, 4 new senior hires joined
- Velocity paradox: Despite "lower" individual PR counts, team throughput increased 23% (less rework, better coordination, higher quality)
Qualitative results:
- Team health survey score: 4.2/10 → 8.3/10
- Engineers report feeling "trusted" and "recognized for real contributions"
- Juniors develop faster (more mentoring available)
- Cross-team collaboration improved (no longer penalized for coordination time)
- Architectural coherence improved (staff engineers re-engaged in design)
CEO Quote (Month 18 all-hands):
"18 months ago, we were optimizing for metrics and losing our best people. Today, we optimize for impact and our best people are thriving. The shift from surveillance metrics to contextual contribution was the best cultural investment we've made."
The Paradox: Metrics Work When They're Not Weaponized
Here's the paradox: Metrics are incredibly valuable—when they're not used punitively.
Metrics as surveillance → Gaming, trust erosion, talent flight
Metrics as insight → Self-awareness, growth, team optimization
The difference is intent and implementation:
Don't:
- ❌ Use git stats as the primary input to individual performance ratings
- ❌ Compare individuals without role/context adjustment
- ❌ Create bonuses or rankings based on PR counts
- ❌ Penalize people for "low" output without investigating why
- ❌ Ignore invisible work (mentoring, architecture, coordination)
Do:
- ✅ Use metrics to understand team dynamics and identify bottlenecks
- ✅ Benchmark individuals within role and context
- ✅ Celebrate non-coding excellence explicitly and publicly
- ✅ Make performance conversations collaborative, not top-down
- ✅ Monitor for gaming signals and address incentive structures
- ✅ Recognize that contribution is multifaceted and complex
Conclusion: From Goodhart's Trap to Growth Culture
Goodhart's Law isn't a reason to abandon metrics—it's a warning about how you use them.
The lesson: Never make a metric a target without considering how rational actors will respond.
When you tie individual performance to raw git stats:
- Rational response: Optimize for the metric, not the outcome
- Result: Gaming, quality degradation, trust collapse
When you use metrics contextually and collaboratively:
- Rational response: Focus on genuine impact, knowing it will be recognized
- Result: Better work, stronger teams, healthier culture
Keypup MCP doesn't eliminate the human challenge of performance management—it gives you the context to do it well. You can:
- Recognize invisible work (mentoring, architecture, coordination)
- Benchmark individuals fairly (role-adjusted, context-aware)
- Detect gaming early (statistical anomalies, team health signals)
- Celebrate multifaceted contribution (not just code output)
- Build trust through transparency (engineers see the full picture too)
The goal isn't to measure everything—it's to recognize the right things and create a culture where contribution is valued holistically.
Your best engineers aren't necessarily the ones with the most PRs. They're the ones making everyone around them better.
Stop counting commits. Start recognizing impact.
Keypup MCP is available now for GitHub Copilot, Claude, and other AI assistants supporting the Model Context Protocol. Connect your Jira, Trello, and Git repositories in under an hour and start asking better questions.
Get Started: Keypup MCP Documentation
More About the Keypup MCP server: MCP Server page
Questions?: Talk to our PM team