When DORA Metrics Lie: How High Performance Numbers Can Mask Critical Tech Debt
DORA metrics show strong performance, but your system is still brittle. Learn how vanity metrics hide technical debt and how Keypup's MCP Server reveals the full story through system legibility analysis.
TL;DR: DORA metrics are powerful organizational indicators, but they can become dangerous vanity metrics that hide critical technical debt.
The Problem: High deployment frequency and low lead times can coexist with mounting technical debt, brittle architectures, and unsustainable practices
System Legibility: Looking beyond surface metrics to understand how work gets done, not just what gets done
The Solution: Keypup's MCP Server integration enables deep-dive analysis that reveals hidden patterns, workarounds, and structural issues
Reddit Reality Check: Engineering communities increasingly warn about gaming DORA metrics at the expense of long-term system health
Actionable Insights: Learn specific queries to detect warning signs like increasing complexity, concentration risk, and technical shortcuts
Introduction: The DORA Paradox
Your DORA dashboard looks great. Deployment frequency is up 40%. Lead time for changes has dropped to under 4 hours. Change failure rate is holding steady at 8%. By all organizational metrics, your engineering team is performing exceptionally.
But something feels wrong.
Developers are frustrated. The codebase is becoming harder to navigate. Minor changes require touching dozens of files. The same senior engineers are bottlenecked on every critical path. Pull requests that should be straightforward are taking days in review because "nobody else understands this part of the system."
This is the DORA paradox: strong aggregate performance metrics masking deteriorating system health.
u/techleadburn from r/devops
"We optimized ourselves into a corner. Our DORA metrics looked amazing—we were shipping fast. But we were also accumulating tech debt at an unsustainable rate. Shortcuts everywhere. The code worked, but nobody understood why. When our tech lead left, everything collapsed. Our 'high-performing' metrics were built on a house of cards."
This isn't an indictment of DORA metrics themselves. They remain valuable for organizational-level insights. But without system legibility—understanding the internal structure, clarity, and maintainability of your engineering systems—DORA metrics tell an incomplete and sometimes misleading story.
Understanding System Legibility
System legibility is the degree to which your engineering system can be understood, modified, and maintained by the team working on it. A legible system has:
Clear ownership boundaries: Responsibilities are well-defined, not concentrated in a few individuals
Distributed knowledge: Multiple team members can work effectively in any part of the codebase
Transparent dependencies: Relationships between components are explicit and well-documented
Sustainable complexity: Changes don't require exponentially increasing effort over time
Visible constraints: Technical limitations and tradeoffs are documented and understood
High DORA metrics with low system legibility create a dangerous illusion of success. You're moving fast, but on increasingly fragile foundations.
Warning Signs Your DORA Metrics Are Masking Problems:
✋ High deployment frequency driven by a small subset of developers
✋ Low lead times achieved through skipping documentation and tests
✋ Change failure rate stable only because certain developers always fix issues
✋ Mean time to recovery (MTTR) impressive because the same "heroes" are always on call
✋ Metrics improve quarter-over-quarter while developer satisfaction plummets
How DORA Metrics Become Vanity Metrics
Reddit's engineering communities have been sounding the alarm. In r/ExperiencedDevs and r/devops, recurring threads warn about organizations that optimize for metrics at the expense of sustainable engineering practices.
u/engineering_realist from r/ExperiencedDevs
"My previous company was obsessed with deployment frequency. We went from 20 deploys/month to 80. Management loved it. But here's what they didn't see: we stopped writing tests because they slowed us down. We stopped doing proper code review because it 'blocked velocity.' We shipped fast, but we shipped garbage. Six months later, our production incidents tripled."
The Four Ways DORA Metrics Hide Technical Debt
1. Aggregation Hides Concentration Risk
DORA metrics are typically reported at the team or organization level. This averaging obscures dangerous concentration patterns:
Knowledge silos: One developer responsible for 60% of infrastructure changes
Module abandonment: Certain parts of the codebase untouched for months because nobody understands them
Review bottlenecks: Critical PRs waiting days for the one person qualified to review
u/sre_survivor from r/devops
"Our deployment frequency looked great until our Staff Engineer went on vacation. Suddenly nobody could deploy anything because he was the only one who understood the deployment pipeline. We were 'high performing' only because of one person. That's not resilience, that's risk."
2. Speed Metrics Don't Capture Quality of Work
Low lead time is celebrated, but it doesn't distinguish between:
Clean, well-tested changes with comprehensive documentation
Quick fixes that introduce new technical debt
Simple configuration updates vs. complex architectural changes
Changes that one person can make vs. changes requiring team coordination
Optimizing for speed without accounting for complexity creates perverse incentives.
Incidents prevented only through heroic manual intervention
Problems caught by senior engineers during emergency post-deploy reviews
Issues that would have occurred if not for undocumented workarounds
Technical debt that makes every change riskier than it should be
u/platform_lead from r/kubernetes
"Our CFR was steady at 5%. What the metric didn't show: we had a 'shadow QA process' where senior devs would frantically test in production right after deploys to catch issues before customers did. We weren't preventing failures—we were just catching them faster. Completely unsustainable."
4. MTTR Rewards Firefighting Over Prevention
Fast mean time to recovery sounds positive. But it can indicate:
Systems so brittle that teams are constantly firefighting
Investment in incident response at the expense of prevention
Knowledge concentrated in a few individuals who become "heroes"
Normalized acceptance of preventable failures
The metric rewards speed of recovery, not the more important goal of eliminating the need for recovery.
Introducing System Legibility Analysis with Keypup MCP
This is where Keypup's MCP (Model Context Protocol) Server fundamentally changes the game. Instead of replacing DORA metrics, it adds the missing layer: deep-dive analysis into how work actually happens.
The Keypup MCP Server integrates directly into AI assistants like Claude, ChatGPT, Cursor, and Windsurf, bringing engineering analytics into your natural workflow. More importantly, it enables queries that reveal system legibility—the patterns that aggregate metrics miss.
How It Works
The MCP Server provides AI assistants with structured access to your engineering data across GitHub, GitLab, Jira, Azure DevOps, and Bitbucket. Instead of viewing dashboards, you ask natural language questions, and the AI generates and executes the appropriate data queries.
But the real power is in the types of questions you can now ask—questions that surface technical debt, concentration risk, and structural problems.
Practical Examples: Revealing Hidden Problems
Let's explore specific analyses that reveal what DORA metrics miss. Each example includes the MCP prompt, the underlying query structure, and what the results tell you about system health.
Example 1: Detecting Knowledge Concentration
Your deployment frequency is high, but is it sustainable? Or is it dependent on a few key individuals?
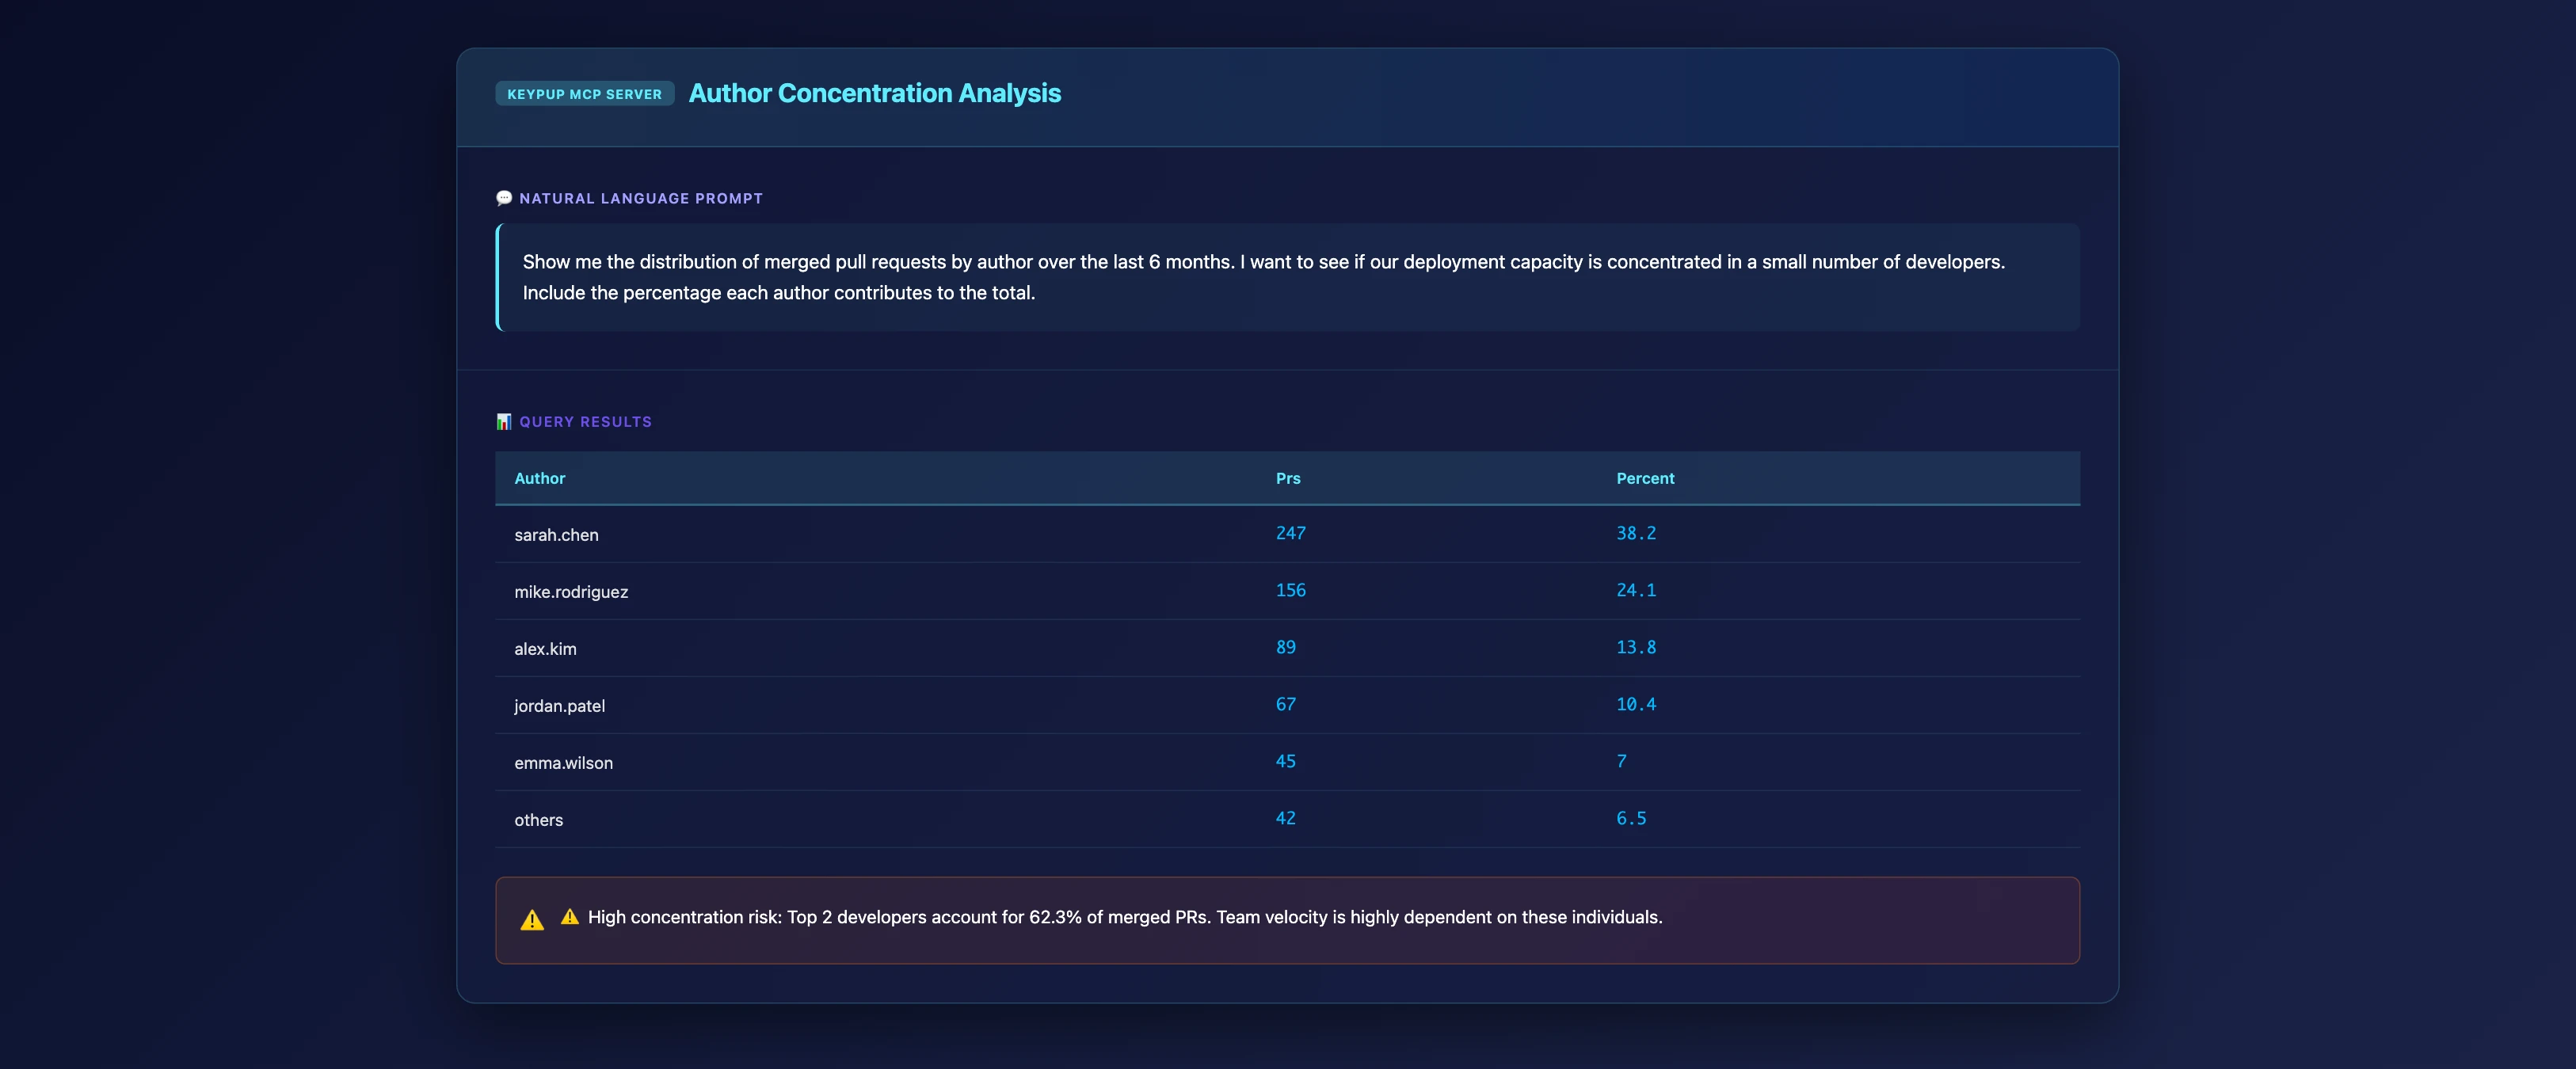
MCP Prompt: Identify Author Concentration Risk
Show me the distribution of merged pull requests by author over the last 6 months. I want to see if our deployment capacity is concentrated in a small number of developers. Include the percentage each author contributes to the total.
What This Reveals
Key Insights 📊
Concentration Risk: If 2-3 developers account for >60% of merged PRs, your "high performance" is fragile
Vacation/Attrition Impact: Losing one key person could cripple deployment capacity
Onboarding Gap: New team members aren't contributing at scale—knowledge transfer isn't happening
⚠️ Bottlenecks and Problem Areas
Senior engineers doing too much hands-on work instead of enabling others
Certain subsystems or infrastructure components only understood by specific individuals
Review capacity concentrated in the same developers who are already overloaded
💡 Recommendations
Implement mandatory knowledge sharing sessions for high-concentration areas
Rotate responsibilities to broaden system understanding
Pair junior developers with seniors on critical path work
Document tribal knowledge before it walks out the door
🚀 Priority Actions
Identify the 3 highest-risk code areas (highest concentration, highest criticality)
Create explicit knowledge transfer plans with measurable goals
Establish "no single point of failure" policy for critical subsystems
Example 2: Uncovering the "Fast and Fragile" Pattern
High deployment frequency is great, but how complex are those changes? Are you shipping thoughtfully designed features or accumulating incremental patches?
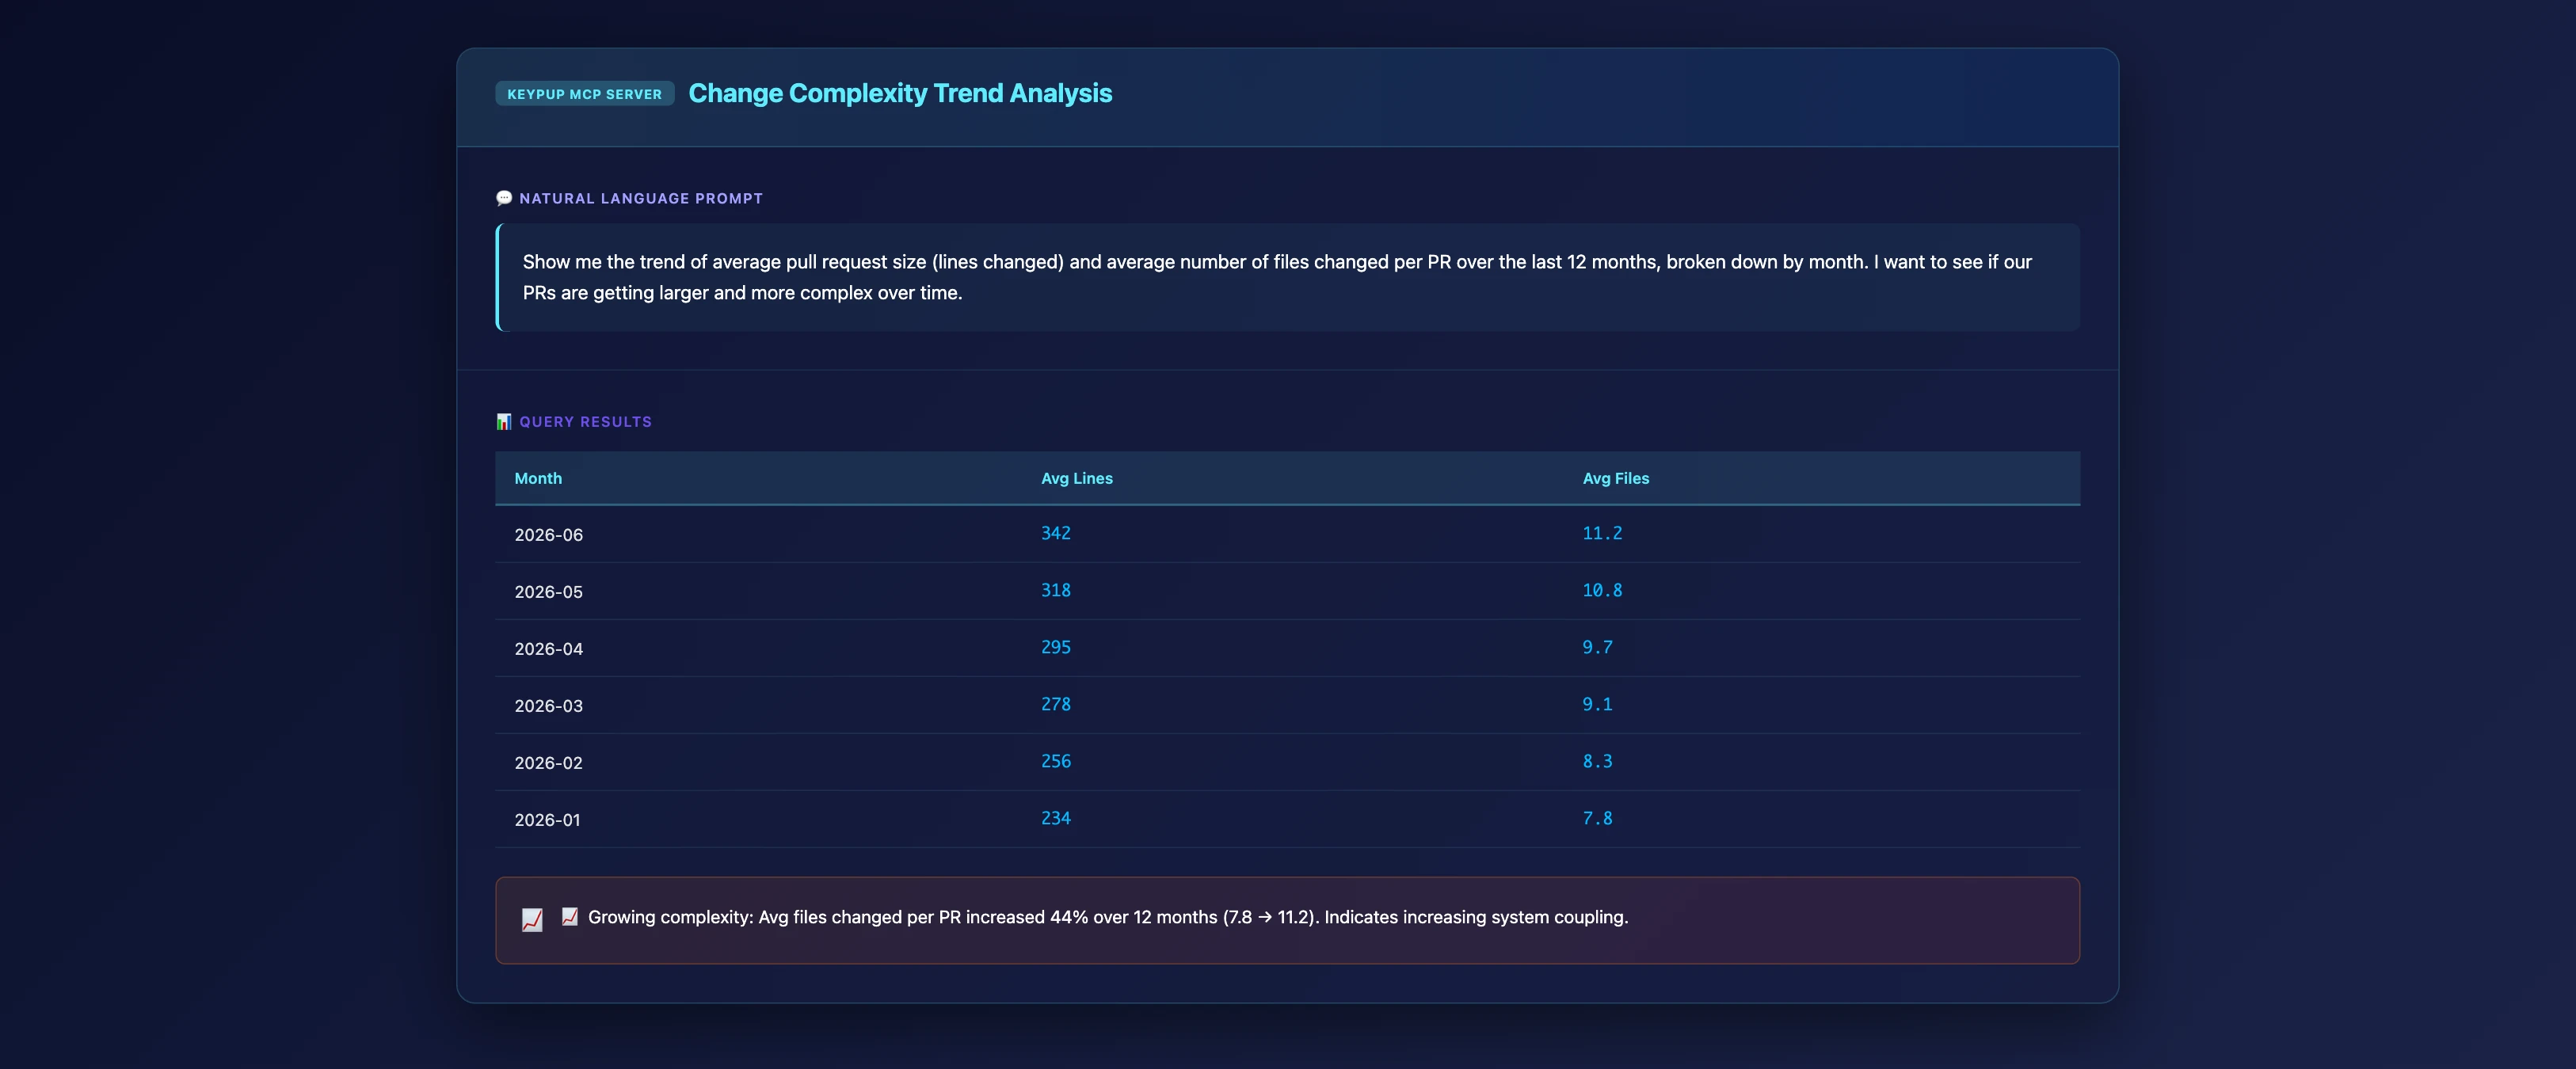
MCP Prompt: Analyze Change Complexity Over Time
Show me the trend of average pull request size (lines changed) and average number of files changed per PR over the last 12 months, broken down by month. I want to see if our PRs are getting larger and more complex over time.
What This Reveals
Key Insights 📊
Growing Coupling: Increasing files per PR suggests growing system coupling—changes ripple across boundaries
Architecture Degradation: If complexity is increasing while deployment frequency stays high, you're likely taking shortcuts
Refactoring Debt: Large, complex PRs often indicate deferred architectural improvements
⚠️ Bottlenecks and Problem Areas
Cross-cutting concerns spreading across the codebase without proper abstraction
Module boundaries breaking down as features are bolted on
Test fragility as changes require updating tests in many unrelated areas
💡 Recommendations
Set PR size guardrails (e.g., flag PRs touching >10 files for architectural review)
Schedule dedicated refactoring sprints to reduce coupling
Invest in modularization and clearer boundaries between components
Implement architecture decision records (ADRs) to prevent future coupling
🚀 Priority Actions
Run a coupling analysis to identify the most entangled modules
Create a "decoupling roadmap" for the 3 highest-risk areas
Establish architectural review process for PRs exceeding complexity thresholds
Example 3: Review Bottleneck Analysis
Low lead time looks good, but is it achieved through rubber-stamp reviews? Or are certain changes getting proper scrutiny while others aren't?
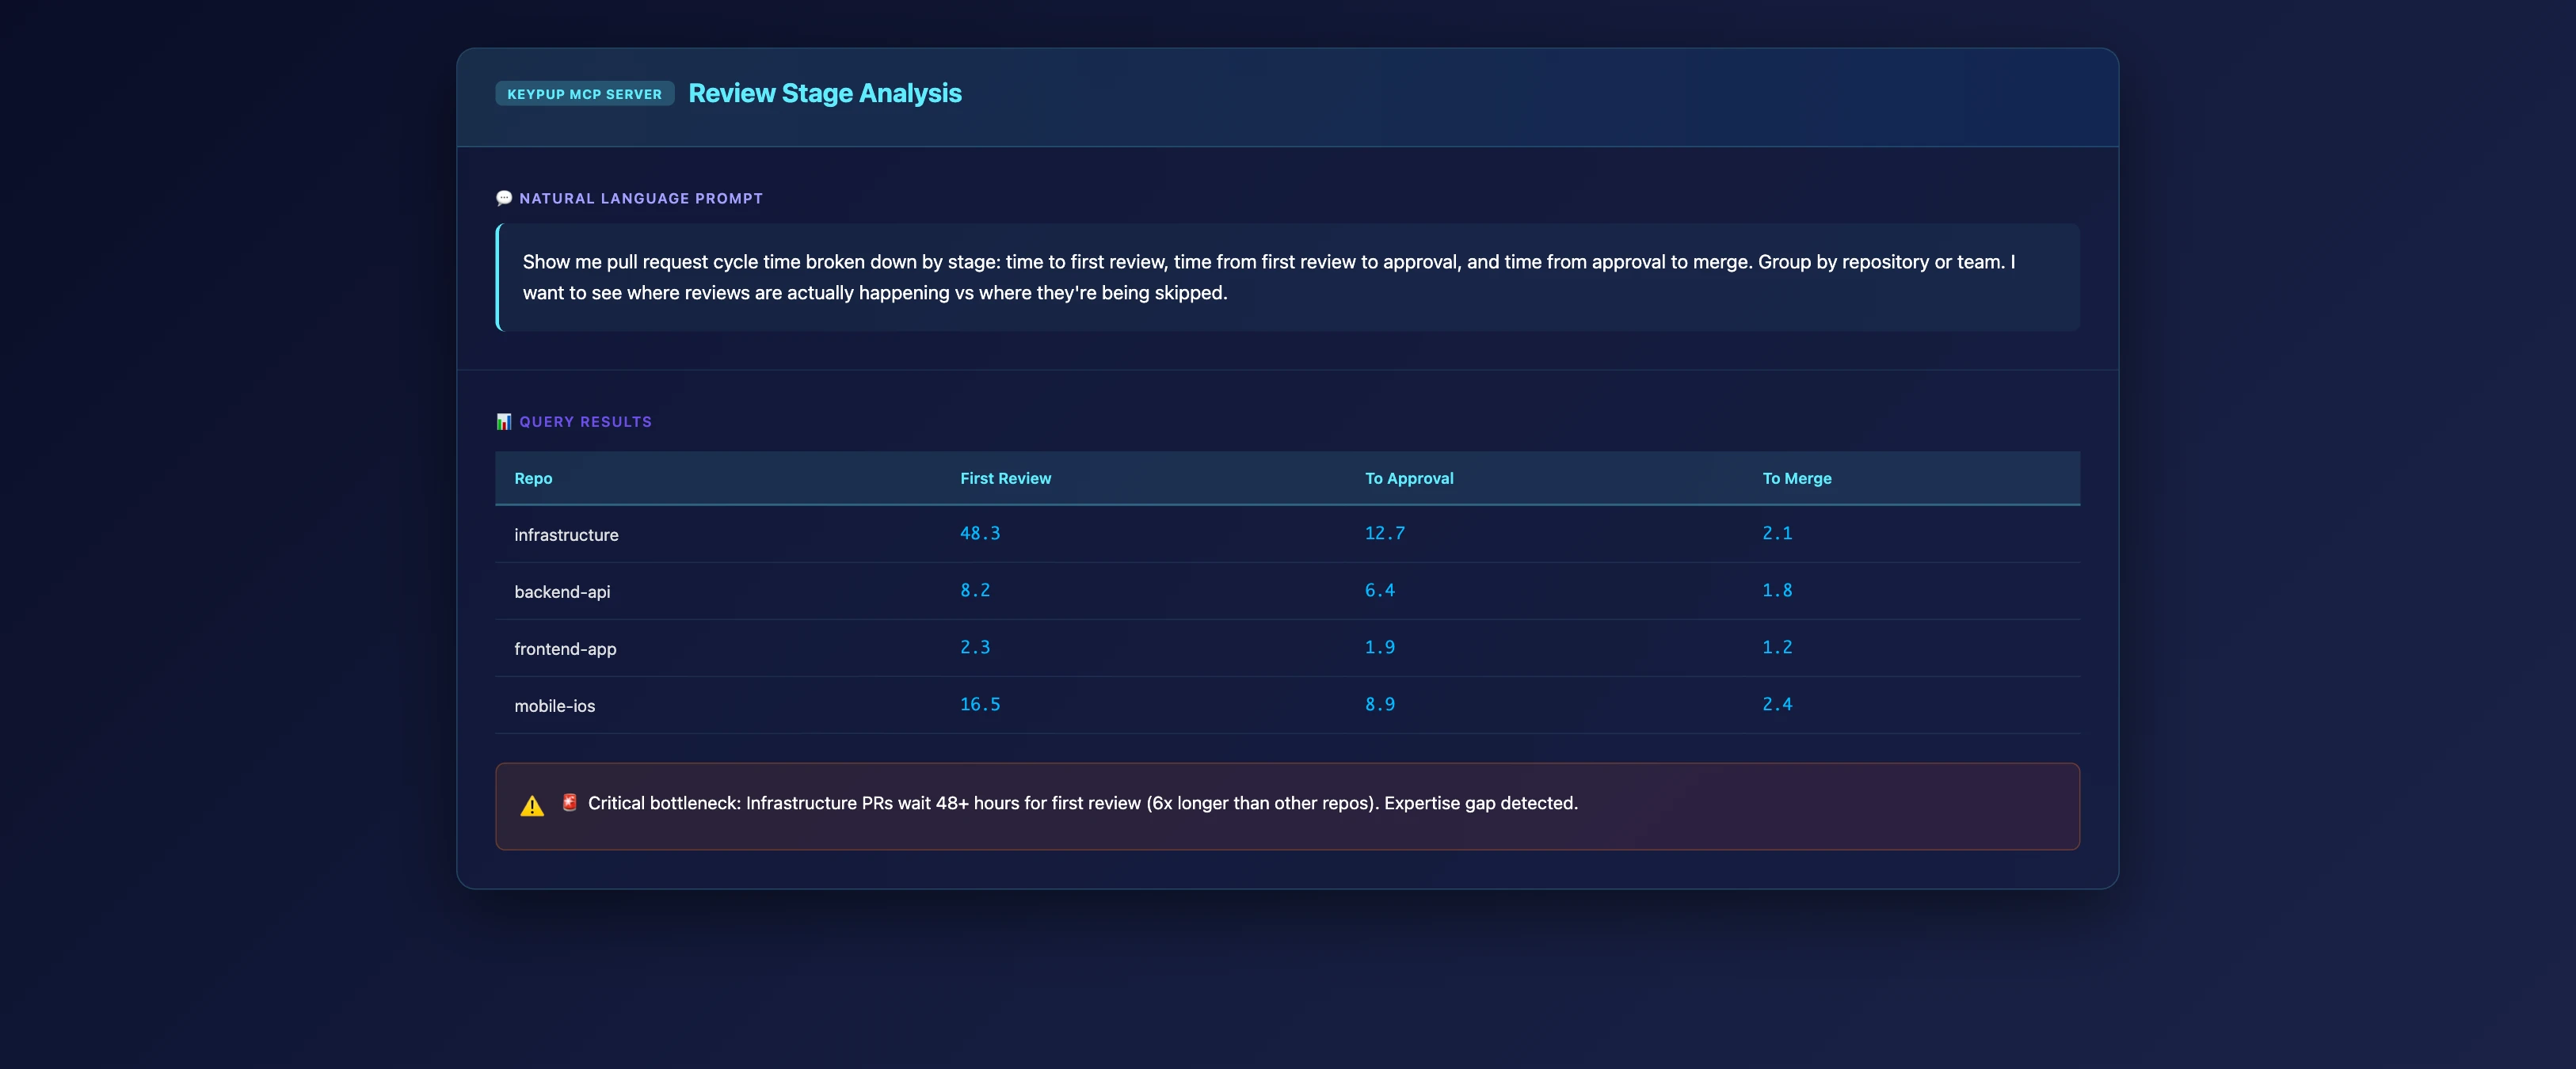
MCP Prompt: Analyze Review Patterns and Bottlenecks
Show me pull request cycle time broken down by stage: time to first review, time from first review to approval, and time from approval to merge. Group by repository or team. I want to see where reviews are actually happening vs where they're being skipped.
What This Reveals
Key Insights 📊
Selective Rigor: Fast reviews in some areas, bottlenecks in others—indicates inconsistent process
Expertise Gaps: Long "time to first review" suggests reviewers lack confidence or knowledge
Rubber-Stamping: Very short review times (especially on complex PRs) indicate insufficient scrutiny
⚠️ Bottlenecks and Problem Areas
Critical infrastructure changes waiting days because only 1-2 people are qualified to review
Frontend changes sailing through with minimal review
Database migrations stuck in review limbo due to lack of DBA expertise
💡 Recommendations
Distribute review expertise through pairing and training programs
Implement review checklists for different change types (security, performance, migrations)
Set up code ownership files (CODEOWNERS) with backup reviewers
Create explicit "review SLA" policies based on change risk level
🚀 Priority Actions
Map critical code areas without sufficient reviewer coverage
Establish mentorship pairs to grow review capacity
Create review guidelines for high-risk change categories
Implement async review practices to reduce bottlenecks
Example 4: Technical Debt Accumulation
Your change failure rate is stable, but are you preventing problems or just getting better at quick fixes?
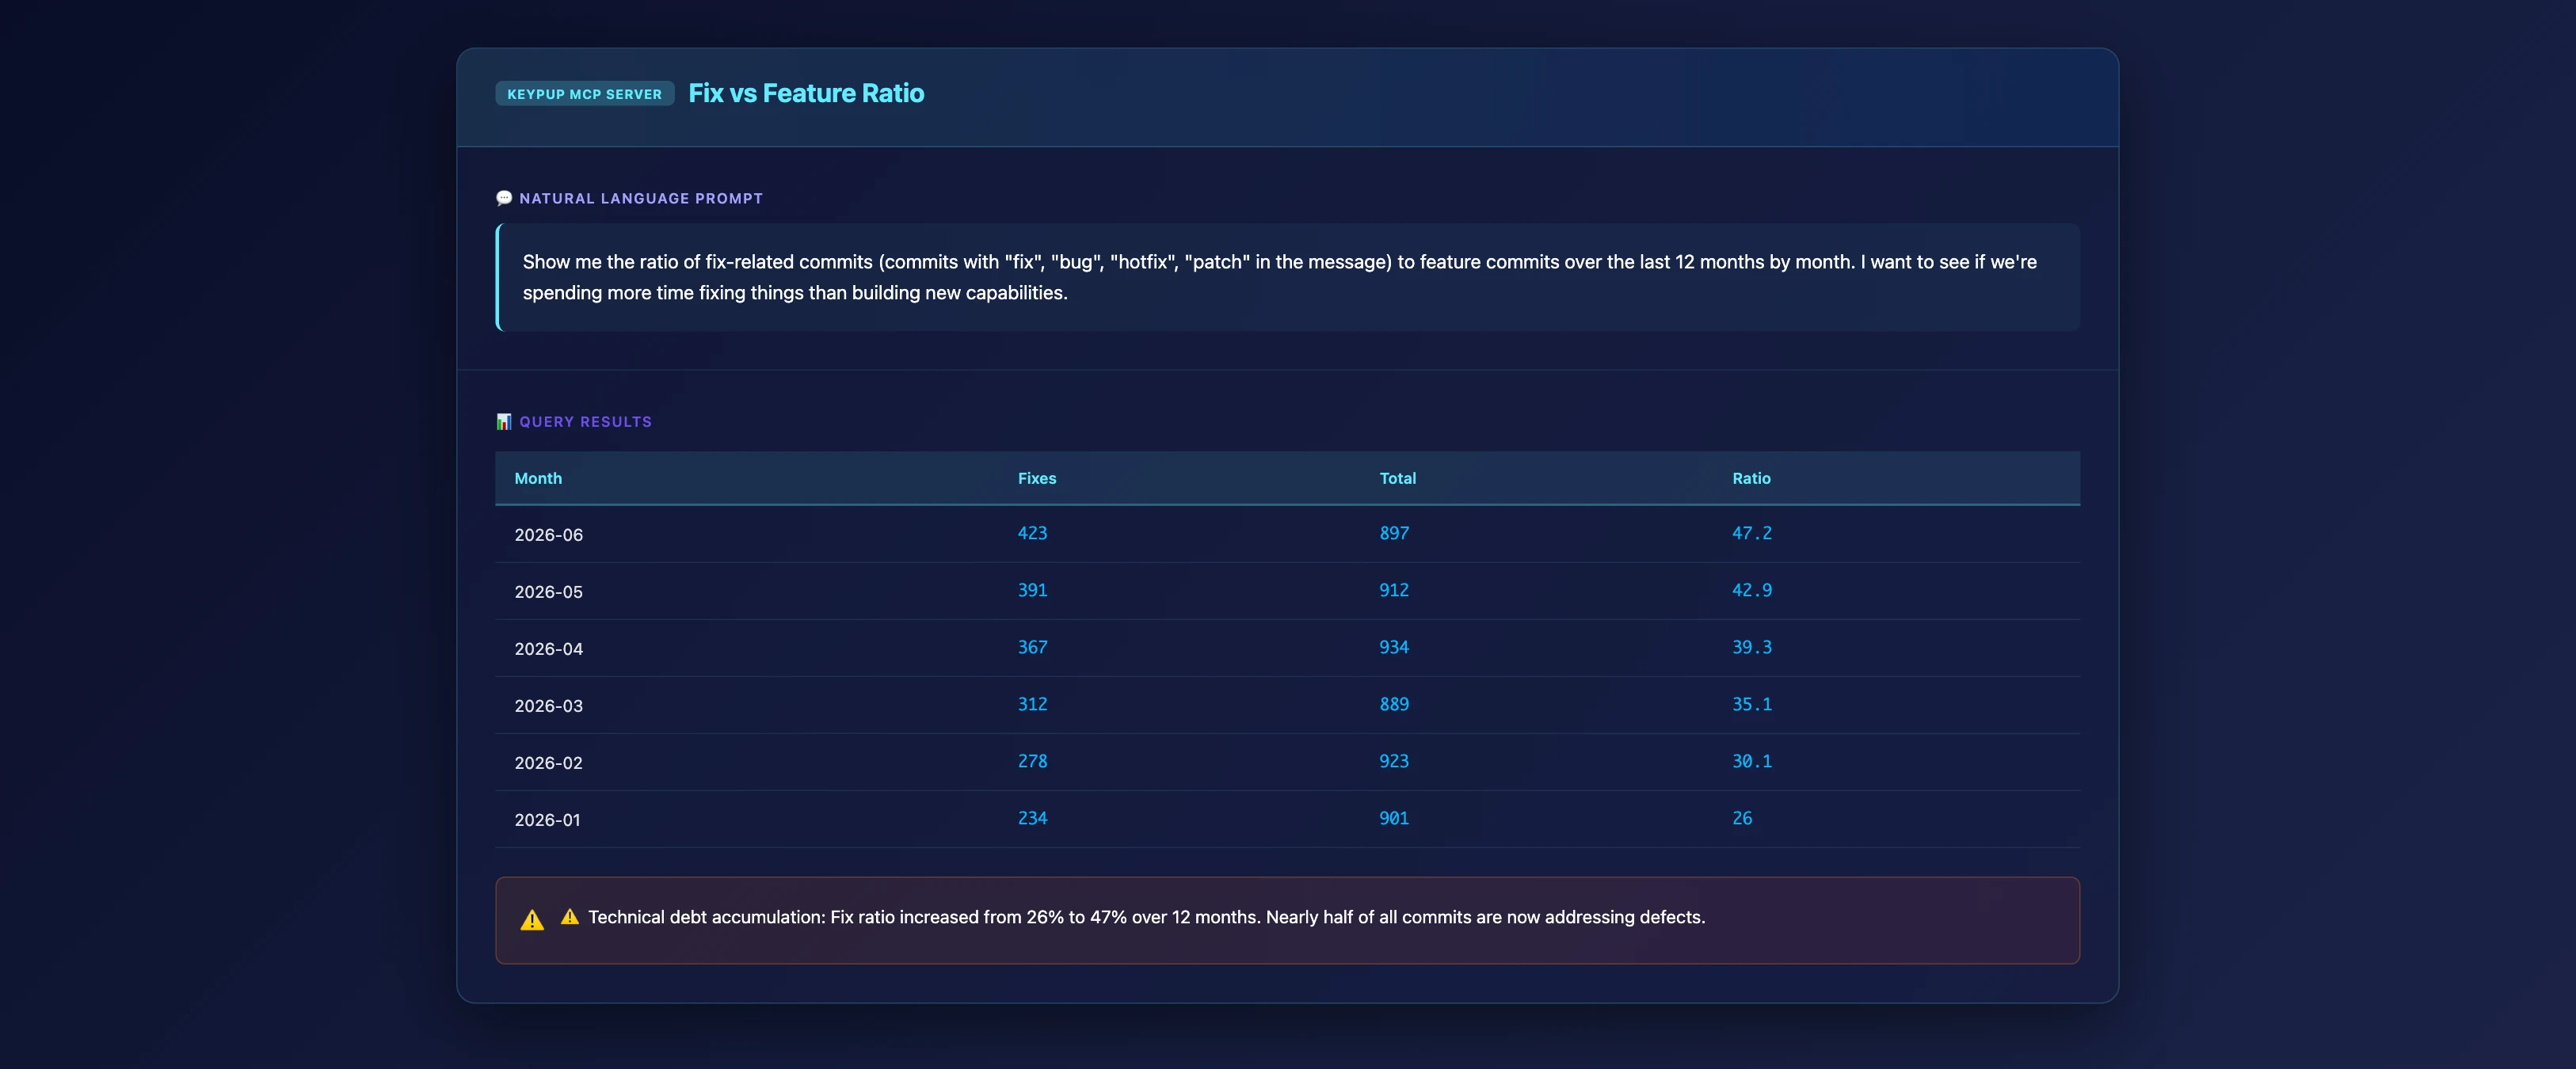
MCP Prompt: Identify Fix vs Feature Ratio
Show me the ratio of fix-related commits (commits with "fix", "bug", "hotfix", "patch" in the message) to feature commits over the last 12 months by month. Also show me the trend of emergency deployments or reverts. I want to see if we're spending more time fixing things than building new capabilities.
What This Reveals
Key Insights 📊
Debt Servicing Ratio: If >40% of commits are fixes, you're spending more time addressing technical debt than building value
Quality Erosion: Increasing fix ratio over time indicates accumulating problems
Stability Illusion: Your CFR might look stable because you're catching and fixing issues faster, not preventing them
⚠️ Bottlenecks and Problem Areas
High-churn files: Same files repeatedly fixed indicate underlying design problems
Cascade failures: Fixes triggering new issues suggests fragile architecture
Test coverage gaps: Bugs that should have been caught earlier making it to production
💡 Recommendations
Allocate 20-30% of sprint capacity to dedicated tech debt reduction
Implement "boy scout rule": leave code better than you found it
Root cause analysis for recurring issues instead of just patching symptoms
Invest in test infrastructure to prevent regressions
🚀 Priority Actions
Identify the 5 files with highest fix frequency—these need refactoring
Implement mandatory RCA for any fix that touches code modified in the last 30 days
Create a "technical debt backlog" with business impact assessment
Establish a "zero tolerance" policy for repeated issues in the same area
The Path Forward: Metrics + Legibility
DORA metrics remain valuable—but they must be paired with system legibility analysis to provide a complete picture of engineering health.
A Balanced Measurement Approach:
✅ Track DORA metrics for organizational benchmarking and trend analysis ✅ Layer in legibility metrics to understand how performance is achieved ✅ Use MCP-powered analysis to detect concentration risk, coupling, and shortcuts ✅ Create feedback loops between metrics and team practices ✅ Celebrate sustainable performance, not just fast numbers
Key Principles for Engineering Leaders
Question aggregates: Always ask "who" and "how" behind your team-level metrics
Value distributed capability over individual heroics
Track debt accumulation through fix/feature ratios
Invest in legibility as a first-class engineering goal
Getting Started with System Legibility Analysis
The Keypup MCP Server is available in beta and integrates with Claude Desktop, ChatGPT with custom GPTs, Cursor IDE, and Windsurf. Installation takes less than 5 minutes.
Quick Start Guide:
Install the MCP Server: Follow the setup guide for your preferred AI assistant
Connect your data sources: Link GitHub, GitLab, Jira, or Azure DevOps (read-only access)
Run your first legibility query: Start with the author concentration analysis above
Create a monitoring routine: Schedule weekly or monthly legibility checks
Share insights with your team: Use findings to inform sprint planning and architectural decisions
The MCP Server provides access to the same data harmonization and calculation engine that powers the Keypup web platform, but integrates directly into your AI-assisted workflow.
Conclusion: Beyond Vanity Metrics
High DORA metrics are desirable, but only if they reflect genuinely sustainable, healthy engineering practices. When performance numbers mask concentration risk, mounting technical debt, and deteriorating system legibility, they become dangerous vanity metrics.
The solution isn't to abandon DORA metrics—it's to augment them with deeper analysis that reveals how your team achieves those numbers.
Keypup's MCP Server integration provides that missing layer, enabling natural language queries that surface hidden patterns, structural problems, and early warning signs. It transforms engineering metrics from a compliance exercise into a genuine tool for understanding and improving system health.
The question isn't whether your DORA metrics look good. The question is: Can your team sustain that performance? Do they understand the systems they're building? Is success dependent on a few heroes, or distributed across the team?
System legibility analysis answers those questions.
Frequently Asked Questions
Are DORA metrics still valuable?
Absolutely. DORA metrics remain the industry standard for measuring software delivery performance at the organizational level. The issue isn't the metrics themselves—it's treating them as sufficient when they're actually necessary but incomplete. Pair DORA with system legibility analysis for a complete picture.
How does Keypup MCP differ from the web platform?
Both use the same data engine and calculations. The web platform provides interactive dashboards ideal for executive reporting and team meetings. The MCP Server integrates into AI assistants, enabling ad-hoc queries and deeper exploration. Many teams use both: the platform for monitoring, the MCP server for investigation.
What if our DORA metrics are already poor?
Start there. If your metrics show low deployment frequency, high lead times, or elevated change failure rates, those are your immediate priorities. System legibility analysis becomes critical once you're "performing well" on paper but things still feel broken—that's when metrics are most likely to mislead.
Can you game system legibility metrics too?
Yes, but it's much harder. Metrics like "author concentration" or "PR complexity trends" reflect structural properties of your system that can't be easily manipulated without actually improving the underlying situation. That said, no metric is perfect—the goal is a portfolio of indicators that together tell a coherent story.
How often should we run legibility analysis?
Most teams benefit from monthly reviews as part of retrospectives. Run concentration risk analysis before major team changes (new hires, departures, reorgs). Run complexity and review analyses when velocity feels mismatched with team sentiment. Treat it like security scanning—regular checks with deep dives when something feels off.
What's the first legibility metric to implement?
Start with author concentration analysis for merged PRs. It's simple to calculate, immediately actionable, and often reveals surprising concentration patterns. If 2-3 people account for >60% of merged work, you've found your first system legibility problem.
How do I convince leadership this matters?
Frame it as risk management. High DORA metrics with low legibility represent single-point-of-failure risk. If key people leave, can the team maintain performance? System legibility is about sustainable performance and reduced business risk, not just making developers happy (though it does that too).
Does this work for small teams?
Yes, though concentration patterns are expected and acceptable in very small teams (< 5 engineers). The value is in tracking trends: are you becoming more or less concentrated over time? As the team grows, is knowledge distributing or concentrating further? System legibility scales with your organization.
Ready to Transform Your Analytics?
Join teams already using AI to make data-driven decisions faster than
ever.
Discover why measuring individual developer performance with raw metrics leads to gaming behavior and erodes team trust. Learn how Keypup's MCP Server provides contextual benchmarking that accounts for mentoring, architecture work, and team contribution—transforming metrics from surveillance tools into culture-building insights that recognize real value beyond lines of code.
Discover how to overcome the most painful project management challenges in software development. Learn how Keypup's MCP Server harmonizes data across Jira, Trello, and Git repositories to provide actionable insights, predictive analytics, and real-time visibility—transforming chaos into clarity and helping teams deliver on time, every time.
Learn how to achieve and maintain ISO27001 and SOC2 Type II certifications for your software development organization. Discover the specific SDLC requirements, audit processes, and how Keypup's MCP Server provides continuous compliance monitoring, automated evidence collection, and real-time audit trails—saving months of preparation time and reducing certification costs by up to 60%.