TL;DR: Software development project management is uniquely challenging—data scattered across Jira, Trello, and Git; velocity unpredictability; invisible dependencies; constant firefighting. Keypup's MCP Server harmonizes this fragmented data into actionable insights through natural language queries, providing real-time visibility, predictive analytics, and measurable solutions that actually work. This guide shows you how to transform PM chaos into clarity.
The Project Manager's Perfect Storm
Managing software development projects is fundamentally different from managing any other type of project. You're dealing with:
- Invisible work: Code complexity, technical debt, refactoring—none of it shows up in your project board
- Fragmented data: Issues in Jira, tasks in Trello, actual work in Git—three sources of truth that never agree
- Unpredictable velocity: Teams commit to 40 story points, deliver 25, and you have no idea why
- Hidden dependencies: That "simple" feature triggers changes across six repos and three teams
- Shifting priorities: Business demands new features while technical debt compounds silently
The traditional PM toolkit—Gantt charts, burndown graphs, status meetings—was built for construction projects where progress is visible and linear. Software development is neither.
The Real Pain: What PMs Actually Say
"I manage three teams across two time zones. My Jira board says we're 80% done. Git says we've merged 40% of the planned PRs. Trello says half the design tasks aren't even started. Which one do I report to the CEO? I spend 15 hours a week manually reconciling data instead of actually managing."
"We committed to a 3-sprint release. Sprint 1: delivered 35/50 points. Sprint 2: delivered 28/50 points. Now sprint 3, and business wants to know the delivery date. How am I supposed to predict that? Every retrospective is the same: 'unexpected complexity,' 'dependencies we didn't know about,' 'production issues.' I'm not a PM, I'm a fortune teller."
"My CTO asks: 'Why is Team A at 2x velocity of Team B?' I have no idea. Different story point scales? Different complexity? Different work types? I can show her two Jira reports that directly contradict each other. Data-driven decisions are impossible when your data is garbage."
Sound familiar? You're not alone. A 2025 State of Software Development PM survey found that 73% of project managers spend more time gathering and reconciling data than actually analyzing it or making decisions.
The Eight PM Nightmares (And Why They're So Hard to Solve)
1. Data Fragmentation: The Three Sources of Partial Truth
Your project exists in three parallel universes:
- Jira/Linear/Azure Boards: What should happen (requirements, user stories, sprint commitments)
- Trello/Notion/Asana: What the process looks like (design reviews, QA checklists, deployment approvals)
- Git/GitHub/GitLab: What actually happened (code changes, reviews, merges, releases)
Each tool captures part of reality. None of them talk to each other. You manually export CSVs, copy-paste into spreadsheets, and hope your formulas are right.
The Keypup MCP Solution: Unified data model that connects work items to code changes in real-time, giving you a single source of truth across all tools.
2. Velocity Unpredictability: The Planning Fallacy at Scale
Sprint planning feels like Groundhog Day:
- Team commits to X story points based on "last sprint's velocity"
- Mid-sprint, you realize half the stories are blocked on external dependencies
- End of sprint, you delivered 60% of the commitment
- Next planning: "Let's be more realistic this time!" (Narrator: They weren't.)
The problem isn't estimation—it's that velocity averages hide everything important. A team with "average velocity 30" might deliver 45, 18, 32, 22—that's not a velocity, that's chaos.
"Stakeholders treat velocity like a speedometer. 'You did 40 points last sprint, why only 30 this sprint?' Because last sprint was bug fixes and this sprint is new features with 5 external API integrations we've never touched before! Story points measure complexity, not time. I've explained this 47 times."
The Keypup MCP Solution: Predictive analytics that factor in work type, team capacity, historical patterns, and dependency complexity—giving you confidence intervals, not false precision.
3. Invisible Dependencies: The Cascade You Never See Coming
You're tracking Feature X in Jira. It looks straightforward. Then you discover:
- It requires changes to the authentication service (Team B)
- Which needs a database migration (DBA team)
- Which can't happen until the staging environment is upgraded (DevOps)
- Which is blocked on a vendor contract renewal (Procurement)
By the time you map all this out, Feature X has blown from "1 sprint" to "probably Q3, maybe Q4."
The problem: Dependencies live in Slack conversations, meeting notes, and developer brains—not in any system you can query.
The Keypup MCP Solution: Cross-repository analysis that detects code-level dependencies, identifies teams involved, and surfaces hidden complexity before you commit to a timeline.
4. Resource Allocation: Who's Overloaded, Who's Idle?
Your team of 12 engineers shows in Jira as "fully allocated." But:
- Two senior devs spend 60% of their time on production support (not tracked)
- One engineer is on four different teams' sprint boards
- Two others have 15 story points assigned but spent last week on an urgent customer escalation
- One is ramping up (assigned work, but actually learning, not delivering)
You're managing tickets, not people. And you won't know someone's drowning until they quit.
"Had a 1:1 with Sarah. She's assigned 25 points this sprint, perfectly average. Turns out she's also: reviewing PRs for another team, mentoring a junior, on-call for the legacy system, and finishing work from the previous sprint that got carried over. I asked how she's doing. She cried. I failed her as a manager because my tools showed green."
The Keypup MCP Solution: Workload analysis that tracks actual work (commits, reviews, issue activity) across all repos and projects, surfacing overallocation and idle capacity before burnout.
5. Technical Debt vs. Features: The Invisible Negotiation
Business wants features. Engineering wants to pay down technical debt. You're stuck in the middle with zero data to adjudicate.
Engineering says: "We need to refactor the payment system or it'll collapse."
Business says: "We need the new checkout flow or we'll lose customers."
You say: "...Both?" (Narrator: You delivered neither well.)
The problem: Technical debt is invisible to non-engineers, and engineers can't quantify the business impact of not addressing it.
The Keypup MCP Solution: Debt quantification that translates technical problems into business metrics (increased cycle time, higher defect rates, slower velocity) with projected ROI of addressing it.
4. Resource Allocation: Who's Overloaded, Who's Idle?
Your team of 12 engineers shows in Jira as "fully allocated." But:
- Two senior devs spend 60% of their time on production support (not tracked)
- One engineer is on four different teams' sprint boards
- Two others have 15 story points assigned but spent last week on an urgent customer escalation
- One is ramping up (assigned work, but actually learning, not delivering)
You're managing tickets, not people. And you won't know someone's drowning until they quit.
"Had a 1:1 with Sarah. She's assigned 25 points this sprint, perfectly average. Turns out she's also: reviewing PRs for another team, mentoring a junior, on-call for the legacy system, and finishing work from the previous sprint that got carried over. I asked how she's doing. She cried. I failed her as a manager because my tools showed green."
The Keypup MCP Solution: Workload analysis that tracks actual work (commits, reviews, issue activity) across all repos and projects, surfacing overallocation and idle capacity before burnout.
5. Technical Debt vs. Features: The Invisible Negotiation
Business wants features. Engineering wants to pay down technical debt. You're stuck in the middle with zero data to adjudicate.
Engineering says: "We need to refactor the payment system or it'll collapse."
Business says: "We need the new checkout flow or we'll lose customers."
You say: "...Both?" (Narrator: You delivered neither well.)
"Stakeholders treat velocity like a speedometer. 'You did 40 points last sprint, why only 30 this sprint?' Because last sprint was bug fixes and this sprint is new features with 5 external API integrations we've never touched before! Story points measure complexity, not time. I've explained this 47 times."
The Keypup MCP Solution: Predictive analytics that factor in work type, team capacity, historical patterns, and dependency complexity—giving you confidence intervals, not false precision.
6. Planning Accuracy: Why Your Roadmap Is Always Wrong
You build a roadmap:
- Q2: Feature A (6 weeks)
- Q3: Feature B (8 weeks)
- Q4: Feature C (4 weeks)
Reality:
- Q2: Feature A (10 weeks, still not done)
- Q3: Emergency security patch (4 weeks), Feature A done (finally), Feature B started (2 weeks)
- Q4: Feature B (still going), Feature C (not started), also five "quick wins" that took 6 weeks total
Your roadmap is fiction. Stakeholders lose trust. You lose credibility.
The Keypup MCP Solution: Historical pattern analysis that identifies why estimates miss (scope creep, dependency delays, context switching) and adjusts future predictions based on actual delivery patterns.
7. Cross-Team Coordination: Conway's Law Strikes Back
You're managing a feature that spans:
- Mobile team (iOS + Android)
- Backend team (API + services)
- Data team (analytics + ML)
- DevOps team (deployment + monitoring)
Each team has its own:
- Sprint schedule (2-week vs. 1-week vs. continuous)
- Planning process (Jira vs. Linear vs. GitHub Projects)
- Definition of done (varies wildly)
- Communication style (Slack vs. email vs. "just find me")
You spend half your time translating between teams and trying to synchronize independent schedules.
"Backend merged their changes. Mobile team is waiting on API docs that don't exist. Data team built a dashboard for an API endpoint that got renamed. DevOps is deploying the old version because nobody told them there was a new one. I scheduled a 'dependency sync meeting.' 12 people, 1 hour, outcome: schedule another meeting. This is my life."
The Keypup MCP Solution: Cross-team dependency tracking with real-time alerts when one team's changes affect another's work, plus impact analysis showing downstream effects.
8. Measuring Success: Did That Sprint Process Change Actually Help?
You implement a new process:
- "Let's do design reviews before coding" (adds 1 week upfront)
- "Let's require two approvers on PRs" (adds review time)
- "Let's add automated testing" (adds setup time)
Engineering grumbles. You promise it'll improve quality/velocity/something. Six weeks later, someone asks: "Did it work?"
You have... no idea. You can't prove it helped. You can't prove it hurt. You're making decisions in the dark.
The Keypup MCP Solution: Before/after analysis with statistical significance testing, isolating the impact of process changes on cycle time, defect rates, and delivery predictability.
How Keypup MCP Harmonizes Your Fragmented Reality
Unlike traditional PM tools that live in their own silo, Keypup MCP integrates with your existing tools and provides a unified, queryable view:
The Harmony Layer: Connecting Jira, Trello, and Git
Keypup creates a unified data model:
Issue (Jira PROJ-123)
  ├─ Task: Design (Trello)
  ├─ Task: Backend (Jira subtask)
  │    └─ Pull Request #456 (GitHub)
  │         ├─ Commits: 12
  │         ├─ Changed files: 8
  │         ├─ Reviews: 2 (approved)
  │         └─ Merge time: 2024-06-15
  ├─ Task: Frontend (Jira subtask)
  │    └─ Pull Request #457 (GitHub)
  │         └─ Status: In review
  └─ Task: QA (Trello)
       └─ Status: Blocked (waiting on PR #457)
Every issue automatically links to its actual code changes. Every PR references back to the work item. Task status in Trello reflects actual code status in Git.
The result: When you ask "What's the status of PROJ-123?", you get real status, not board status.
Natural Language Queries: Your Data, Your Questions
Instead of wrestling with Jira Query Language or writing SQL, you ask questions in plain English via your AI assistant:
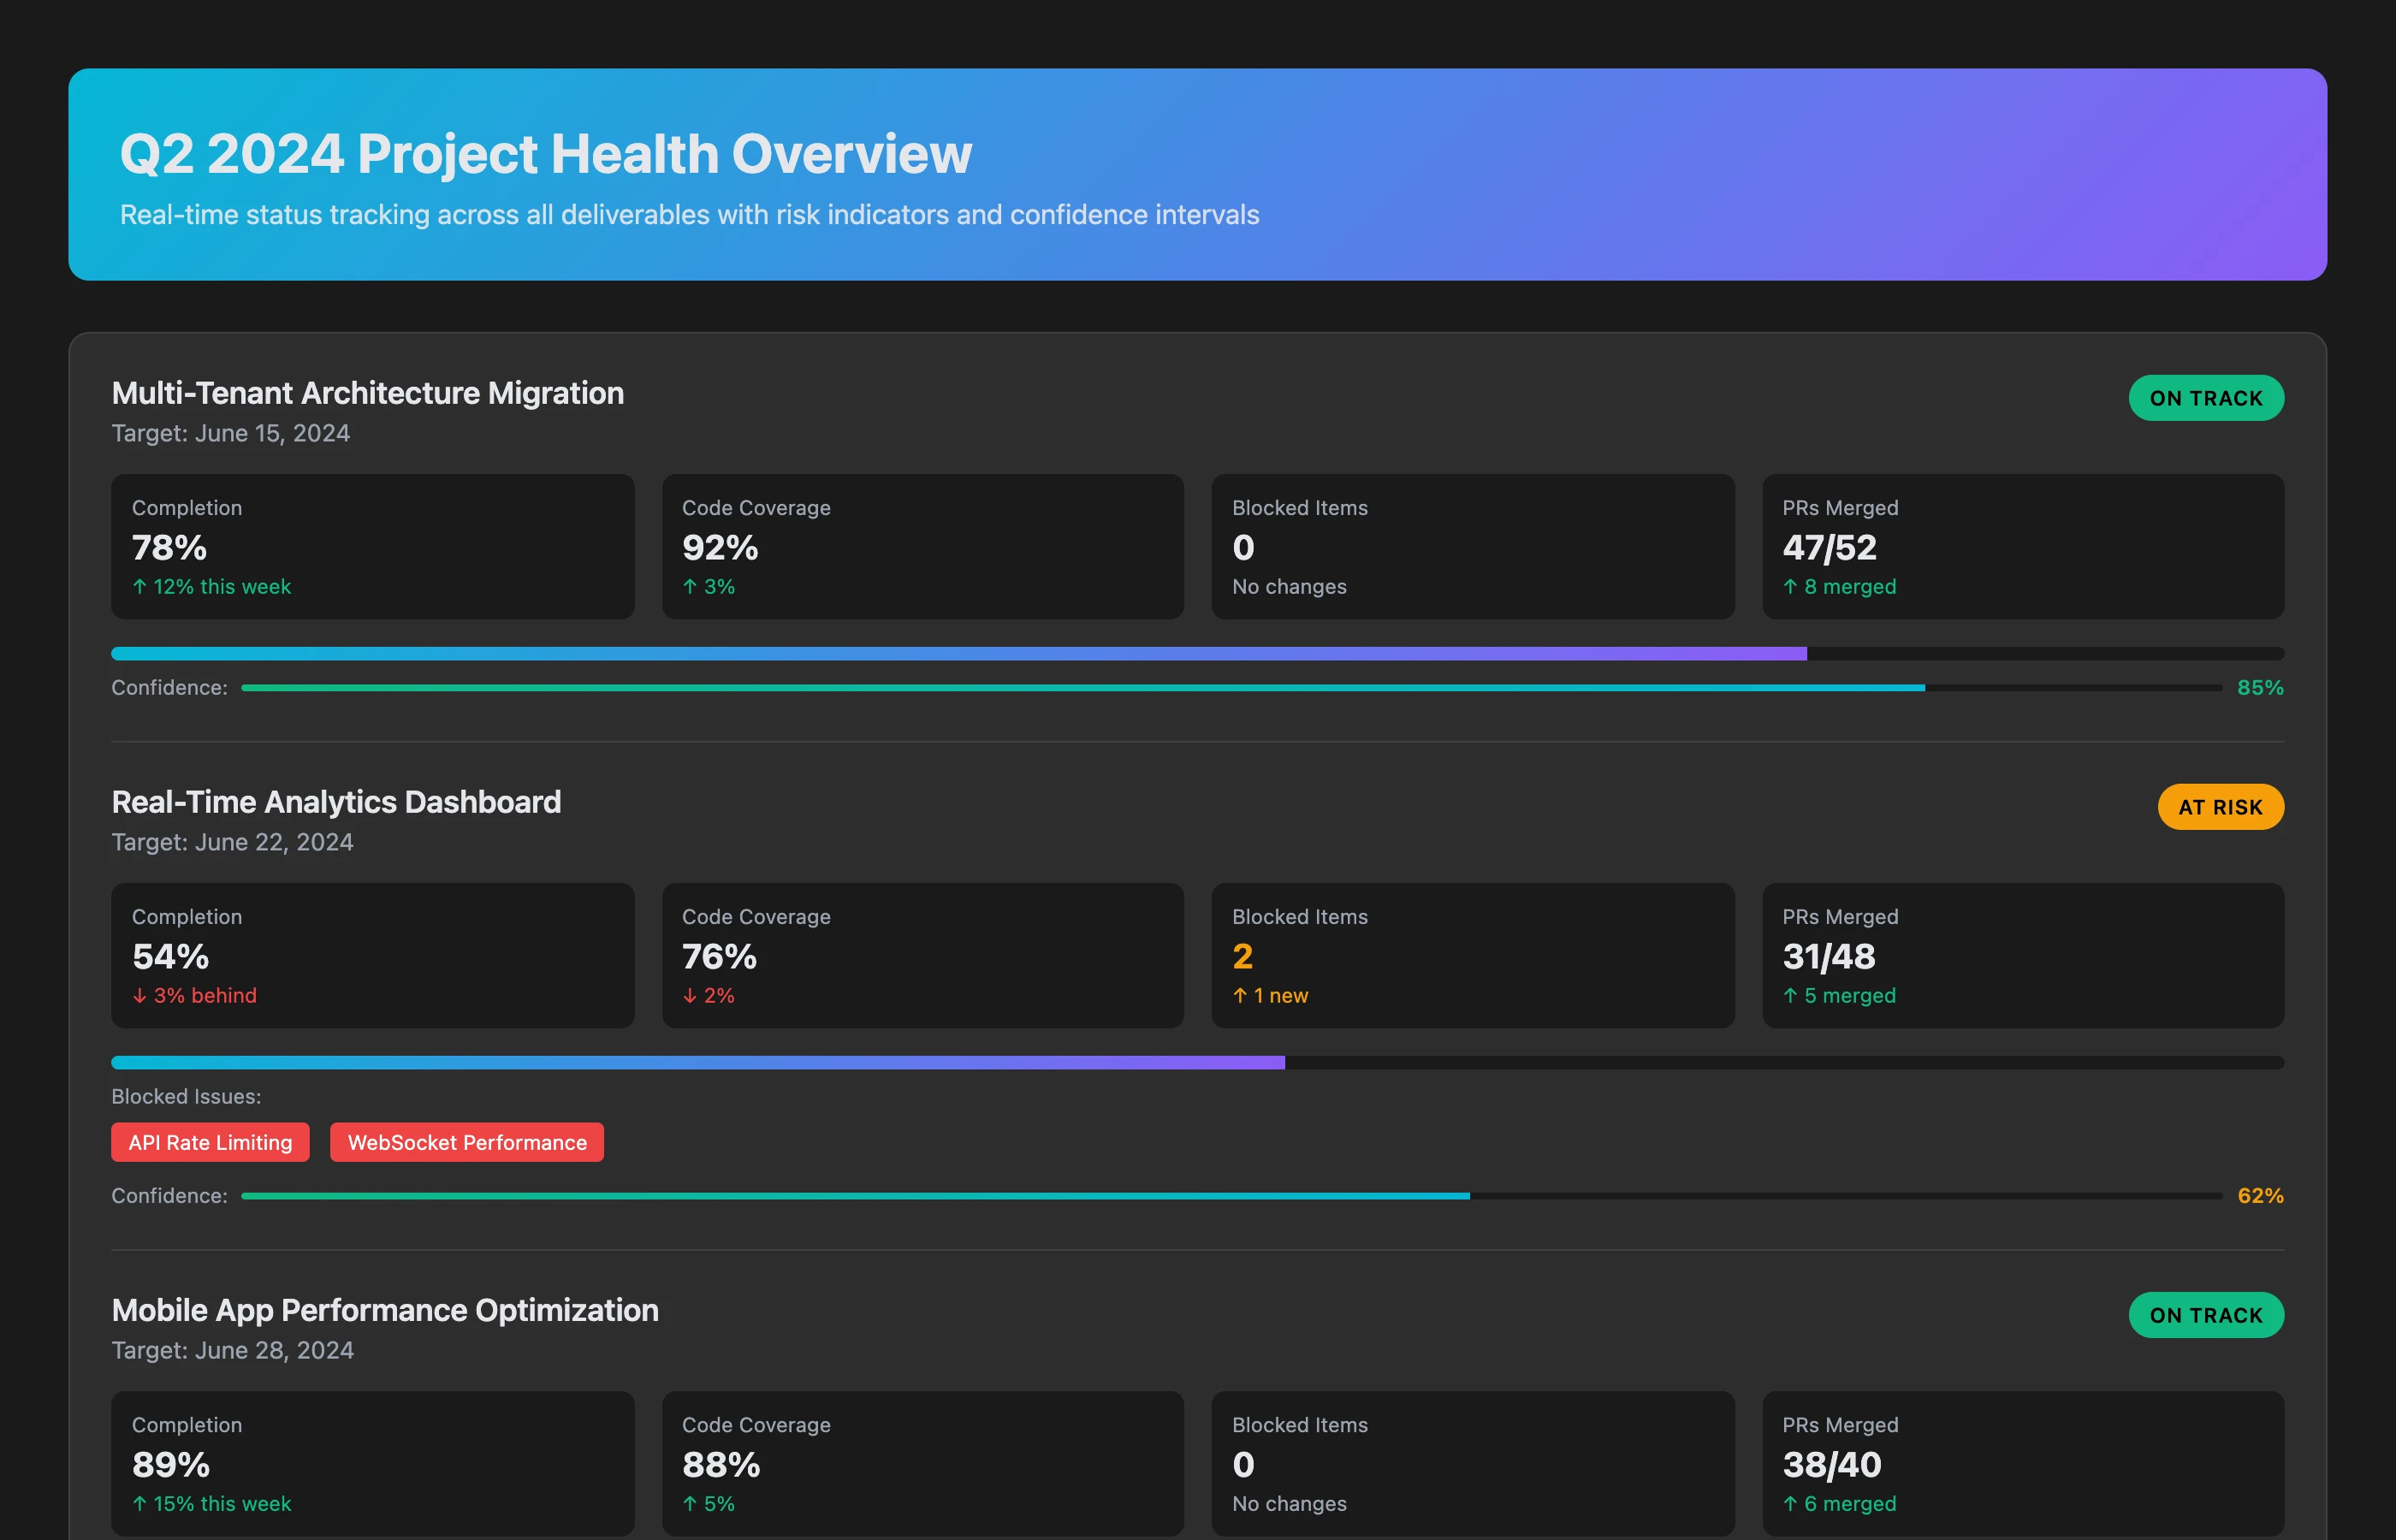
Project Health Overview
Show me the current status of all Q2 deliverables, including code completion percentage, blocked items, and risk factors for missing the deadline.
What you see:
- Deliverable 1: 87% code complete, PRs merged, QA in progress → Green (on track)
- Deliverable 2: 45% code complete, 3 PRs in review, 1 blocked on external API → Yellow (at risk, needs attention)
- Deliverable 3: 12% code complete, design not approved, dependency on Team B not started → Red (missing deadline, requires intervention)
Each item drills down to specific blockers, responsible teams, and recommended actions.
Predictive Analytics: From Reactive to Proactive
Instead of discovering problems in retrospectives, you predict them in planning:
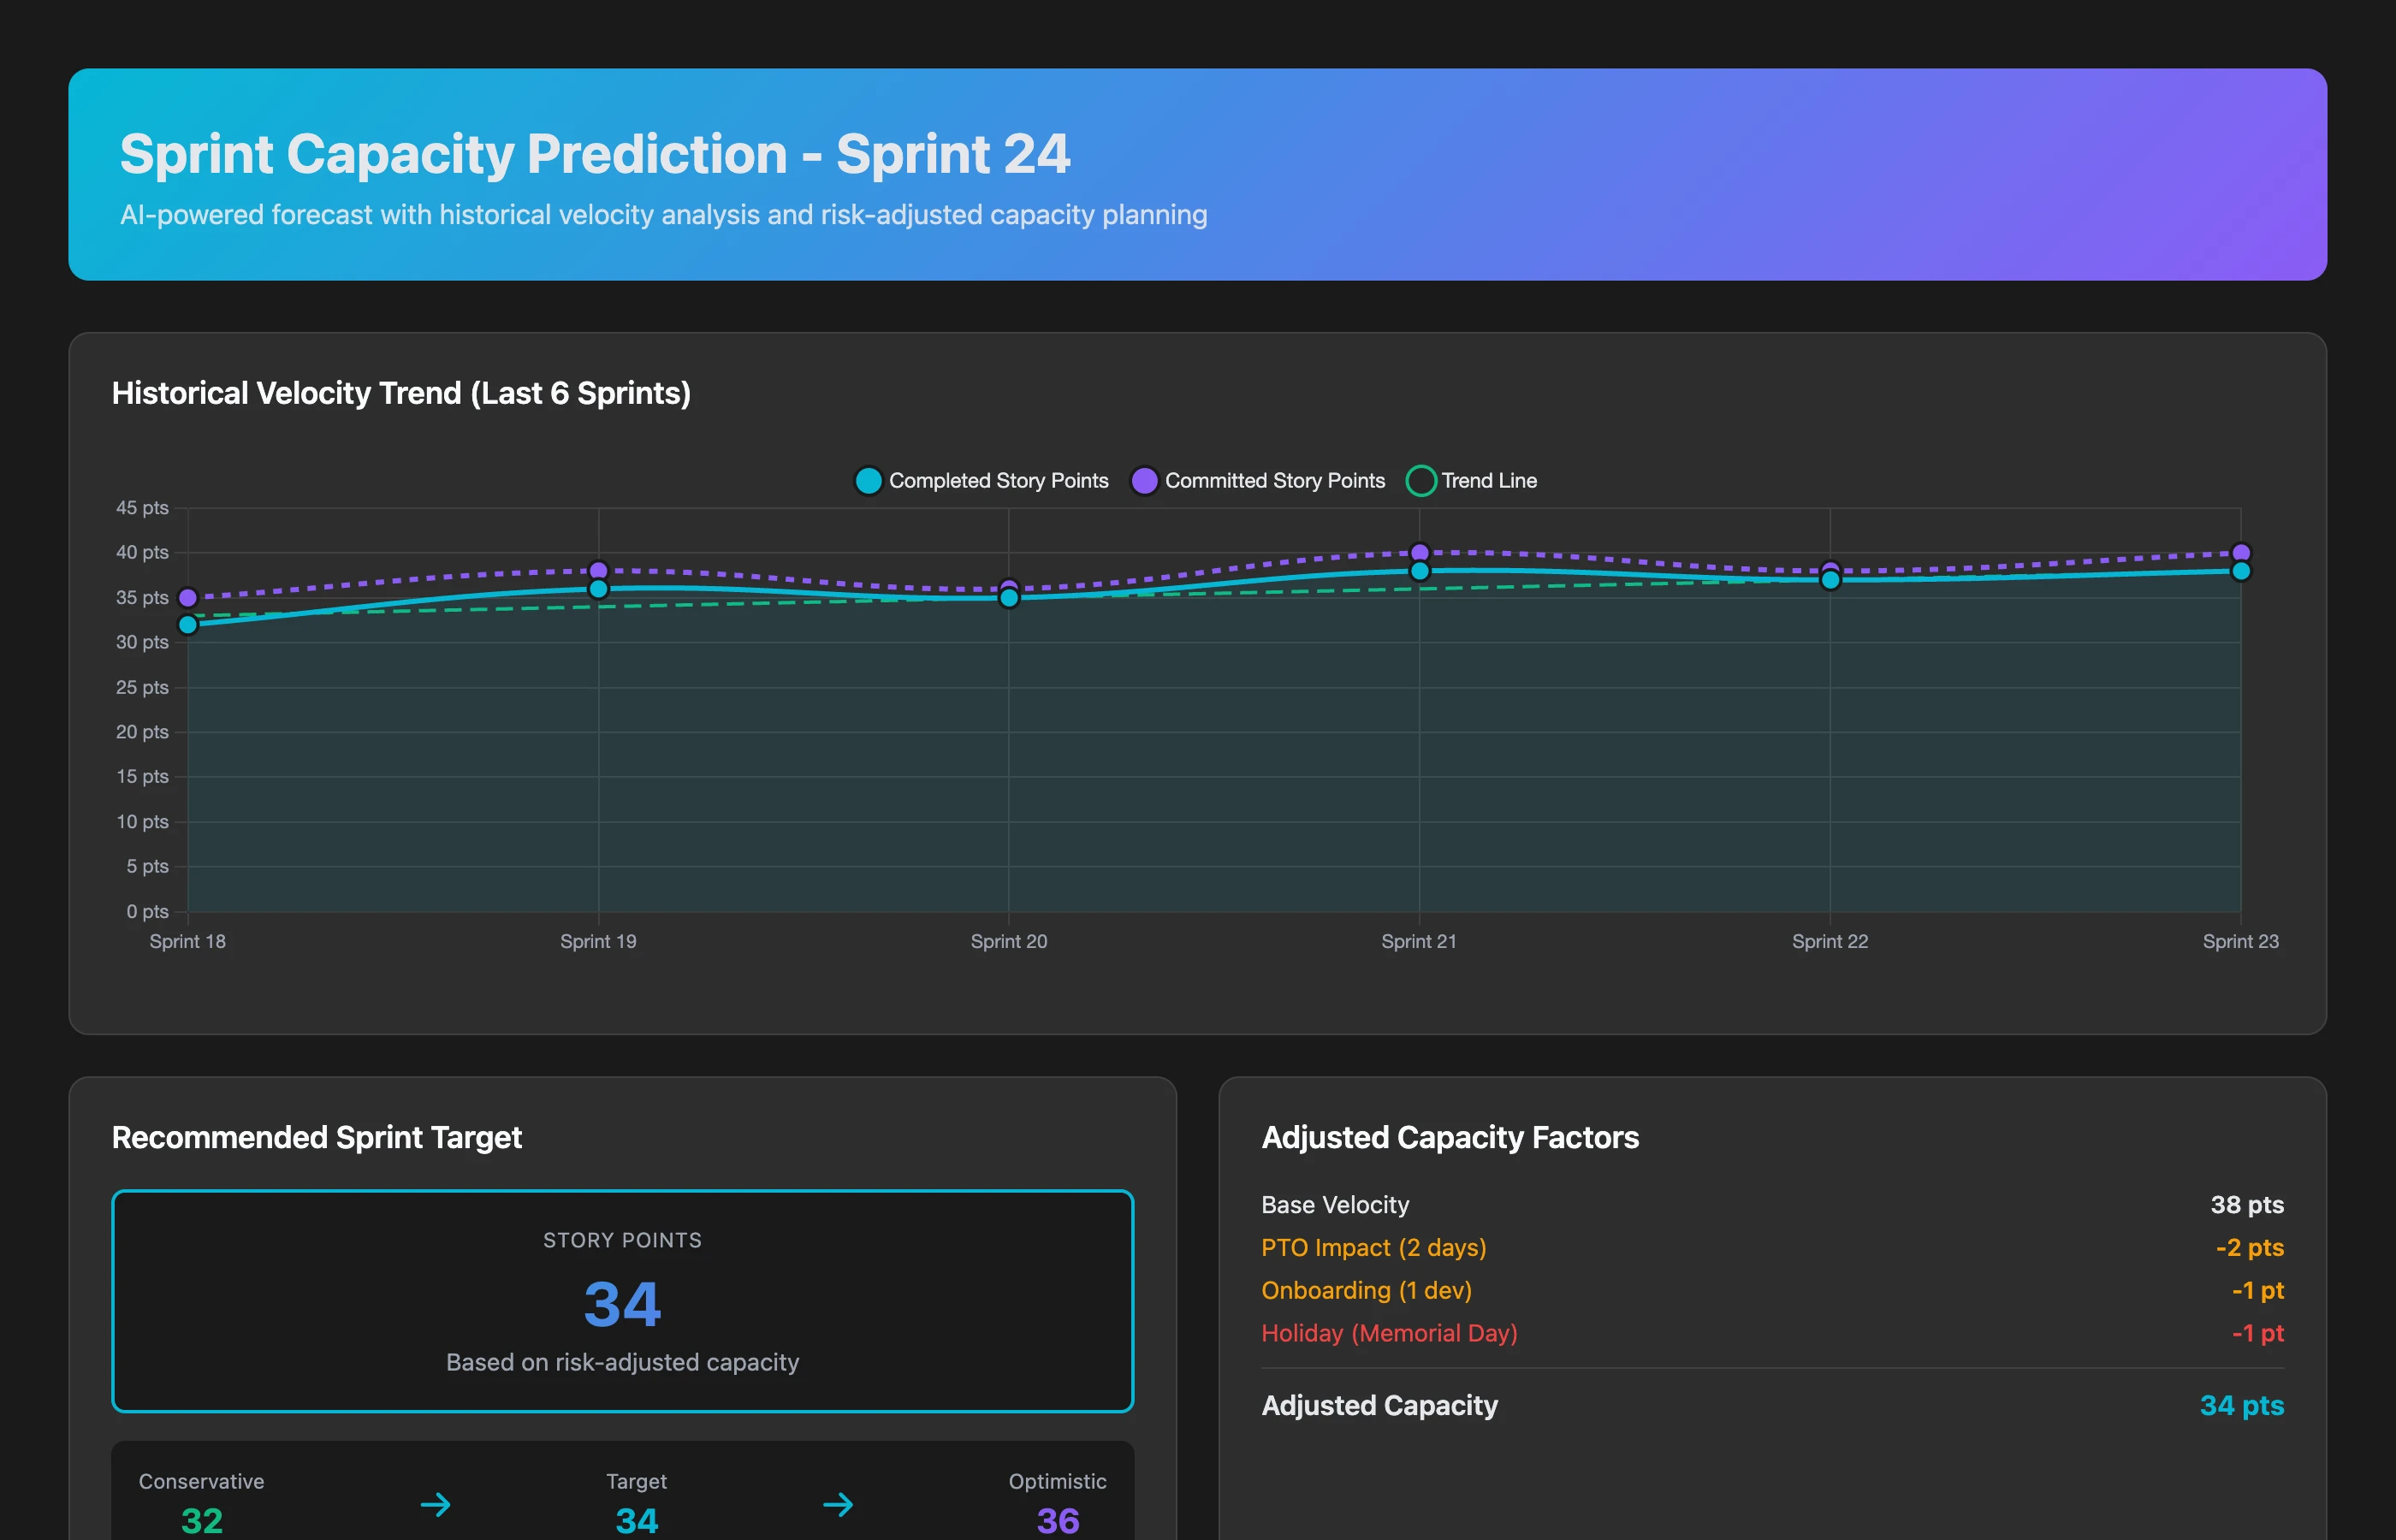
Sprint Capacity Prediction
Based on our team's historical velocity, current work in progress, upcoming holidays, and planned meetings, what's our realistic capacity for the next sprint? Factor in that we're onboarding a new engineer and Sarah is on vacation for 1 week.
The output:
- Historical velocity: 42 ± 8 points (3-sprint average)
- Adjusted capacity: 32-36 points (76% of normal)
- Sarah's PTO: -6 points
- New engineer ramp: -3 points
- Holiday Monday: -1 point
- Recommendation: Commit to 32 points with medium confidence, 28 points with high confidence
- Risk factors: If more than 1 person takes unplanned leave, capacity drops to 24-26 points
You plan with reality, not optimism.
Dependency Detection: See the Cascade Before It Hits
Before you commit to a timeline, understand the full scope:
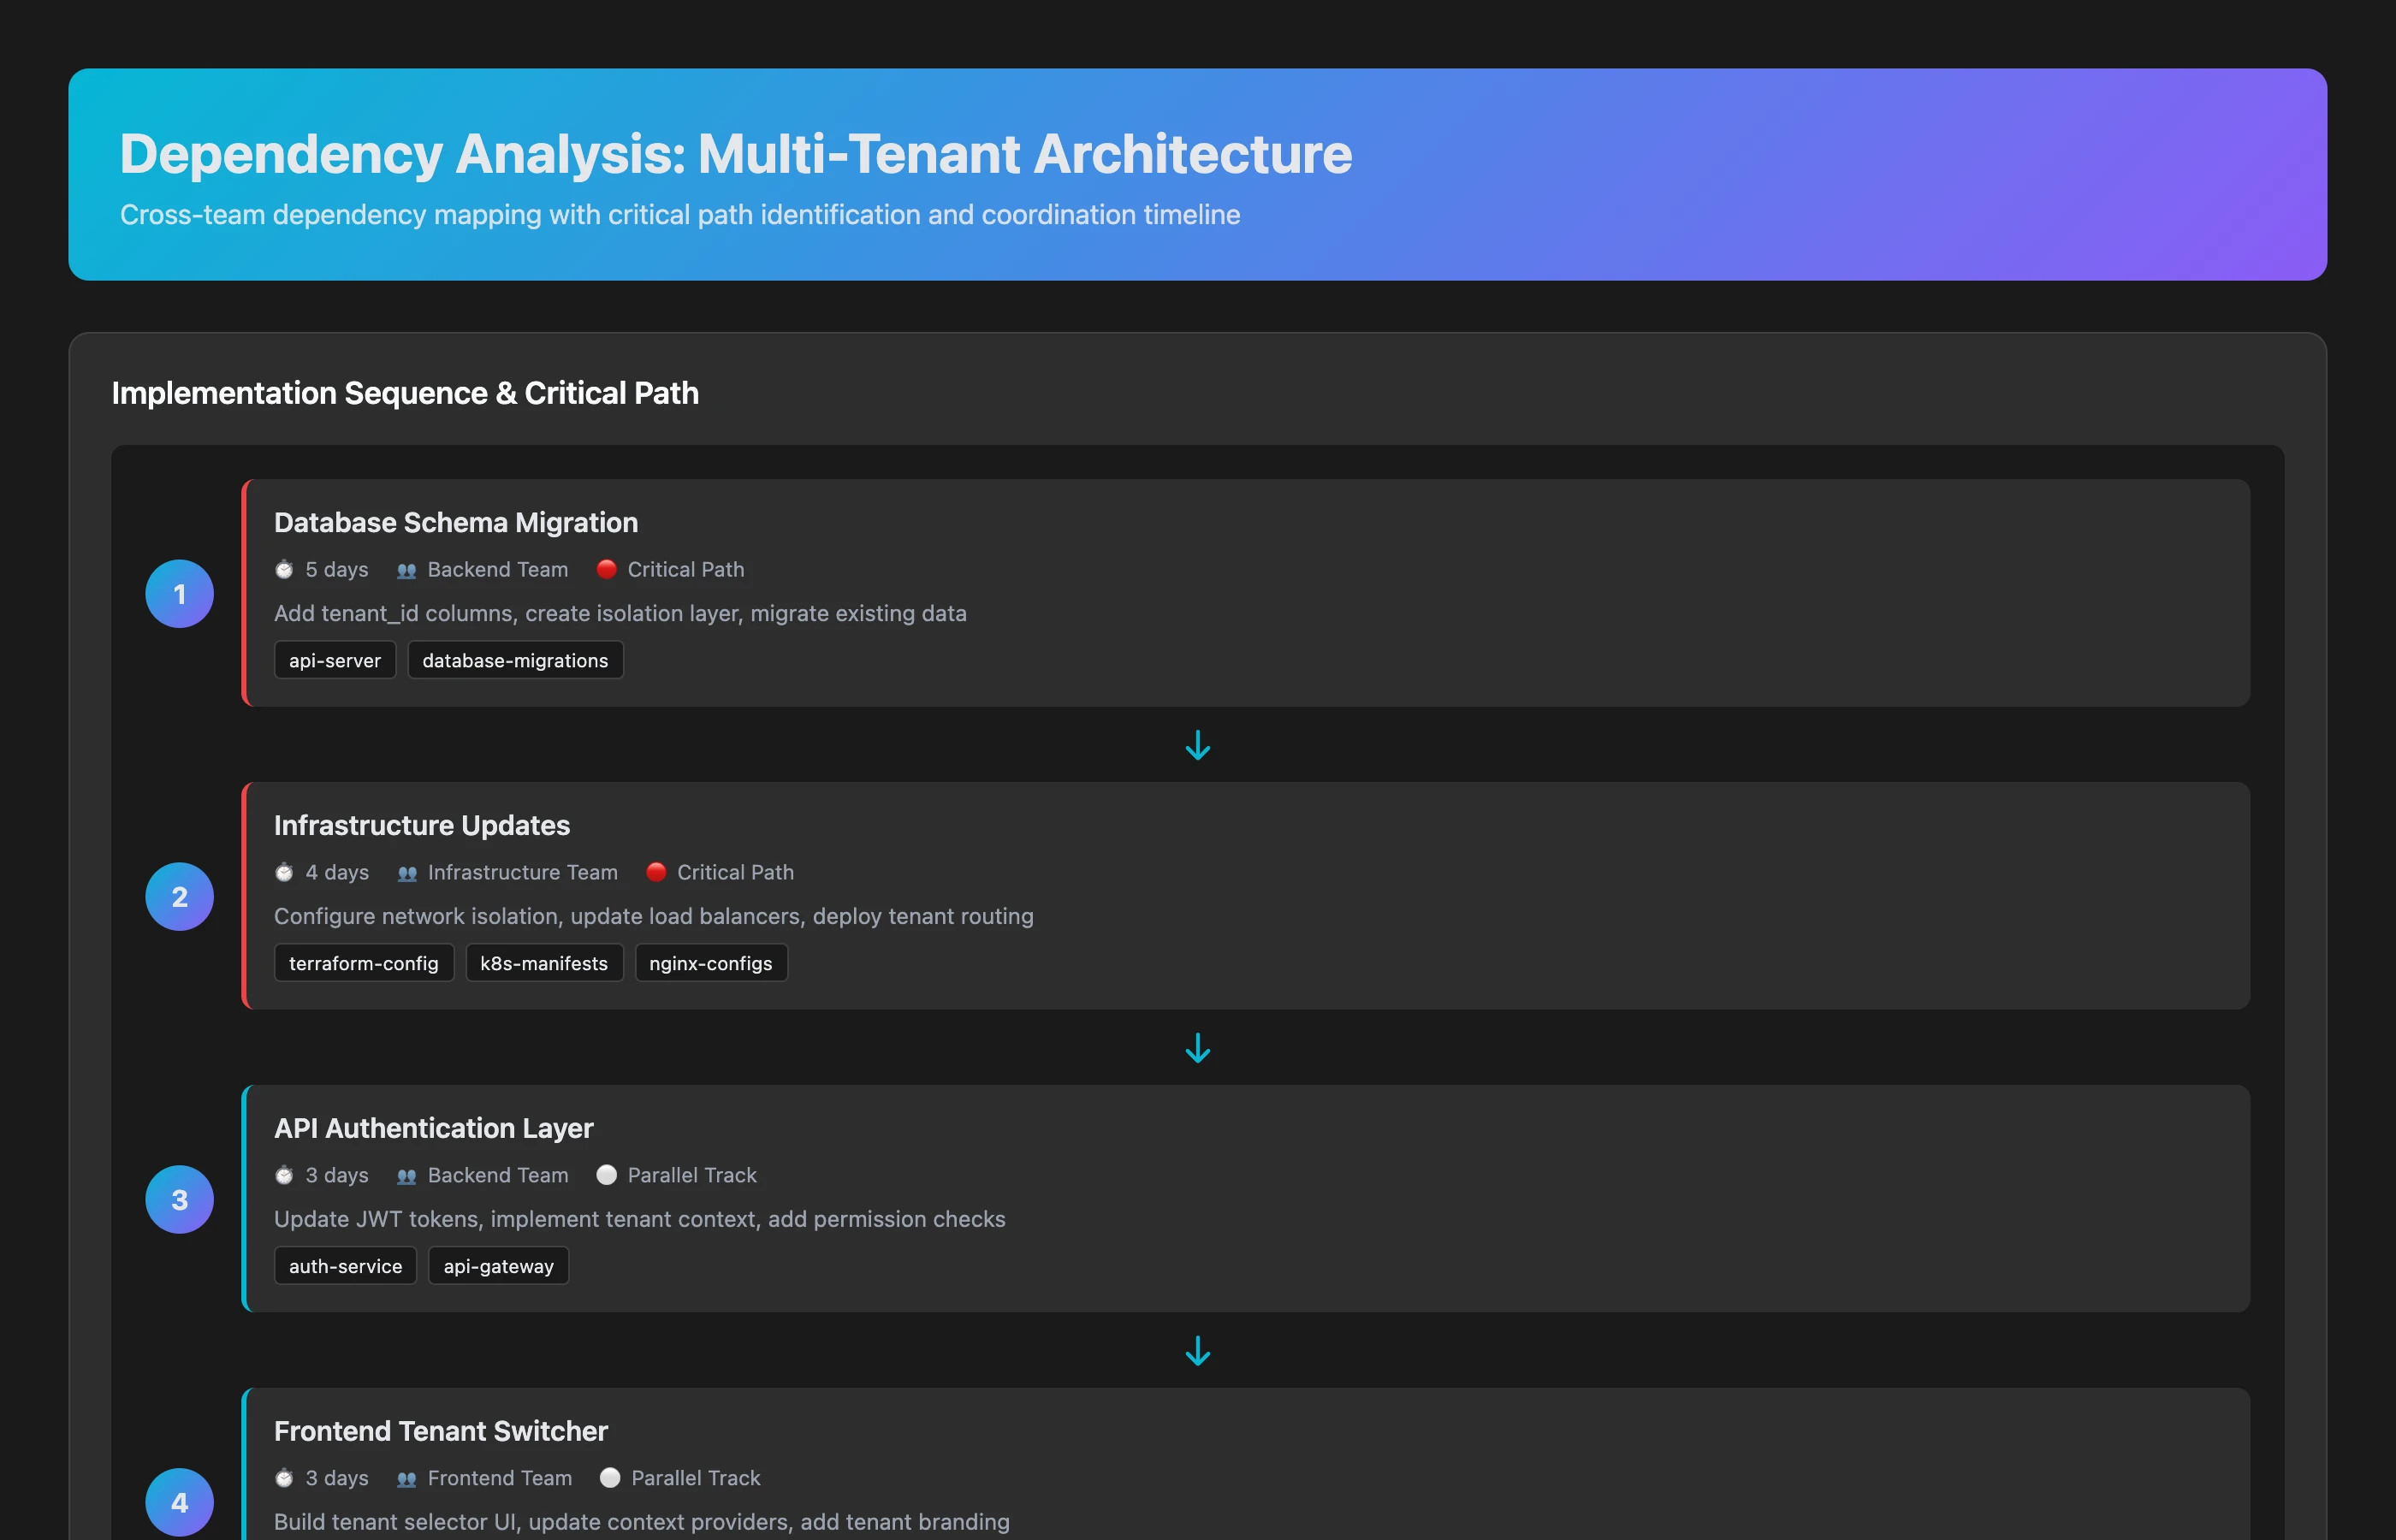
Cross-Team Dependency Analysis
We're planning the new multi-tenant architecture feature (JIRA-5432). What teams, repos, and dependencies are involved? What's the critical path and estimated duration including coordination overhead?
The analysis reveals:
- 5 repositories affected (auth-service, api-gateway, tenant-manager, frontend-app, analytics-pipeline)
- 4 teams involved (Backend, Infrastructure, Frontend, Data)
- Critical path:
- Infrastructure: Multi-tenant DB schema (2 weeks)
- Backend: Auth service updates (1 week, depends on #1)
- Backend: API changes (2 weeks, depends on #2)
- Frontend: UI updates (1.5 weeks, depends on #3)
- Data: Analytics updates (1 week, parallel with #4)
- Estimated duration: 6.5 weeks on critical path + 1 week coordination/testing = 7.5-8 weeks
- Risk: If auth service changes require security review (historical: 30% probability), add 1-2 weeks
You see the full picture before saying "yes."
Resource Balance: Who's Overloaded, Who Can Help
Get real-time visibility into actual workload:
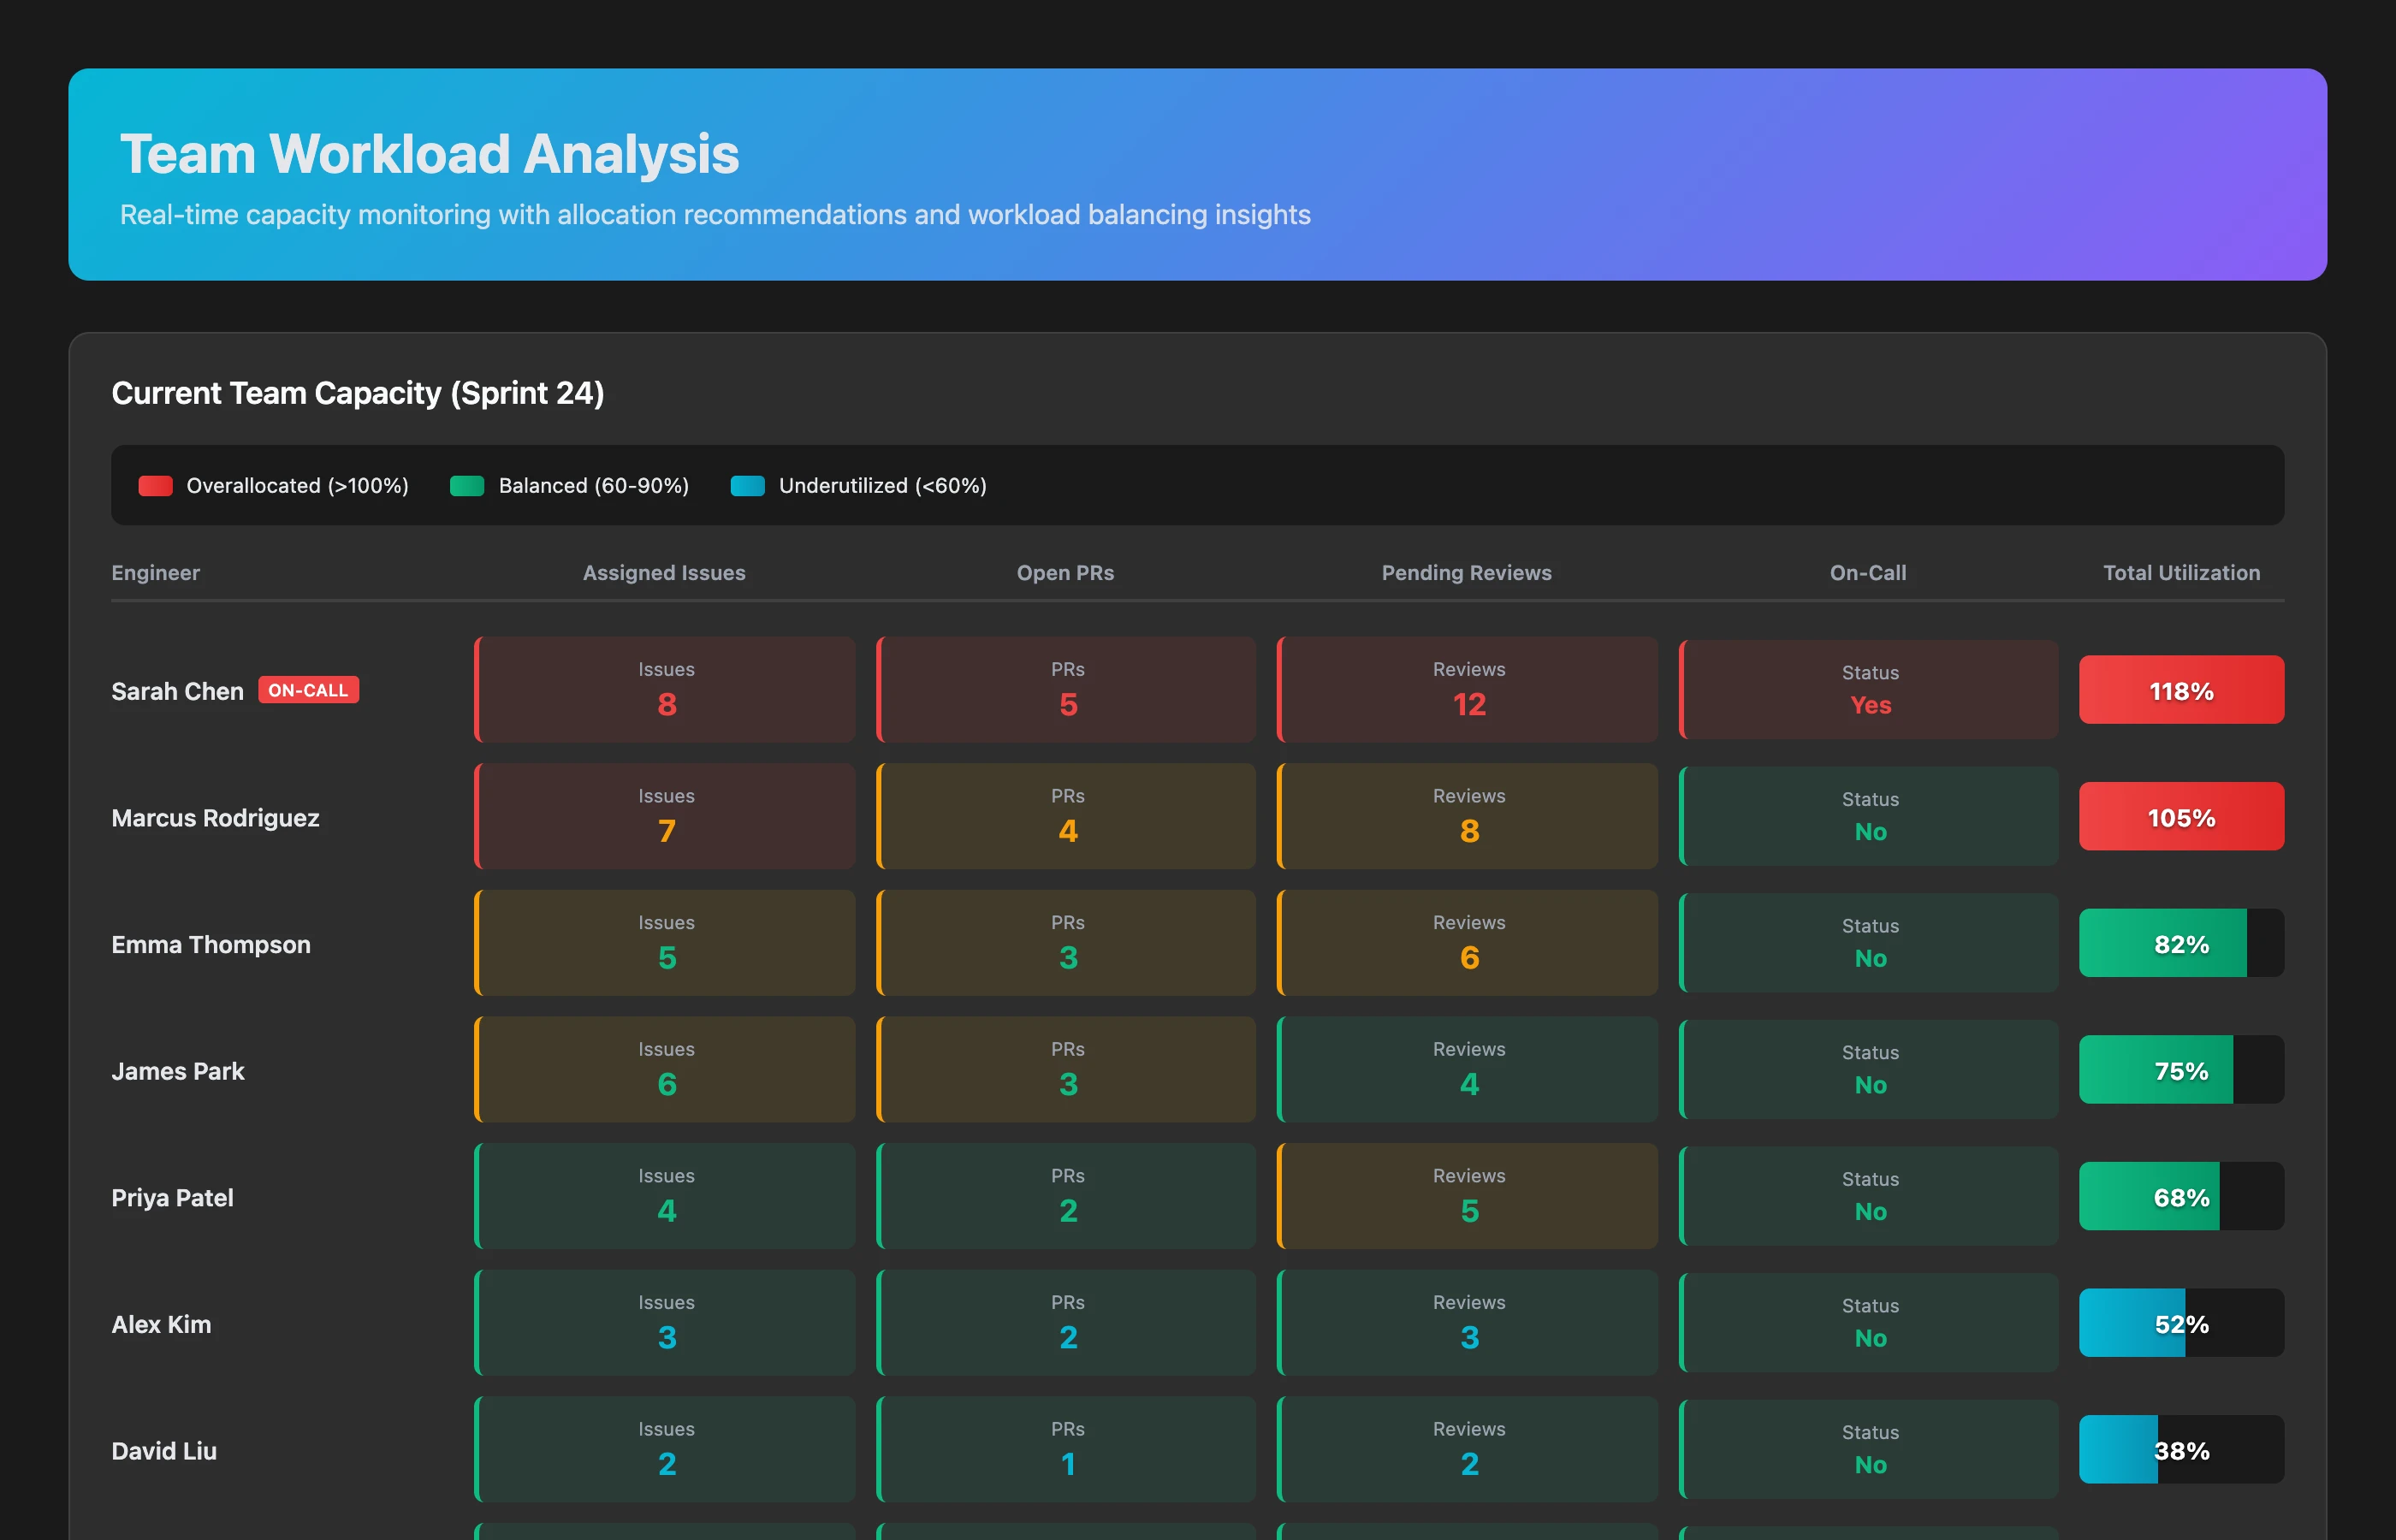
Team Workload Analysis
Show me each engineer's current workload across all projects, including open PRs, assigned issues, review requests, and on-call duties. Highlight overallocation and idle capacity.
The dashboard shows:
- Sarah: 145% allocated (3 active issues, 7 PRs in review, on-call this week, mentoring junior) → Overloaded
- Mike: 88% allocated (2 active issues, 4 PRs open, 2 reviews pending) → Balanced
- Emma: 45% allocated (1 issue active, 1 PR open, finished early) → Available for more work
- New hire (Chris): 30% allocated (ramping up, pairing with Mike) → Learning mode
Recommended actions:
- Reassign 2 of Sarah's review requests to Mike and Emma
- Remove Sarah from on-call rotation this week
- Assign one of Sarah's issues to Emma (similar context)
- Keep Chris's load light for 2 more weeks
You manage people's time, not just ticket assignments.
Technical Debt Quantification: Making the Invisible Visible
Translate engineering concerns into business impact:
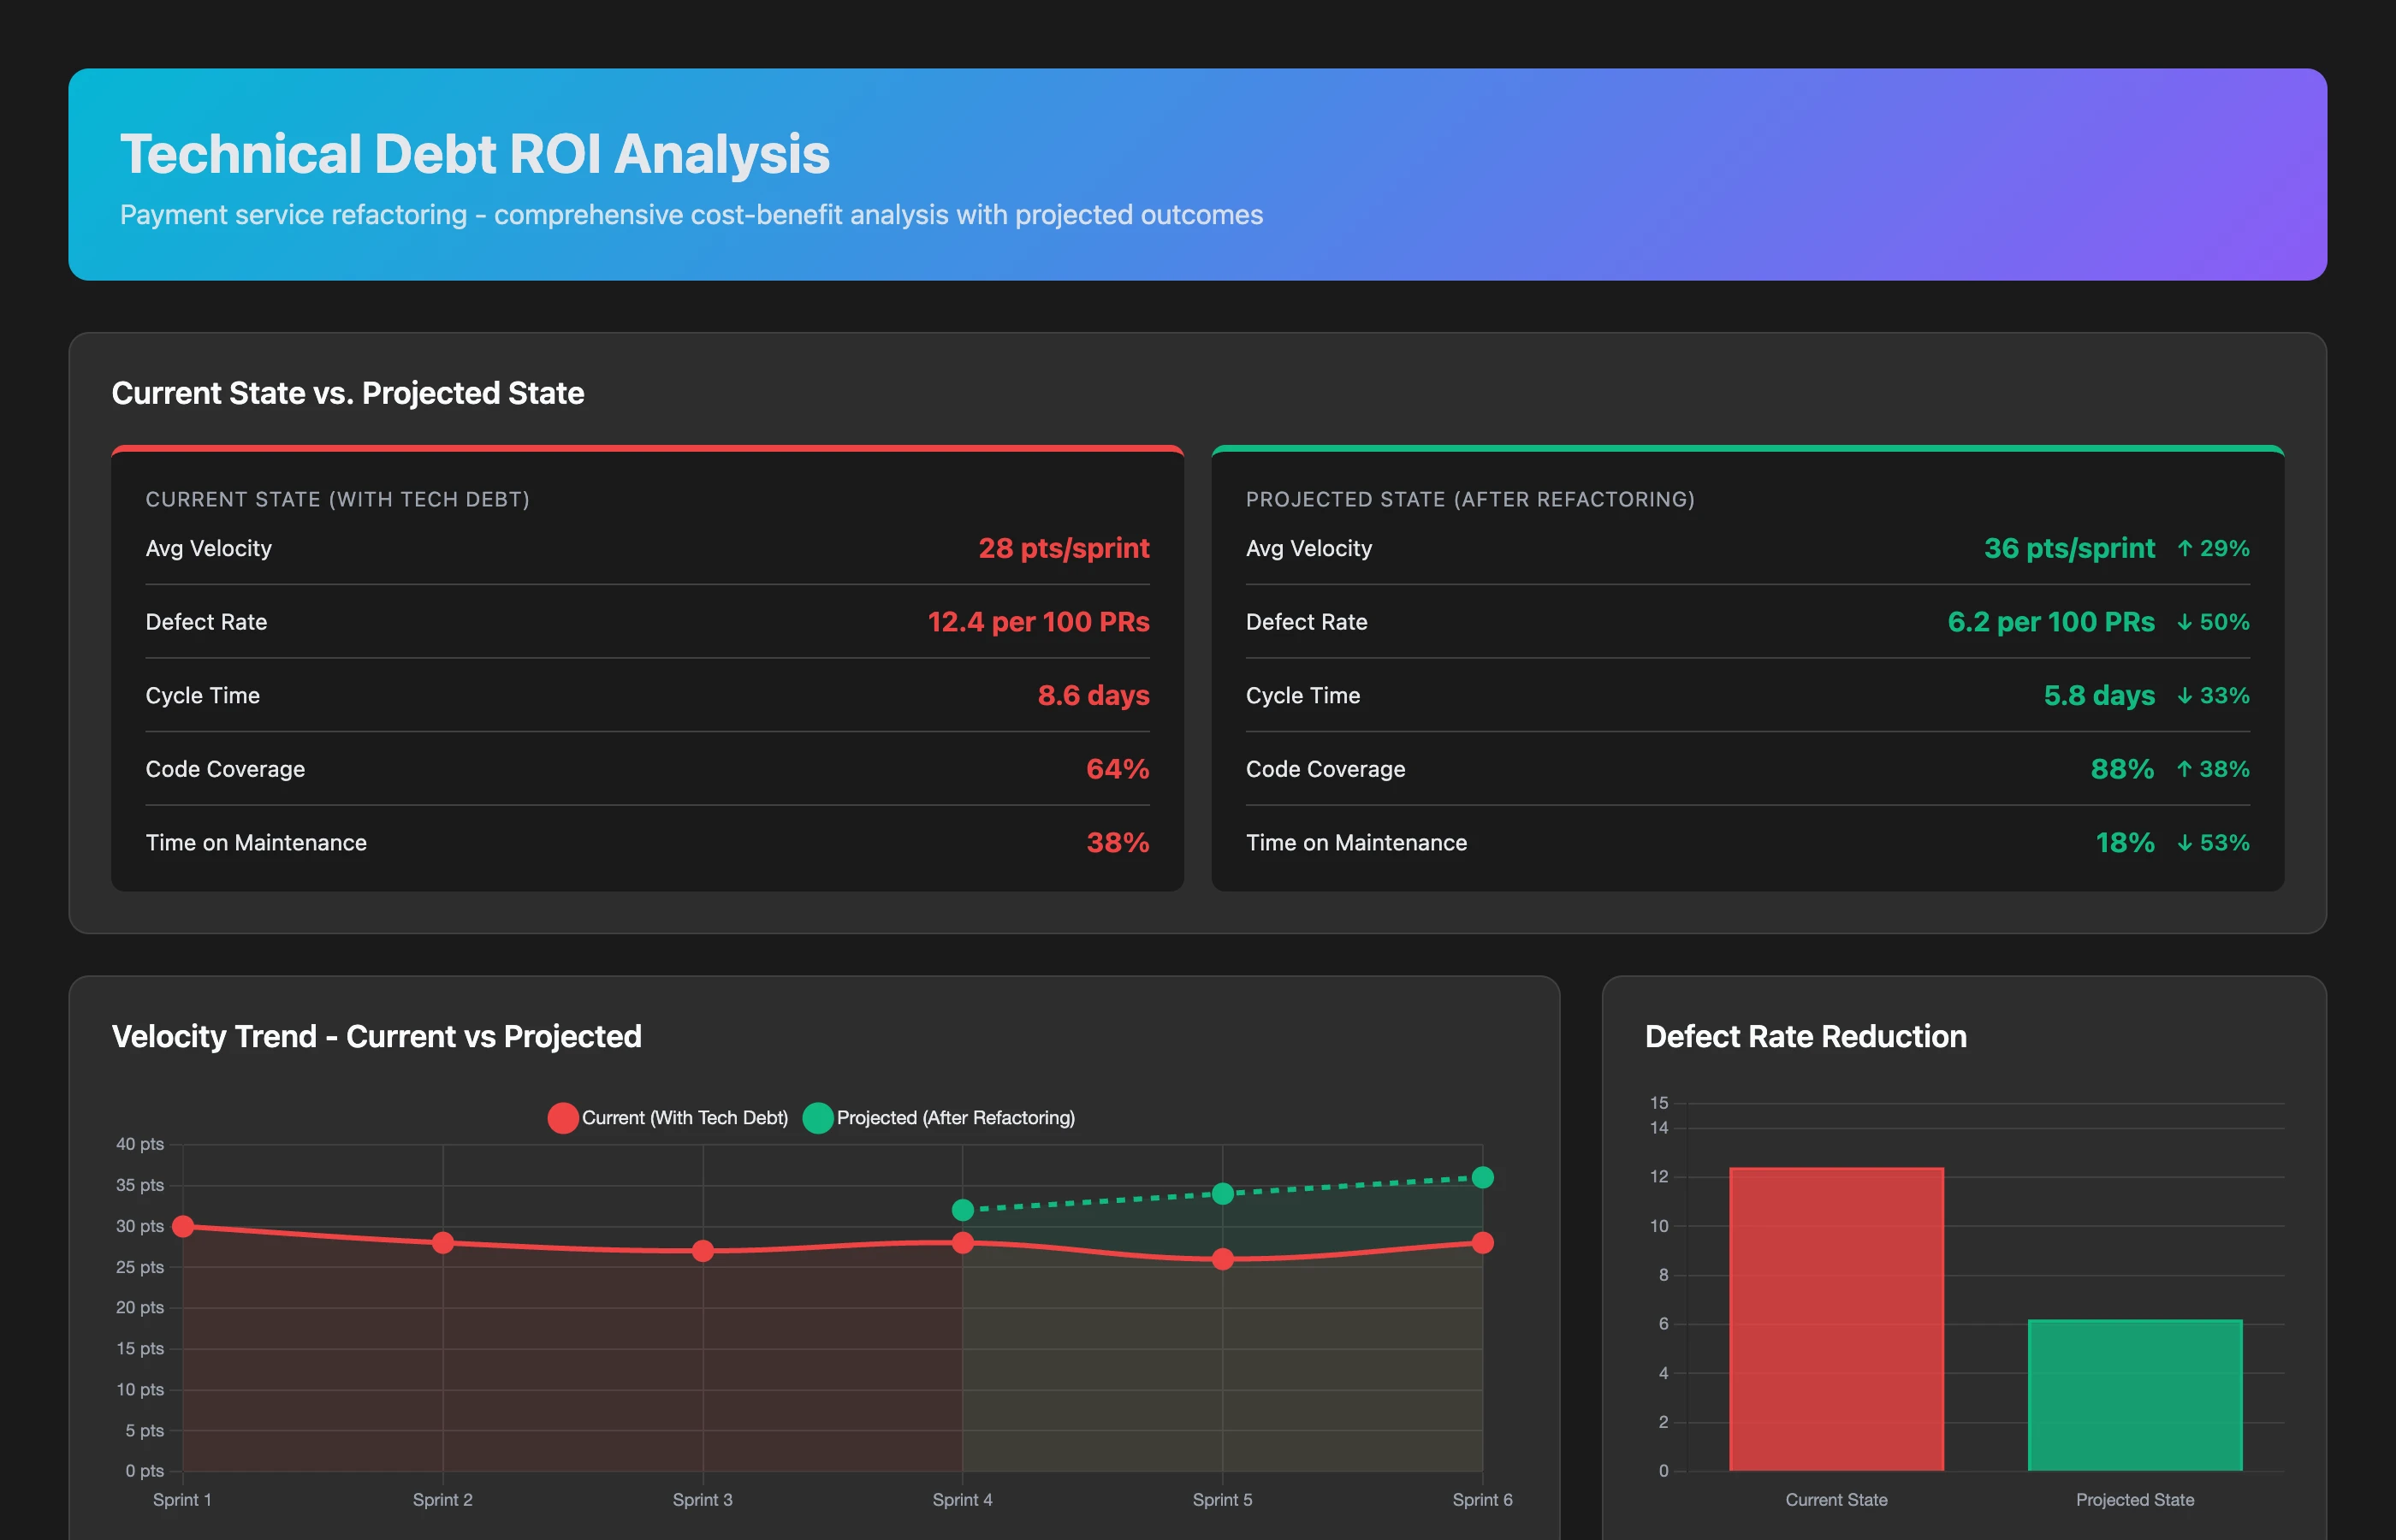
Technical Debt Impact Analysis
Our payment service has accumulated technical debt. Quantify the current impact on velocity, defect rates, and cycle time. What's the ROI of a 3-week refactoring effort?
The analysis:
Current impact (last 8 weeks vs. baseline):
- Velocity: -18% (42 points/sprint → 34 points/sprint)
- Defect rate: +67% (3 bugs/sprint → 5 bugs/sprint)
- Cycle time: +35% (4.2 days → 5.7 days)
- Team sentiment: 3 engineers mentioned "payment code is scary" in retrospectives
Projected improvement (3-week refactoring investment):
- Velocity recovery: +12 points/sprint (back to ~38-40 points)
- Defect rate reduction: -40% (5 bugs → 3 bugs)
- Cycle time reduction: -25% (5.7 days → 4.3 days)
- Maintenance time saved: ~6 hours/week
ROI calculation:
- Investment: 3 weeks × 2 engineers = 6 engineer-weeks
- Payback: ~8 weeks (recovered velocity + reduced bug fixes)
- 12-month ROI: +42% (net gain of 25 engineer-weeks of productive capacity)
You present this to business. Refactoring gets prioritized.
Planning Accuracy: Learn from History
Understand why estimates miss and improve future predictions:
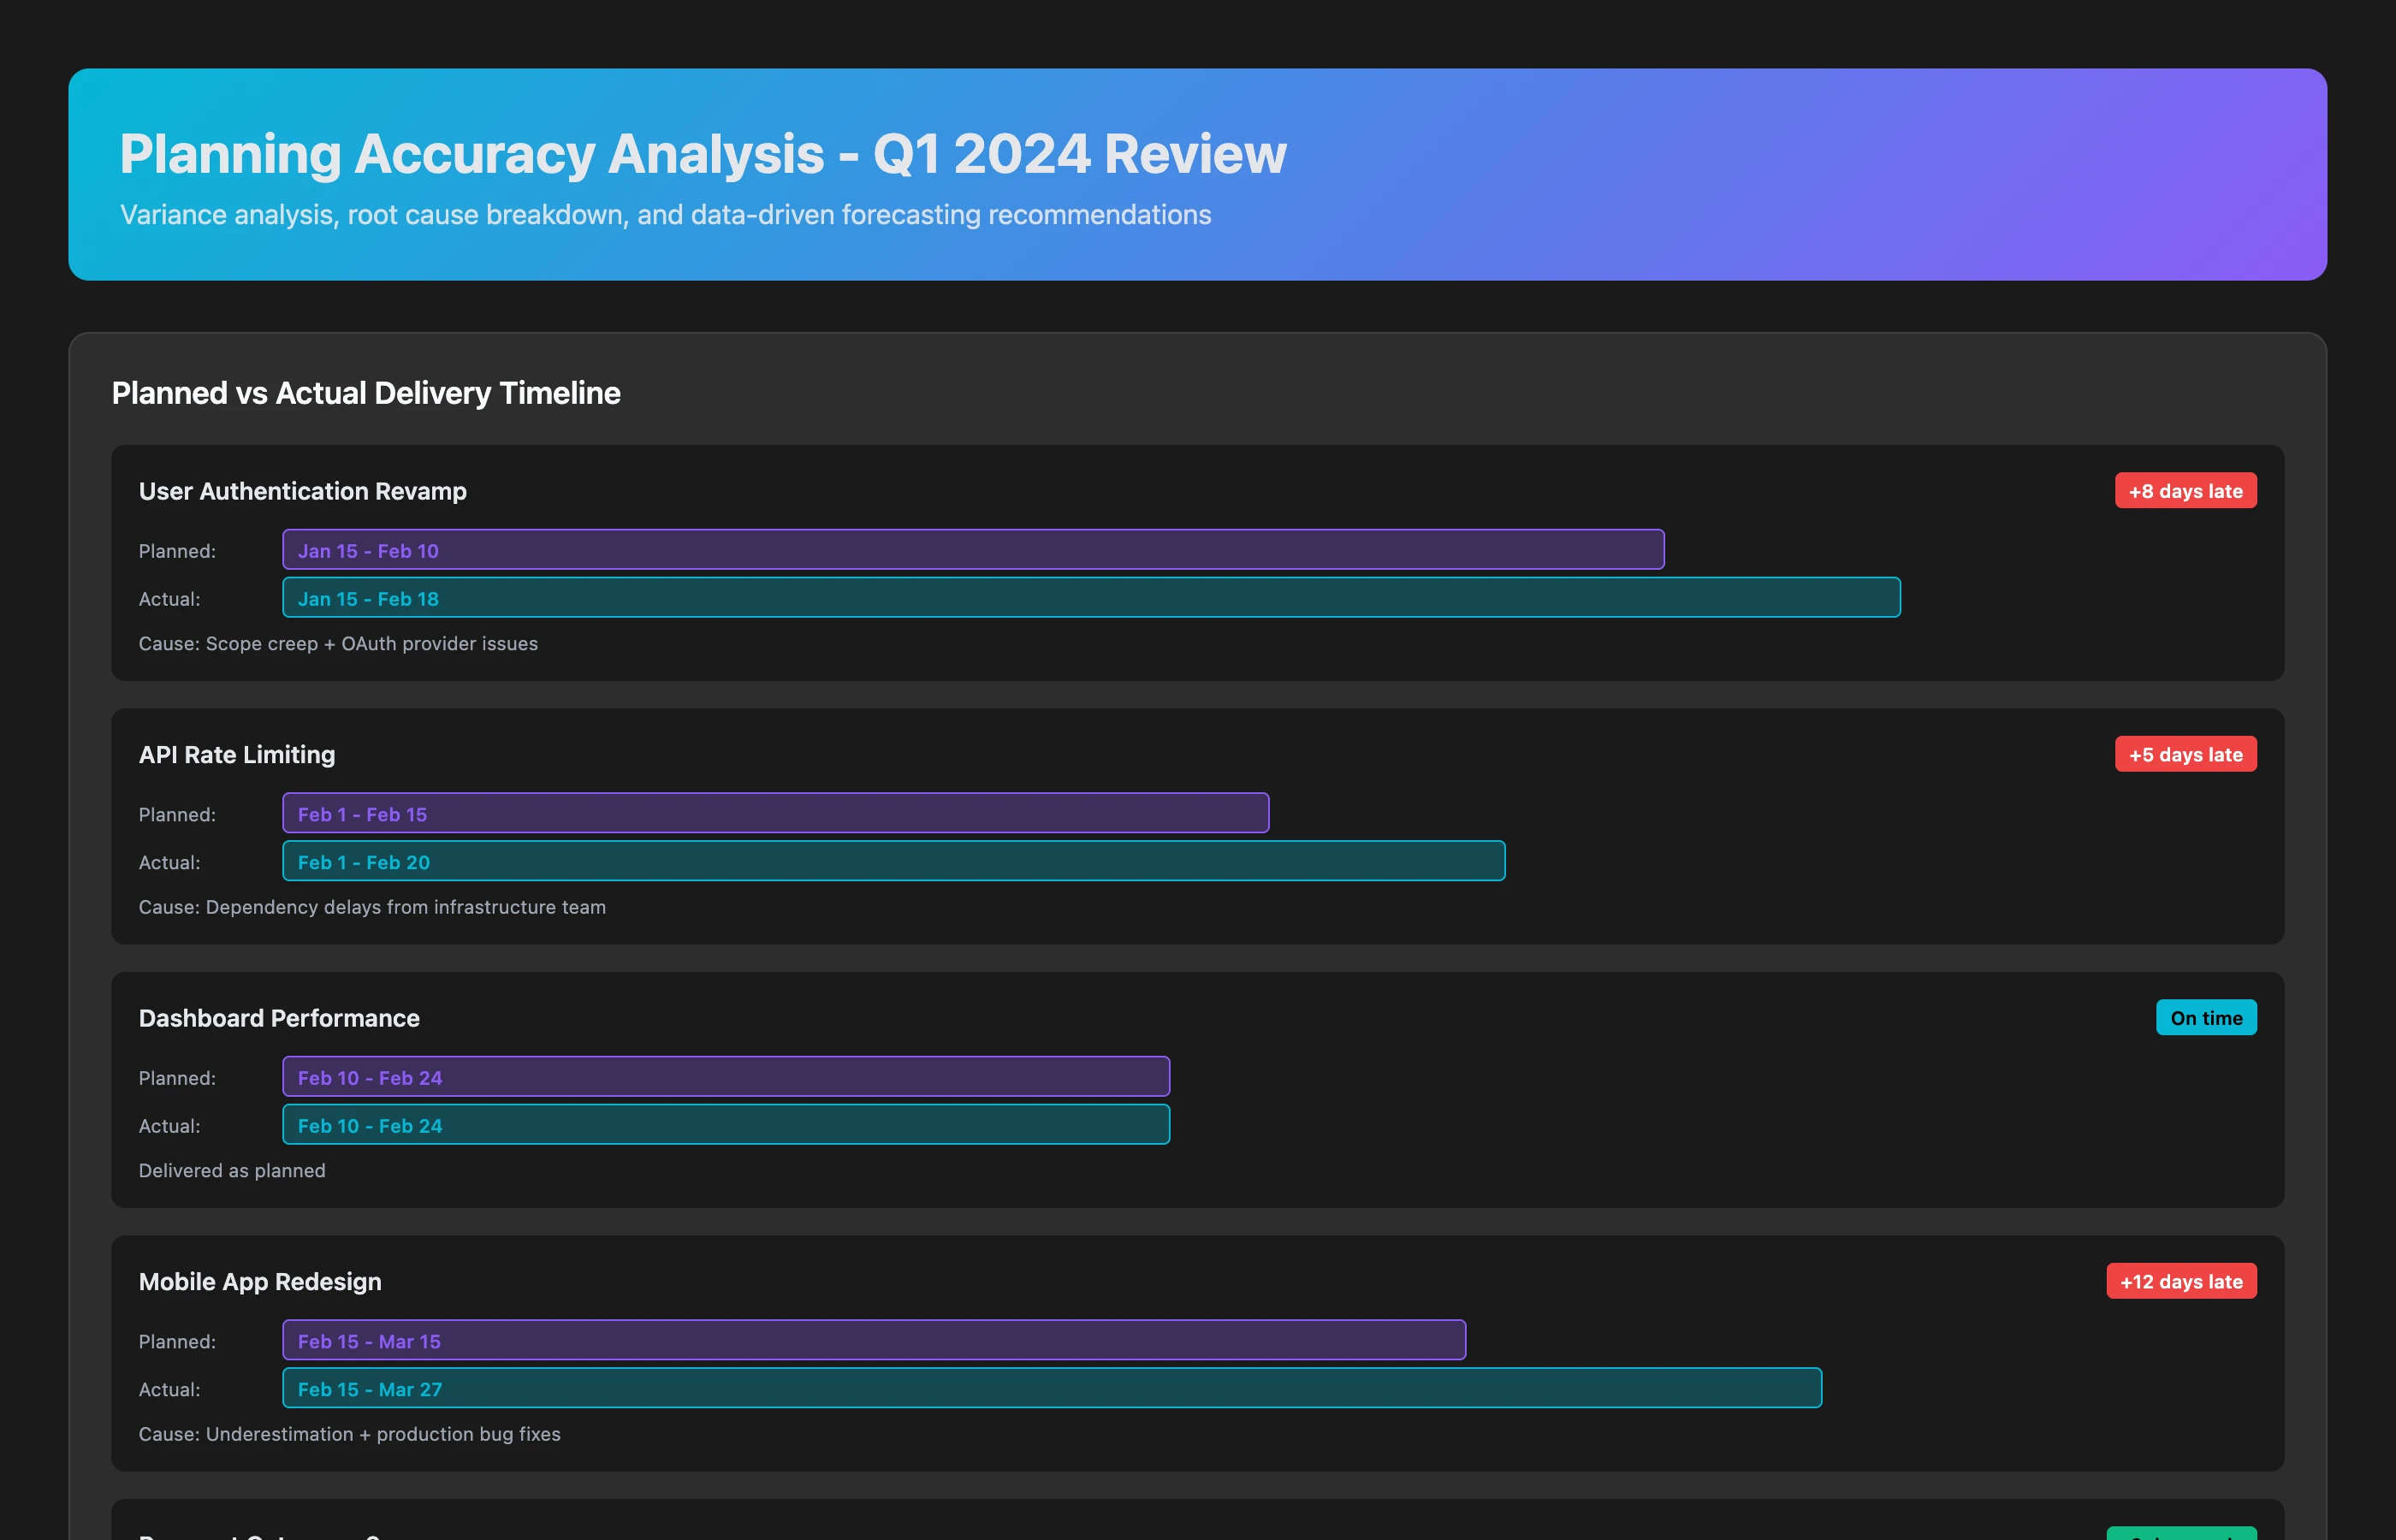
Estimate Accuracy Post-Mortem
Compare our Q1 roadmap commitments to actual delivery. What patterns explain the variance? How should we adjust Q2 planning?
The findings:
Q1 Performance:
- Planned: 8 features, 22 weeks total effort
- Actual: 6 features delivered, 31 weeks total effort (41% overrun)
Variance breakdown:
- Scope creep (35%): Original specs expanded mid-development
- Example: "Simple" admin dashboard became full analytics platform
- Dependency delays (28%): Blocked waiting on other teams
- Example: Mobile feature waiting 3 weeks for API team
- Underestimation (22%): Tasks genuinely more complex than expected
- Example: Data migration "1 week" took 4 weeks
- Production issues (15%): Unplanned firefighting
- Example: Security patch consumed 1.5 weeks
Q2 Recommendations:
- Add 30% buffer for cross-team dependencies (historical average delay)
- Lock requirements at sprint start (implement change control process)
- For data migrations, multiply initial estimate by 3× (historical pattern)
- Reserve 15% capacity for unplanned production work (happens every quarter)
- When engineering says "1 week," plan for 1.5 weeks (historical accuracy: 67%)
Your Q2 roadmap is grounded in reality.
Cross-Team Coordination: Automatic Alerts
Stop chasing people, let the system notify them:
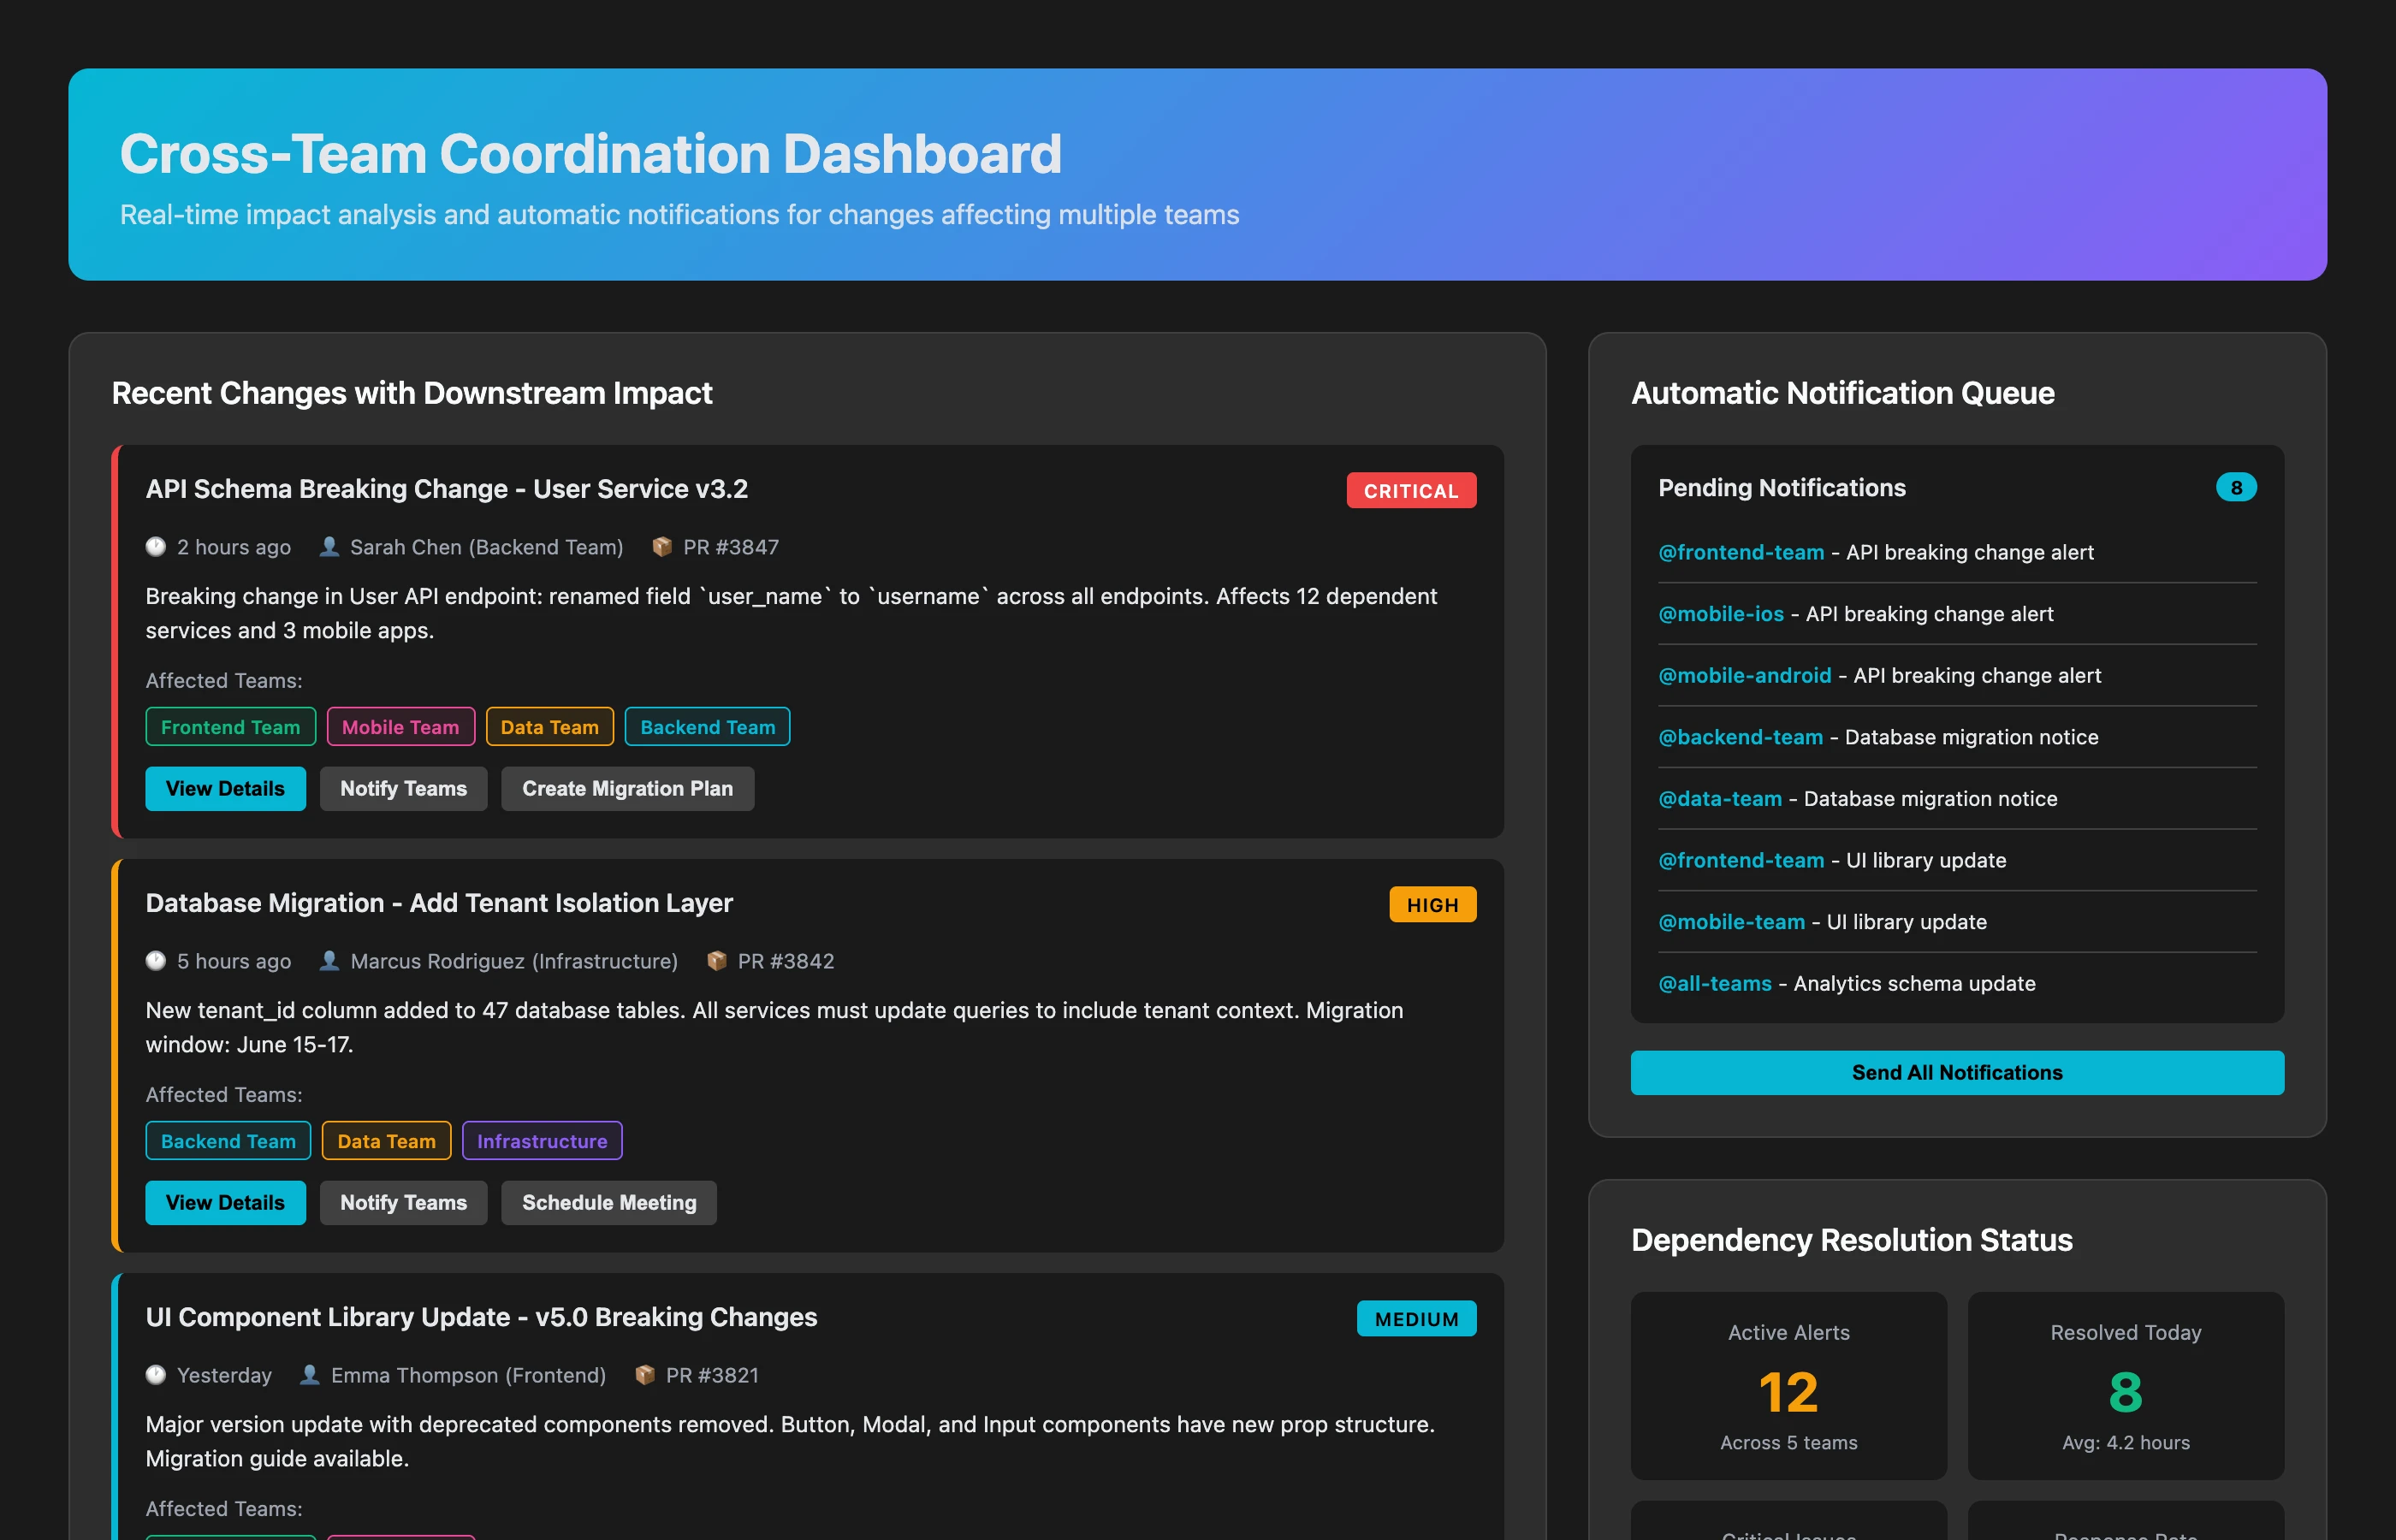
Cross-Team Impact Detection
Monitor all PR merges and issue status changes. When one team's work affects another team's dependencies, automatically alert the affected team with impact analysis and recommended actions.
Example alert (automatically sent to Mobile team Slack):
🚨 Dependency Impact Alert
Backend team just merged PR #892: "Refactor user authentication endpoints"
Impact on your work:
- Your PR #445 (Login screen) uses
/auth/login endpoint → Endpoint URL changed to /v2/auth/login - Your issue MOB-234 (Profile sync) depends on
user.profile schema → Schema updated (2 fields renamed)
Action required:
- Update API calls in
LoginService.swift (estimated: 30 minutes) - Update profile mapping in
UserModel.swift (estimated: 15 minutes) - Test changes with new API (staging environment updated)
Documentation: API Migration Guide
Contact: @backend-team in #api-changes
No more "Nobody told us the API changed!" surprises.
Success Measurement: Did That Process Change Work?
Measure the impact of process improvements with statistical rigor:
Process Change Impact Analysis
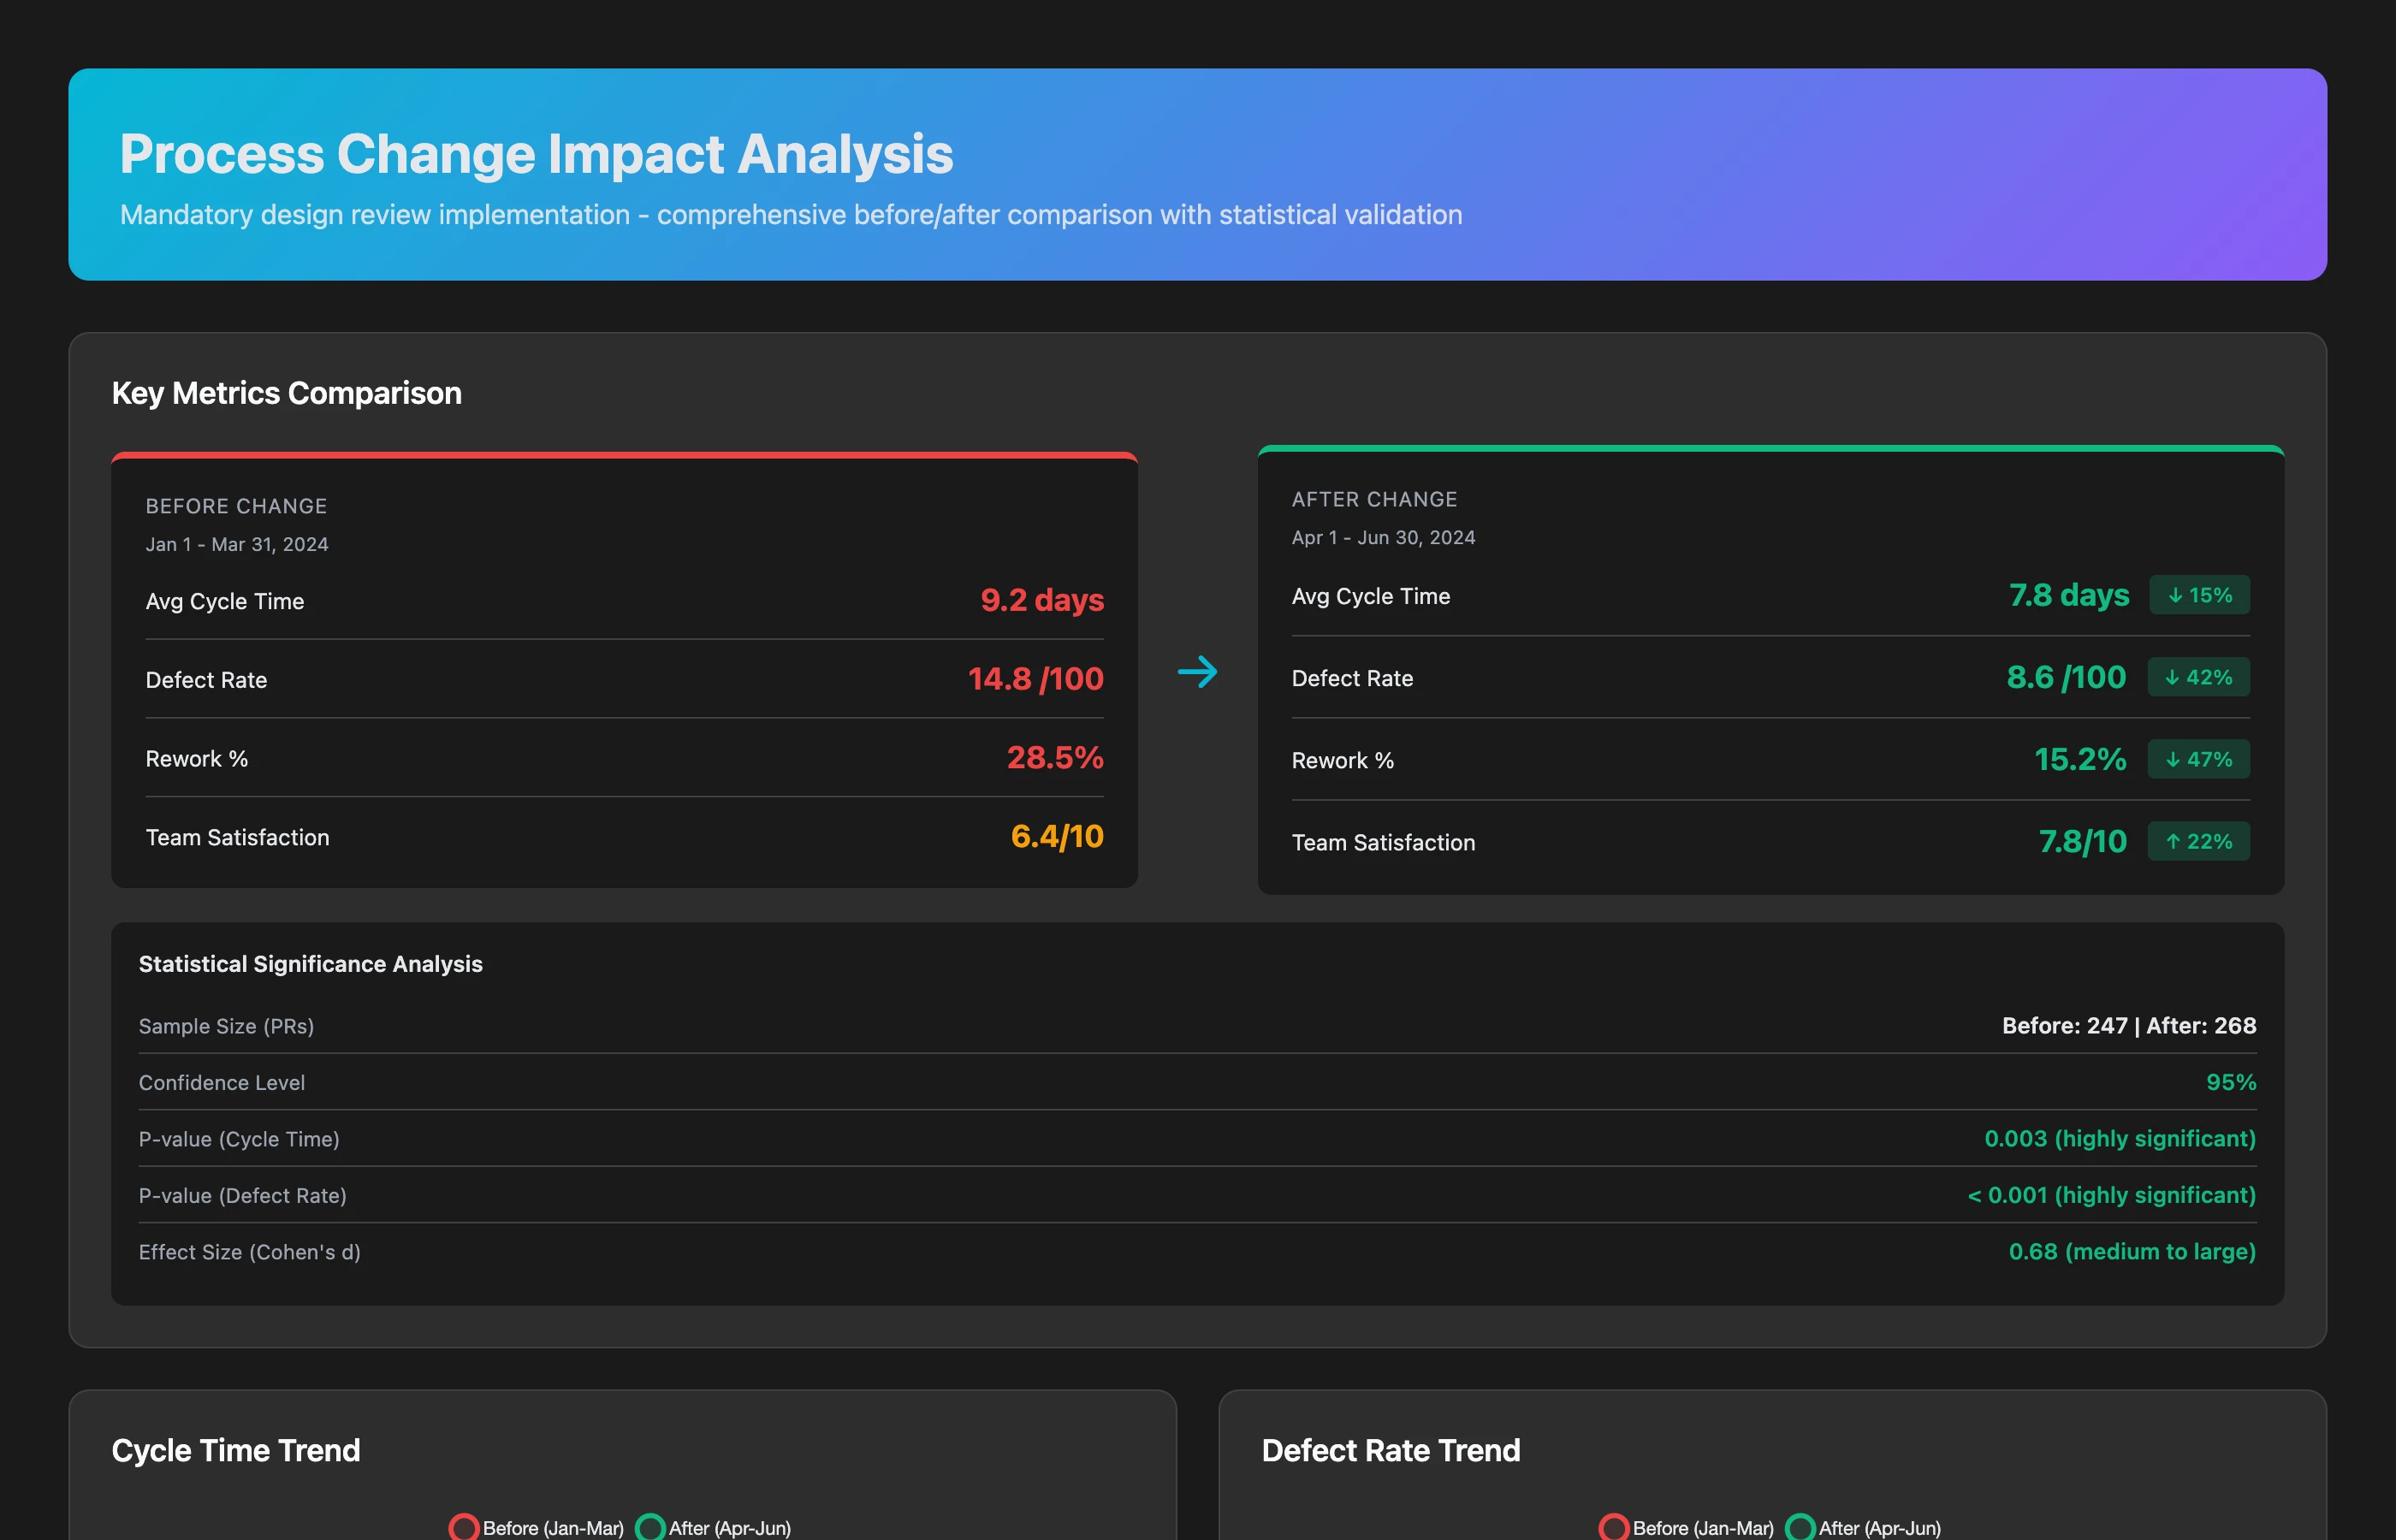
We implemented mandatory design reviews 8 weeks ago. Compare metrics before and after: cycle time, defect rates, rework percentage, and team satisfaction. Is the process improvement worth the added time?
The results (before vs. after, 12-week comparison):
Time investment:
- Average design review duration: 2.3 hours/feature
- Total time invested: 47 hours over 8 weeks
- Perceived negative: "Slows us down" (3 engineers mentioned in retrospectives)
Quality improvements:
- Defect rate: 4.8 bugs/sprint → 2.1 bugs/sprint (-56%, p < 0.01, statistically significant)
- Rework percentage: 23% of PRs required major changes → 9% (-61%, p < 0.01)
- Production incidents: 2.3/month → 0.8/month (-65%, p < 0.05)
Time savings (from avoided rework):
- Average rework time saved: 6.4 hours/feature
- Total time saved: 131 hours over 8 weeks
- Net time saved: 131 - 47 = 84 hours (equivalent to 2+ engineer-weeks)
Cycle time impact:
- Initial fear: Cycle time would increase
- Reality: Cycle time decreased from 6.2 days → 5.1 days (-18%)
- Why: Less rework, fewer late-stage changes, clearer implementation path
Team satisfaction:
- Retrospective sentiment analysis: +12% positive mentions
- Quotes: "Design reviews catch issues early," "Less stressful than discovering problems in PR review"
Verdict: Design reviews add upfront time but save significantly more time downstream, reduce defects, and improve team morale. Recommendation: Keep the process, consider expanding to all features (currently only applied to 60%).
You have proof, not opinions.
Implementation: Your First Week with Keypup MCP
Keypup MCP integrates with your existing stack—no migration, no disruption:
- Connect Jira/Linear/Azure DevOps: Read-only access to issues, sprints, and roadmaps
- Connect Trello/Asana/Notion: Import task lists and workflows
- Connect GitHub/GitLab/Bitbucket: Access repos, PRs, commits, and reviews
- Optional: Connect Slack/Teams: Enable automatic alerts and notifications
Setup takes 30-45 minutes. Your data remains in your tools—Keypup creates a unified view, not a new system to maintain.
Day 2-3: Baseline Your Current State
Run diagnostic queries to understand where you are:
Project Health Baseline
Analyze the last 12 weeks across all projects: velocity trends, cycle time patterns, defect rates, estimation accuracy, workload distribution, and technical debt accumulation. Create a baseline report.
You'll get a comprehensive health report showing:
- Which projects are healthy vs. struggling
- Where bottlenecks exist (review delays, testing gaps, deployment issues)
- Which teams are overloaded vs. underutilized
- How accurate your planning has been (and why it misses)
- Quantified technical debt by repository
This becomes your "before" snapshot for measuring improvement.
Day 4-5: Identify Quick Wins
Use MCP to surface actionable improvements:
Quick Win Opportunities
What are the top 5 high-impact, low-effort improvements we can make in the next 2 weeks to improve delivery predictability and team satisfaction?
Typical recommendations:
- Rebalance workload: Reassign 8 issues from overloaded engineers to available capacity (impact: +12% velocity, effort: 2 hours)
- Clear PR review backlog: 14 PRs waiting >48 hours for review—assign reviewers (impact: -18% cycle time, effort: 3 hours)
- Update stale issues: 23 issues unchanged in 30+ days—close or re-prioritize (impact: clearer backlog, effort: 1 hour)
- Fix broken builds: 3 repos have failing CI for 1+ weeks—block progress (impact: unblock 4 features, effort: 4 hours)
- Document known dependencies: 12 cross-team dependencies discovered but not documented—formalize them (impact: prevent future surprises, effort: 2 hours)
Total effort: ~12 hours. Impact: Meaningful improvement in 2 weeks.
Week 2+: Continuous Monitoring and Optimization
Integrate MCP queries into your regular rhythm:
Daily (5 minutes):
- Check project health dashboard for red flags
- Review overnight PR activity and blockers
- Scan workload balance for overallocation
Weekly (30 minutes):
- Sprint planning: Get capacity prediction and risk assessment
- Mid-sprint: Check velocity tracking vs. commitment
- Cross-team sync: Review dependency status and upcoming impacts
Monthly (2 hours):
- Planning accuracy review: Compare commitments to actuals
- Process improvement analysis: Measure impact of recent changes
- Technical debt review: Quantify accumulation and prioritize paydown
- Team health metrics: Workload trends, satisfaction signals
Quarterly (half day):
- Roadmap retrospective: Why did we miss/hit targets?
- Organizational patterns: Cross-team coordination effectiveness
- Tool effectiveness: Are processes helping or hurting?
- Strategic planning: Data-driven priority setting for next quarter
Measuring MCP's Impact on Your PM Effectiveness
After 8-12 weeks, run a comparison:
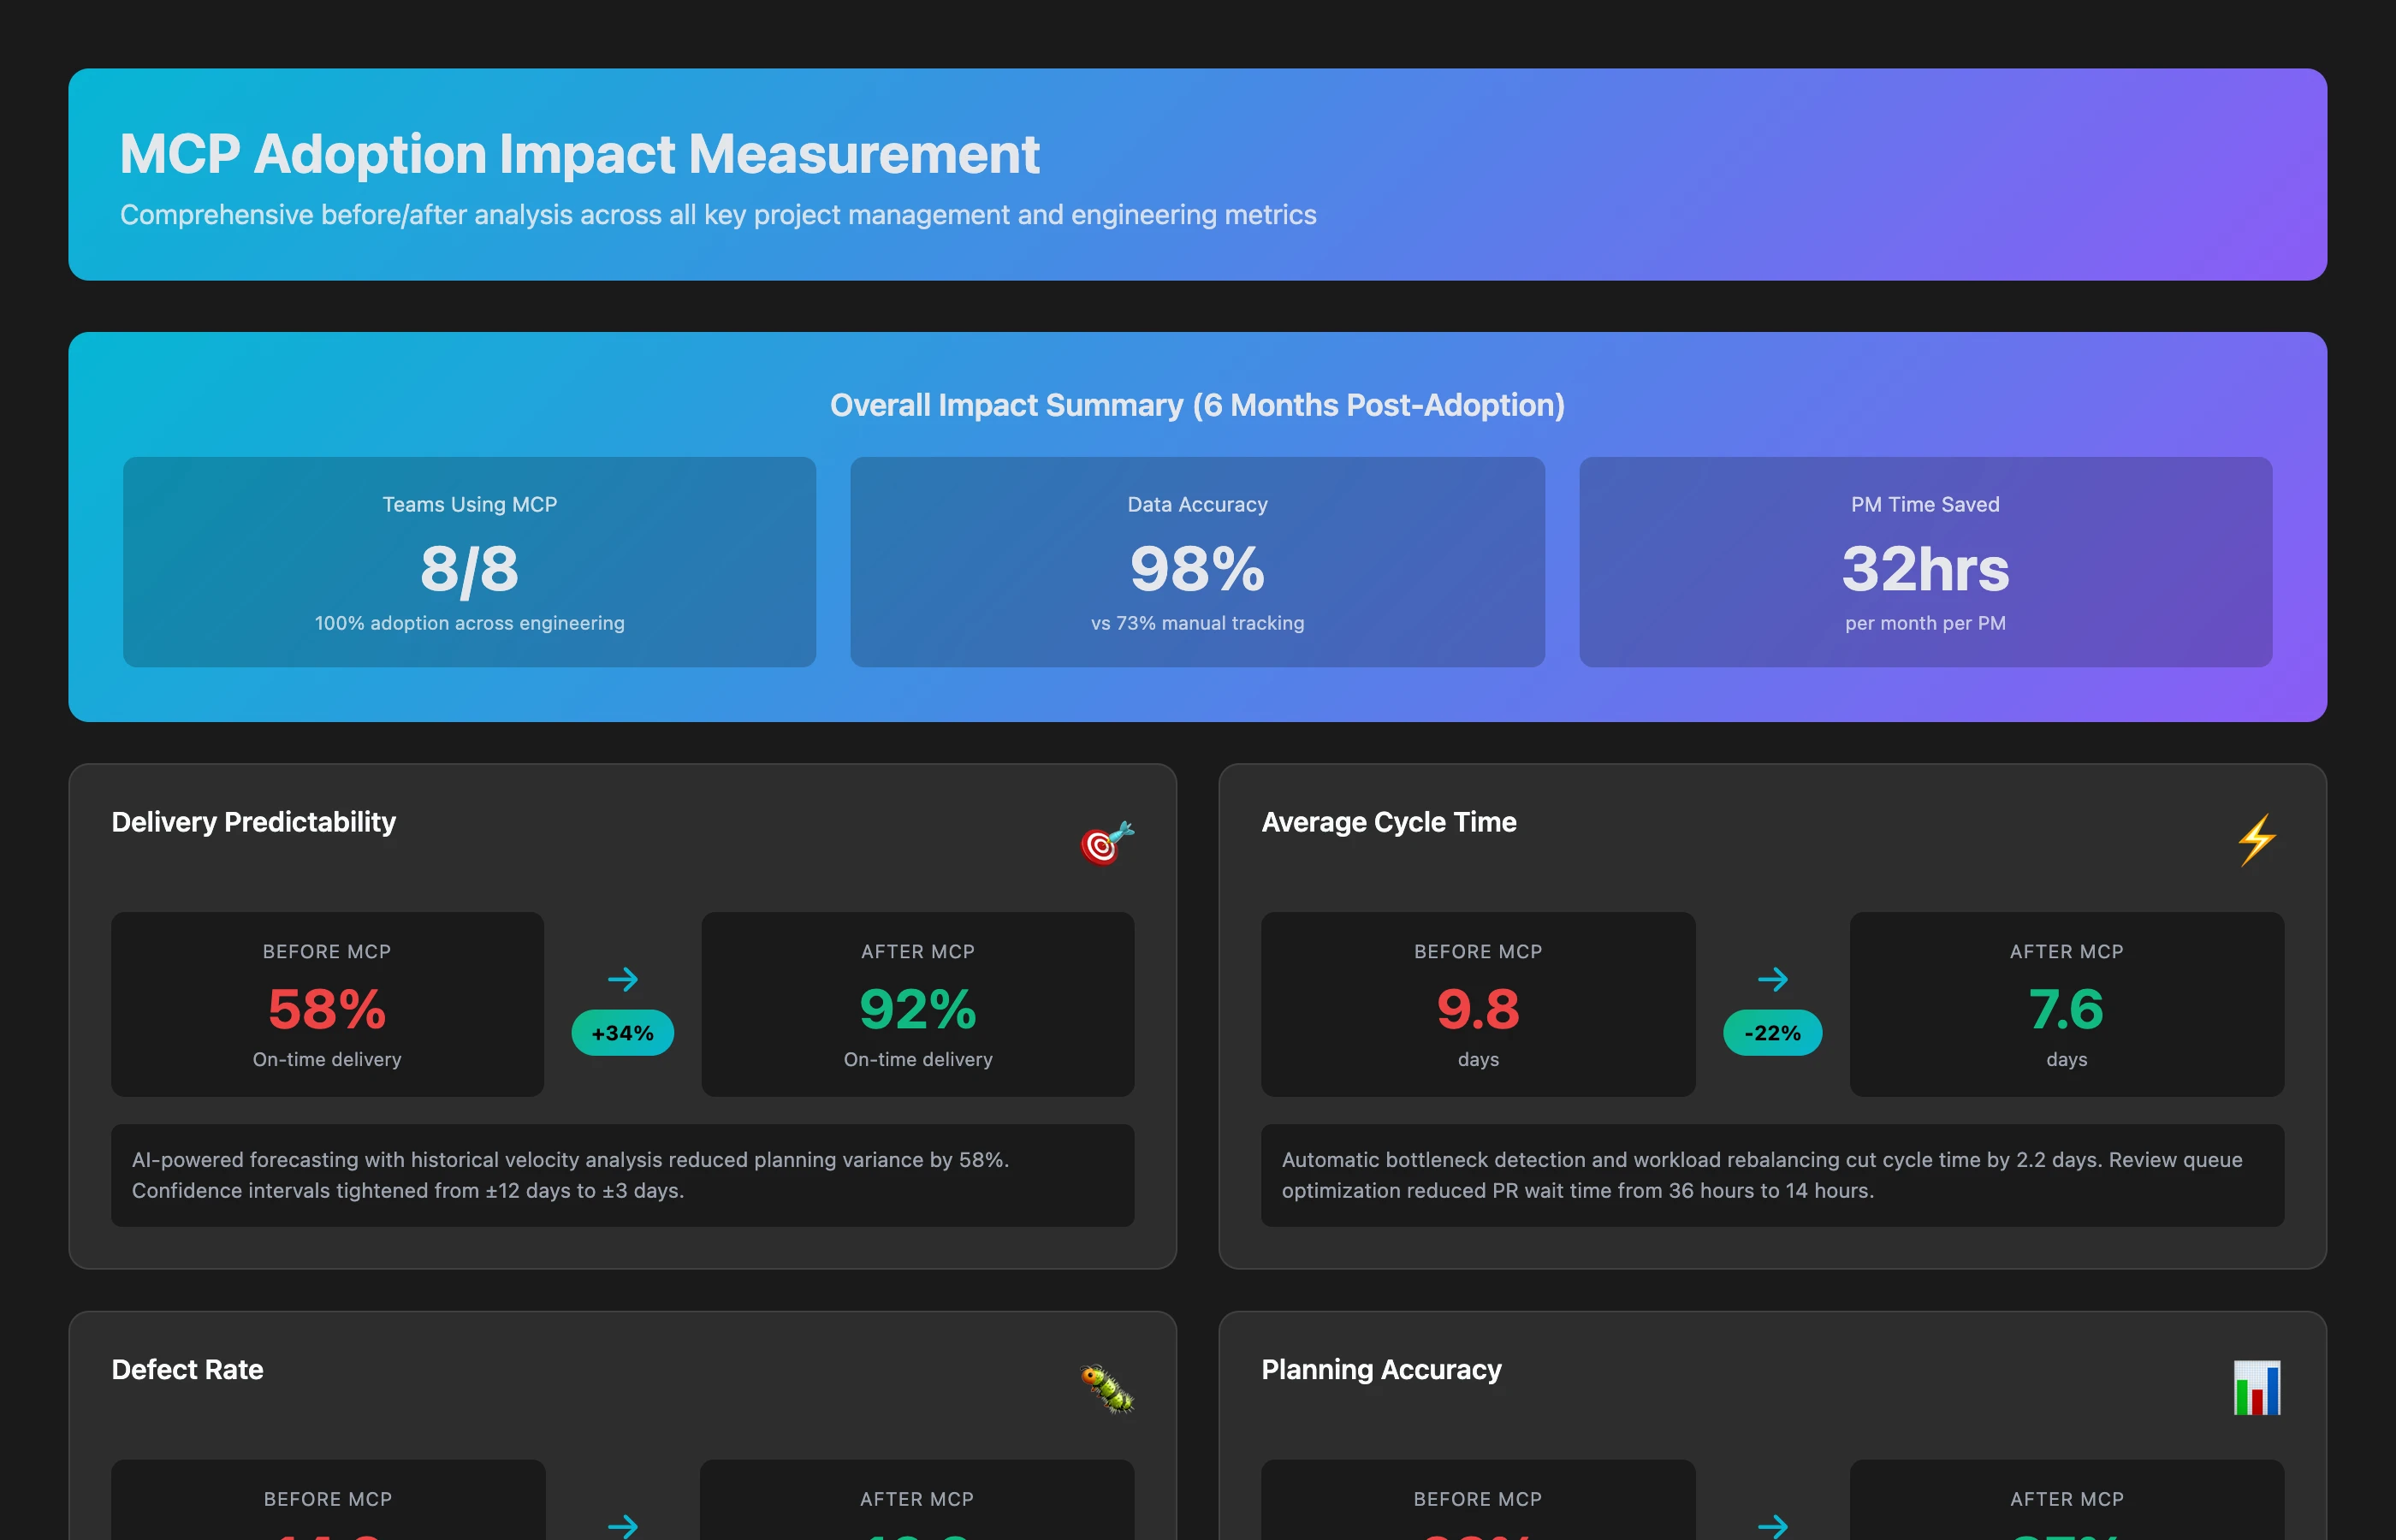
MCP Impact Assessment
Compare project metrics from 12 weeks before MCP adoption to 12 weeks after: delivery predictability, cycle time, defect rates, planning accuracy, team satisfaction, and PM time allocation. Quantify the improvement.
Typical results after 12 weeks:
- Delivery predictability: +34% (more commitments met on time)
- Cycle time: -22% (faster feature delivery)
- Defect rate: -28% (fewer bugs making it to production)
- Planning accuracy: +41% (estimates closer to actuals)
- PM time on data gathering: -67% (15 hours/week → 5 hours/week)
- Team satisfaction: +18% (less chaos, clearer priorities)
The data proves the value.
Common Pitfalls and How to Avoid Them
Pitfall 1: "We'll Wait Until Our Data Is Clean"
The trap: "Our Jira is a mess, let's clean it up before using MCP."
The reality: Your data will never be perfect. MCP helps you identify and clean bad data by surfacing inconsistencies.
The solution: Start with MCP using your current (messy) data. Use its insights to prioritize cleanup efforts where it matters most.
Pitfall 2: "We Need Everyone Trained Before Rollout"
The trap: Schedule a big training, wait for 100% attendance, then launch.
The reality: People learn by doing, not by watching PowerPoints.
The solution: Start with PM team and tech leads (5-8 people). Run for 2 weeks. Capture wins. Share success stories. Organic adoption follows.
The trap: "MCP is better, let's migrate everything and shut down Jira."
The reality: MCP complements your existing tools, it doesn't replace them. Teams still need Jira for day-to-day work.
The solution: MCP is your analysis layer on top of operational tools. Don't disrupt workflows—augment them with insights.
Pitfall 4: "We'll Generate Every Possible Report"
The trap: Create 40 dashboards covering every metric imaginable.
The reality: Information overload leads to decision paralysis. More dashboards ≠ better decisions.
The solution: Start with 3-5 core questions you need answered weekly. Add more only when those become routine.
The trap: "MCP says this, so we do it—no discussion."
The reality: Data informs decisions, but context and human judgment matter. A metric can't tell you about a personal issue affecting someone's productivity.
The solution: Use MCP insights as conversation starters in 1:1s and retrospectives, not as verdicts.
The Future: From Project Manager to Strategic Orchestrator
Traditional project management is tactical: tracking tickets, updating Gantt charts, chasing status updates, reconciling data. You're a human glue layer between tools.
With Keypup MCP, the tactical work becomes automated. Your role shifts:
From: "What's the status of this feature?"
To: "Should we invest in this feature given our current capacity and technical debt?"
From: "Why are we behind schedule?"
To: "What process changes would improve our delivery predictability by 30%?"
From: "Who's working on what?"
To: "How should we rebalance our team structure to optimize for our Q3 goals?"
From: "Can we hit this deadline?"
To: "What's the optimal scope-timeline-quality trade-off for this initiative?"
You become a strategic orchestrator: setting direction, removing obstacles, optimizing systems, and enabling teams—not a data janitor.
Conclusion: Clarity Beats Chaos
Software development project management is hard because the work is invisible, the data is fragmented, and the complexity is exponential. Traditional PM tools aren't built for this reality.
Keypup MCP doesn't simplify the complexity—it makes the complexity visible and manageable. You can't eliminate uncertainty in software development, but you can:
- See the full picture across all your tools in real-time
- Predict outcomes based on historical patterns and current capacity
- Detect problems before they derail your timeline
- Quantify the impact of your decisions and process changes
- Optimize continuously based on data, not opinions
The PMs who thrive in the next decade won't be the ones with the prettiest Gantt charts—they'll be the ones who turn chaos into clarity, data into decisions, and insights into action.
Your team deserves better than status meeting theater and spreadsheet archaeology. Your stakeholders deserve accurate forecasts and transparent trade-offs. You deserve tools that help you manage, not just report.
Start with one question: "What's the real status of my projects?"
Ask Keypup MCP. The answer might surprise you—and it will definitely help you.
Keypup MCP is available now for GitHub Copilot, Claude, and other AI assistants supporting the Model Context Protocol. Connect your Jira, Trello, and Git repositories in under an hour and start asking better questions.
Get Started: Keypup MCP Documentation
More About the Keypup MCP server: MCP Server page
Questions?: Talk to our PM team