The Story Point Illusion: Why Your Estimates Don't Predict Delivery
Story points are supposed to make delivery predictable, yet an 8-point issue rarely takes much longer than a 3-pointer and points inflate quarter after quarter. Learn what engineering leaders on Reddit say about story points, why the estimation gap stays invisible in enterprise reporting, and how Keypup MCP compares Jira story points with workflow history, sprints and linked pull requests to measure it.
TL;DR: In many enterprise organizations, story points barely predict how long work takes. An 8-point issue is estimated at almost three times a 3-pointer but takes only about 1.4 times as long in development, the spread inside each point value is wider than the gap between them, and the average points per issue keep rising while the work stays the same size. On top of that, points only estimate the development slice — often less than a quarter of the calendar time. The Keypup MCP Server reads the Jira Story Points field, the workflow status history of every issue, its sprint history and the pull requests linked to it, so your AI assistant can compare estimates with actual time in progress, show point inflation over time, compare what a "point" costs in each team, show where calendar time really goes, and list the small issues that blew past their estimate.
Every quarter, the same ritual plays out. Teams sum their story points, divide by velocity, and hand leadership a date. Every quarter, the date slips — and the explanation is always specific: an unexpected dependency, a sick engineer, a tricky migration. Nobody questions the instrument itself. But when you put the estimates next to what actually happened, a different picture appears: the points were never a good predictor of delivery in the first place.
The Friction: An Estimate Nobody Checks
The story point illusion is the belief that summing estimates tells you when work will ship. Story points were designed as a relative measure of complexity, to help a single team plan a single sprint. In enterprise organizations, they end up used for something else entirely: roadmap forecasts, cross-team capacity plans, productivity comparisons and executive reporting.
The gap stays invisible for structural reasons:
Estimates are never compared with outcomes. Points are set at refinement and never revisited. Nobody goes back to check whether the 2-pointer actually took less time than the 8-pointer.
Velocity looks healthy by construction. Teams that are measured on velocity learn to estimate higher. Points per sprint go up; delivery doesn't.
Points only cover development. A story point estimates the build effort. Waiting to start, code review and QA — often most of the calendar time — aren't in the estimate at all.
A "point" means something different in every team. Summing points across teams to forecast a program adds up numbers in different currencies.
The result: leaders commit to dates using a number that describes what teams expected, not what usually happens.
Why This Matters: Unreliable Estimates Have Real Costs
The Forecast Problem
If 3-point and 8-point issues take roughly the same time, a backlog of 200 points tells you very little about how long the backlog will take. Roadmap dates built on point totals are guesses dressed up as arithmetic — and the more teams a program spans, the bigger the error.
The Trust Problem
When dates keep slipping, leadership adds process: more detailed estimates, longer refinement sessions, commitment ceremonies. Engineers spend more time estimating and the estimates get no better. Both sides start to see estimation as theatre.
The Inflation Problem
When velocity is used as a performance signal, points inflate. A team that delivered 40 points per sprint now delivers 60 — with the same people, doing the same kind of work. Any productivity trend built on points becomes meaningless, and comparisons between teams become actively misleading.
The Enterprise Discussion: What Engineers Are Actually Saying
Story points are one of the most argued-about topics wherever engineering managers, delivery leads and senior engineers at large organizations compare notes. The quotes below are representative of recurring threads on r/ExperiencedDevs, r/agile and r/scrum.
Engineering Manager, Global Bank (r/ExperiencedDevs)
"Our VP asks for a date, we sum the story points, divide by velocity and give him a date. We've missed every single one this year. Nobody has ever checked whether our 8-pointers actually take longer than our 3-pointers. I'm fairly sure they don't."
"Leadership started comparing velocity between teams, and within two quarters every team's velocity went up 40%. Nothing shipped faster. We just got better at picking bigger numbers in planning poker."
Staff Engineer, Healthcare SaaS (r/scrum)
"The estimate covers the coding. The ticket then sits in review for four days and in QA for three. Then everyone asks why a 2-point story took two weeks. The estimate was right — it just measured the smallest part of the journey."
The pattern holds: everyone suspects the estimates don't predict delivery, but nobody can show by how much, where the time actually goes, or which issues to learn from — because the evidence lives in the story points, status history and pull requests of thousands of closed issues.
How Keypup MCP Measures the Story Point Gap
The Keypup Model Context Protocol (MCP) Server gives your AI assistant structured access to the issues and pull requests Keypup imports from Jira, GitHub, GitLab and Bitbucket. For every Jira issue, that includes its Story Points and other Jira fields (such as Team), its creation and closing dates, its workflow timeline — each status it entered, with start and end timestamps — its current and past sprints, and the pull requests linked to it, with their lines changed. That's everything needed to compare what was estimated with what actually happened.
1. Sizing the Estimation Gap
The first question is simple: do bigger estimates actually mean longer work?
MCP Prompt:
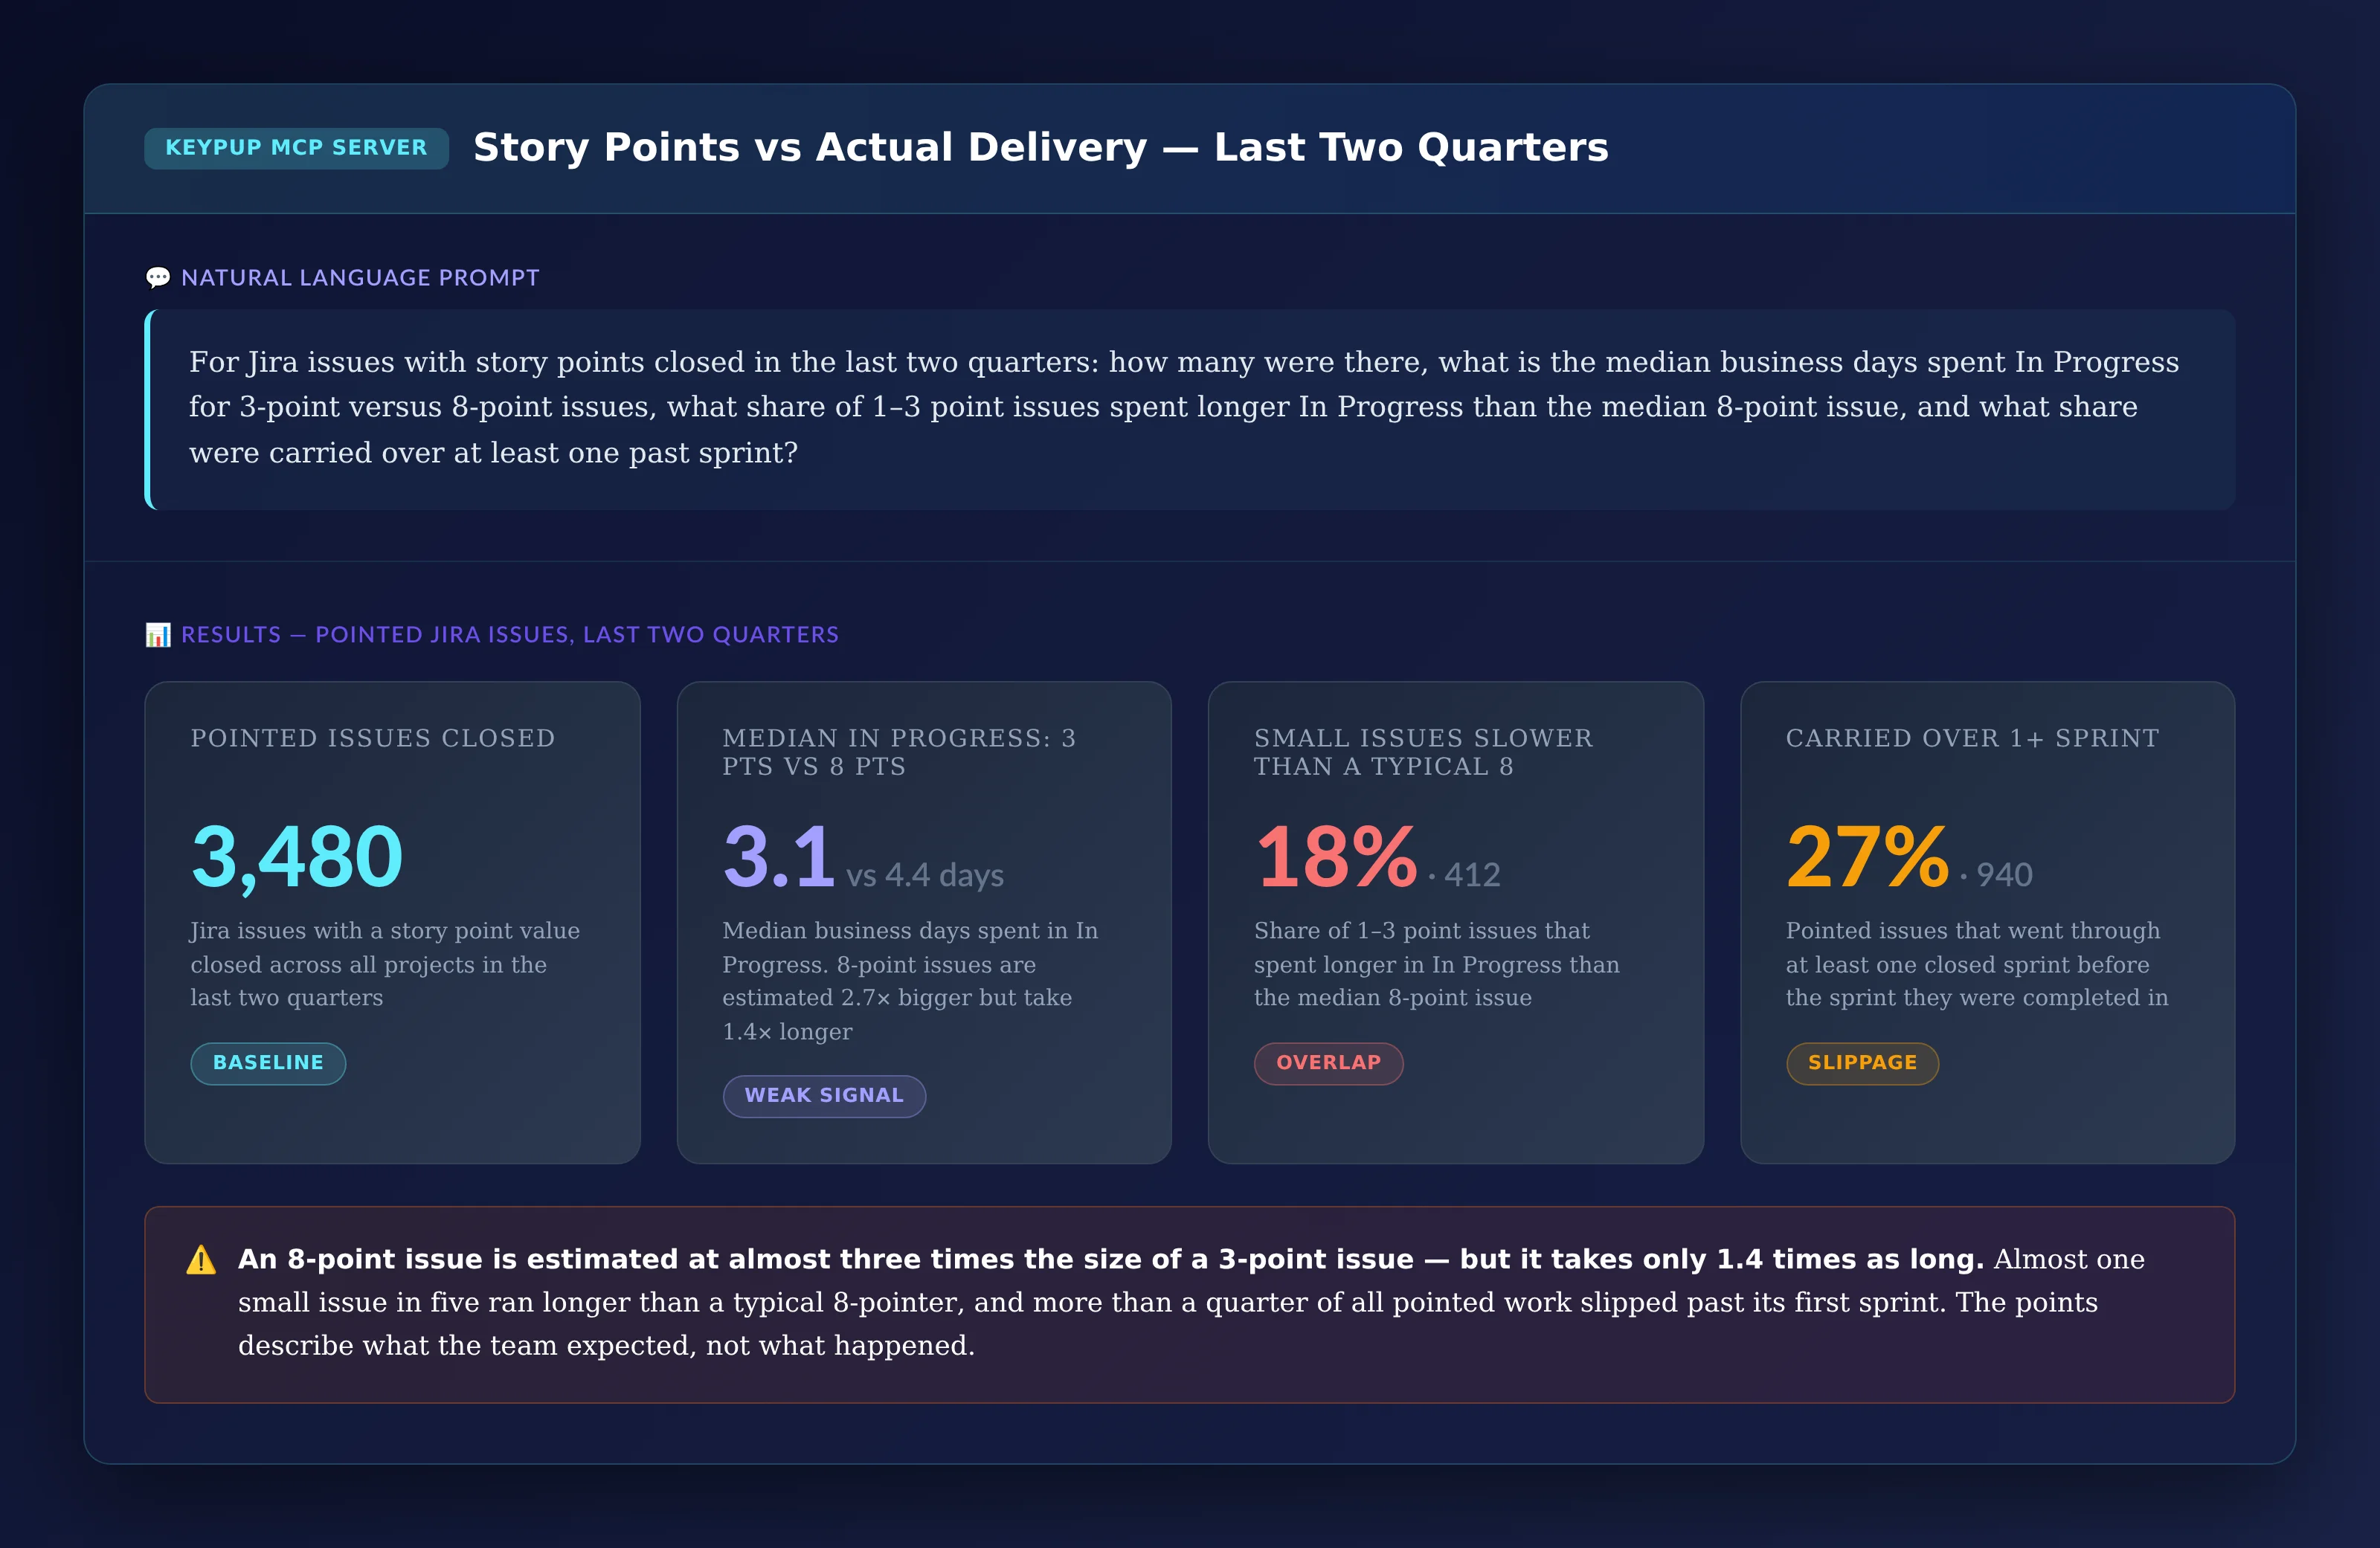
For Jira issues with story points closed in the last two
quarters: how many were there, what is the median business
days spent In Progress for 3-point versus 8-point issues,
what share of 1–3 point issues spent longer In Progress than
the median 8-point issue, and what share were carried over
at least one past sprint?
Output: Story Points vs Actual Delivery — Last Two Quarters
Key Insight: An 8-point issue is estimated at almost three times the size of a 3-point issue, but takes only 1.4 times as long in development. Almost one small issue in five ran longer than a typical 8-pointer, and more than a quarter of all pointed work slipped past its first sprint.
2. Seeing the Overlap
A median can hide a lot. The full distribution shows how much each point value really tells you.
MCP Prompt:
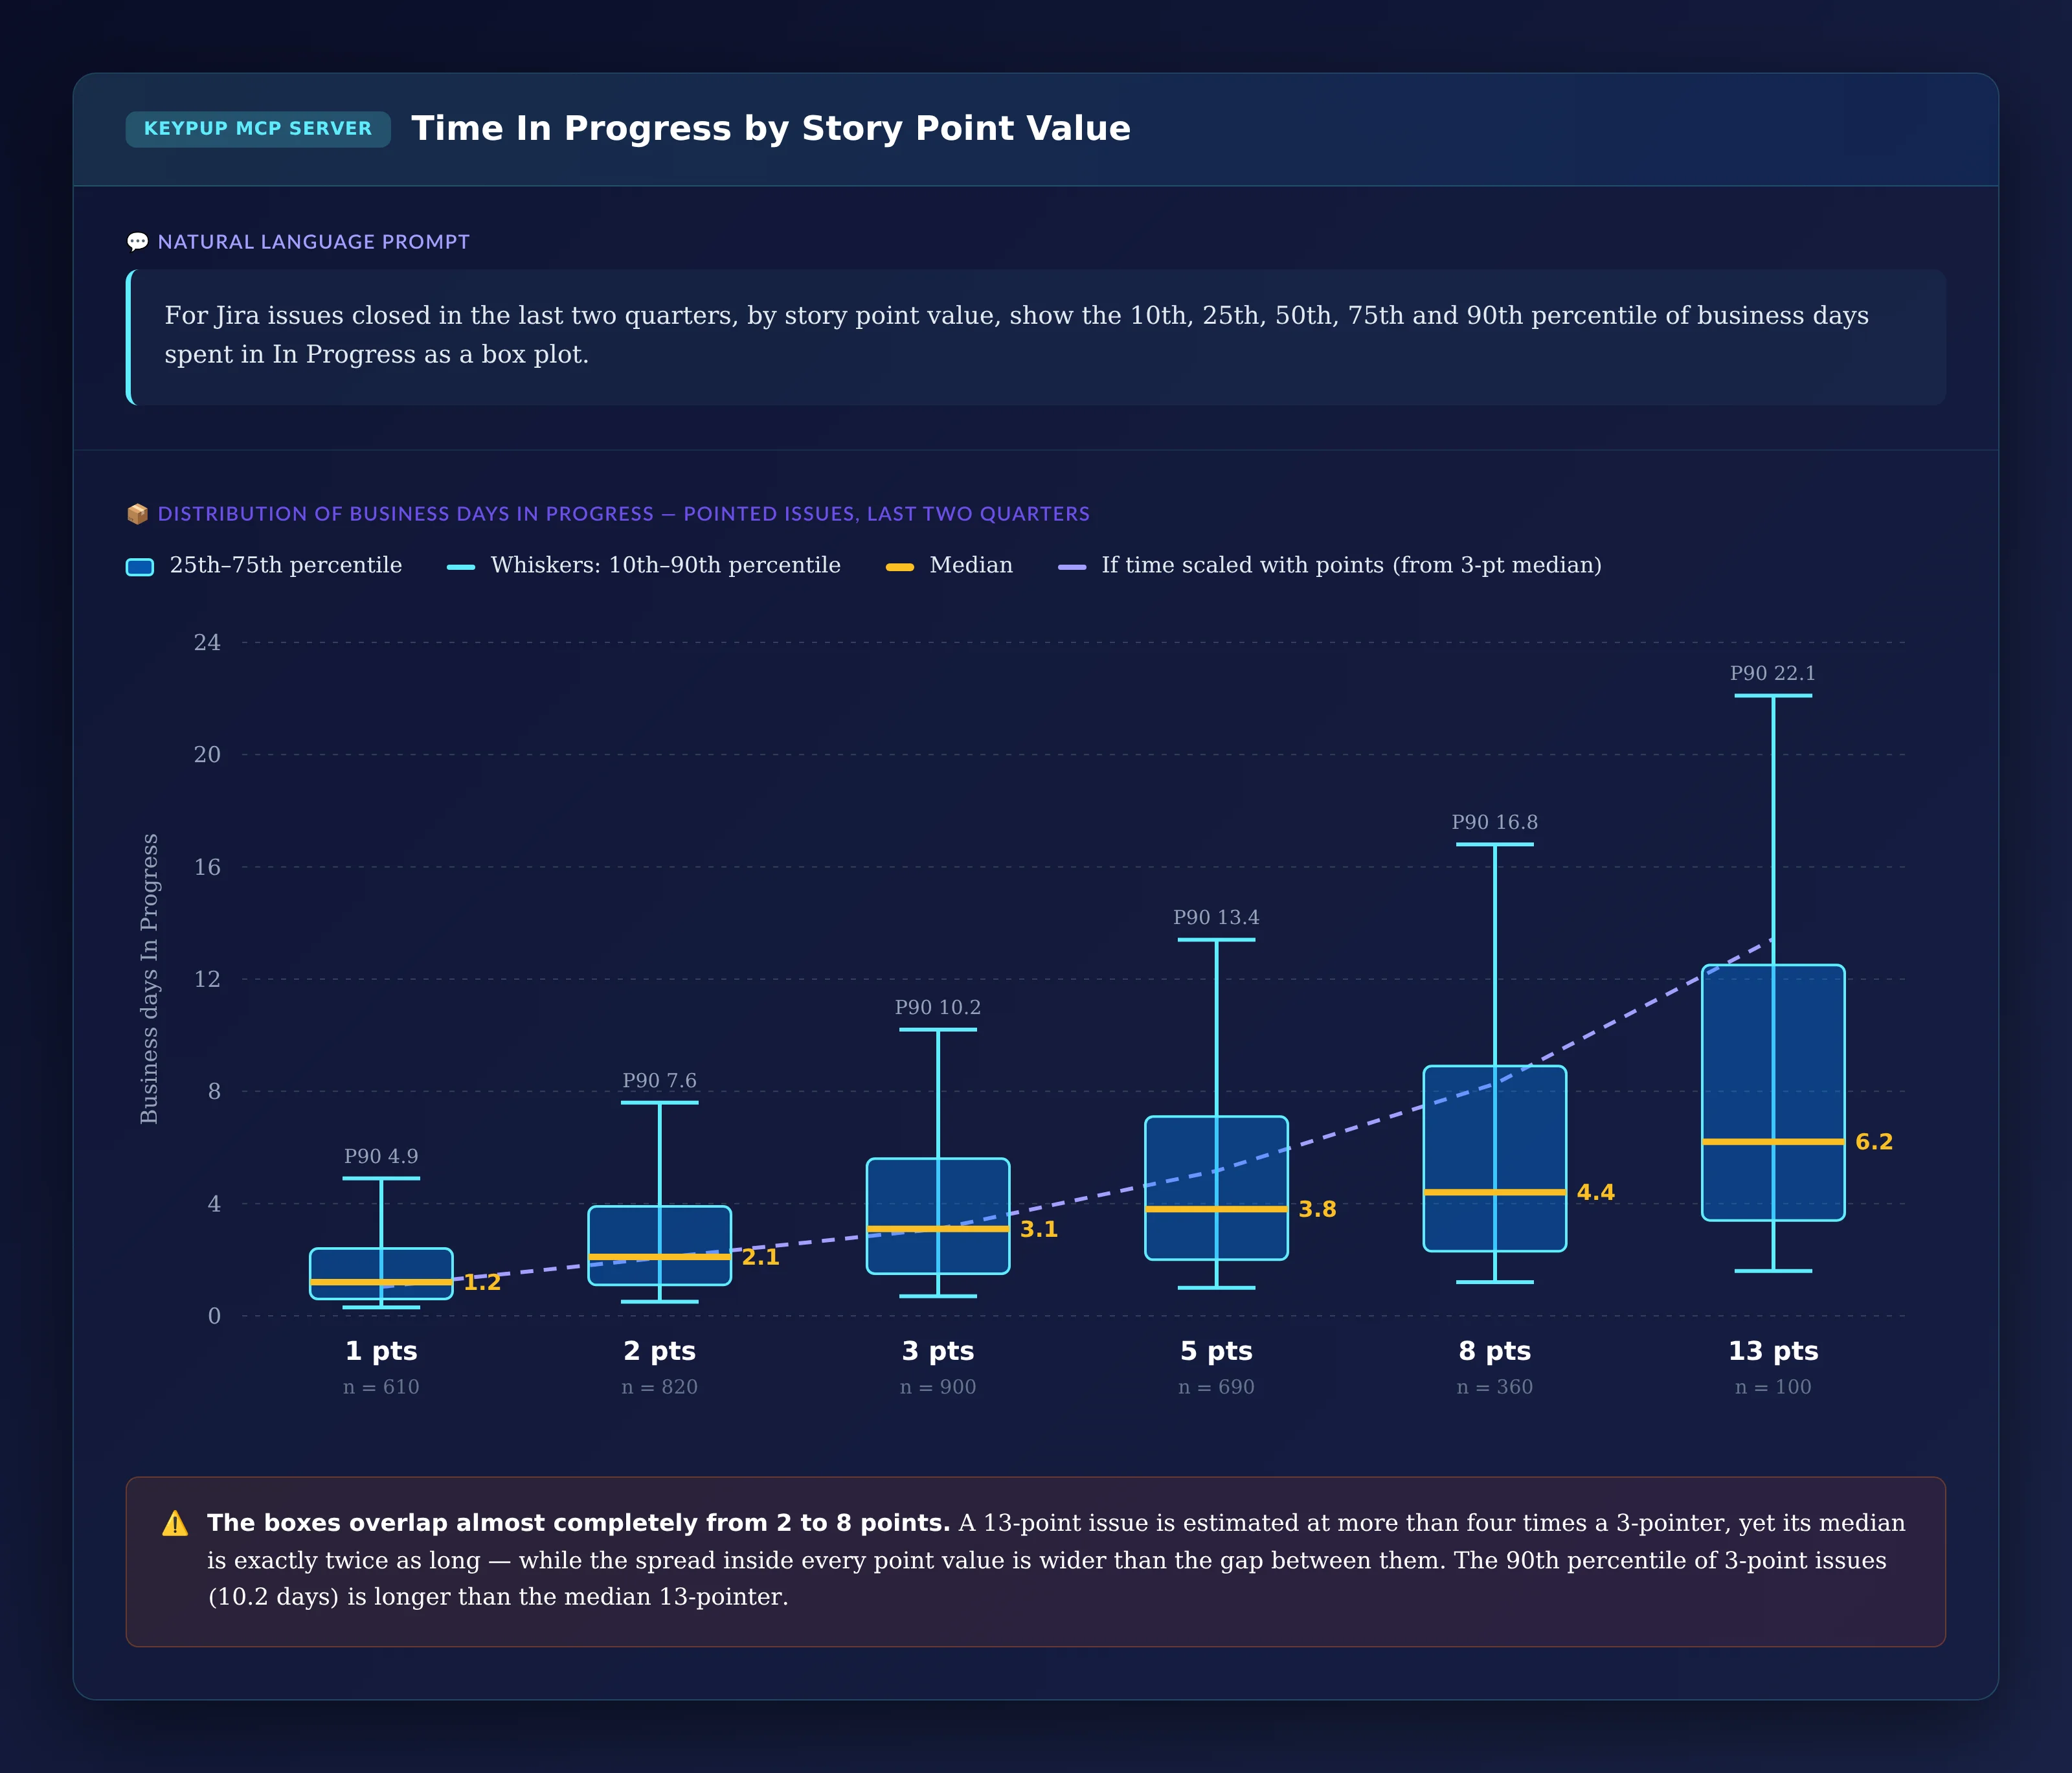
For Jira issues closed in the last two quarters, by story
point value, show the 10th, 25th, 50th, 75th and 90th
percentile of business days spent in In Progress as a
box plot.
Output: Time In Progress by Story Point Value
Key Insight: The boxes overlap almost completely from 2 to 8 points. A 13-point issue is estimated at more than four times a 3-pointer, yet its median is exactly twice as long — and the slowest 10% of 3-point issues (10.2 business days and more) take longer than the median 13-pointer. The spread inside each point value is wider than the gap between them.
3. Proving Point Inflation
Leadership will ask whether velocity growth means the organization is delivering more. Points per issue against time per issue answers it.
MCP Prompt:
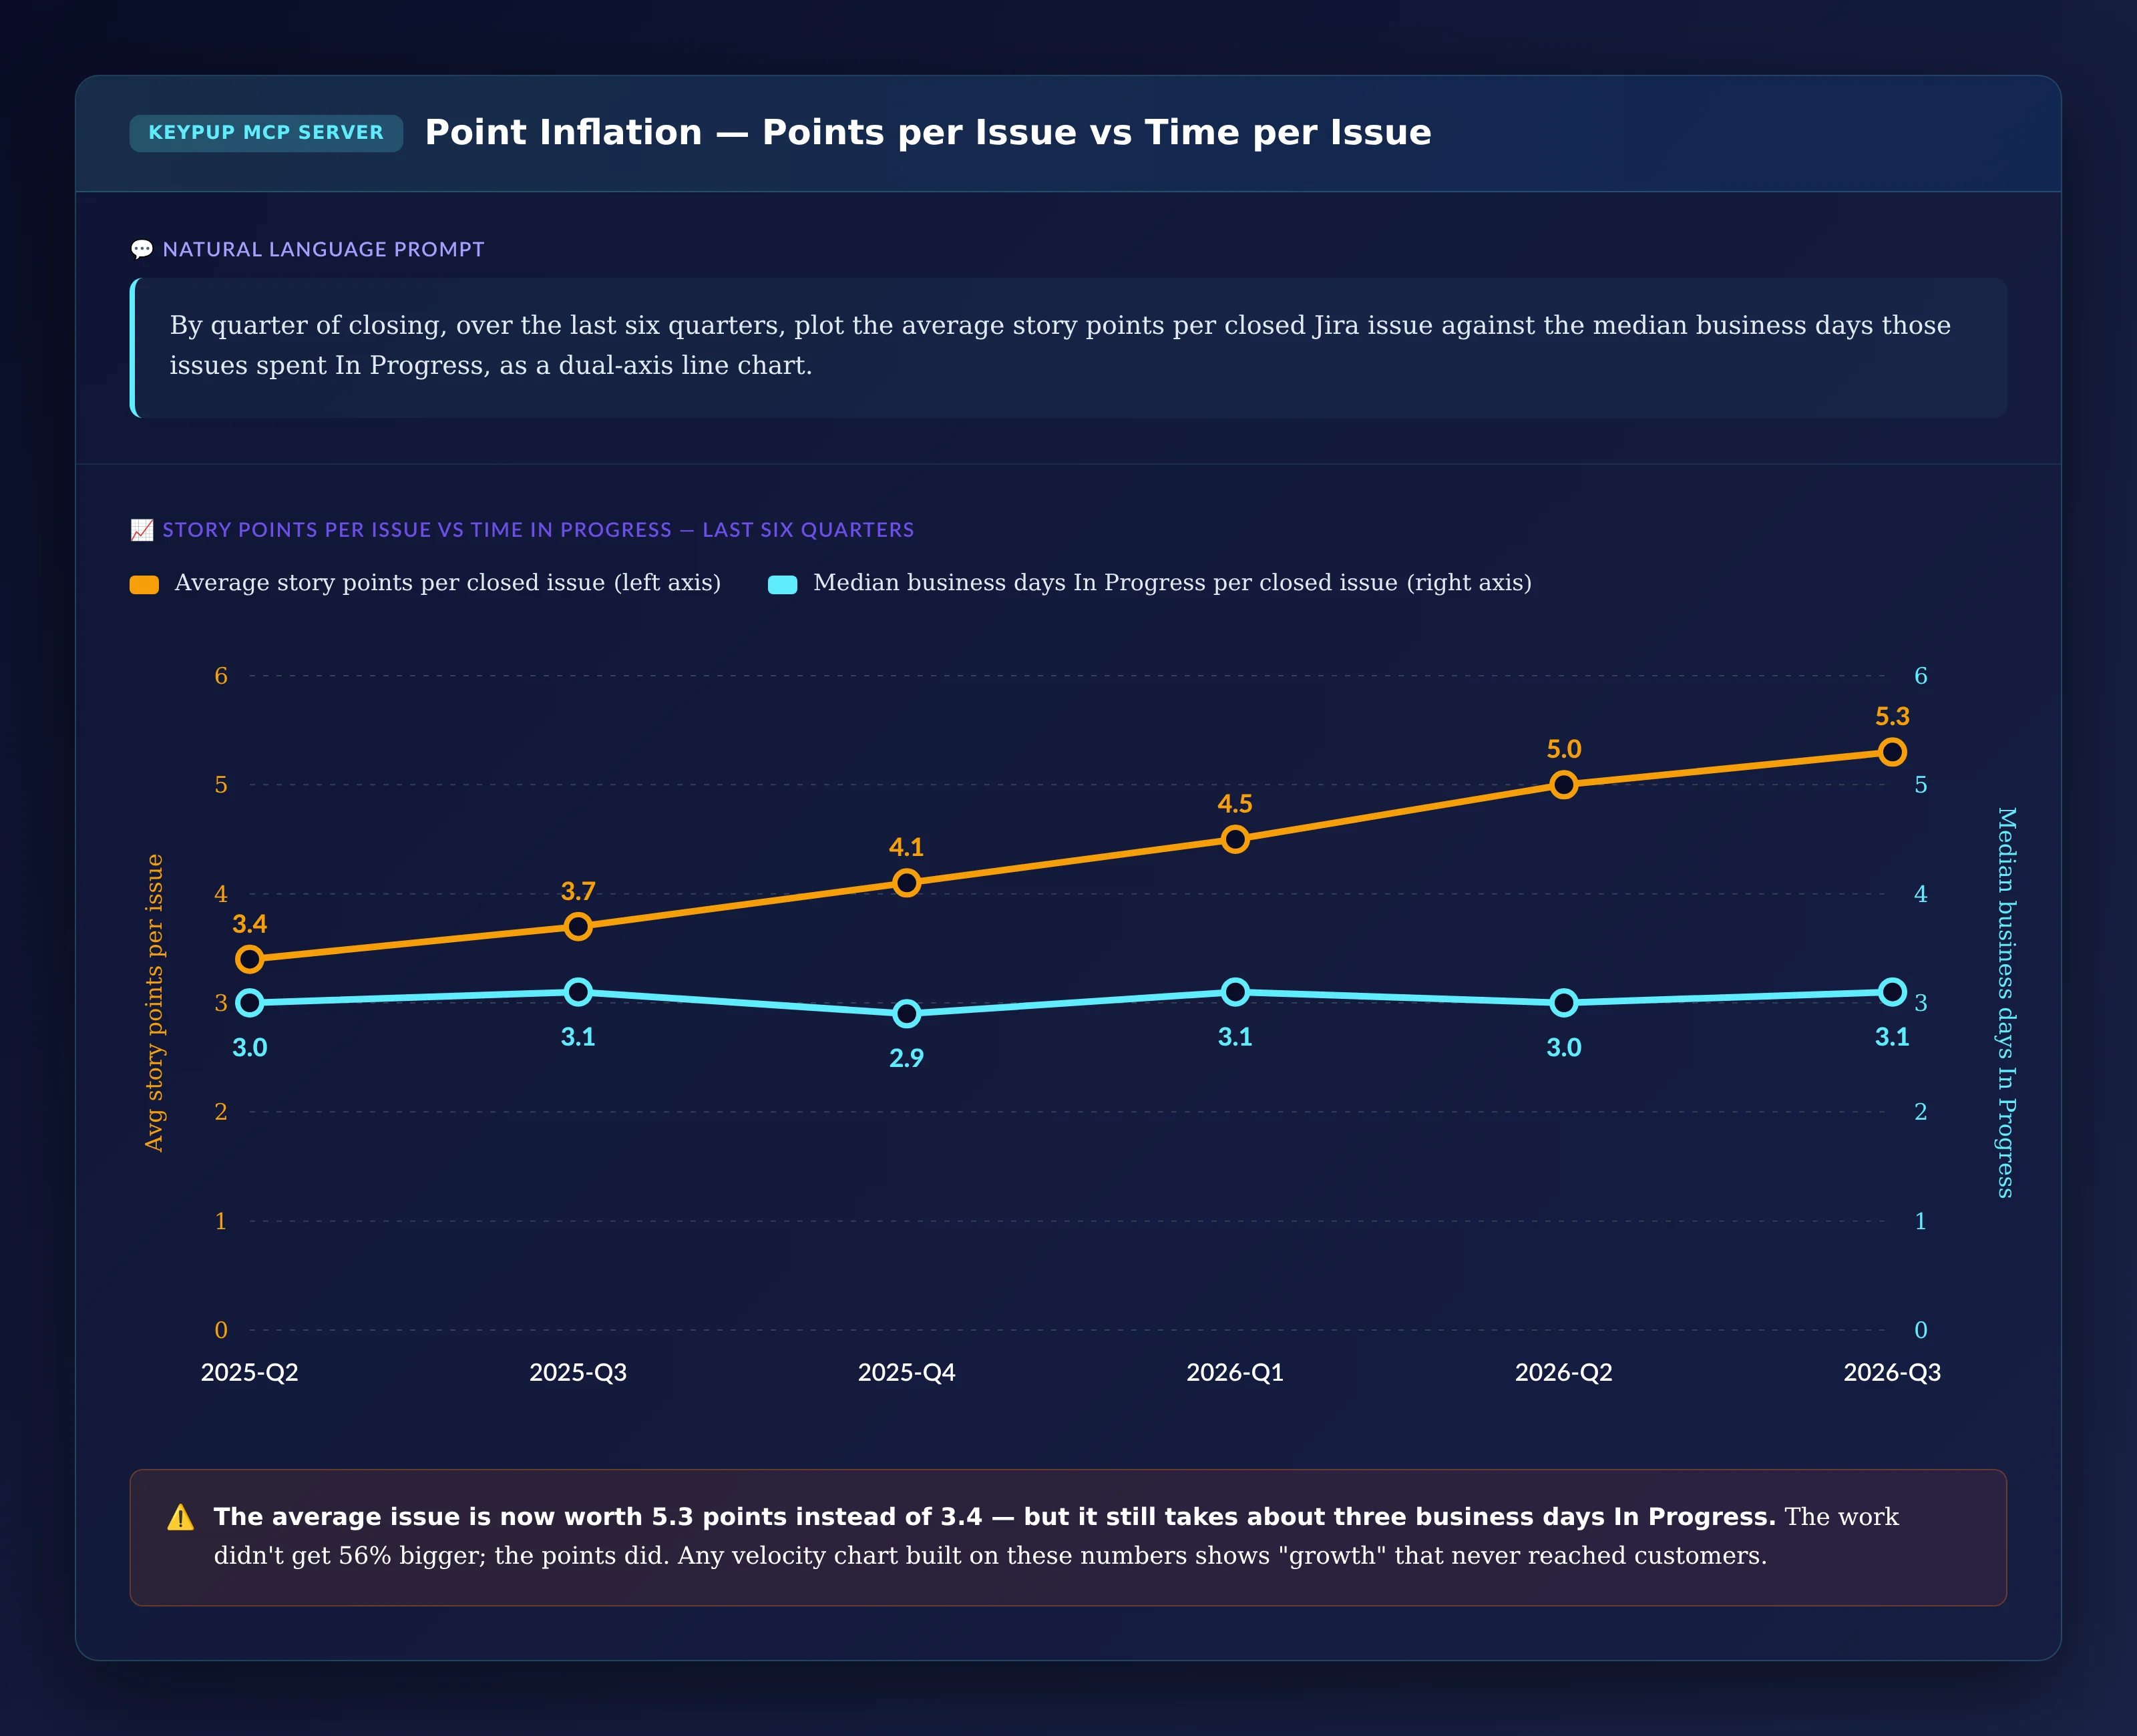
By quarter of closing, over the last six quarters, plot the
average story points per closed Jira issue against the median
business days those issues spent In Progress, as a dual-axis
line chart.
Output: Points per Issue vs Time per Issue — Last Six Quarters
Key Insight: The average issue is now worth 5.3 points instead of 3.4 — but it still takes about three business days in development. The work didn't get 56% bigger; the points did. Any velocity chart built on these numbers shows growth that never reached customers.
4. Comparing What a Point Costs in Each Team
Program-level forecasts add points across teams. That only works if a point means the same thing everywhere.
MCP Prompt:
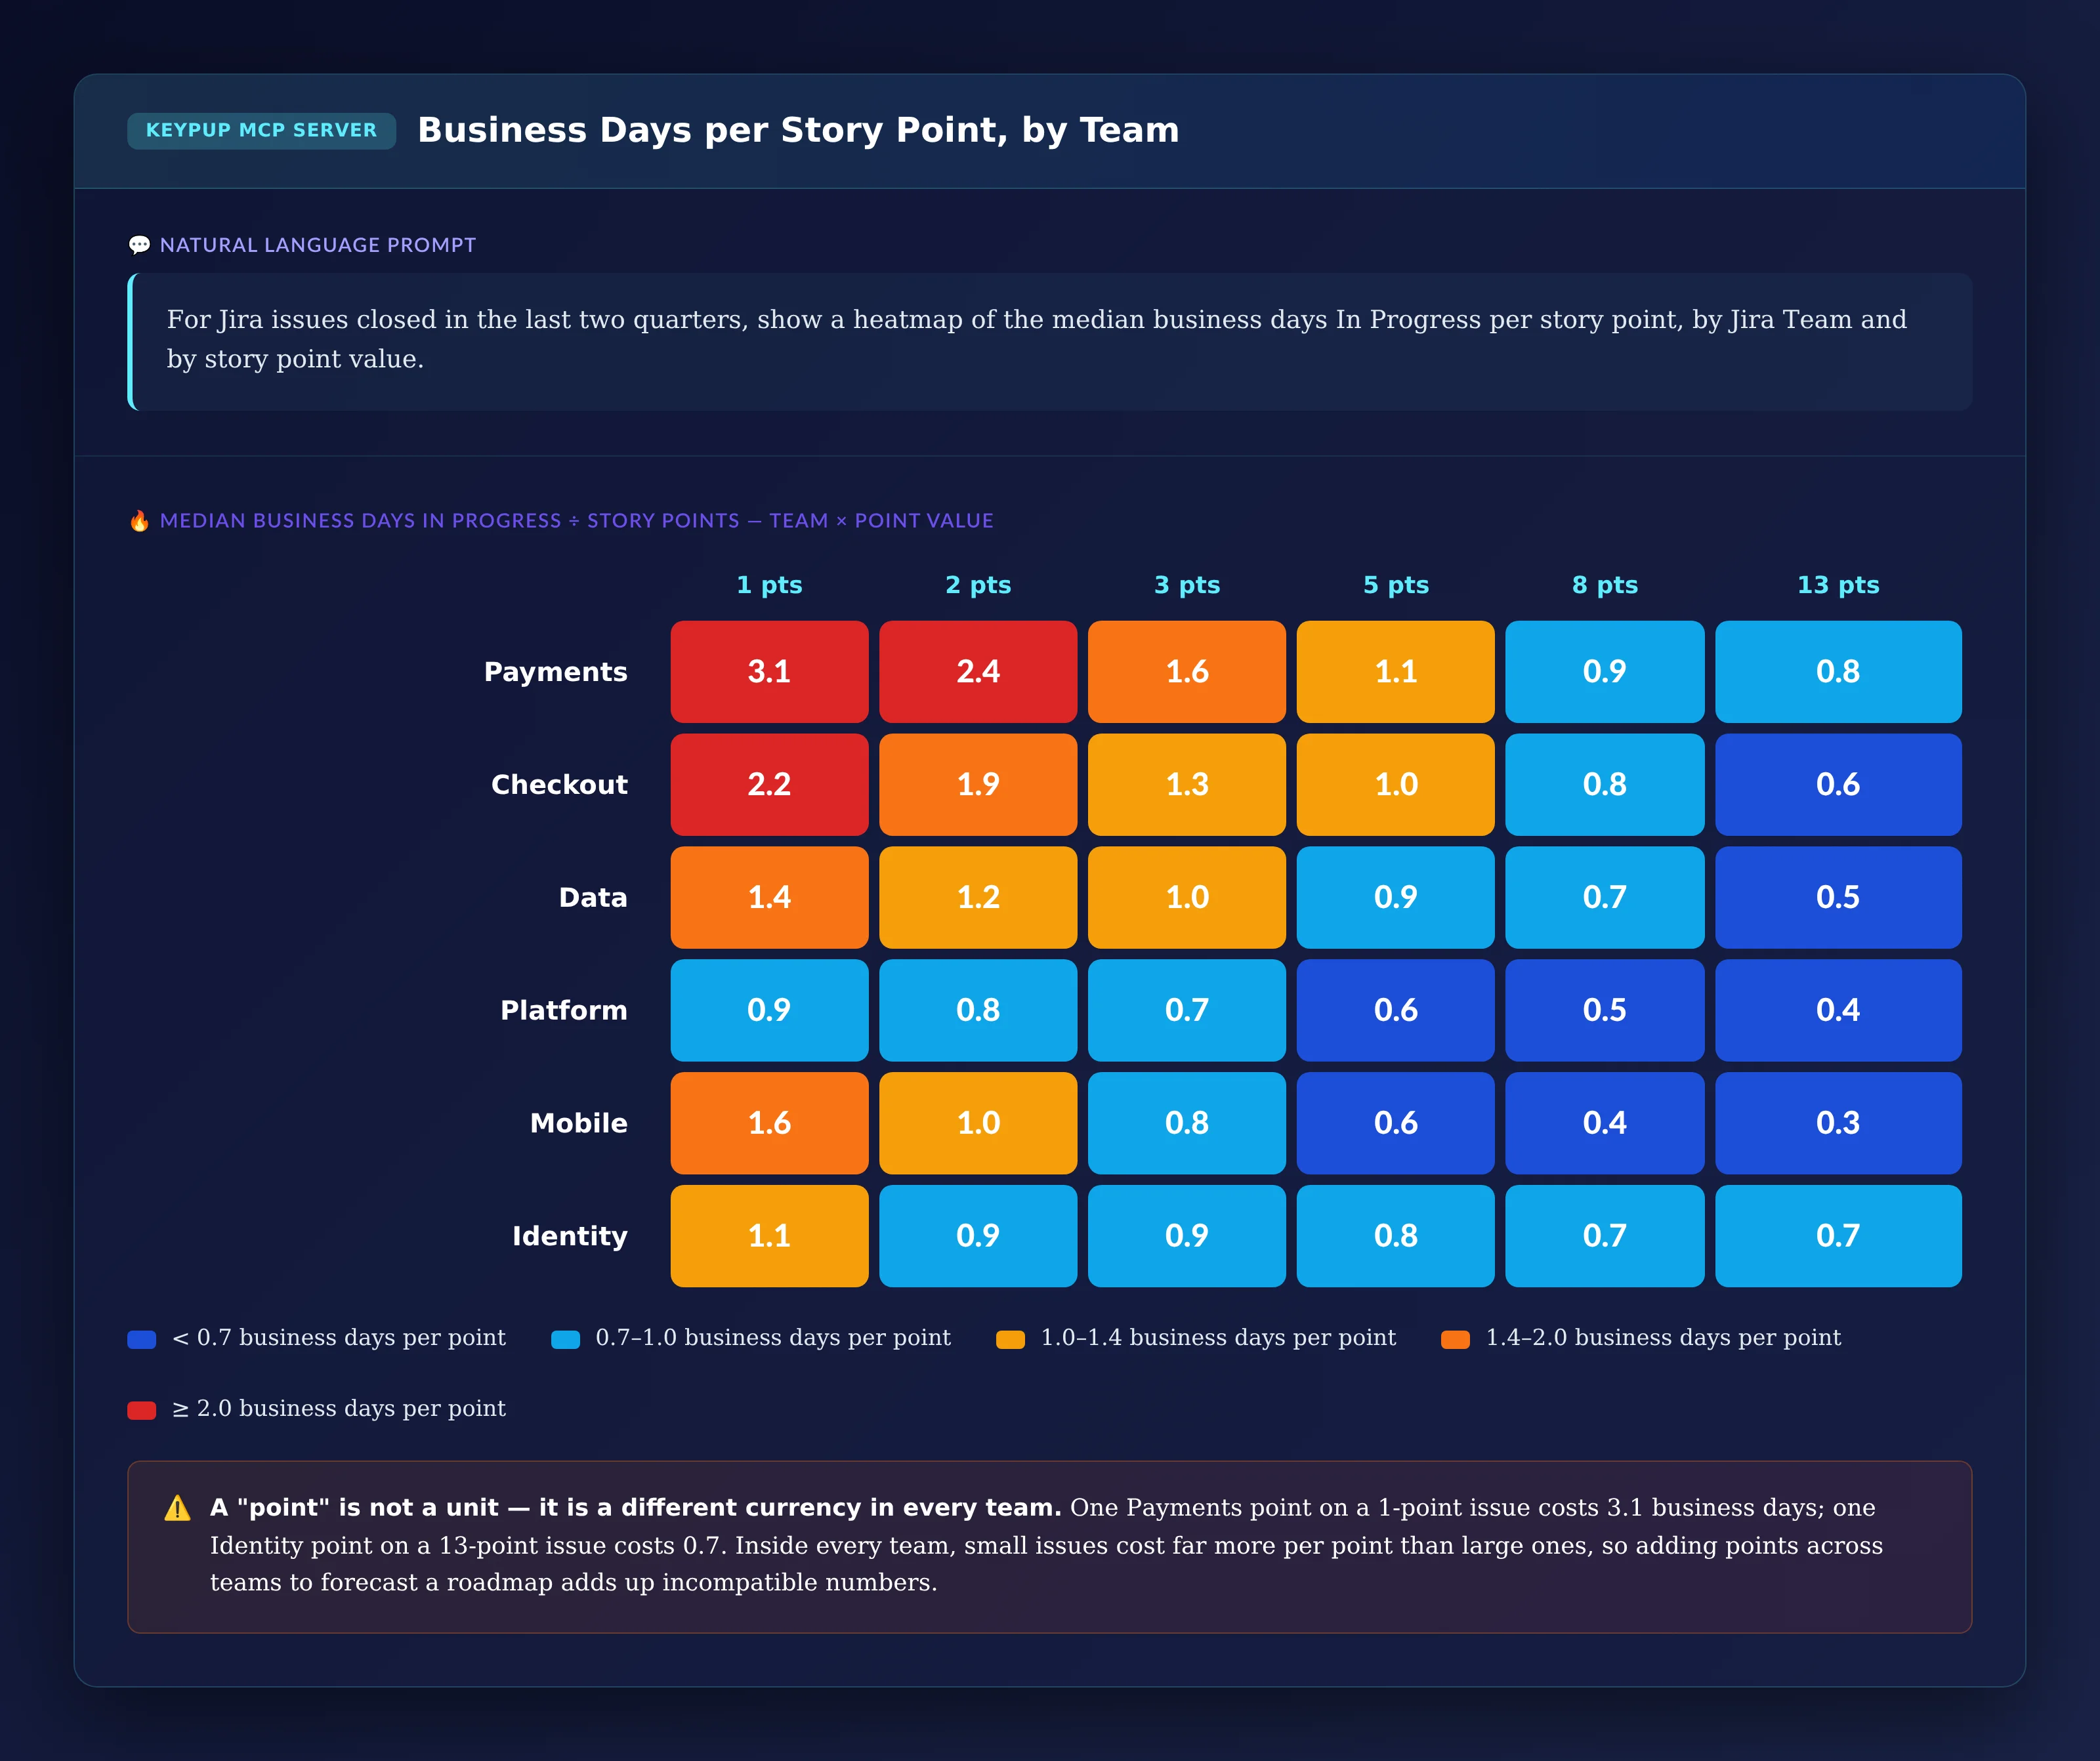
For Jira issues closed in the last two quarters, show a
heatmap of the median business days In Progress per story
point, by Jira Team and by story point value.
Output: Business Days per Story Point, by Team
Key Insight: A point isn't a unit — it's a different currency in every team. One point on a 1-point Payments issue costs 3.1 business days; one point on a 13-point Identity issue costs 0.7. And inside every team, small issues cost more per point than large ones. Summing points across teams to forecast a roadmap adds up incompatible numbers.
5. Showing Where the Calendar Time Goes
Even a perfect estimate only covers development. To set realistic dates, leaders need to see the rest of the journey.
MCP Prompt:
For Jira issues closed in the last two quarters, by story
point value, show the median business days from creation to
first In Progress, and the median business days spent in In
Progress, In Review and In QA, as a stacked bar chart.
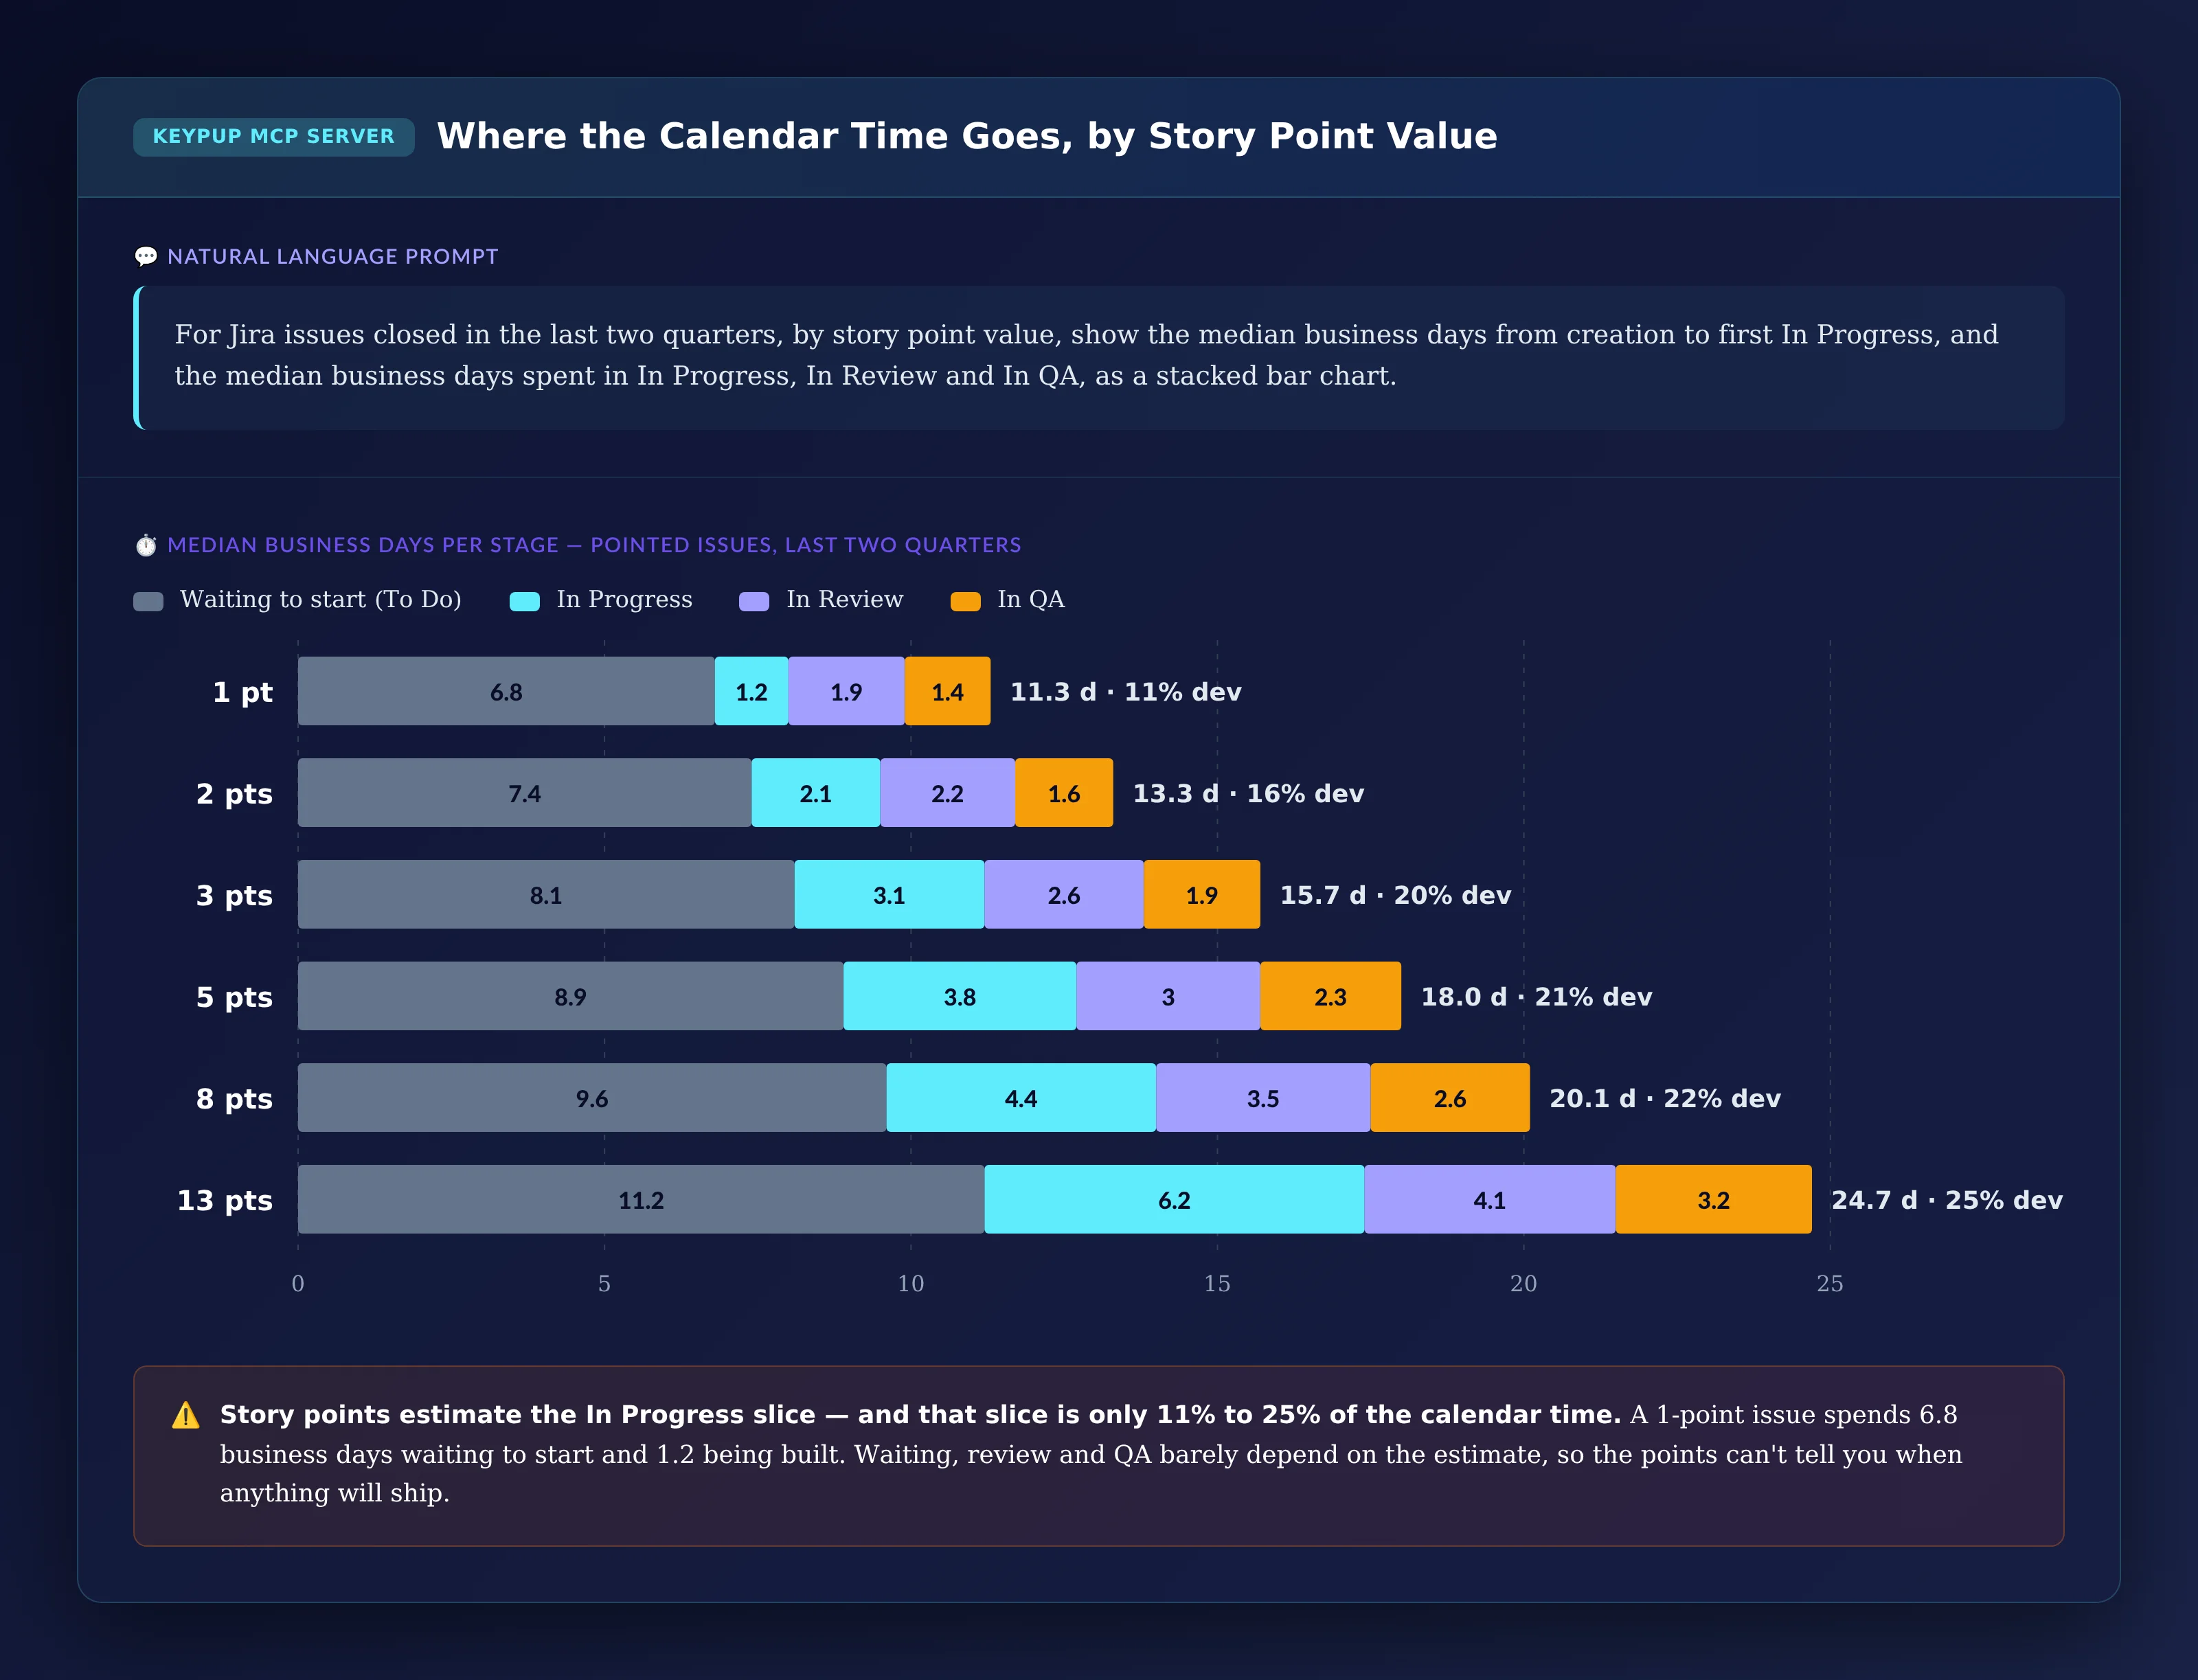
Output: Where the Calendar Time Goes, by Story Point Value
Key Insight: Story points estimate the In Progress slice — and that slice is only 11% to 25% of the calendar time. A 1-point issue spends 6.8 business days waiting to start and 1.2 being built. Waiting, review and QA barely depend on the estimate, so the points alone can't tell you when anything will ship.
6. Finding the Issues to Learn From
Retrospectives work best with specific examples. The issues that blew past a small estimate are the best place to start.
MCP Prompt:
List Jira issues closed last quarter with 3 story points or
fewer that spent more than 10 business days In Progress,
longest first. Show team, type, points, business days In
Progress, number of past sprints, number of linked pull
requests and total lines changed in those pull requests.
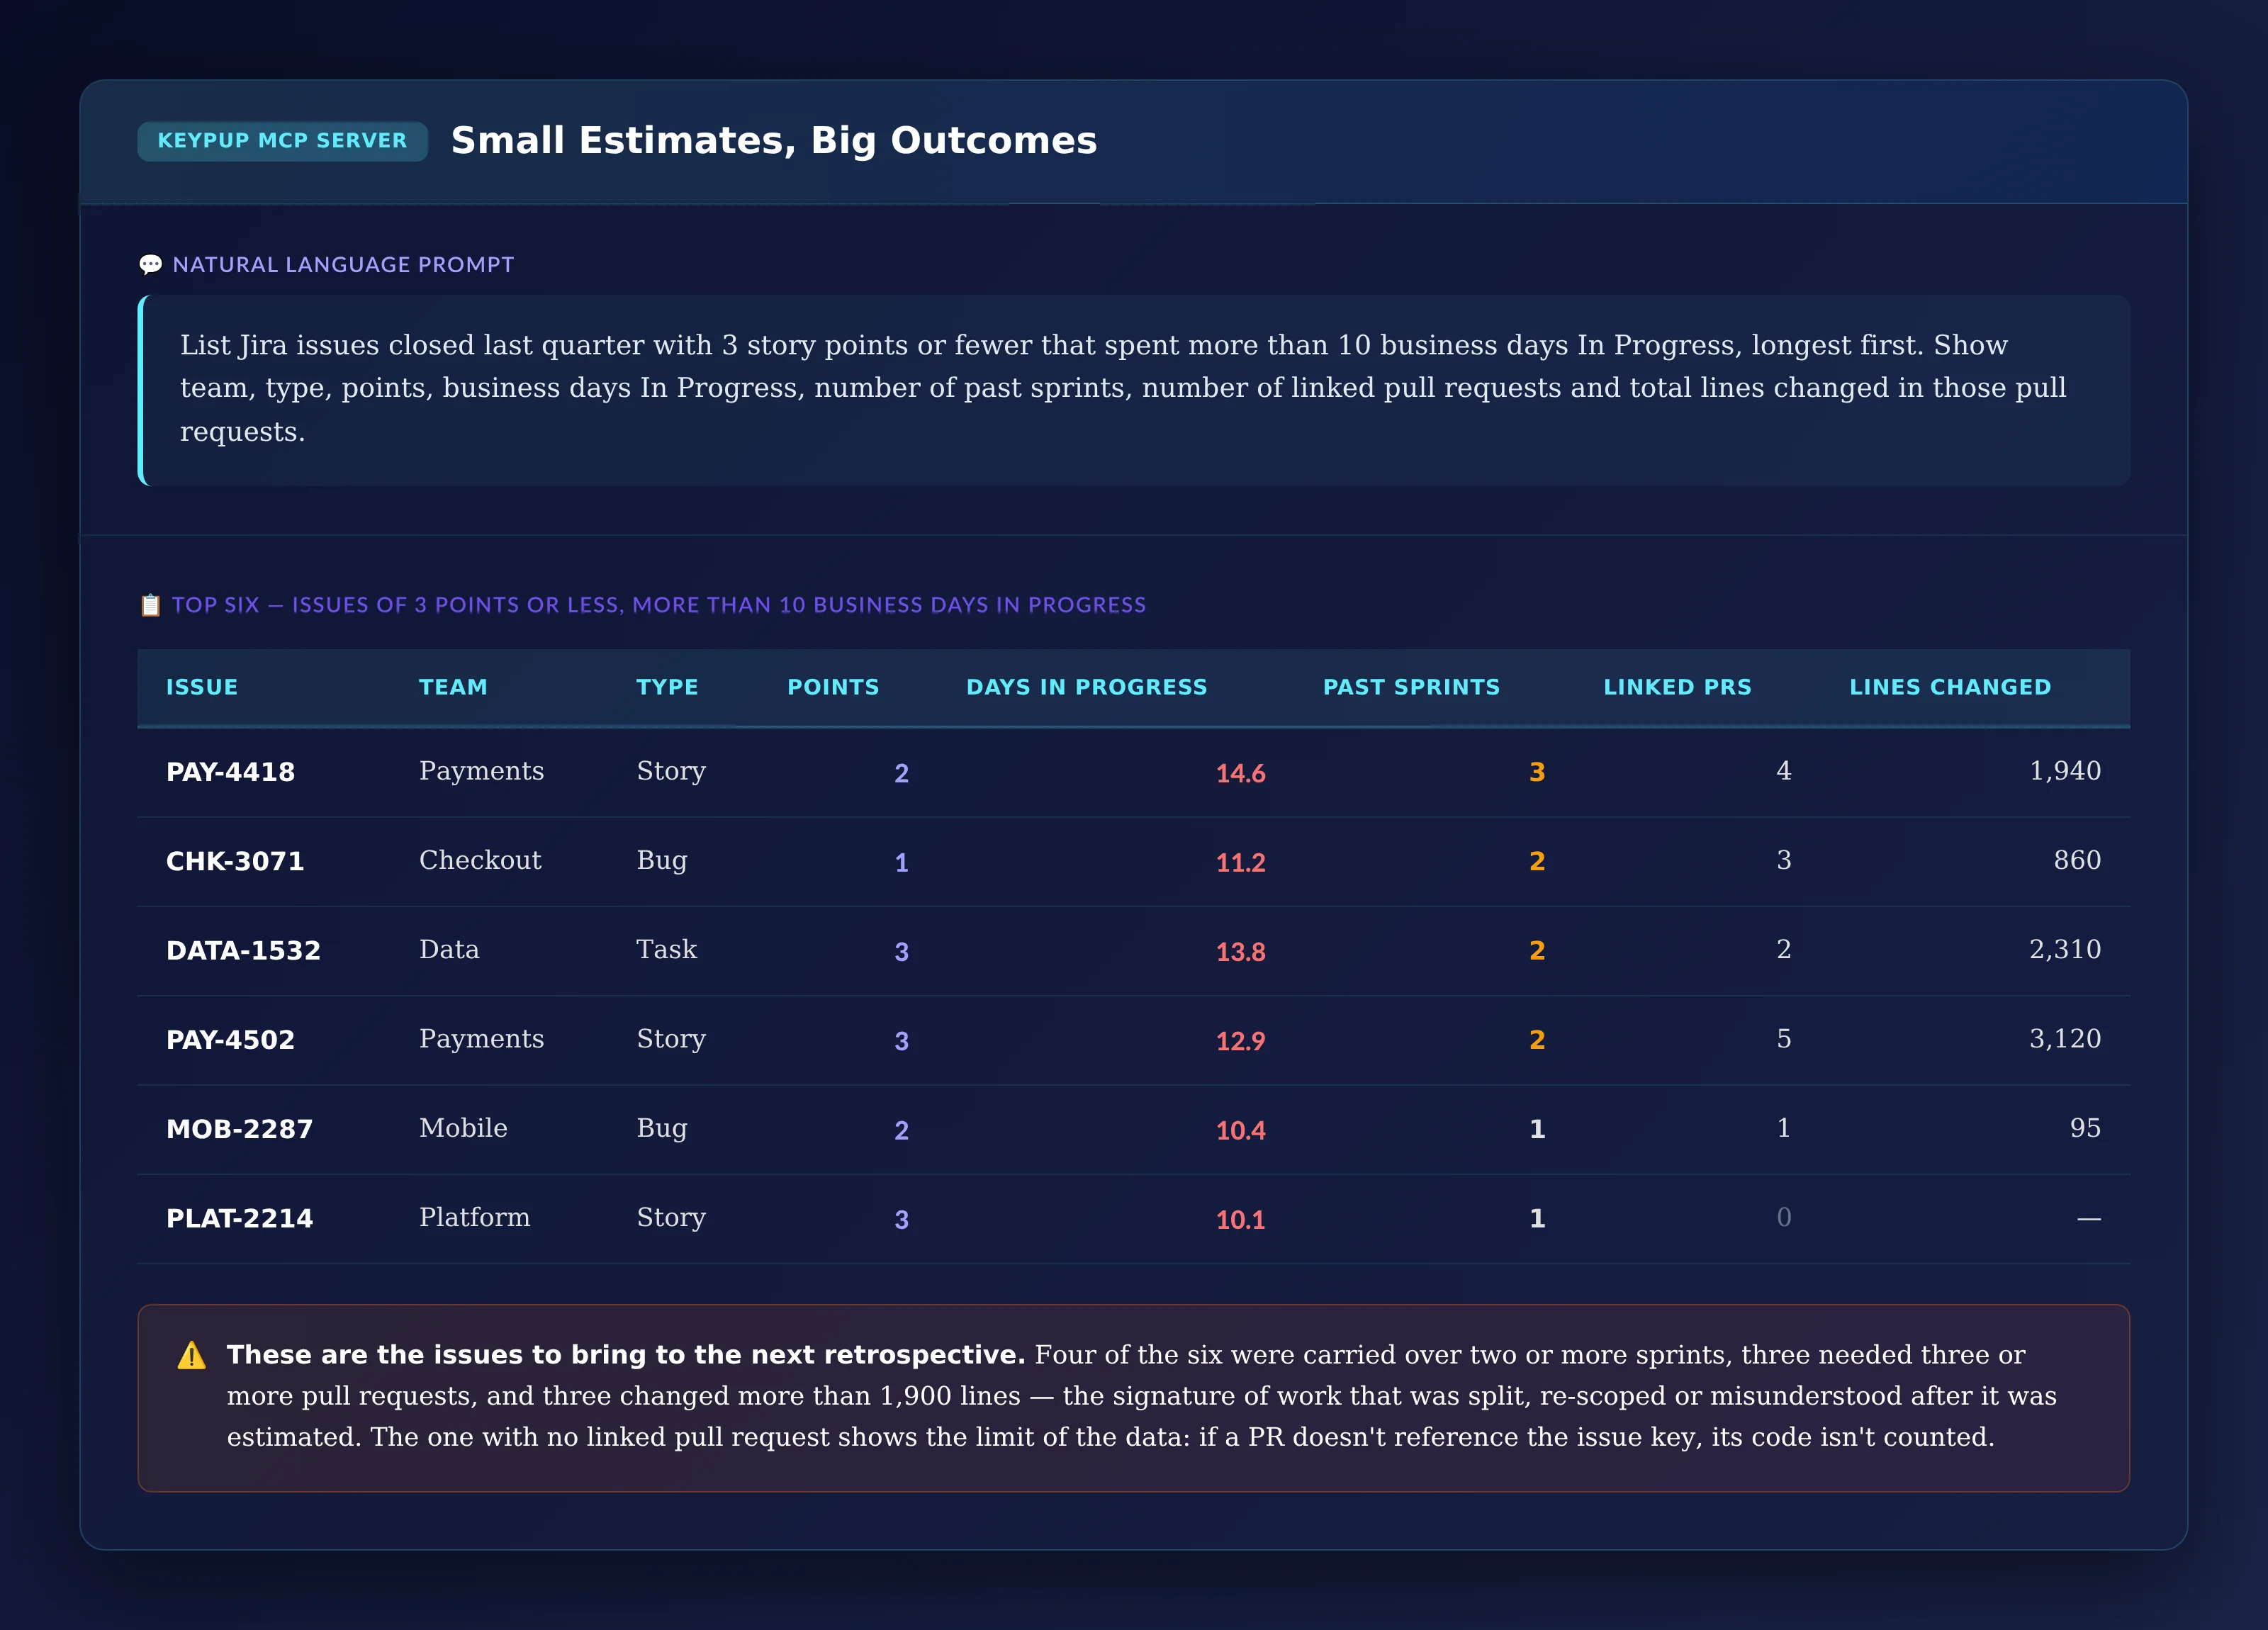
Output: Small Estimates, Big Outcomes
Issue
Team
Type
Points
Days In Progress
Past Sprints
Linked PRs
Lines Changed
PAY-4418
Payments
Story
2
14.6
3
4
1,940
CHK-3071
Checkout
Bug
1
11.2
2
3
860
DATA-1532
Data
Task
3
13.8
2
2
2,310
PAY-4502
Payments
Story
3
12.9
2
5
3,120
MOB-2287
Mobile
Bug
2
10.4
1
1
95
PLAT-2214
Platform
Story
3
10.1
1
0
—
Key Insight: Four of the six were carried over two or more sprints, three needed three or more pull requests, and three changed more than 1,900 lines — the signature of work that was split, re-scoped or misunderstood after it was estimated. The issue with no linked pull request shows the limit of the data: if a pull request doesn't reference the issue key, its code isn't counted.
The Technical Implementation: What Keypup MCP Actually Reads
Every number above comes from data Keypup already imports from Jira and your Git platform. It helps to be precise about what that data is — and what it isn't.
Estimates Come From the Jira Story Points Field
Keypup imports the Jira Story Points field with every issue (and other estimate fields, such as Story point estimate or Original estimate, as custom fields). Keypup reads the current value of the field — it does not keep a history of estimate changes — so if a team re-estimates an issue after the work is done, the analysis uses the final value. Issues without a story point value are left out of the point-based views.
Time In Progress Comes From the Workflow Timeline
For every Jira issue, Keypup stores a workflow timeline: each status the issue entered, in order, with the time it entered and left it. Time In Progress is the total business days the issue spent in the In Progress status, including any return visits. Waiting to start is the business days from creation to the first time it entered In Progress. Review and QA time come from the statuses your workflow uses for them. If your teams use other names — "In Development", "Code Review", "Testing" — use those exact names in the prompts. Business days use a standard Monday-to-Friday, 9-to-5 schedule by default; you can ask for a different time zone or working week in the prompt.
Sprint History Comes From Jira Sprints
Keypup imports each issue's current sprint and the past sprints it went through before it. "Carried over" means the issue went through at least one closed sprint before the one it was completed in. This only applies to teams that plan in Jira sprints.
Teams and Linked Pull Requests
Grouping by team uses your Jira Team field (or whichever custom field you use to assign issues to teams), so the team view only works if that field is filled in consistently. Linked pull requests and their lines changed come from pull requests that reference the Jira issue key; issues whose pull requests don't reference the key show no linked pull requests, even if code was written for them.
Real-World Impact: Enterprise Case Studies
Case Study 1: Global Financial Services Group
Before Keypup MCP:
Fourteen teams summed story points to commit to quarterly roadmap dates
More than half of quarterly commitments slipped, each with a different explanation
Refinement sessions grew longer every quarter as leadership asked for "better estimates"
After Keypup MCP:
The box plot showed 3-, 5- and 8-point issues overlapping almost completely, which ended the push for more detailed estimates
Forecasts moved from summing points to counting issues and using each team's historical time per issue, including waiting, review and QA
Refinement time was cut by roughly half, and quarterly commitments were set as ranges based on the past two quarters
"We spent years trying to make our estimates more accurate. When we finally compared them with what happened, we realized the estimate was never the problem — it only covered a quarter of the journey. Now we forecast from history, and our dates mean something."
— CTO, Global Financial Services Group
Case Study 2: Enterprise E-Commerce Platform
Before Keypup MCP:
Velocity was reported to the executive team and compared between teams
Average points per sprint rose sharply over eighteen months while release frequency stayed flat
Teams with lower velocity were asked to "catch up"
After Keypup MCP:
The points-per-issue trend showed estimates rising while time in development stayed flat, proving the velocity gains were inflation
The team heatmap showed a point cost up to four times more in some teams than others, so cross-team velocity comparisons were dropped
Executive reporting switched to closed issues and median calendar time per issue, with story points kept only for sprint planning inside each team
"Our velocity chart said we were 50% more productive. Our customers said nothing had changed. The data showed both were true — the points had grown, the work hadn't. We stopped reporting points upward the same month."
— VP Engineering, Enterprise E-Commerce Platform
Implementation: Getting Started with Keypup MCP
1. Connect Jira and Your Git Platform
Connect Jira and GitHub, GitLab or Bitbucket to Keypup. Story points, workflow status histories, sprints, custom fields and pull request links are imported automatically.
2. Confirm Your Estimate Field and Status Names
Check which field your teams use for estimates (Story Points, Story point estimate or another custom field) and the names of your development, review and QA statuses. Use those exact names in your prompts.
3. Check Your Field and Linking Hygiene
Confirm your teams fill in the Team field and that pull requests reference Jira issue keys. These two habits decide how precise the team view and the linked pull request data can be.
4. Connect the MCP Server to Your AI Assistant
Follow the MCP documentation to connect Keypup to Claude, ChatGPT, Cursor or any MCP-compatible assistant.
5. Set a Baseline and Change How You Forecast
Run the sizing, box plot and stage-breakdown prompts to set a baseline. Then forecast from history — issues closed and calendar time per issue — and bring the outlier list to retrospectives so teams learn from the estimates that missed.
Frequently Asked Questions
Do story points predict delivery time?
Usually only weakly. Within a single team, larger estimates tend to take somewhat longer in development, but the spread inside each point value is often wider than the gap between values, and points don't cover waiting, review or QA time. Compare your own estimates with actual time in progress to see how much they tell you.
How do you measure story point accuracy in Jira?
Group closed issues by story point value and compare the distribution of business days each spent in your development status. If the distributions overlap heavily, or time doesn't grow with points, the estimates aren't predicting effort. Keypup MCP computes this from the Jira Story Points field and the workflow timeline.
What is story point inflation?
Story point inflation is when the average estimate per issue keeps rising while the work itself doesn't get bigger. It typically happens when velocity is used as a performance target. Plot average points per closed issue against time in progress per issue: if points rise and time stays flat, the points have inflated.
Should we stop using story points?
Not necessarily. Points can still help a single team discuss complexity and fill a sprint. The problem is using them for things they can't do: cross-team comparisons, productivity tracking and roadmap dates. For forecasting, issue counts and historical calendar time per issue are usually more reliable.
The Bottom Line
Story points measure what a team expected, not what happened. Keypup MCP puts the two side by side so leaders can see how far apart they are:
✅ Sizing the gap — time in progress by point value and sprint carry-over ✅ Seeing the overlap — the full distribution behind every point value ✅ Proving inflation — points per issue against time per issue over time ✅ Comparing teams, so nobody adds up points in different currencies ✅ Showing where calendar time goes — waiting, development, review and QA ✅ Listing the small issues that blew up for every retrospective
When leaders can see what an estimate really predicts, they can stop asking for better guesses and start forecasting from evidence.
Get Started
Ready to find out what your story points really predict?
Start Free Trial — Connect Jira and your Git platform in minutes and compare your estimates with actual delivery today.
Request Demo — See how enterprise engineering leaders use Keypup MCP to replace point-based guesses with evidence-based forecasts.
View MCP Documentation — Technical details for engineering teams connecting Keypup MCP to Jira and their Git platform.
Keywords: story points, story point accuracy, estimation accuracy, story point inflation, velocity, Jira story points, delivery predictability, sprint carryover, software estimation, planning poker, engineering forecasting, MCP server engineering analytics
Ready to Transform Your Analytics?
Join teams already using AI to make data-driven decisions faster than
ever.
Compare the 5 best value stream analytics platforms for engineering leaders — Keypup, Pluralsight Flow, LinearB, Jellyfish and Swarmia — across DORA Metrics depth, cross-platform data unification, contextual analysis, customization, AI and natural language capabilities, and setup speed. Find out which value stream management platform turns Git, Jira and CI/CD data into prescriptive, actionable insights.
Ten-line pull requests get twenty comments. Two-thousand-line pull requests get "LGTM" in four minutes. Learn what engineering leaders on Reddit say about rubber-stamp code reviews in large organizations, why the problem stays invisible, and how Keypup MCP uses pull request size, review timestamps, approvals and comments to measure it repository by repository.
Enterprise Jira backlogs grow every month until nobody trusts them: thousands of zombie tickets, year-old "High" priorities and grooming sessions that change nothing. Learn what engineering leaders on Reddit say about backlog bankruptcy, why the problem stays invisible, and how Keypup MCP uses issue age, workflow history, priority, resolution and linked pull requests to measure it and plan a reset.