The Multi-Service "Release Train" Problem: Ending Distributed Blame Attribution
Enterprises with tightly coupled systems can't release one microservice at a time — dozens of teams get bundled onto synchronized "release trains" across shared databases and legacy message buses. When a train fails, standard SDLC dashboards flag every participating team with a Change Failure, even the ones whose code was completely stable. When one team's late pull request delays the whole train, nobody's metrics capture it. Discover how Keypup MCP performs root-cause attribution across repository boundaries, ending the finger-pointing that per-team dashboards can't resolve.
TL;DR: Modern SDLC analytics assume teams release decoupled microservices independently. Large enterprises with tightly coupled systems don't work that way — dozens of teams get bundled onto synchronized "release trains" across shared databases and legacy message buses. When a train fails or rolls back, standard dashboards flag every participating service with a Change Failure, penalizing teams whose artifacts were completely stable. When one team's delayed pull request causes the entire train to miss its slot, nobody's metrics capture the cascading dependency delay at all. The Keypup MCP Server solves this by attributing failures and delays to the specific commit and team responsible — across repository boundaries — turning distributed blame into precise, defensible accountability.
Ask an engineer at a bank, an airline, or a large retailer what happens after a "release train" rollback, and the answer is rarely about the code. It's about the meeting that follows — the one where nine teams argue about whose Change Failure it actually was.
The Friction: SDLC Analytics Assume Decoupled Releases
DORA metrics and most SEI platforms were built around a simple mental model: one team, one service, one independent deployment. That model breaks down the moment a release requires coordinated, synchronized deployment across multiple backend services, a legacy message bus, and two or three frontend applications — which is exactly how large enterprises with tightly coupled systems have to ship.
One rollback, nine "failures." When a synchronized release fails and gets rolled back, standard analytics register a Change Failure against every service bundled into that release — not just the one whose commit actually broke it.
Root cause is invisible across repo boundaries. Per-team dashboards are scoped to a single repository. None of them can see that the actual defect lived in one service's commit while eight others shipped completely stable code.
Cascading delay has no metric at all. If one team's pull request lands late and the entire train misses its scheduled deployment window, nothing in a standard SDLC dashboard captures "team X's delay cost teams A through H their slot." Every other team just shows up as part of a "delayed release," with no attribution to the actual cause.
The dashboard becomes the argument. Because the tooling can't distinguish "my commit broke it" from "I happened to be on the same train," the debrief after every failed release train turns into a political negotiation instead of a data-backed root-cause analysis.
None of this is a tooling failure in the traditional sense — it's a scope mismatch. The metric was built for independent services and is being asked to explain a tightly coupled distributed system.
Why This Matters: Blame Without Boundaries Erodes Trust Fastest
The Fairness Problem
Nothing damages trust in engineering analytics faster than a scoreboard that visibly gets the wrong answer. When five stable teams see their Change Failure Rate spike because a sixth team's service broke, they stop trusting the metric — and often stop trusting each other.
The Incentive Problem
If blanket attribution persists, teams rationally start avoiding synchronized releases altogether, padding their own schedules, or quietly negotiating to be pulled off shared trains — undermining the very coordination the release train model was designed to achieve.
The Root-Cause Problem
Distributed systems fail at their seams, not usually inside any single service. A metric that can't cross repository boundaries can't see the seam — which means it can't help anyone actually fix the coordination problem that caused the failure in the first place.
The Enterprise Discussion: What Engineers Are Actually Saying
This exact frustration shows up constantly wherever engineers at large, tightly coupled enterprises compare notes on release trains.
Senior SRE, National Retail Chain (r/sre)
"Our release train bundles eleven services every other week. Last rollback, our team's Change Failure Rate jumped because we happened to be scheduled on the same train as the service that actually broke — our code didn't move an inch. I spent more time in the postmortem defending a metric than anyone spent finding the actual root cause."
Engineering Manager, Airline IT (r/ExperiencedDevs)
"The metric that would actually help nobody tracks: my team was ready two hours before the slot, and one other team's late PR pushed the whole train back four hours. On paper it looks like 'the 6pm release was delayed' with zero indication of whose delay it actually was. We all get lumped into 'the release that slipped,' and then it's back to Slack archaeology to figure out who to talk to."
The pattern is consistent: the failure isn't hard to find — it's just invisible to tools scoped to a single repository. Engineering teams already know how to do root-cause analysis. What they don't have is a metric that crosses the train's repository boundaries automatically, every time, without a manual investigation.
How Keypup MCP Solves Release Train Blame Attribution
The Keypup Model Context Protocol (MCP) Server treats a release train as what it actually is — a single coordinated event spanning multiple repositories — instead of a set of unrelated per-team deployments that happen to share a timestamp. It attributes failures to the specific commit that caused them, quantifies cascading delay by team, and gives every participating team a defensible, root-cause-accurate record.
1. Separating Who Was Flagged From Who Was Actually at Fault
The first question after any train rollback is simple, and standard dashboards can't answer it: how many of these "failures" are real?
MCP Prompt:
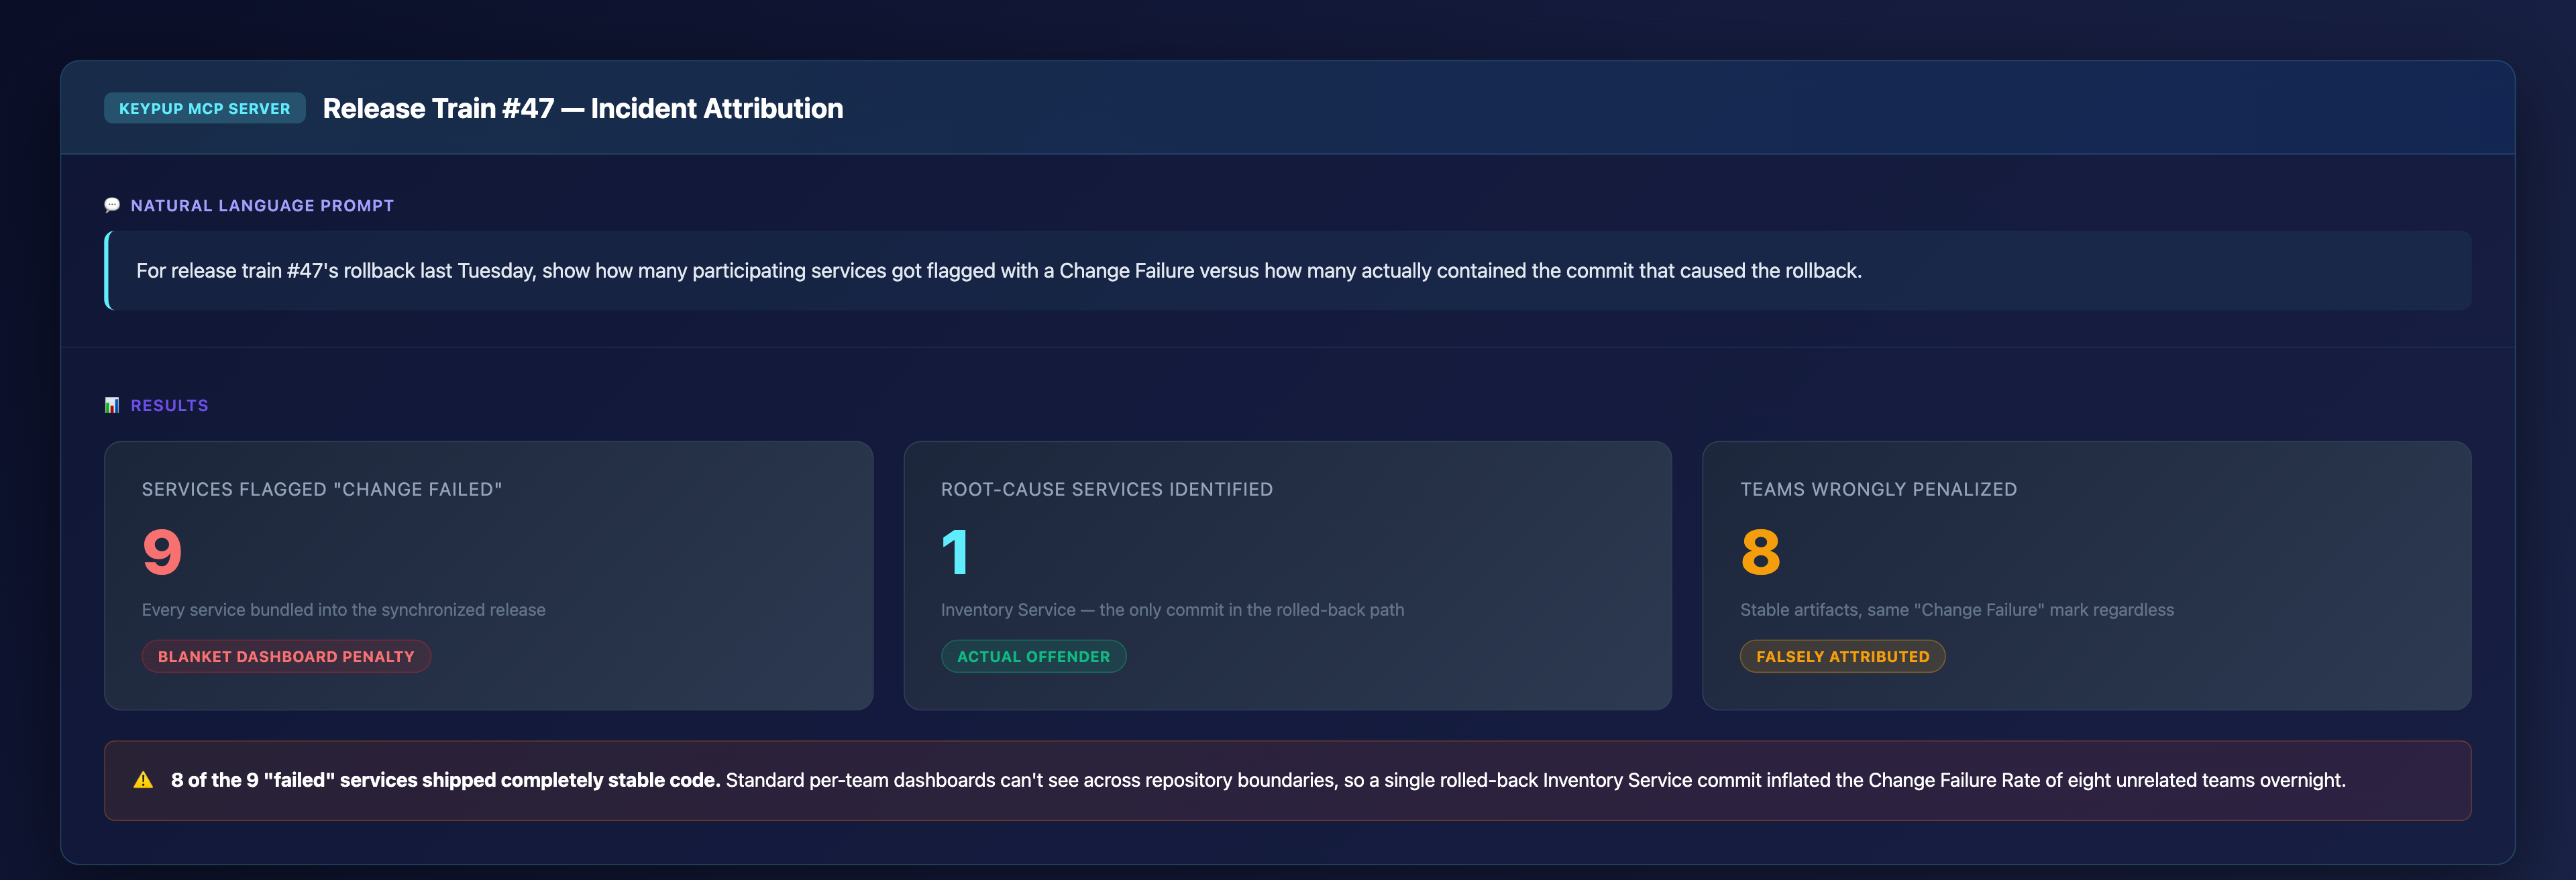
For release train #47's rollback last Tuesday, show how many
participating services got flagged with a Change Failure versus
how many actually contained the commit that caused the rollback.
Output: Release Train #47 — Incident Attribution
Key Insight: 8 of the 9 "failed" services shipped completely stable code. Standard per-team dashboards can't see across repository boundaries, so a single rolled-back Inventory Service commit inflated the Change Failure Rate of eight unrelated teams overnight.
2. Proving the Blanket Metric Hides the Real Repeat Offender
A single incident is an anecdote. A per-team comparison across every train shows whether the blanket metric is systematically hiding the same team every time.
MCP Prompt:
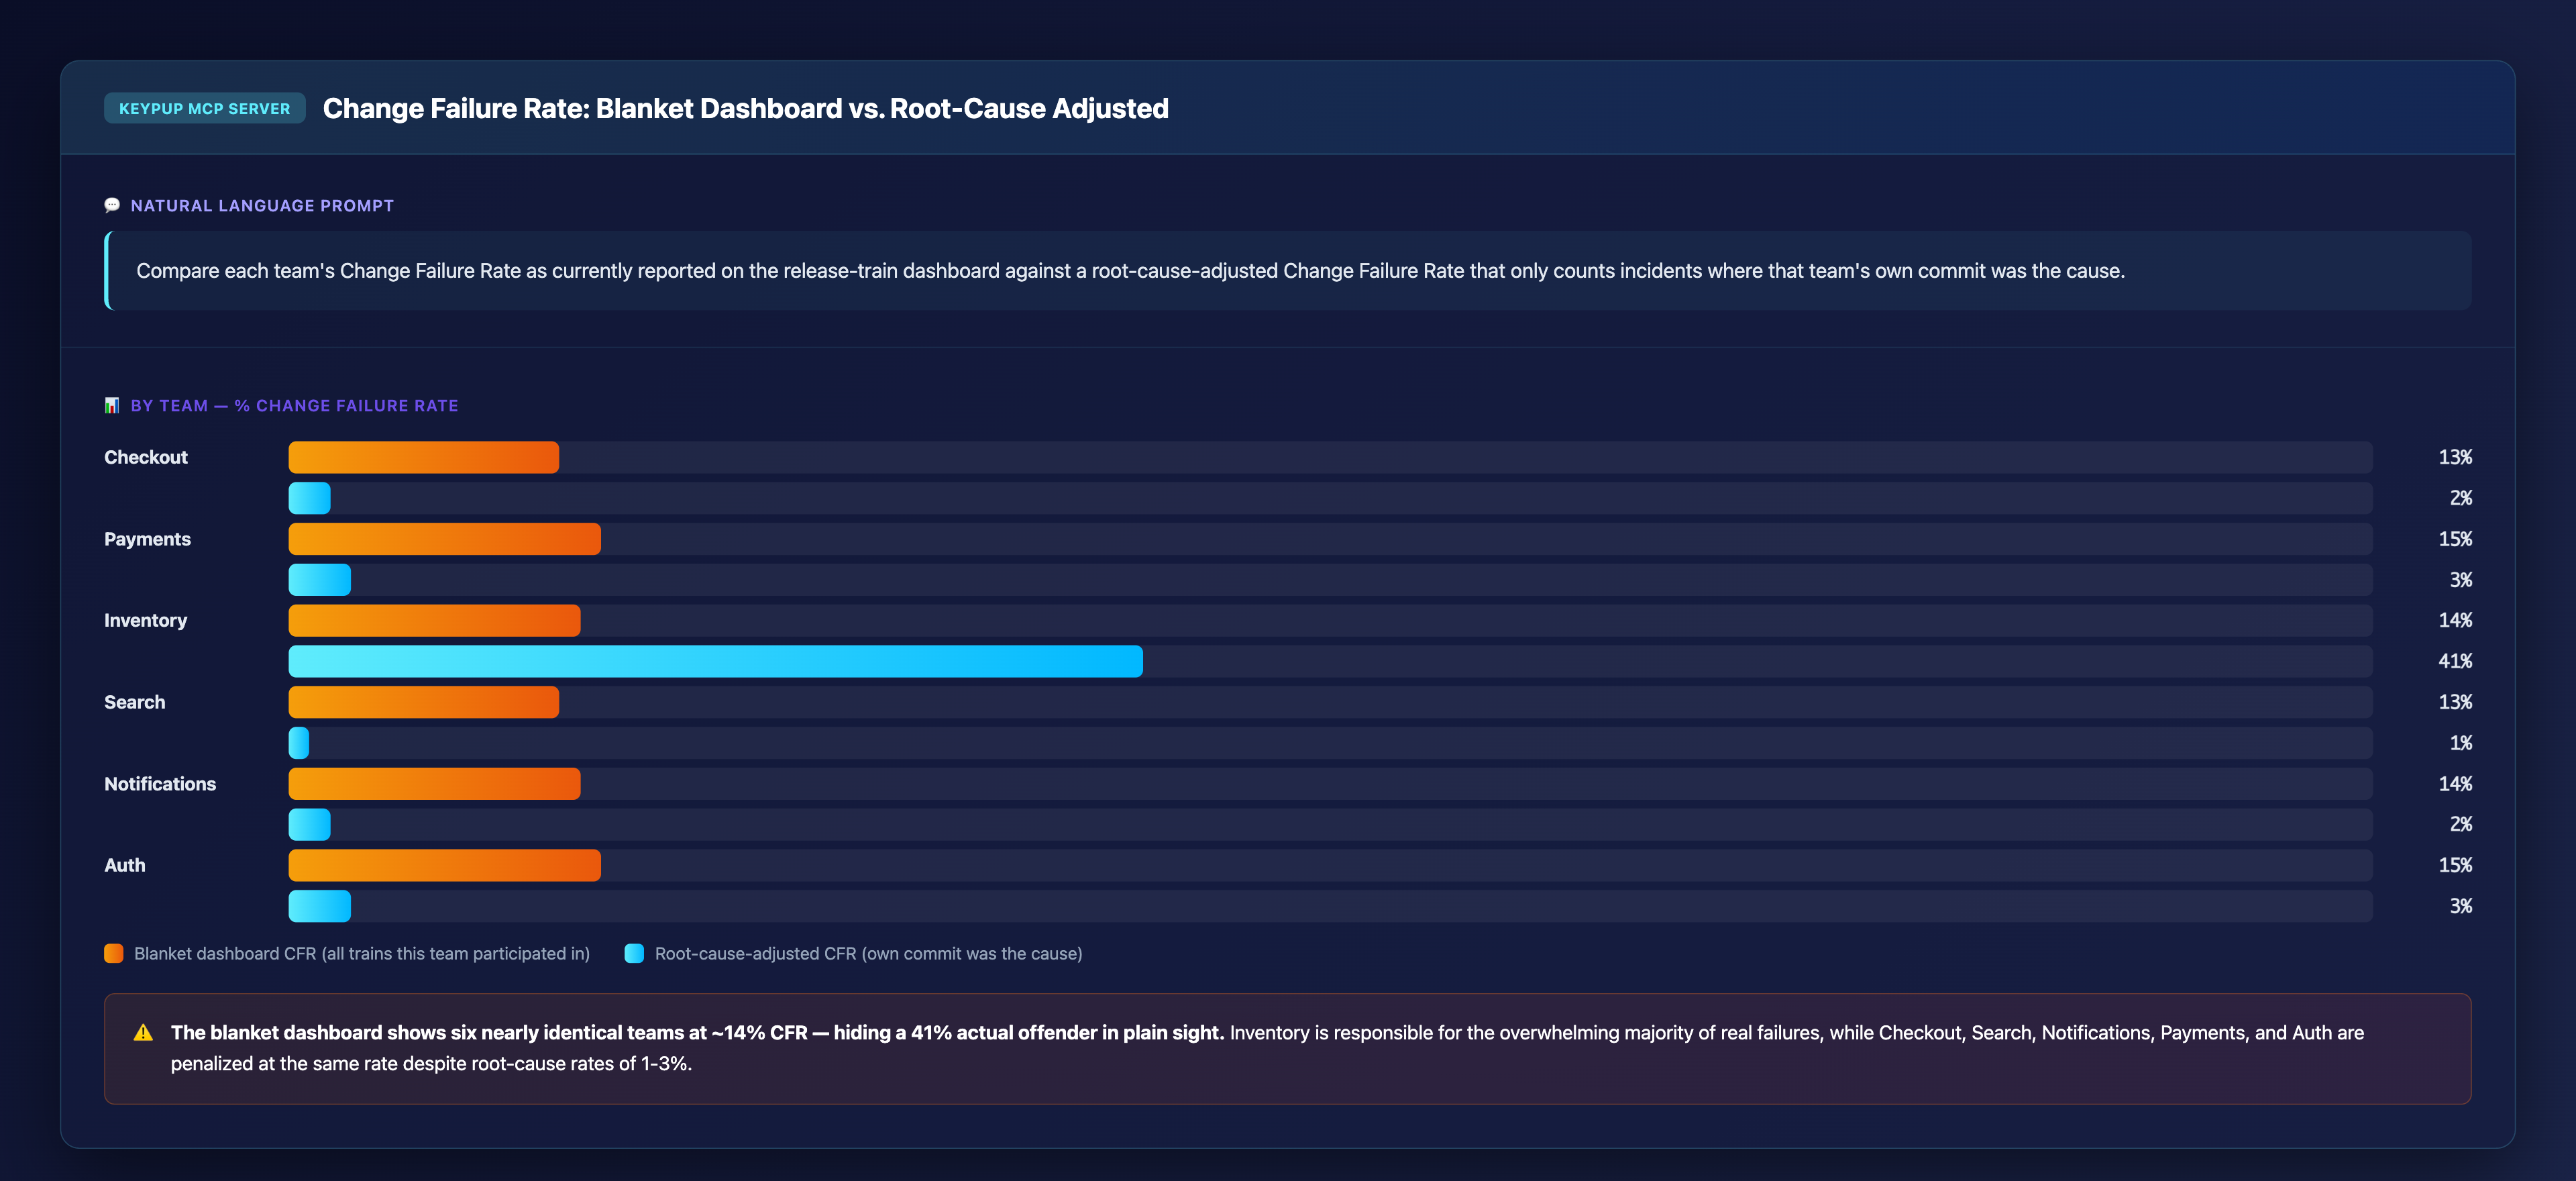
Compare each team's Change Failure Rate as currently reported on
the release-train dashboard against a root-cause-adjusted Change
Failure Rate that only counts incidents where that team's own
commit was the cause.
Output: Change Failure Rate — Blanket Dashboard vs. Root-Cause Adjusted
Key Insight: The blanket dashboard shows six nearly identical teams at ~14% CFR — hiding a 41% actual offender in plain sight. Inventory is responsible for the overwhelming majority of real failures, while Checkout, Search, Notifications, Payments, and Auth are penalized at the same rate despite root-cause rates of 1-3%.
3. Quantifying Cascading Delay, Not Just Cascading Failure
Failures aren't the only thing that gets misattributed. A missed deployment slot needs the same root-cause treatment.
MCP Prompt:
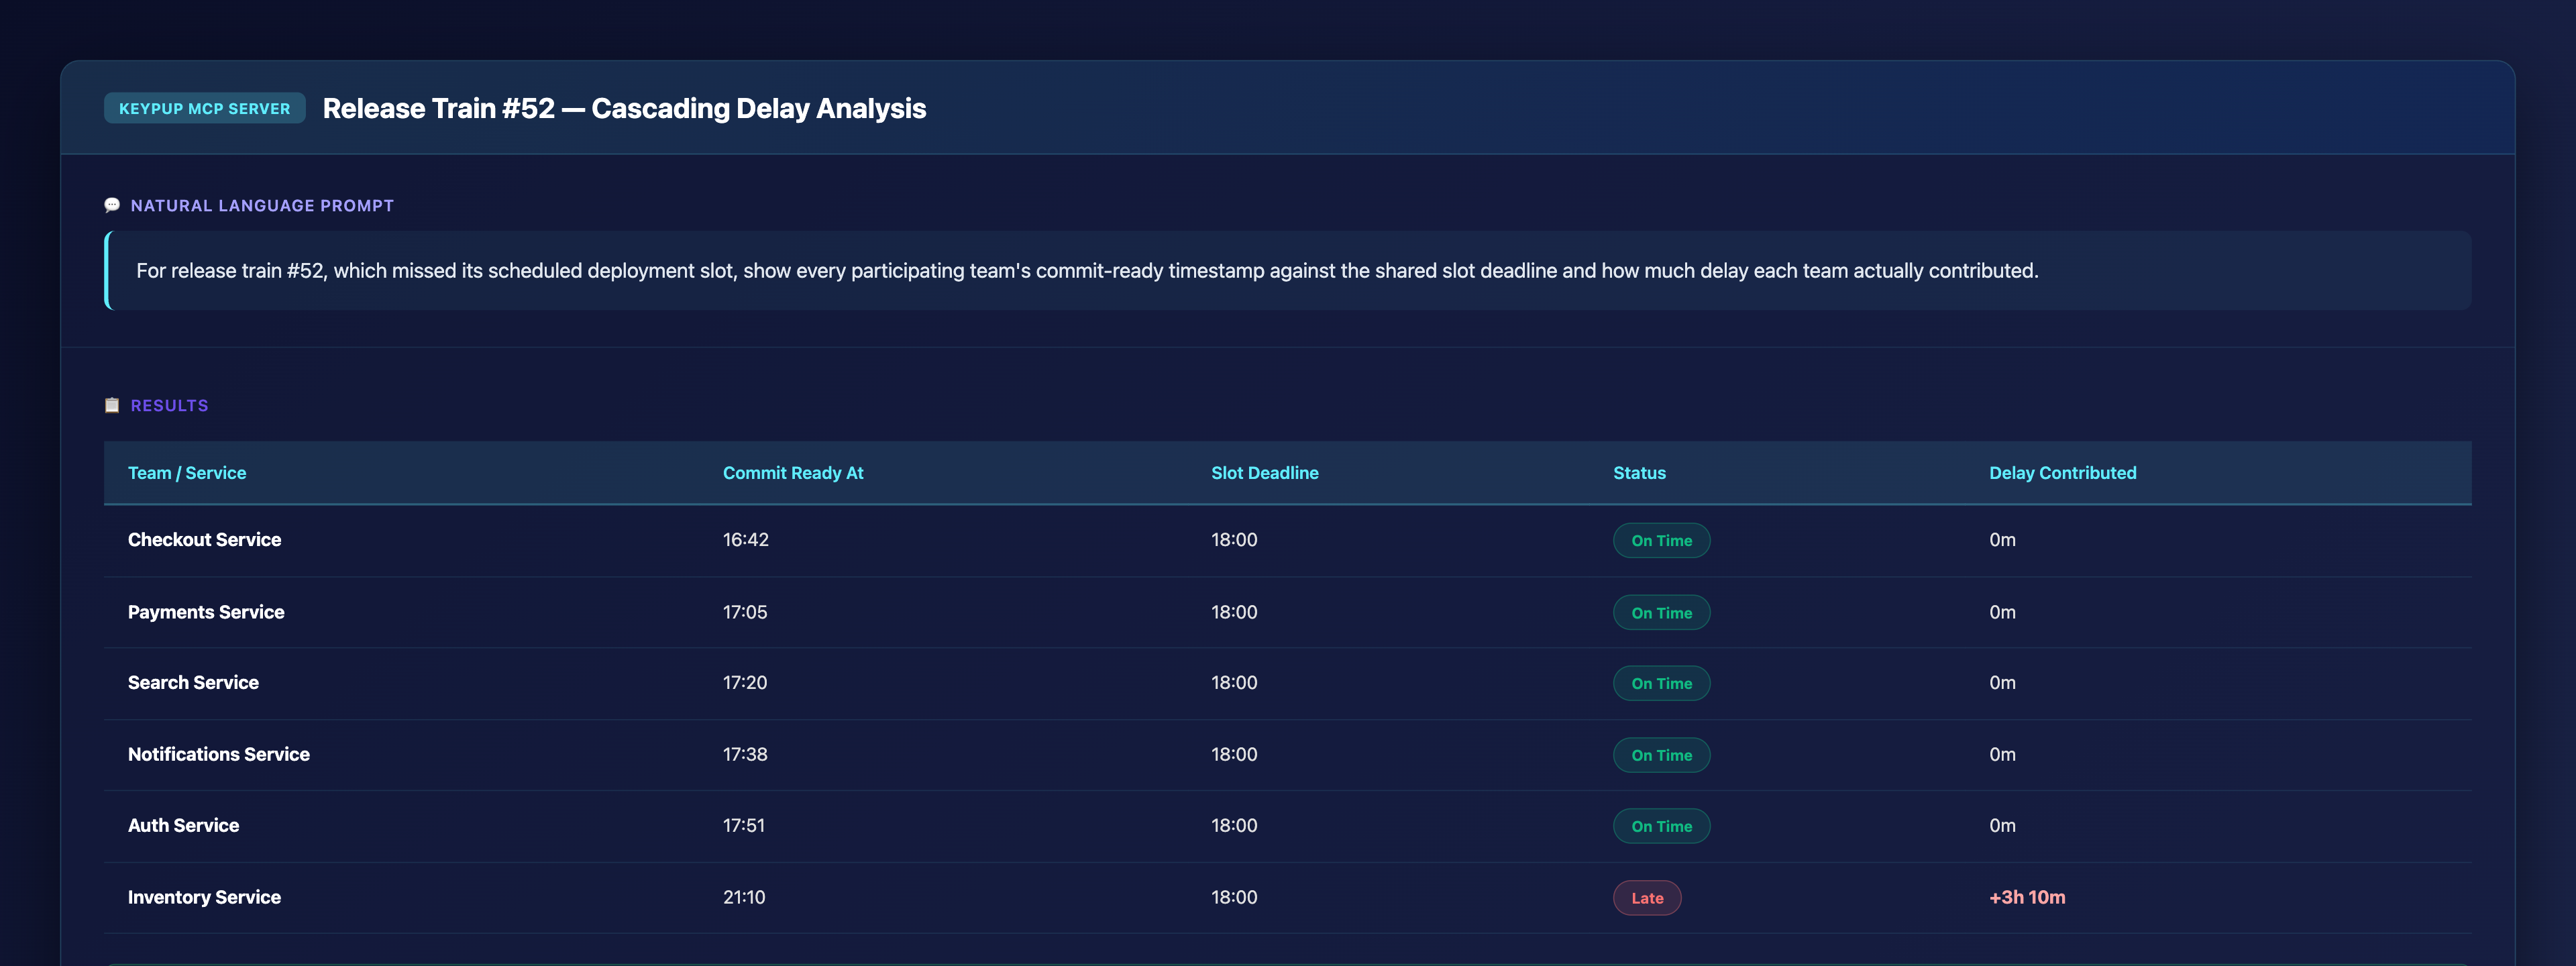
For release train #52, which missed its scheduled deployment
slot, show every participating team's commit-ready timestamp
against the shared slot deadline and how much delay each team
actually contributed.
Key Insight: Five of six teams were ready up to 1h18m before the deadline — only Inventory Service caused the miss. Standard per-team dashboards would have shown all six teams as "part of a delayed release" with no way to see which one actually cost the other five their scheduled slot.
4. Showing Leadership How Big the Measurement Gap Really Is
One chart, tracked across every train, proves the blanket metric isn't just wrong occasionally — it's wrong by a consistent, quantifiable margin.
MCP Prompt:
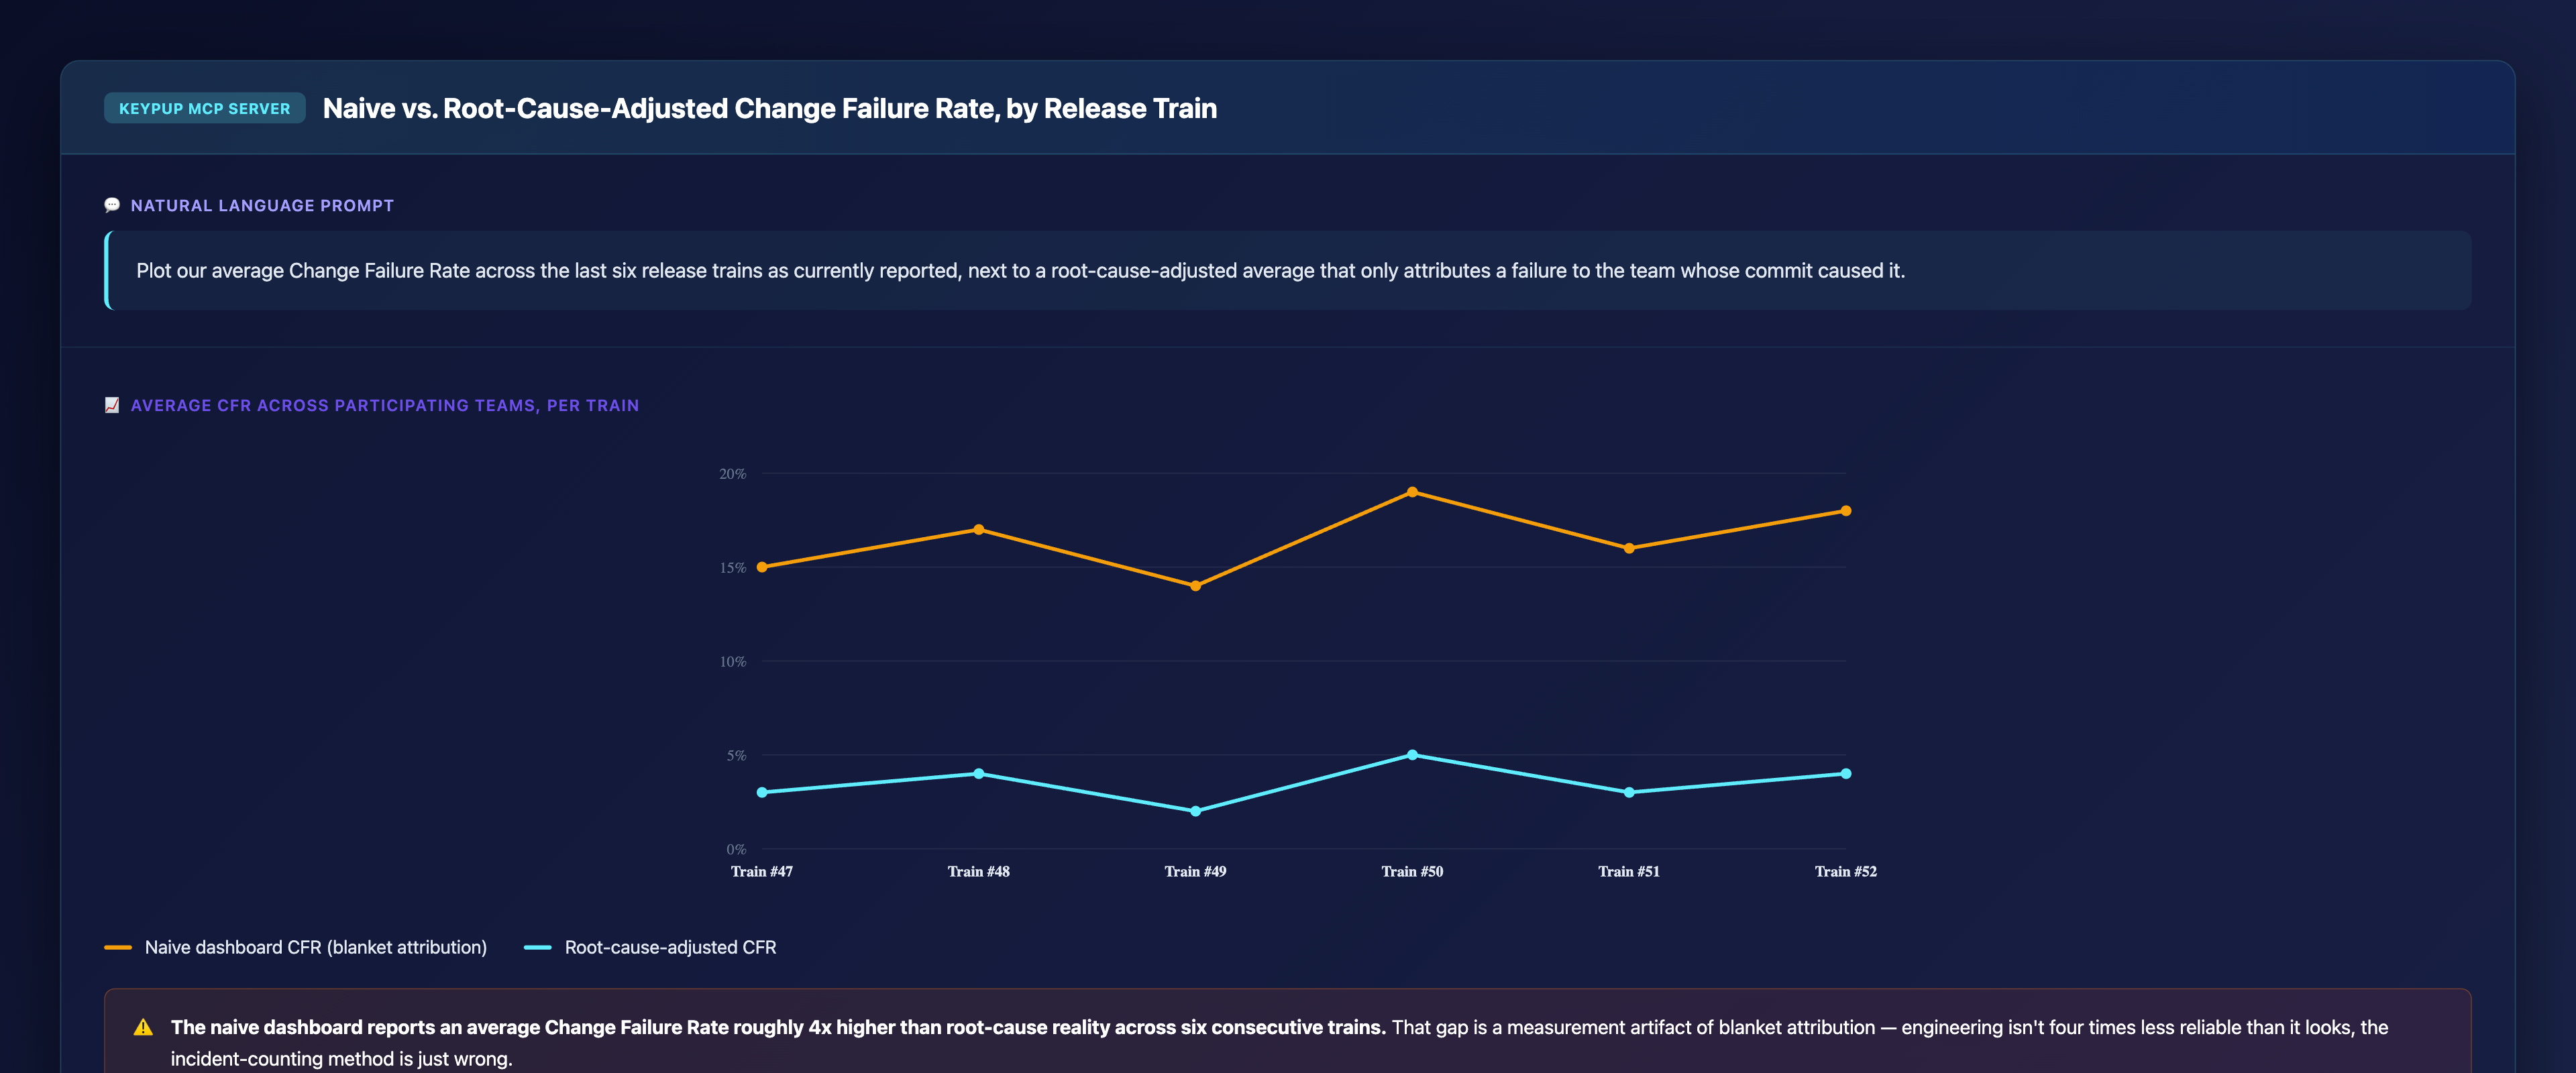
Plot our average Change Failure Rate across the last six release
trains as currently reported, next to a root-cause-adjusted
average that only attributes a failure to the team whose commit
caused it.
Output: Naive vs. Root-Cause-Adjusted Change Failure Rate, by Release Train
Key Insight: The naive dashboard reports an average Change Failure Rate roughly 4x higher than root-cause reality across six consecutive trains. That gap is a measurement artifact of blanket attribution — engineering isn't four times less reliable than it looks, the incident-counting method is just wrong.
5. Giving Every Team a Standing, Defensible Accountability Record
Once root cause is established for individual incidents, leadership needs an ongoing scorecard that shows accountability accumulating correctly over time, not just per incident.
MCP Prompt:
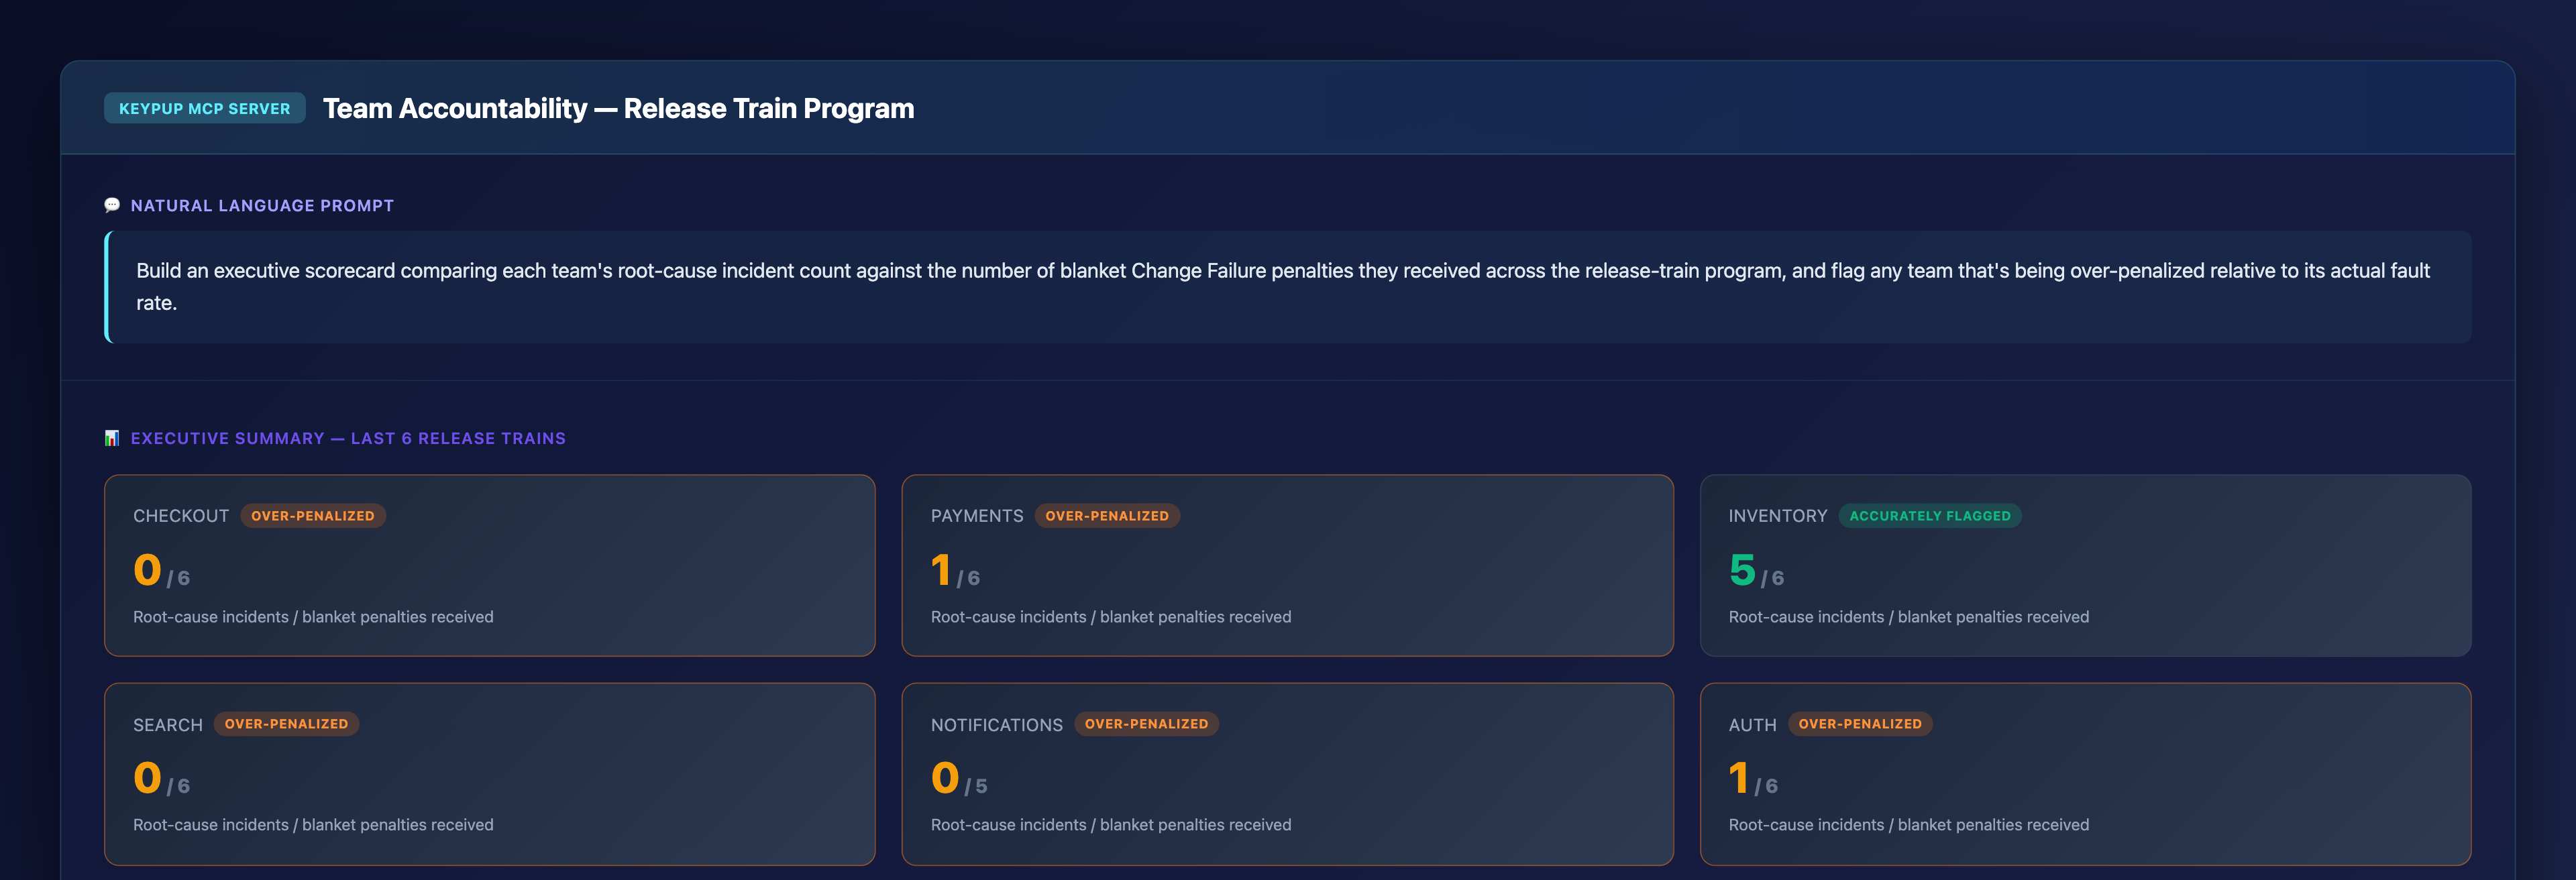
Build an executive scorecard comparing each team's root-cause
incident count against the number of blanket Change Failure
penalties they received across the release-train program, and
flag any team that's being over-penalized relative to its actual
fault rate.
Output: Team Accountability — Release Train Program
Key Insight: Inventory caused 5 of 6 root-cause incidents yet received the same 6 blanket penalties as teams responsible for zero or one. Five stable teams are carrying a reliability score that belongs almost entirely to a single service — the scorecard finally puts accountability where the commits actually are.
The Technical Implementation: How Keypup MCP Crosses Repository Boundaries
Release Trains as a First-Class Object
Keypup MCP models a synchronized release train as a single event linking every participating repository, commit, and deployment — not a coincidence of shared timestamps across unrelated dashboards. That's what makes cross-repository root-cause attribution possible instead of a manual, after-the-fact investigation.
Commit-Level Fault Isolation
When a release train fails or rolls back, Keypup MCP traces the failure back to the specific commit and repository that caused it, so a Change Failure only counts against the team whose code was actually in the rolled-back path.
Slot-Aware Delay Attribution
Every participating team's commit-ready timestamp is tracked against the shared deployment slot deadline, so a missed release window can be attributed to whichever team's delay actually pushed the schedule, not the five teams who were ready on time.
Real-World Impact: Enterprise Case Studies
Case Study 1: National Retail Chain
Before Keypup MCP:
Every synchronized release train rollback triggered a Change Failure flag across all eleven participating services, regardless of which one's commit caused it
Postmortems routinely spent the first 30-45 minutes re-litigating whose "failure" it actually was before any real root-cause work began
Three stable teams had repeatedly elevated Change Failure Rates purely from being scheduled on trains with unrelated services
After Keypup MCP:
Root-cause attribution became automatic for every train rollback, tracing the failure to the specific commit and team responsible
Postmortems dropped the blame-finding phase entirely, starting directly from a confirmed root cause
Three previously "high-CFR" teams saw their root-cause-adjusted rate fall below 3%, closing a credibility gap that had lasted over a year
"We used to spend the first half of every postmortem arguing about attribution before we could even start the actual analysis. Now the root cause is on the screen before the meeting starts, and we spend the whole hour on the fix instead of the fight."
— VP Engineering, National Retail Chain
Case Study 2: Regional Airline IT Organization
Before Keypup MCP:
A single team's chronically late pull requests had delayed the shared release train on four of the last six cycles, with no metric that isolated the pattern
Other teams absorbed the reputational cost of "the release slipped again" with no way to show they'd been ready on schedule
Leadership had no data to justify reallocating headcount or timeline pressure to the actual bottleneck team
After Keypup MCP:
Cascading delay attribution confirmed the same team as the root cause in three of the next four release trains, replacing suspicion with a documented pattern
Four previously blamed teams were formally cleared in the program's standing accountability scorecard
Engineering leadership reallocated senior support to the bottleneck team directly, based on the delay-attribution data rather than anecdote
"Once we could show exactly whose delay pushed the slot, four times out of six, the conversation stopped being about blame and started being about capacity. That's a completely different — and much more useful — meeting."
— Director of Release Engineering, Regional Airline
Implementation: Getting Started with Keypup MCP
1. Model Your Release Trains as Single Events First
Before attributing anything, make sure every participating repository and service is linked to the same release-train event in your analytics — attribution across boundaries only works if the boundaries are mapped first.
2. Separate "Flagged" From "At Fault" in Every Report
Stop reporting a single Change Failure Rate per team. Report both the blanket, train-level flag and the root-cause-adjusted rate side by side, so nobody has to argue about which one is real.
3. Query in Natural Language, Across Every Repository
No manual Slack archaeology required. Just ask:
"Which service actually caused last week's release train rollback?"
"Show every team's root-cause-adjusted Change Failure Rate this quarter"
"Which team's delay caused our last three missed deployment slots?"
"Build an accountability scorecard for the release-train program"
4. Automate Recurring Root-Cause Reporting
Schedule recurring queries for:
Automatic root-cause attribution the moment a release train rollback occurs
Monthly root-cause-adjusted Change Failure Rate by team, alongside the blanket figure
Cascading delay attribution for every missed deployment slot
Standing accountability scorecards ahead of program-level leadership reviews
The Bottom Line: Distributed Systems Need Distributed-Aware Metrics
A metric built for independent microservices will always misattribute blame in a tightly coupled release train — not occasionally, but systematically, every time a train fails or slips. Fixing it requires:
✅ Modeling release trains as single, cross-repository events, not a coincidence of shared timestamps ✅ Separating "flagged" from "at fault" in every Change Failure report, every time ✅ Attributing cascading delay to the team that actually caused it, not the five teams who were ready on schedule ✅ Quantifying the size of the measurement gap, so leadership sees it's systematic, not anecdotal ✅ Maintaining a standing, defensible accountability record instead of re-litigating fault after every incident
Keypup MCP turns "whose fault was the release train" from a recurring political argument into a precise, cross-repository answer — giving every team, and every leader trying to referee between them, the receipts the metric alone was never able to provide.
Get Started
Ready to stop the blame game after every release train incident?
Start Free Trial — Connect your engineering stack in minutes and start attributing release train failures and delays to their actual root cause.
Request Demo — See how enterprise engineering leaders use Keypup MCP to resolve distributed blame across coordinated releases.
View MCP Documentation — Technical details for engineering teams implementing Keypup MCP across multi-service release trains.
In regulated enterprises — finance, healthcare, telecom — code can be written, tested, and merged in three hours, then sit for two to three weeks waiting on a Change Advisory Board slot. DORA's Lead Time for Changes can't tell the difference between active engineering work and passive bureaucratic wait, so executive dashboards flag a "velocity problem" that doesn't exist. Discover how Keypup MCP decomposes Lead Time into engineering-controlled time versus CAB queue wait, exposes SLA-breaching change categories, and gives engineering leadership the receipts to stop absorbing blame for a compliance calendar.
Centralizing SDLC data across ten business units exposes a governance vacuum long before it delivers insight: seven competing "story point" scales, four business units with no named data owner, and a workflow taxonomy nobody was ever assigned to define. This isn't a GDPR problem — it's a political and technical negotiation over who owns what data, and who is accountable when a poorly maintained JIRA board quietly skews a portfolio-wide metric. Discover how Keypup MCP makes data ownership, definition consistency, and governance maturity measurable across every business unit.
Rolling out SDLC analytics across an enterprise takes more than an engineering VP's buy-in. If HR misreads flow metrics in performance reviews, or Product Management keeps demanding features while ignoring system health, the initiative quietly becomes an "engineering-only project" that never earns organization-wide trust. Discover how Keypup MCP builds the guardrails, translations, and cross-functional accountability that make SDLC analytics stick beyond engineering.