Change Management and Cross-Functional Alignment: Getting HR, Product, and Marketing to Trust Engineering Metrics
Rolling out SDLC analytics across an enterprise takes more than an engineering VP's buy-in. If HR misreads flow metrics in performance reviews, or Product Management keeps demanding features while ignoring system health, the initiative quietly becomes an "engineering-only project" that never earns organization-wide trust. Discover how Keypup MCP builds the guardrails, translations, and cross-functional accountability that make SDLC analytics stick beyond engineering.
Liam Davis
•13 min read
Table of Contents
TL;DR: Enterprise-wide adoption of SDLC analytics fails for a predictable reason: it becomes an engineering-only initiative the moment HR misreads flow metrics for performance reviews, or Product Management keeps demanding features without acknowledging system health data. Without executive sponsorship spanning HR, Product, and Marketing — not just Engineering — even the best analytics platform breeds mistrust instead of a data-driven culture. The Keypup MCP Server solves this by making cross-functional adoption, metric misuse risk, and departmental trust directly measurable — turning change management from a vague mandate into a tracked, accountable rollout.
Successful enterprise-wide adoption of SDLC analytics requires a significant cultural shift and genuine buy-in — not just from engineering, but from Human Resources, Product Management, and even Marketing. Most rollouts get the technology right and the change management wrong, and the platform quietly becomes shelfware outside the one department that requested it.
The Friction: An Engineering Champion Isn't an Enterprise Rollout
A VP of Engineering can champion the tools, run the pilot, and even get glowing feedback from their own team. None of that guarantees the rest of the organization uses the data responsibly, or uses it at all.
Human Resources doesn't understand how to interpret flow metrics for performance reviews — or worse, misuses them, turning commit frequency or story points into an informal productivity ranking nobody signed off on
Product Management keeps demanding features on the old cadence, without ever factoring system health metrics — tech debt, reliability, security — into roadmap conversations
Marketing and other departments were never looped in at all, so the initiative reads internally as "engineering's dashboard," not a company-wide capability
No executive sponsorship exists outside Engineering, so when priorities compete for budget or attention next quarter, there's no one at the table advocating for the initiative from HR's or Product's side
Lack of executive sponsorship across departments means the initiative can easily become an "engineering-only" project that fails to drive broader organizational change — no matter how good the underlying data is.
Why This Matters: Mistrust Compounds Faster Than Adoption
The Trust Problem
Translating engineering insights into actionable strategy for non-technical stakeholders is a genuinely uphill battle. When a flow metric gets misapplied even once — an engineer flagged for a "low" cycle time that was actually a complex, well-reviewed change — trust in the entire platform erodes across that department, not just for that one metric. Rebuilding that trust takes far longer than it took to break it.
The Change Management Problem
Training and change management efforts are massive undertakings in large organizations, and they don't happen by accident. Without strong, unified leadership — ideally from the CEO down — and clear communication across every relevant department, SEI platforms risk becoming expensive, underutilized tools that breed mistrust rather than foster a genuinely data-driven culture.
The Enterprise Discussion: What Engineering Leaders Are Actually Saying
This exact tension — real insight, undermined by uneven cross-functional buy-in — shows up constantly wherever engineering leaders compare notes on rolling out SDLC analytics.
"We had a beautiful dashboard and a miserable rollout. HR started pulling deploy frequency into performance conversations without ever asking us what it meant. By the time we found out, three engineers already felt like they'd been quietly graded on a metric they didn't know was being tracked. We spent more time doing damage control with HR than we spent building the actual analytics."
Director of Engineering, Financial Services (r/devops)
"Product Management still asks for feature commitments as if tech debt is invisible. We can show them the system health data every sprint planning and it doesn't move the roadmap conversation, because nobody above them is asking them to factor it in. It's not a tooling problem at this point — it's that no executive outside engineering has ever been told this is their job too."
The pattern is consistent: the data isn't the obstacle — the ownership is. Engineering can build the analytics. It cannot, by itself, force HR to interpret metrics correctly or force Product Management to weigh system health against feature velocity. That requires cross-functional accountability the tool has to make visible.
How Keypup MCP Solves Change Management and Cross-Functional Alignment
The Keypup Model Context Protocol (MCP) Server treats cross-functional adoption as a measurable outcome, not a hoped-for side effect. It surfaces exactly where the rollout is becoming an engineering-only project, where metrics are at risk of misuse, and where trust is recovering or eroding — giving change management leaders the same rigor engineering already applies to its own metrics.
1. Making the "Engineering-Only Project" Pattern Visible
Before you can fix uneven adoption, you need a clear, current picture of who is actually using the platform outside Engineering.
MCP Prompt:
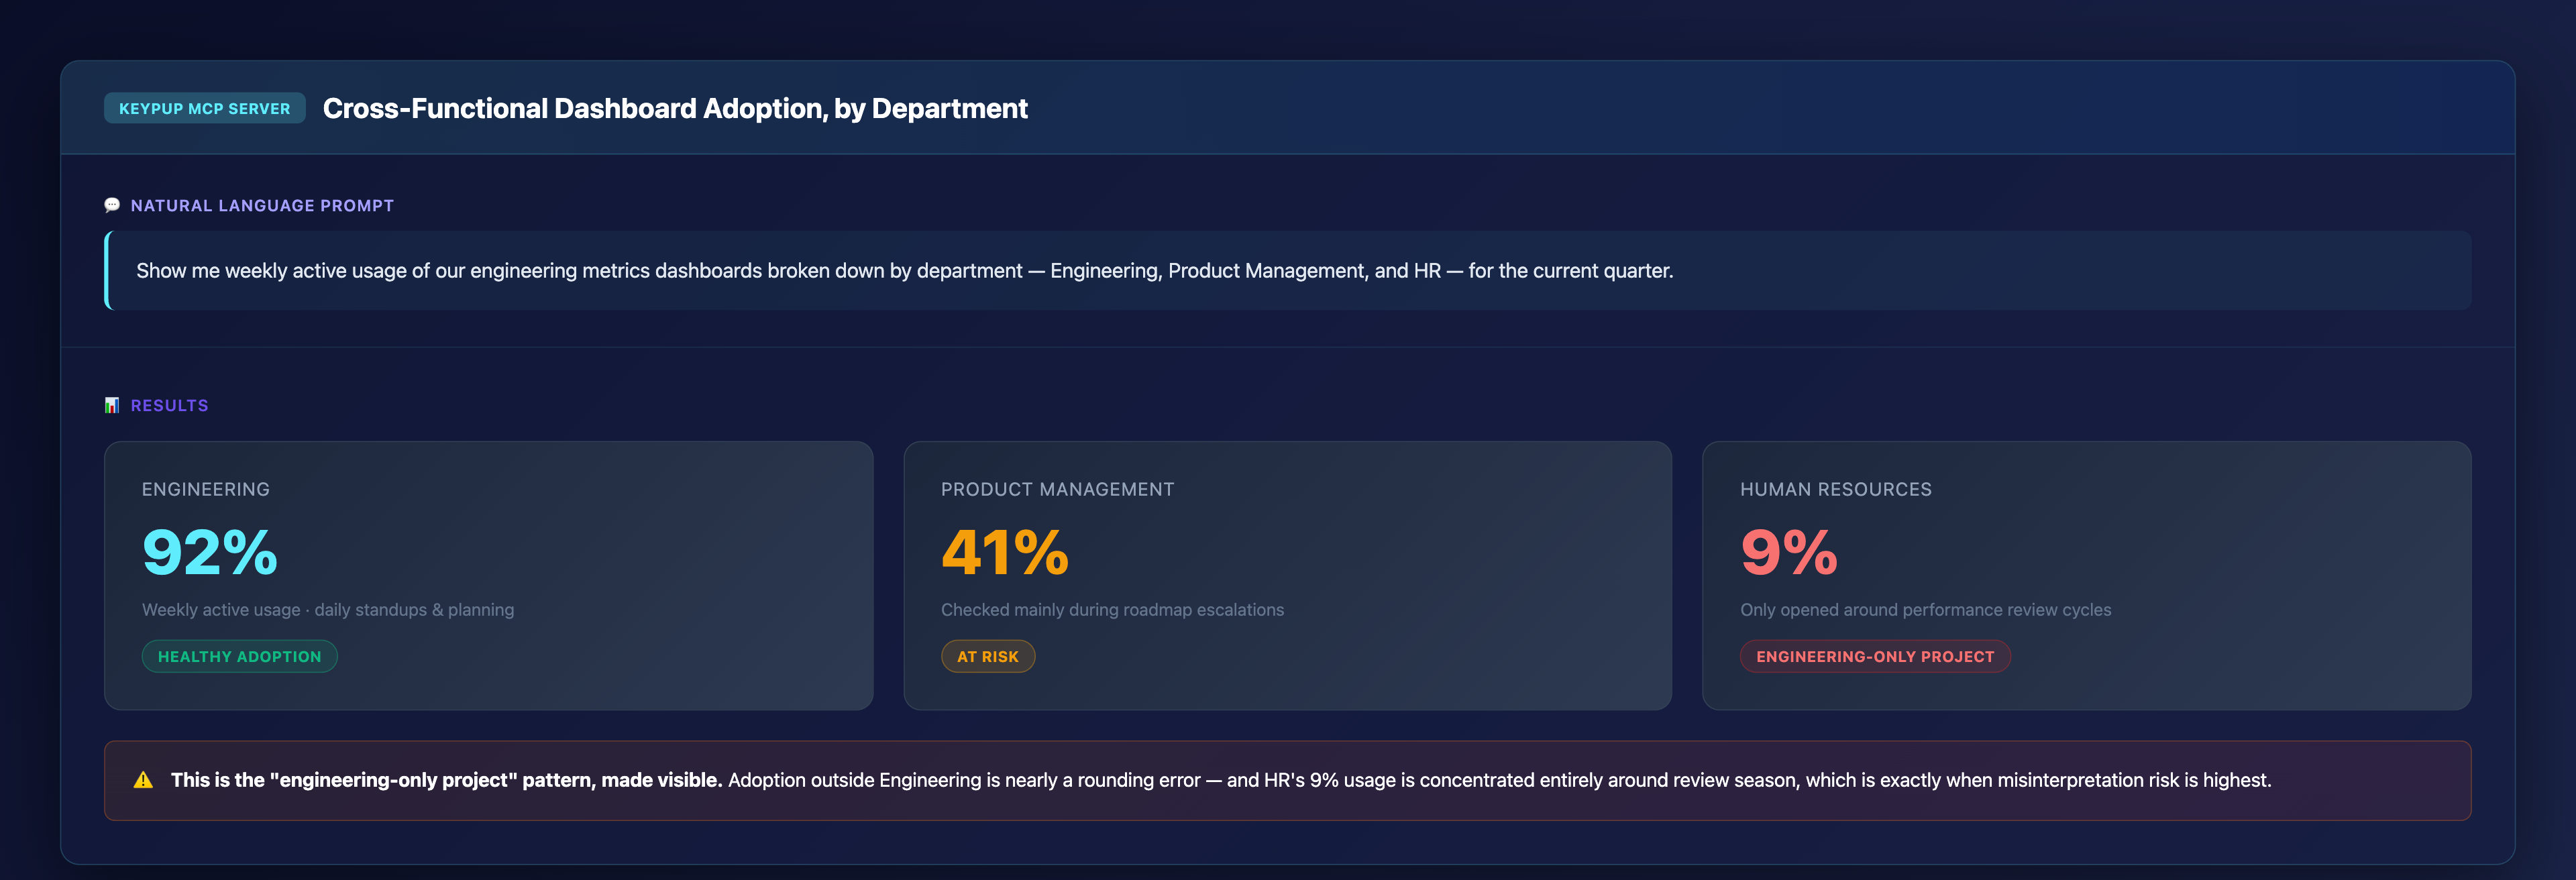
Show me weekly active usage of our engineering metrics dashboards
broken down by department — Engineering, Product Management, and HR
— for the current quarter.
Output: Cross-Functional Adoption KPI Cards
Key Insight: This is the "engineering-only project" pattern, made visible. Adoption outside Engineering is nearly a rounding error — and HR's 9% usage is concentrated entirely around review season, which is exactly when misinterpretation risk is highest.
2. Proving Product Management Is Ignoring System Health Signals
A dashboard alone won't change roadmap behavior. Showing the growing gap between feature demand and system health investment, quantified over time, makes the trade-off impossible to ignore.
MCP Prompt:
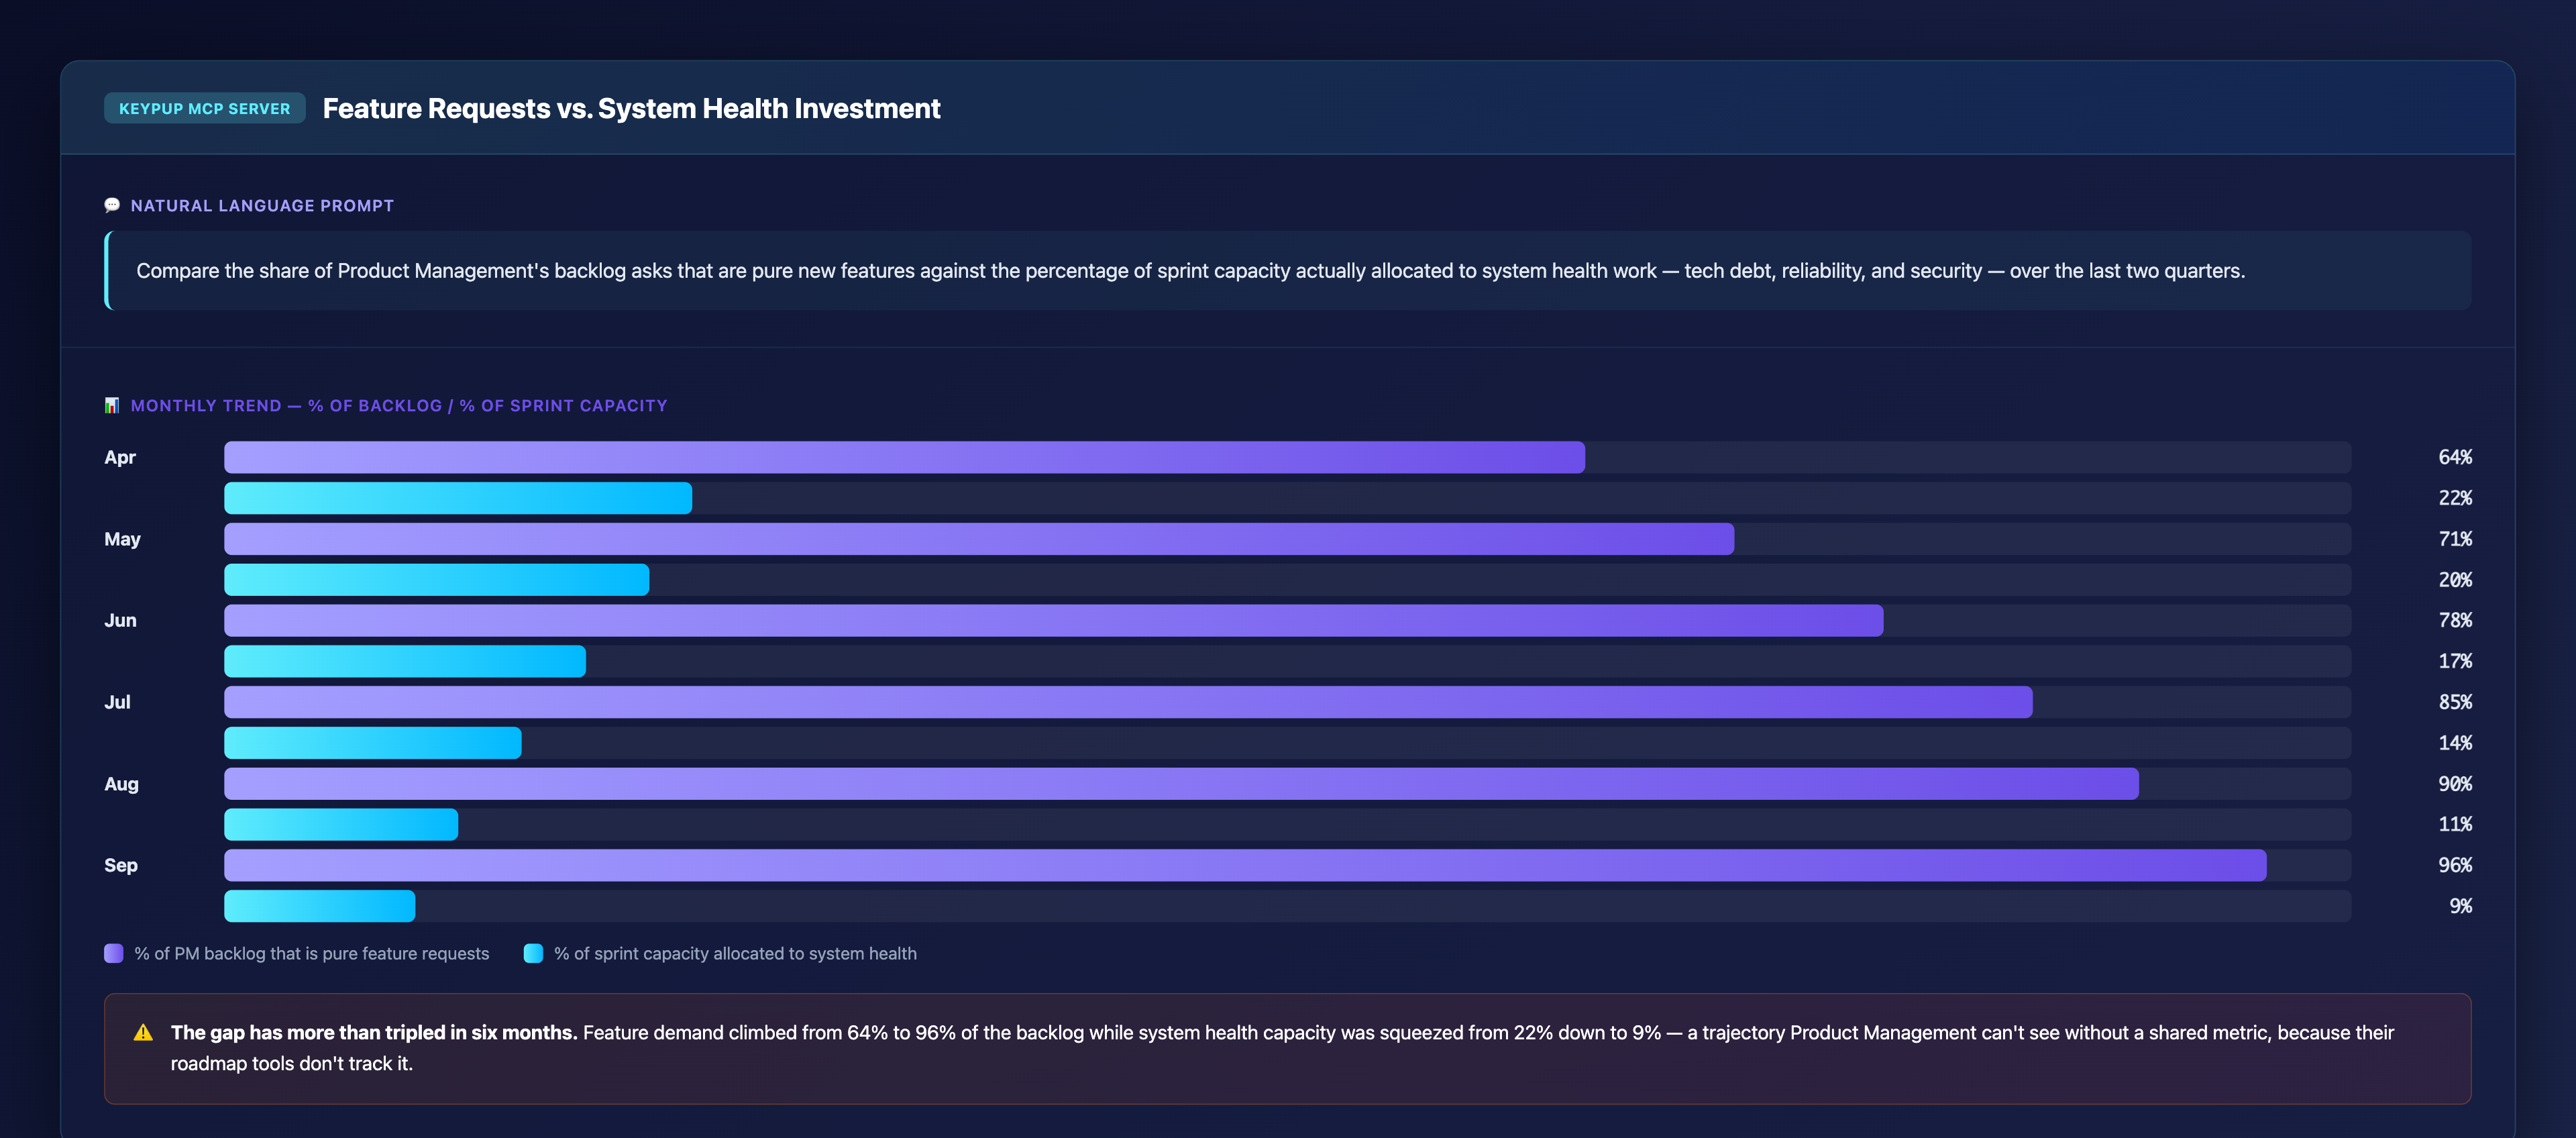
Compare the share of Product Management's backlog asks that are
pure new features against the percentage of sprint capacity
actually allocated to system health work — tech debt, reliability,
and security — over the last two quarters.
Output: Feature Demand vs. System Health Trend Chart
Key Insight: The gap has more than tripled in six months. Feature demand climbed from 64% to 96% of the backlog while system health capacity was squeezed from 22% down to 9% — a trajectory Product Management can't see without a shared metric, because their roadmap tools don't track it.
3. Giving HR a Concrete, Per-Metric Guardrail
"Don't misuse the data" is not an actionable policy. A documented misuse risk and safeguard for every metric HR might be tempted to use is.
MCP Prompt:
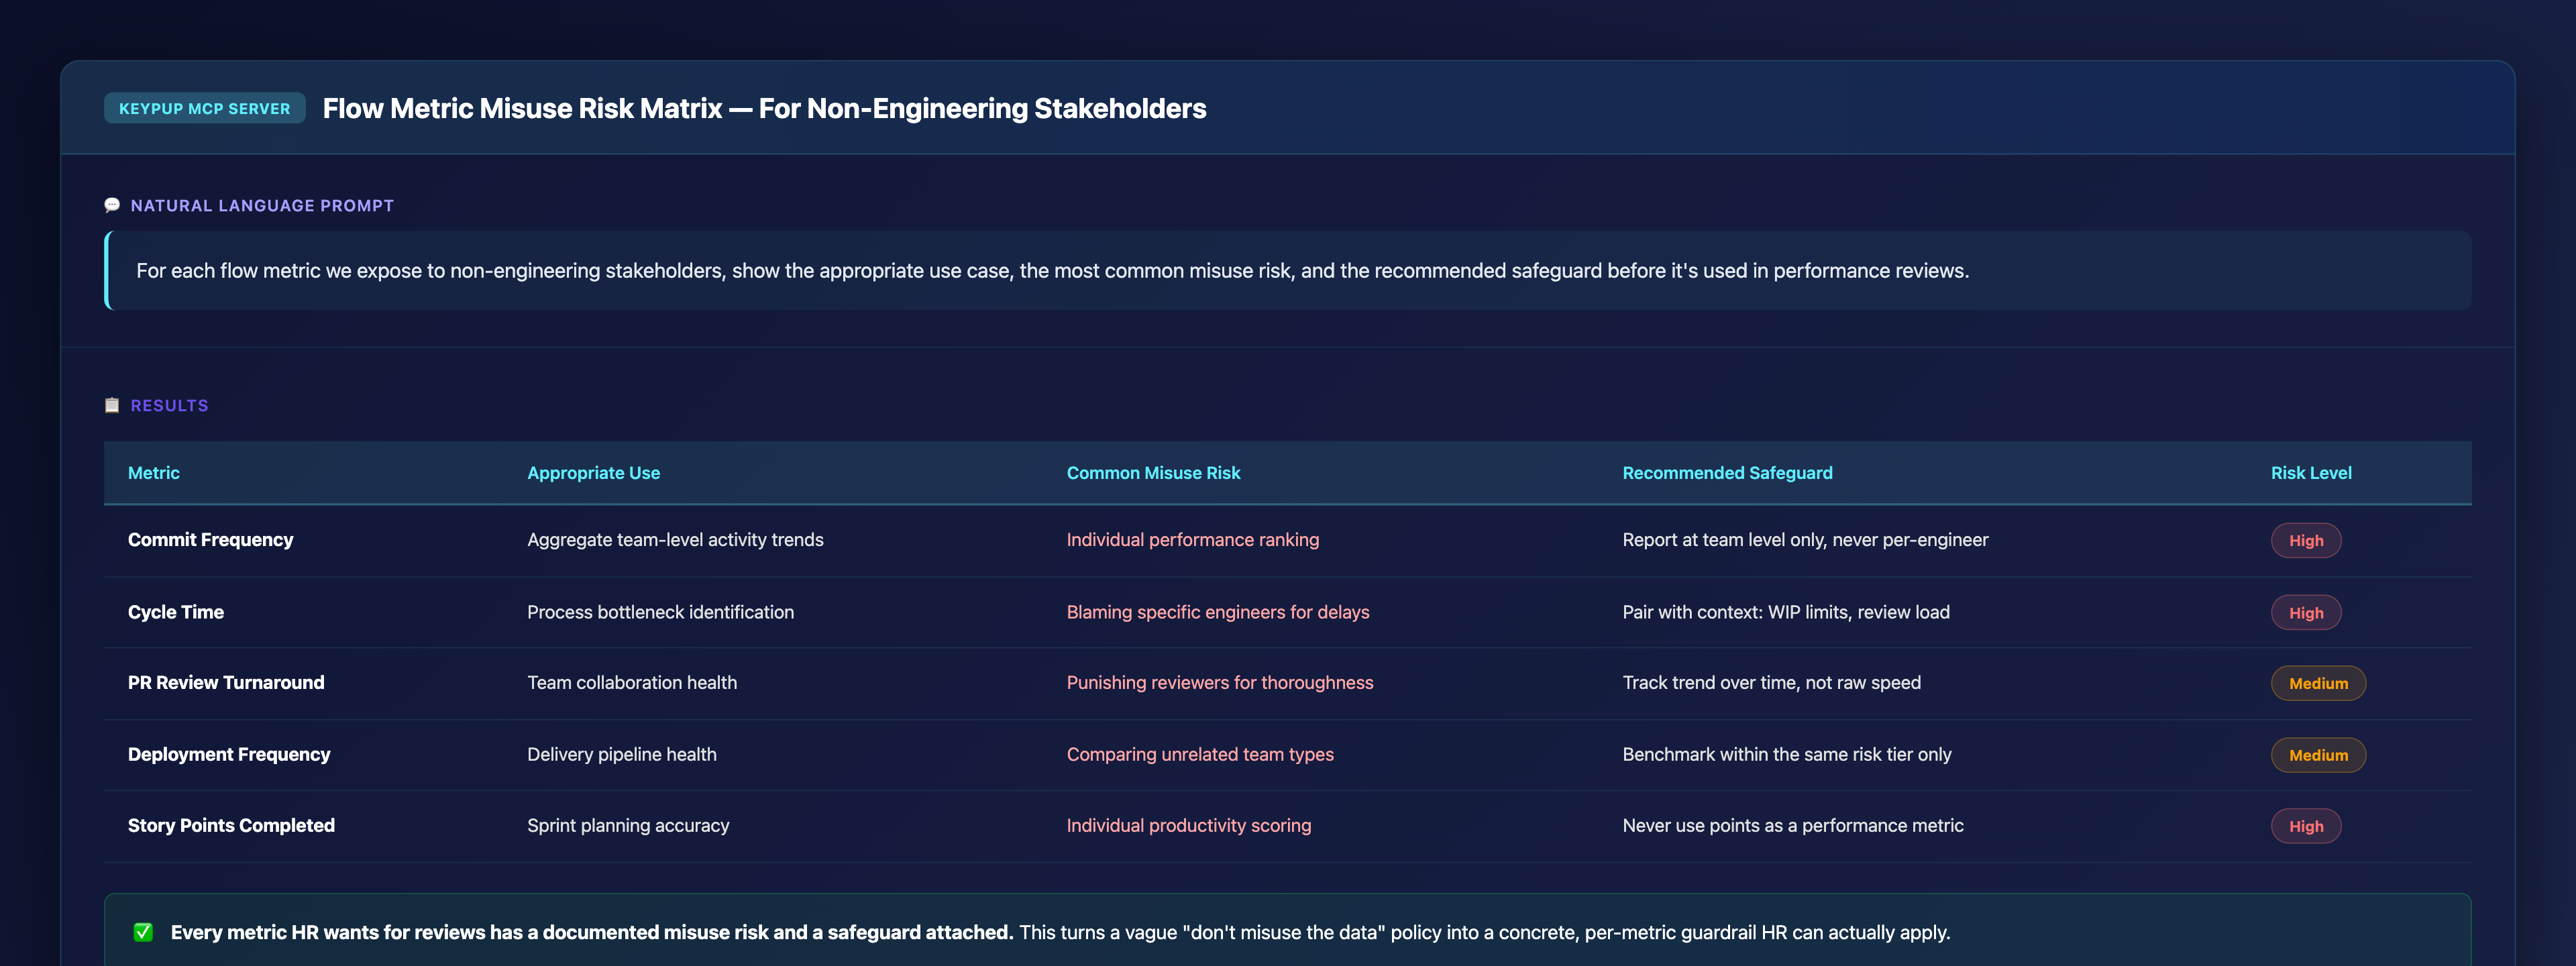
For each flow metric we expose to non-engineering stakeholders,
show the appropriate use case, the most common misuse risk, and the
recommended safeguard before it's used in performance reviews.
Output: Flow Metric Misuse Risk Matrix
Metric
Appropriate Use
Common Misuse Risk
Recommended Safeguard
Risk Level
Commit Frequency
Aggregate team-level activity trends
Individual performance ranking
Report at team level only, never per-engineer
High
Cycle Time
Process bottleneck identification
Blaming specific engineers for delays
Pair with context: WIP limits, review load
High
PR Review Turnaround
Team collaboration health
Punishing reviewers for thoroughness
Track trend over time, not raw speed
Medium
Deployment Frequency
Delivery pipeline health
Comparing unrelated team types
Benchmark within the same risk tier only
Medium
Story Points Completed
Sprint planning accuracy
Individual productivity scoring
Never use points as a performance metric
High
Key Insight: Every metric HR wants for reviews has a documented misuse risk and a safeguard attached. This turns a vague "don't misuse the data" policy into a concrete, per-metric guardrail HR can actually apply.
4. Tracking Whether Trust Is Actually Recovering
Change management isn't done when guardrails are written — it's done when the departments that were burned start trusting the data again. That recovery (or lack of it) needs to be tracked over time, not assumed.
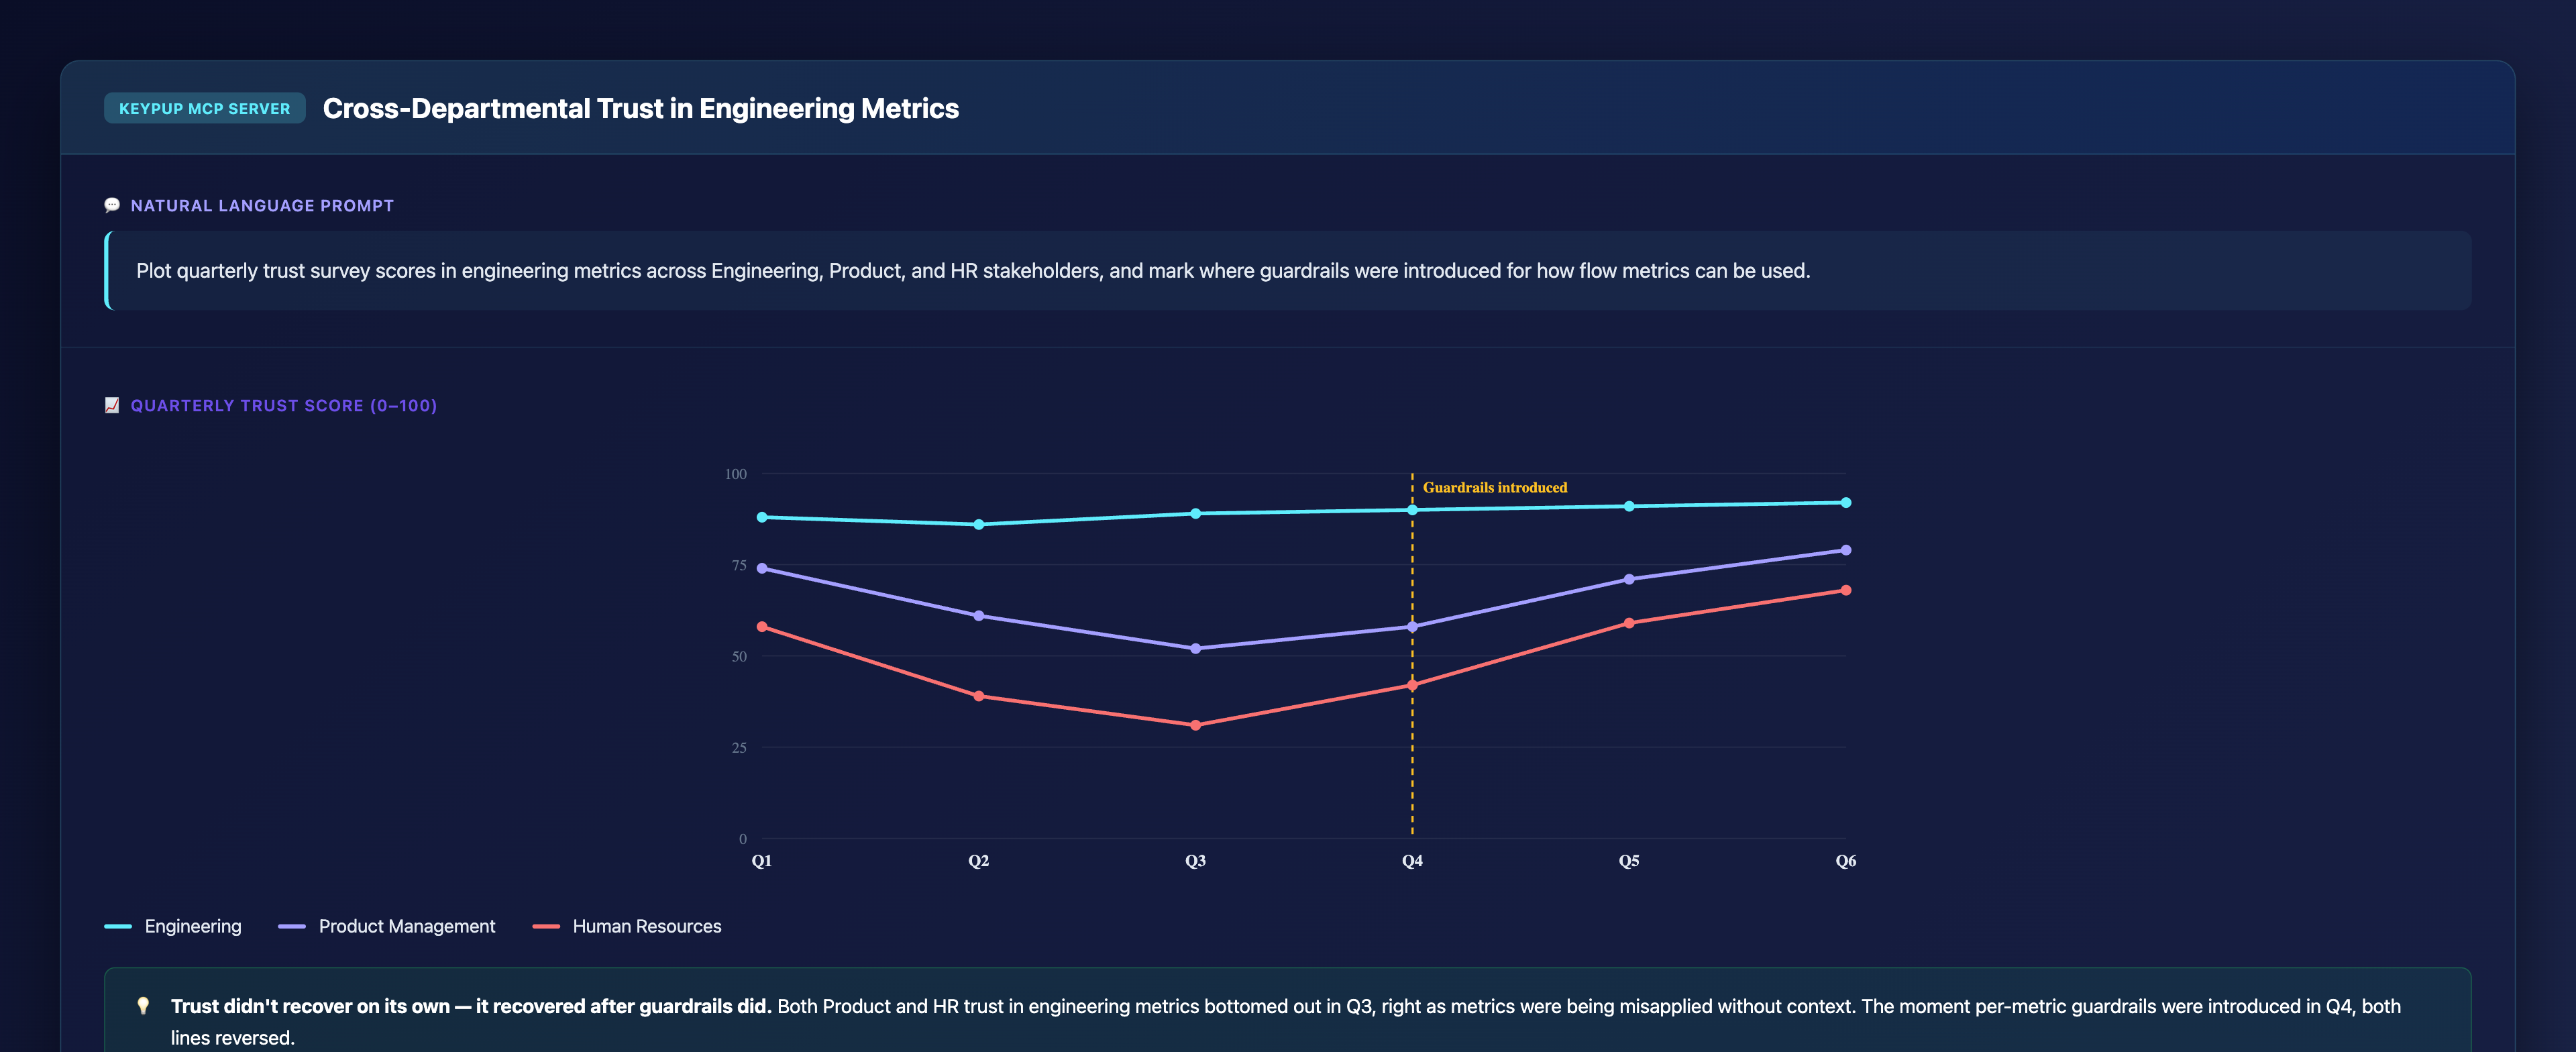
MCP Prompt:
Plot quarterly trust survey scores in engineering metrics across
Engineering, Product, and HR stakeholders, and mark where
guardrails were introduced for how flow metrics can be used.
Output: Cross-Departmental Trust Trend Chart
Key Insight: Trust didn't recover on its own — it recovered after guardrails did. Both Product and HR trust in engineering metrics bottomed out in Q3, right as metrics were being misapplied without context. The moment per-metric guardrails were introduced in Q4, both lines reversed.
5. Holding Every Department Accountable, Not Just Engineering
Executive sponsors need a single view that names which departments are engaged, which have a champion in name only, and which have no sponsor at all.
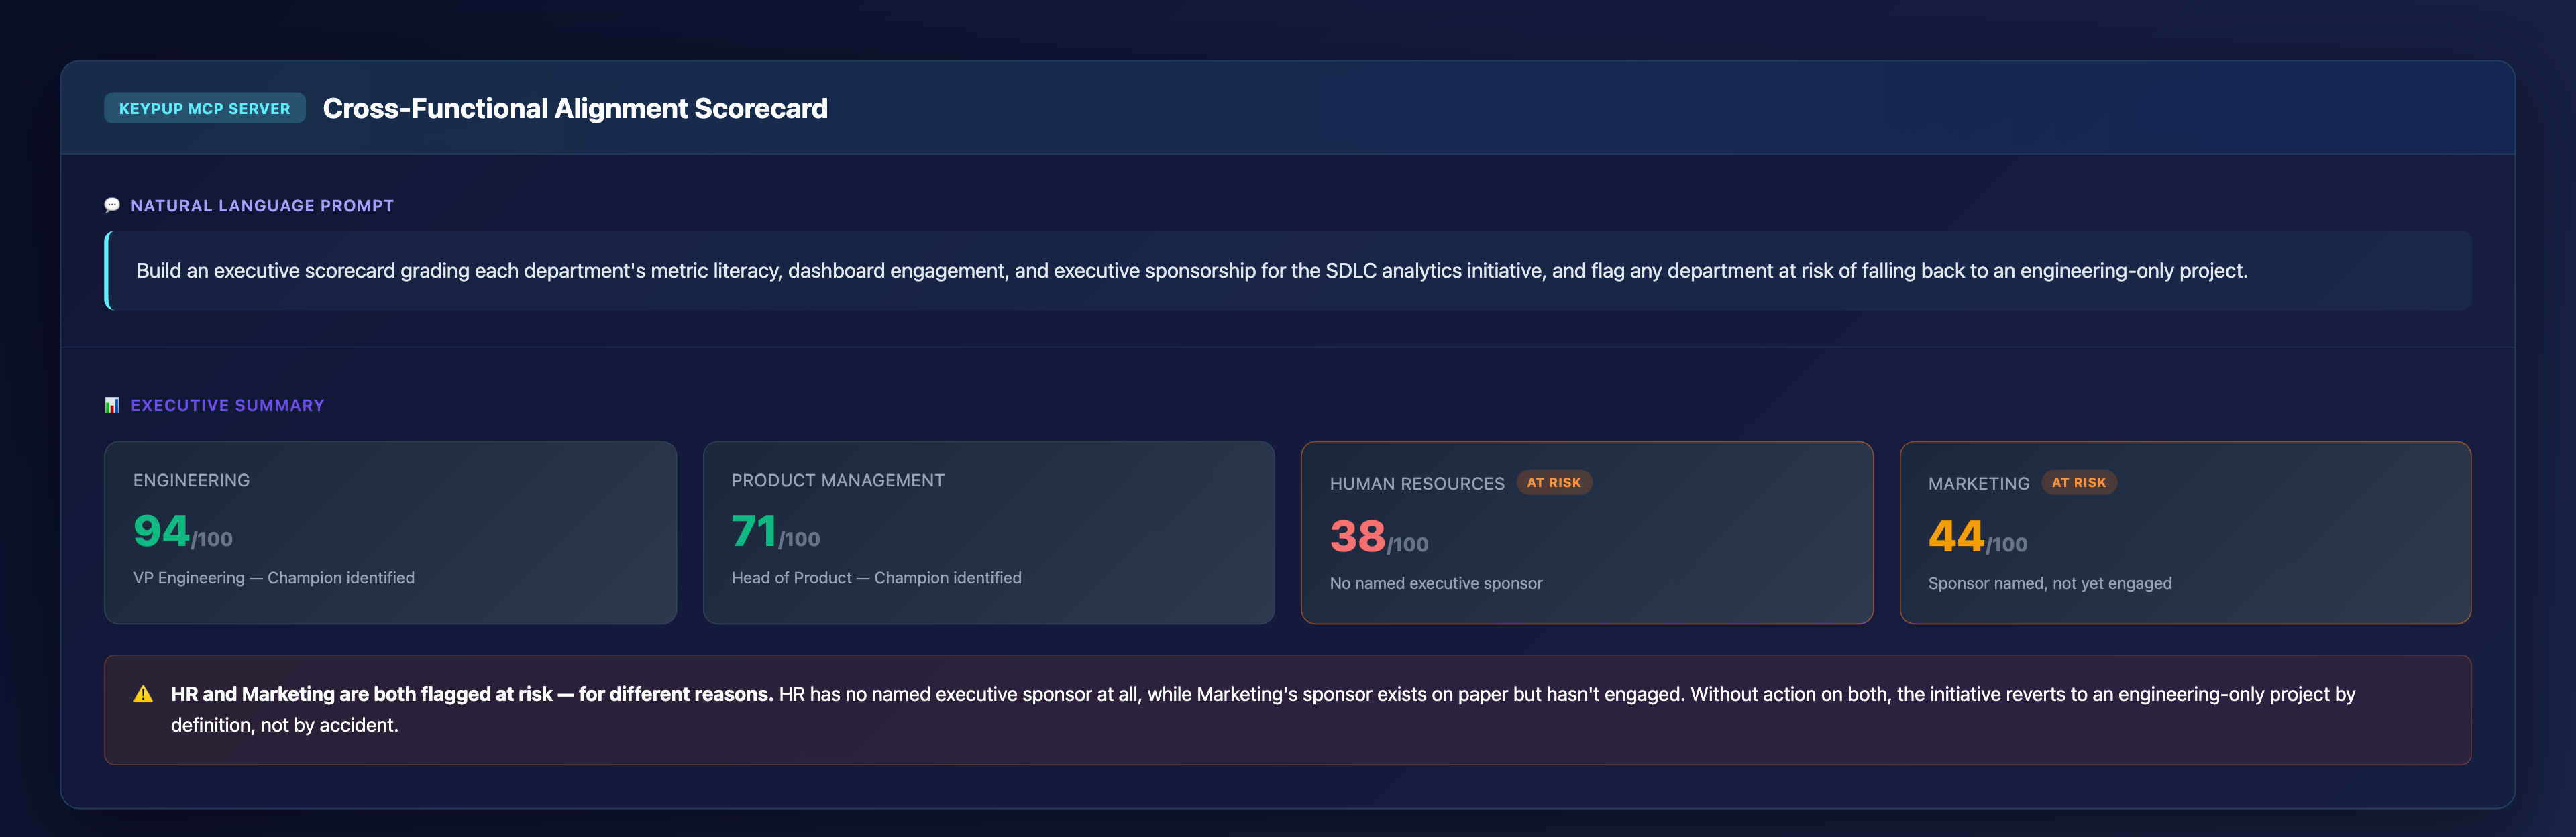
MCP Prompt:
Build an executive scorecard grading each department's metric
literacy, dashboard engagement, and executive sponsorship for the
SDLC analytics initiative, and flag any department at risk of
falling back to an engineering-only project.
Output: Cross-Functional Alignment Scorecard
Key Insight: HR and Marketing are both flagged at risk — for different reasons. HR has no named executive sponsor at all, while Marketing's sponsor exists on paper but hasn't engaged. Without action on both, the initiative reverts to an engineering-only project by definition, not by accident.
The Technical Implementation: How Keypup MCP Tracks Cross-Functional Alignment
Usage Analytics Beyond Engineering
Keypup MCP tracks dashboard and query engagement per department, not just per user — making the "engineering-only project" pattern visible in a single report instead of anecdotal complaints months into a rollout.
Metric Governance Built In
Every metric exposed to non-engineering stakeholders can be tagged with its appropriate use case, common misuse risks, and recommended safeguards, so HR and Product get a governance layer alongside the raw numbers, not just the numbers themselves.
Trust and Sponsorship as Tracked Signals
Just as Keypup MCP tracks DORA metrics over time, it can incorporate survey-based trust scores and named executive sponsorship status per department, turning "are people actually bought in?" from a hallway conversation into a trend line leadership can act on.
Real-World Impact: Enterprise Case Studies
Case Study 1: Global Enterprise SaaS Company
Before Keypup MCP:
HR quietly began referencing individual commit frequency during performance calibration sessions, without engineering's knowledge or a documented safeguard
Three engineers raised concerns about being informally graded on a metric nobody had explained to them
Trust in the entire analytics rollout, not just the one metric, dropped sharply across both Engineering and HR
After Keypup MCP:
Metric misuse risk matrix rolled out to HR with explicit safeguards for every metric used in review cycles
Zero further reports of unsanctioned metric use in performance calibration sessions the following two quarters
HR dashboard engagement rose from 9% to 54% once HR had a governance framework it trusted, not just raw data
"We didn't need HR to stop caring about engineering data — we needed them to have a safe way to use it. The misuse risk matrix did more for trust in three weeks than a year of dashboards had done on its own."
— VP Engineering, Enterprise SaaS
Case Study 2: Multi-Product Financial Services Organization
Before Keypup MCP:
Product Management continued committing to aggressive feature roadmaps for four consecutive quarters while system health capacity was quietly squeezed
No shared metric existed to make the trade-off visible outside Engineering's own retrospectives
A major reliability incident eventually forced the conversation that data could have surfaced two quarters earlier
After Keypup MCP:
Feature-vs-system-health trend became a standing agenda item in quarterly roadmap planning, reviewed by Product and Engineering leadership together
System health capacity allocation stabilized instead of continuing its downward trend
Executive sponsorship extended to Product Management leadership, not just Engineering, closing the accountability gap that had let the trend go unchecked
"The chart didn't tell Product anything they couldn't have calculated themselves. What it did was make the trend impossible to argue with in the room, in front of their own leadership. That's the part that actually changed the roadmap."
— Director of Engineering, Financial Services
Implementation: Getting Started with Keypup MCP
1. Baseline Cross-Functional Adoption First
Before rolling out training, measure where usage actually stands today across Engineering, Product, HR, and any other stakeholder department. You can't fix an engineering-only project you haven't measured.
2. Build the Metric Governance Layer Before Training, Not After
Document appropriate use, misuse risk, and safeguards for every metric non-engineering stakeholders will see — especially any metric HR might reference in performance conversations — before the training session, not as a follow-up.
3. Query in Natural Language, From Any Department
No SQL required. Just ask:
"Which departments have the lowest dashboard engagement this quarter?"
"Show every metric currently at risk of misuse in HR conversations"
"Has trust in engineering metrics recovered since we introduced guardrails?"
"Which departments have an executive sponsor who hasn't engaged?"
4. Automate Cross-Functional Reporting
Schedule recurring queries for:
Quarterly adoption and trust tracking by department
Automatic flags when a department's engagement or sponsorship status changes
Feature-vs-system-health trend reviews ahead of every roadmap planning cycle
Executive alignment scorecards ahead of board or leadership reporting
The Bottom Line: SDLC Analytics Is a Change Management Problem First
An engineering VP's enthusiasm was never going to be enough. Enterprise-wide adoption of SDLC analytics requires:
✅ Measuring adoption by department, not just assuming engineering's enthusiasm will spread on its own ✅ Giving HR a governance layer, not just raw metrics, before performance conversations happen ✅ Making the feature-vs-system-health trade-off visible to Product Management in a language their own leadership will act on ✅ Tracking trust recovery over time, so guardrails can be proven to work, not just assumed to help ✅ Naming and holding accountable an executive sponsor in every department, not just Engineering
Keypup MCP makes cross-functional change management measurable in the same way engineering already measures its own delivery — turning "get buy-in from HR and Product" from a vague mandate into a tracked, accountable rollout with a clear owner in every department.
Get Started
Ready to turn cross-functional buy-in from a hope into a tracked outcome?
Start Free Trial — Connect your engineering stack in minutes and start measuring adoption beyond Engineering today.
Request Demo — See how enterprise engineering leaders use Keypup MCP to drive change management across HR, Product, and Marketing.
View MCP Documentation — Technical details for engineering and change management teams implementing Keypup MCP.
Keywords: SDLC analytics change management, cross-functional alignment engineering metrics, HR misuse of engineering metrics, engineering metrics performance reviews risk, executive sponsorship SEI platform, Product Management system health metrics, engineering analytics adoption enterprise, flow metrics governance HR, data-driven culture engineering organization, MCP server cross-departmental reporting
Ready to Transform Your Analytics?
Join teams already using AI to make data-driven decisions faster than
ever.
Why do some Jira tickets bounce between engineers and teams for weeks before anyone fixes them? Learn what engineering leaders on Reddit say about ticket reassignment churn at enterprise scale, and how Keypup MCP uses previous assignees, assignment dates, issue types, projects and linked pull request authors to measure how often tickets change hands, what each hand-off costs in cycle time, who actually wrote the code and which open tickets are being passed around right now.
Compare the 6 best engineering analytics tools for Jira and Git in 2026 — Keypup, LinearB, Jellyfish, Swarmia, Faros AI and Pluralsight Flow — across Git and Jira unification, DORA Metrics and cycle time, dashboard customization, AI and natural language, integration breadth, setup speed and security. Find out which platform turns your code and ticketing data into one reporting layer with prescriptive recommendations.
Why do pull requests sit for days before anyone reviews them? Learn what engineering leaders on Reddit say about code review bottlenecks at enterprise scale, and how Keypup MCP uses review request dates, first review dates, approvals, reviewers and lines changed to measure your wait for first review, break cycle time into phases, find when requests get stuck, show who carries the review load and list the pull requests waiting right now.