ITIL and CAB Governance Bottlenecks Are Distorting Your Lead Time for Changes Telemetry
In regulated enterprises — finance, healthcare, telecom — code can be written, tested, and merged in three hours, then sit for two to three weeks waiting on a Change Advisory Board slot. DORA's Lead Time for Changes can't tell the difference between active engineering work and passive bureaucratic wait, so executive dashboards flag a "velocity problem" that doesn't exist. Discover how Keypup MCP decomposes Lead Time into engineering-controlled time versus CAB queue wait, exposes SLA-breaching change categories, and gives engineering leadership the receipts to stop absorbing blame for a compliance calendar.
TL;DR: In regulated enterprises, DORA's "Lead Time for Changes" quietly measures two completely different things as one number: a few hours of active engineering work, and one to three weeks of passive waiting for a Change Advisory Board (CAB) slot, architecture sign-off, or scheduled release window. Automated SDLC analytics can't tell them apart, so executive dashboards report a rising "velocity problem" that is actually a governance cadence problem — and engineering leadership gets pressured to optimize a pipeline that was already Elite-tier. The Keypup MCP Server fixes this by decomposing Lead Time into engineering-controlled time versus CAB queue wait, tracking SLA breaches by change category, and making the real bottleneck visible in the same dashboards leadership already trusts.
Ask any engineer at a bank, a hospital system, or a telecom carrier what "Lead Time for Changes" means on their executive dashboard, and you'll get an eye-roll before an answer. The number is real. The conclusion drawn from it usually isn't.
The Friction: DORA Metrics Weren't Built for a Change Advisory Board
DORA's Lead Time for Changes was designed around a simple assumption: once code is merged, it deploys — automatically, continuously, close to real time. That assumption holds for a startup shipping to production ten times a day. It does not hold for a regulated enterprise where continuous deployment straight to production is rarely permitted at all.
Code moves fast; releases don't. A well-reviewed pull request can go from first commit to merge-ready in three hours. It then waits in a ticketing queue for the next biweekly CAB meeting, the next scheduled change freeze, or the next architecture review board slot — commonly two to three weeks.
One metric, two clocks. Automated SDLC analytics timestamp "created" and "deployed" and divide the difference. They have no concept of "waiting for a human committee to convene" versus "waiting for a reviewer to look at the diff." Both get counted as the same kind of time.
The dashboard reads as a velocity story. Executives see Lead Time for Changes climbing quarter over quarter and reasonably ask why engineering is getting slower. Nobody wrote "CAB backlog" on the dashboard, so nobody asks about CAB backlog.
The pressure lands on the wrong team. Engineering leadership gets pulled into "why is delivery slowing down" conversations and told to optimize code review, sprint planning, or test automation — none of which touch the actual bottleneck, which is a compliance process engineering doesn't own and can't unilaterally change.
The result is a governance process doing exactly what it's designed to do — reduce risk through mandatory review — while an unrelated engineering metric absorbs the reputational cost of that design choice.
Why This Matters: The Metric Can't See What It's Measuring
The Attribution Problem
Lead Time for Changes is a single aggregate number by design. That's what makes it useful for comparing delivery pipelines across teams — and exactly what makes it useless for diagnosing why a specific pipeline is slow. In a regulated enterprise, the number blends coding time, review time, testing time, CAB queue time, and release-window time into one figure, then reports it as if it were a single, controllable process.
The Governance Problem
CAB, architecture review boards, and compliance sign-offs exist for legitimate reasons — audit trails, segregation of duties, regulatory attestations. None of that is inherently wrong. What's wrong is measuring the outcome of that governance model with a metric built for continuous deployment, and then routing the resulting number to an engineering scorecard instead of a governance one.
The Trust Problem
Once engineering leadership has been asked to defend a metric they don't control often enough, they stop trusting the dashboard — and so does everyone reporting into it. That erosion is hard to reverse, because the fix isn't "work faster." It's "separate the two clocks the dashboard has been quietly merging together."
The Enterprise Discussion: What Engineers Are Actually Saying
This exact frustration shows up constantly wherever engineers in regulated industries compare notes on release governance.
Staff Engineer, Regional Bank (r/ExperiencedDevs)
"Our lead time chart has looked worse every quarter for a year and leadership keeps asking what's wrong with the team. Nothing is wrong with the team. Our PRs merge in under a day. Then they sit in a change ticket for two and a half weeks because CAB only meets every other Thursday and we're not the only line of business fighting for a slot. The dashboard doesn't know the difference between 'engineer is slow' and 'calendar is full.'"
Engineering Manager, Healthcare Payer (r/devops)
"I've had three separate conversations this year explaining that our 'velocity problem' is actually a change freeze schedule nobody in engineering set. It's exhausting to keep re-explaining the same chart. What I actually need is a metric that shows my team's real cycle time next to the compliance wait time, side by side, so I stop having to say it out loud every single time."
The pattern is consistent: the metric isn't lying, it's just incomplete. Engineering can't shrink a biweekly CAB cadence by writing better code. It can, however, insist on a metric that stops blending the two clocks together — which is exactly the gap Keypup MCP closes.
How Keypup MCP Solves ITIL/CAB Governance Distortion
The Keypup Model Context Protocol (MCP) Server treats "Lead Time for Changes" as a decomposable metric, not a single black box. It separates engineering-controlled time from governance queue time, tracks every change category against its own SLA, and quantifies exactly how much of the reported number is actually a compliance calendar — all through plain-language prompts, no dashboard building required.
1. Decomposing Lead Time Into What Engineering Controls and What It Doesn't
Before anyone can argue about "velocity," the two clocks need to be pulled apart and shown as separate numbers.
MCP Prompt:
Break down our median Lead Time for Changes into active engineering
time — coding through merge — versus passive Change Advisory Board
queue wait time, for pull requests merged last quarter.
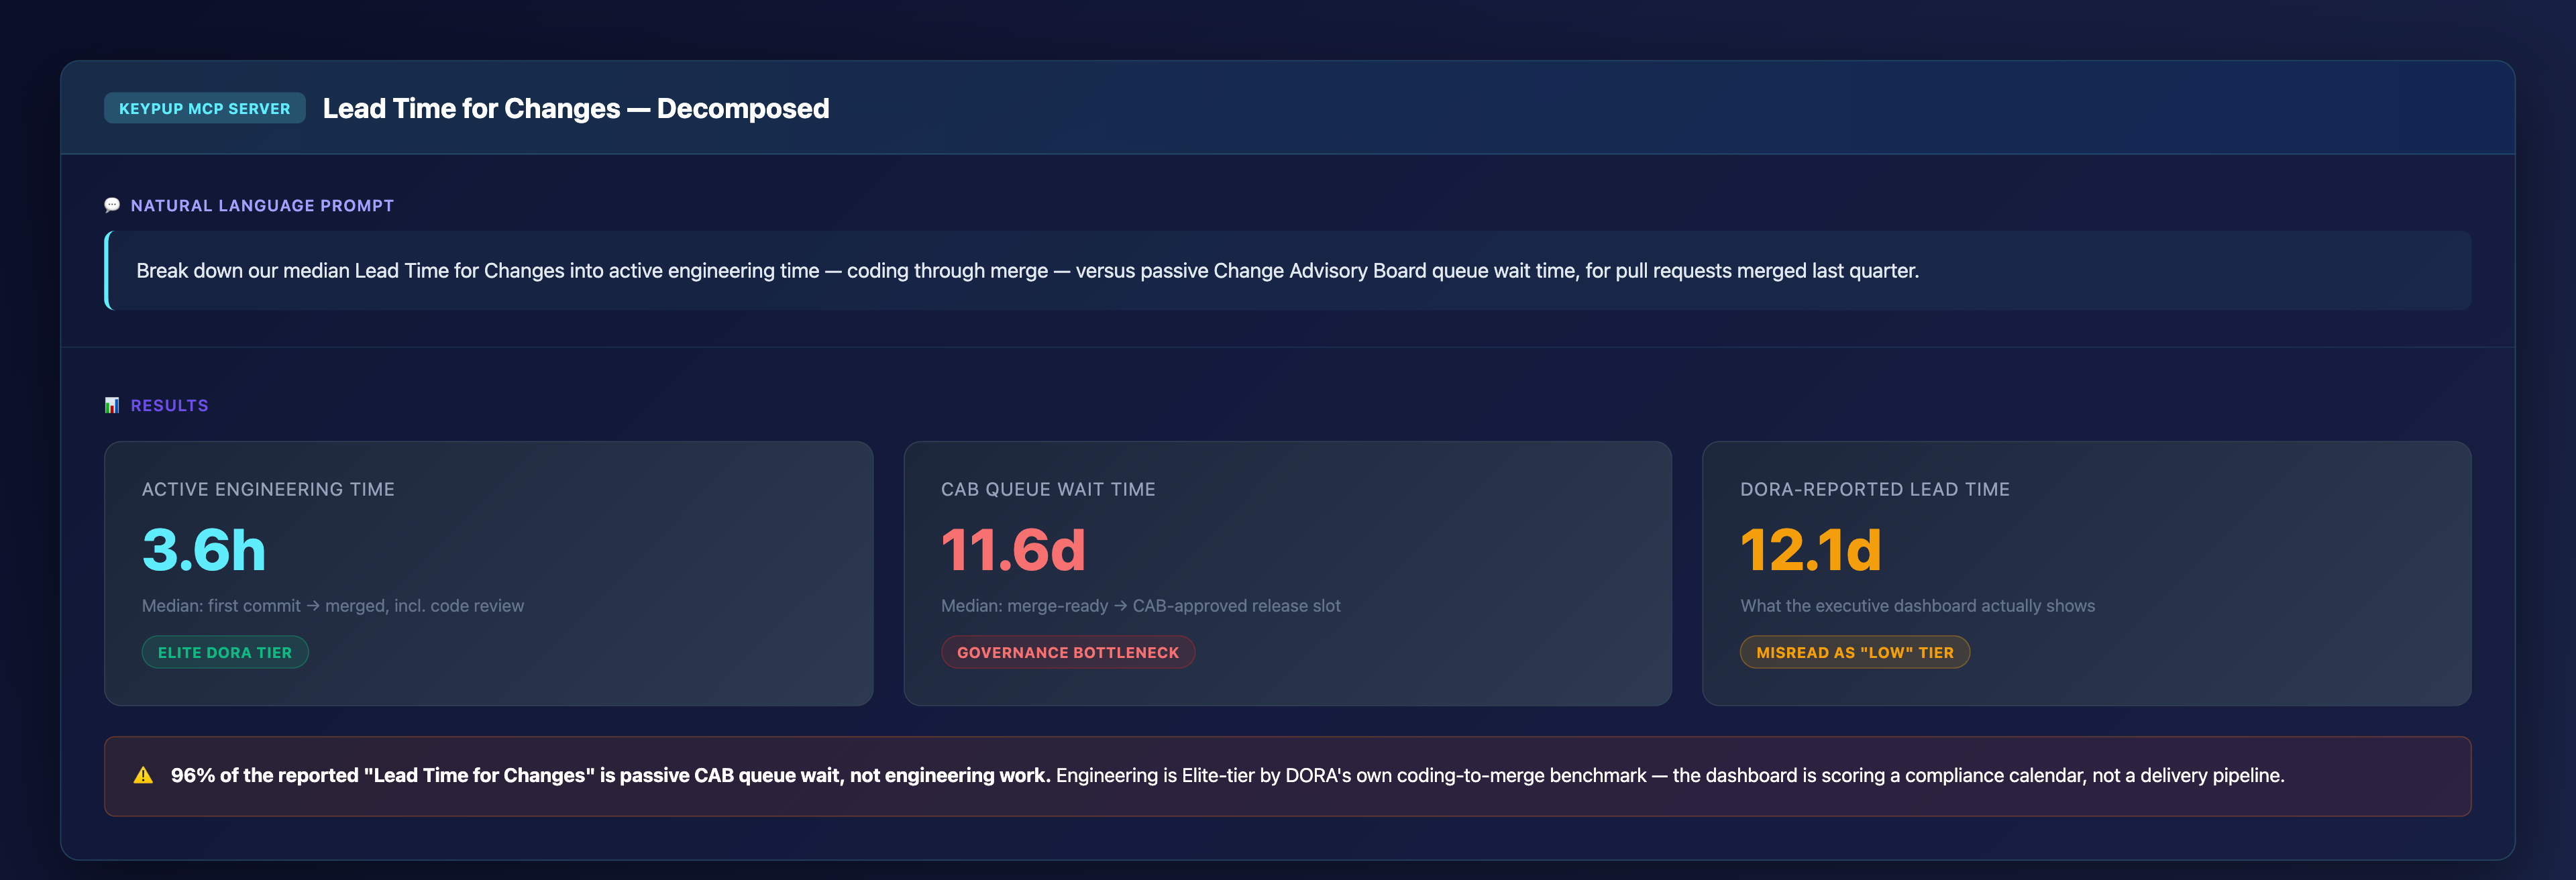
Output: Lead Time for Changes, Decomposed
Key Insight: 96% of the reported "Lead Time for Changes" is passive CAB queue wait, not engineering work. Engineering is Elite-tier by DORA's own coding-to-merge benchmark — the dashboard is scoring a compliance calendar, not a delivery pipeline.
2. Proving the Trend Is a Governance Trend, Not a Velocity Trend
A single snapshot invites a one-time explanation. A six-month trend showing engineering's share of the number shrinking while CAB's share grows makes the pattern impossible to keep re-litigating every quarter.
MCP Prompt:
For each of the last six months, show what percentage of total
Lead Time for Changes was active engineering work versus time
spent waiting in the Change Advisory Board queue after merge.
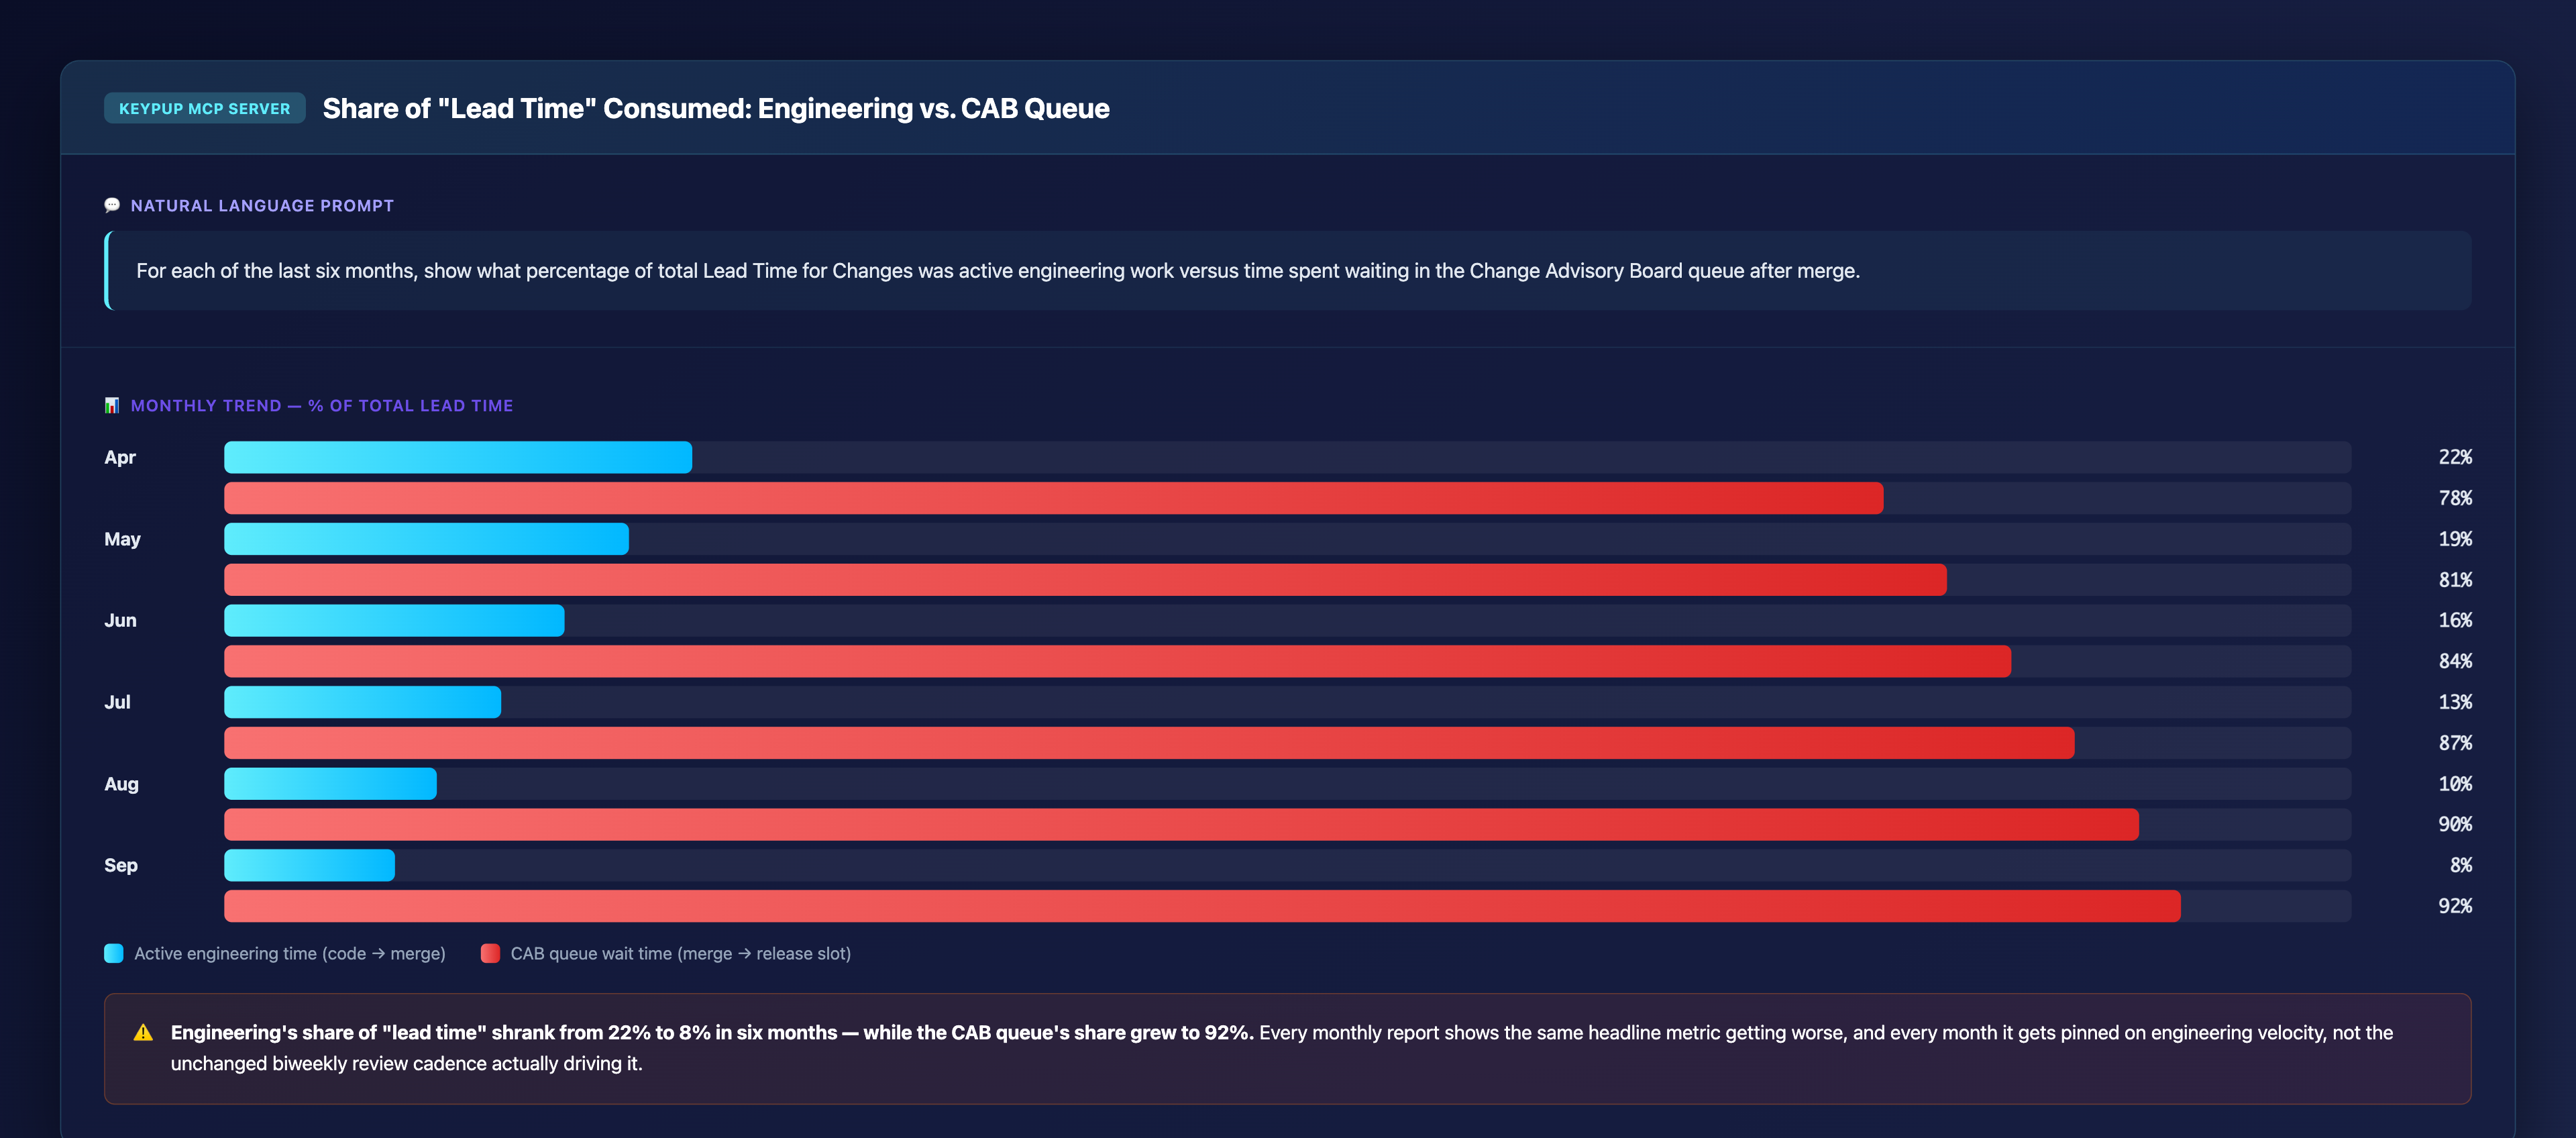
Output: Share of "Lead Time" Consumed — Engineering vs. CAB Queue
Key Insight: Engineering's share of "lead time" shrank from 22% to 8% in six months — while the CAB queue's share grew to 92%. Every monthly report shows the same headline metric getting worse, and every month it gets pinned on engineering velocity, not the unchanged biweekly review cadence actually driving it.
3. Naming Exactly Which Change Categories Breach SLA — and by How Much
A generic "CAB is slow" complaint doesn't get budget or headcount approved. A per-category SLA breach table does.
MCP Prompt:
For each change type in our ITIL process, show the required
review board, the governance SLA, the actual median wait time
observed last quarter, and how far over SLA each category runs.
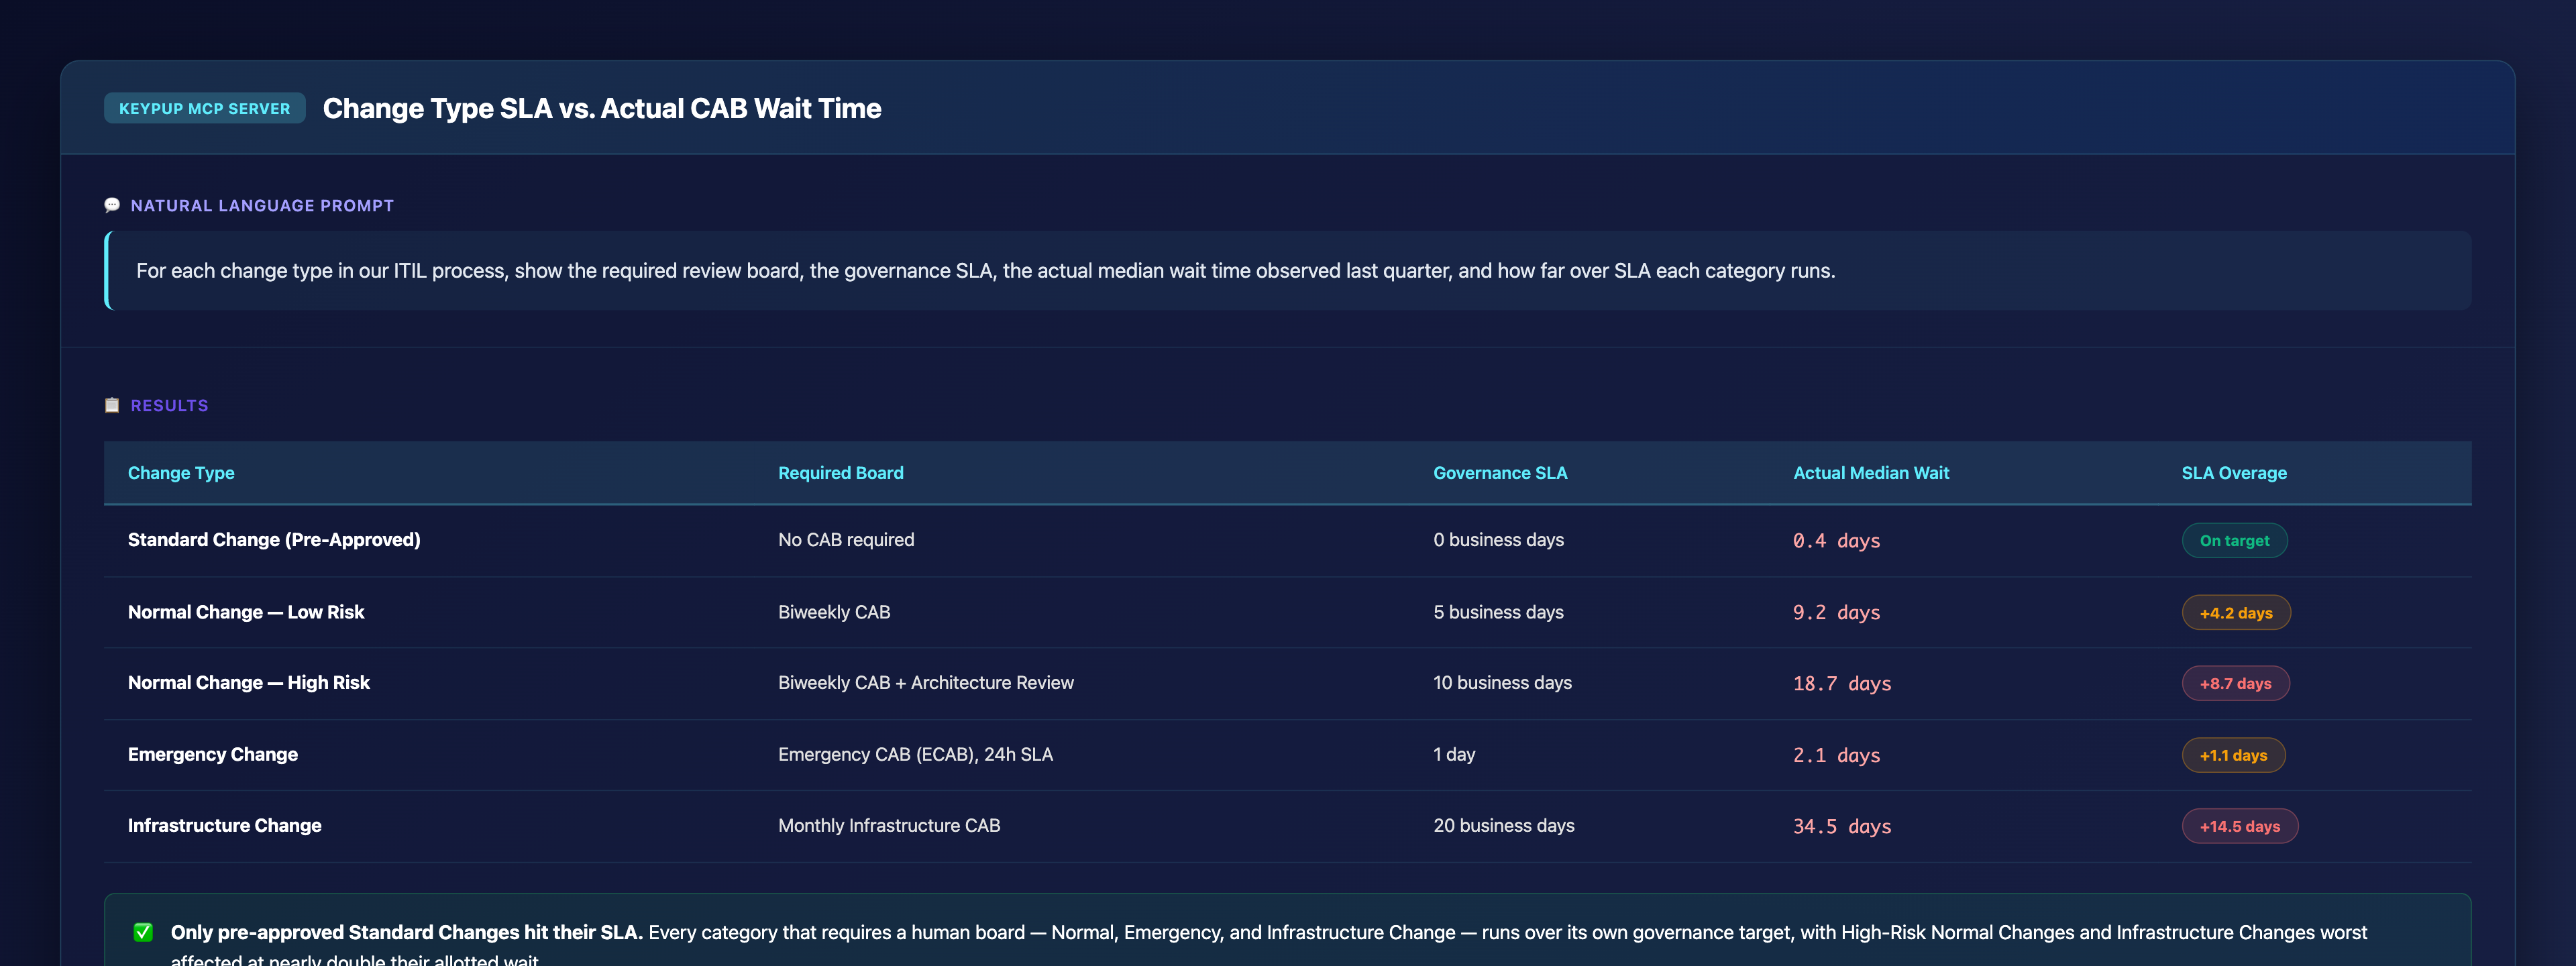
Output: Change Type SLA vs. Actual CAB Wait Time
Change Type
Required Board
Governance SLA
Actual Median Wait
SLA Overage
Standard Change (Pre-Approved)
No CAB required
0 business days
0.4 days
On target
Normal Change — Low Risk
Biweekly CAB
5 business days
9.2 days
+4.2 days
Normal Change — High Risk
Biweekly CAB + Architecture Review
10 business days
18.7 days
+8.7 days
Emergency Change
Emergency CAB (ECAB), 24h SLA
1 day
2.1 days
+1.1 days
Infrastructure Change
Monthly Infrastructure CAB
20 business days
34.5 days
+14.5 days
Key Insight: Only pre-approved Standard Changes hit their SLA. Every category that requires a human board — Normal, Emergency, and Infrastructure Change — runs over its own governance target, with High-Risk Normal Changes and Infrastructure Changes worst affected at nearly double their allotted wait.
4. Showing Leadership the Two Lines Side by Side, Over Time
The most convincing artifact in any governance conversation is a chart where one line moves and the other one doesn't.
MCP Prompt:
Plot our official DORA Lead Time for Changes next to the
engineering-controlled portion of that same metric — first
commit to merge-ready — over the last six months, and flag
whether the CAB review cadence changed.
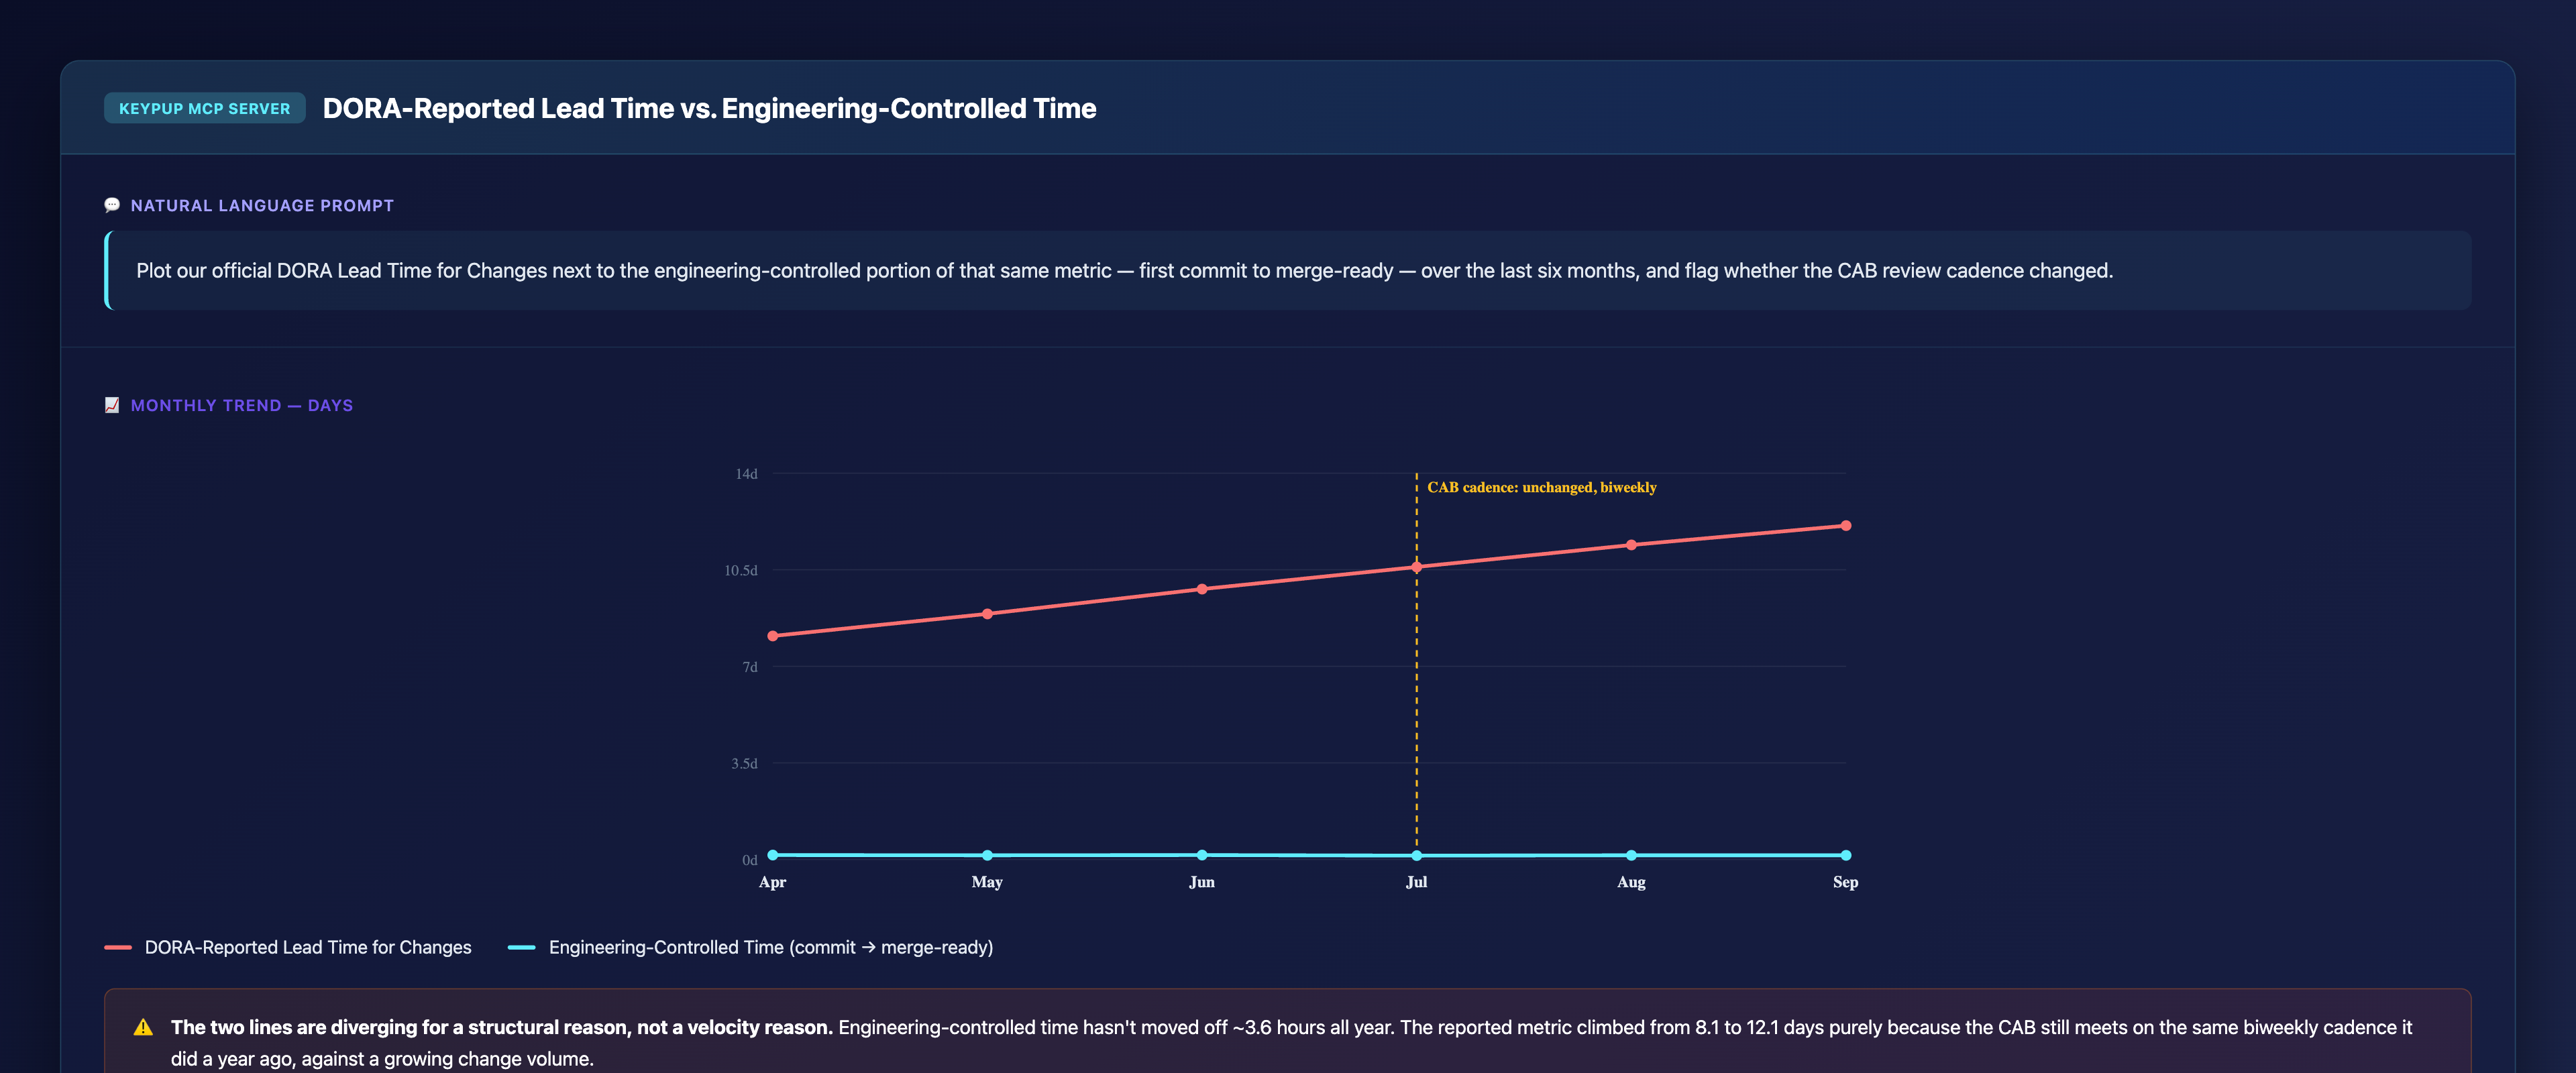
Output: DORA-Reported Lead Time vs. Engineering-Controlled Time
Key Insight: The two lines are diverging for a structural reason, not a velocity reason. Engineering-controlled time hasn't moved off ~3.6 hours all year. The reported metric climbed from 8.1 to 12.1 days purely because the CAB still meets on the same biweekly cadence it did a year ago, against a growing change volume.
5. Giving Executives a Live Scorecard of Where the Backlog Actually Sits
Once the pattern is proven, leadership needs an ongoing view — not a one-time analysis — of exactly which change categories are breaching SLA and how large each backlog is right now.
MCP Prompt:
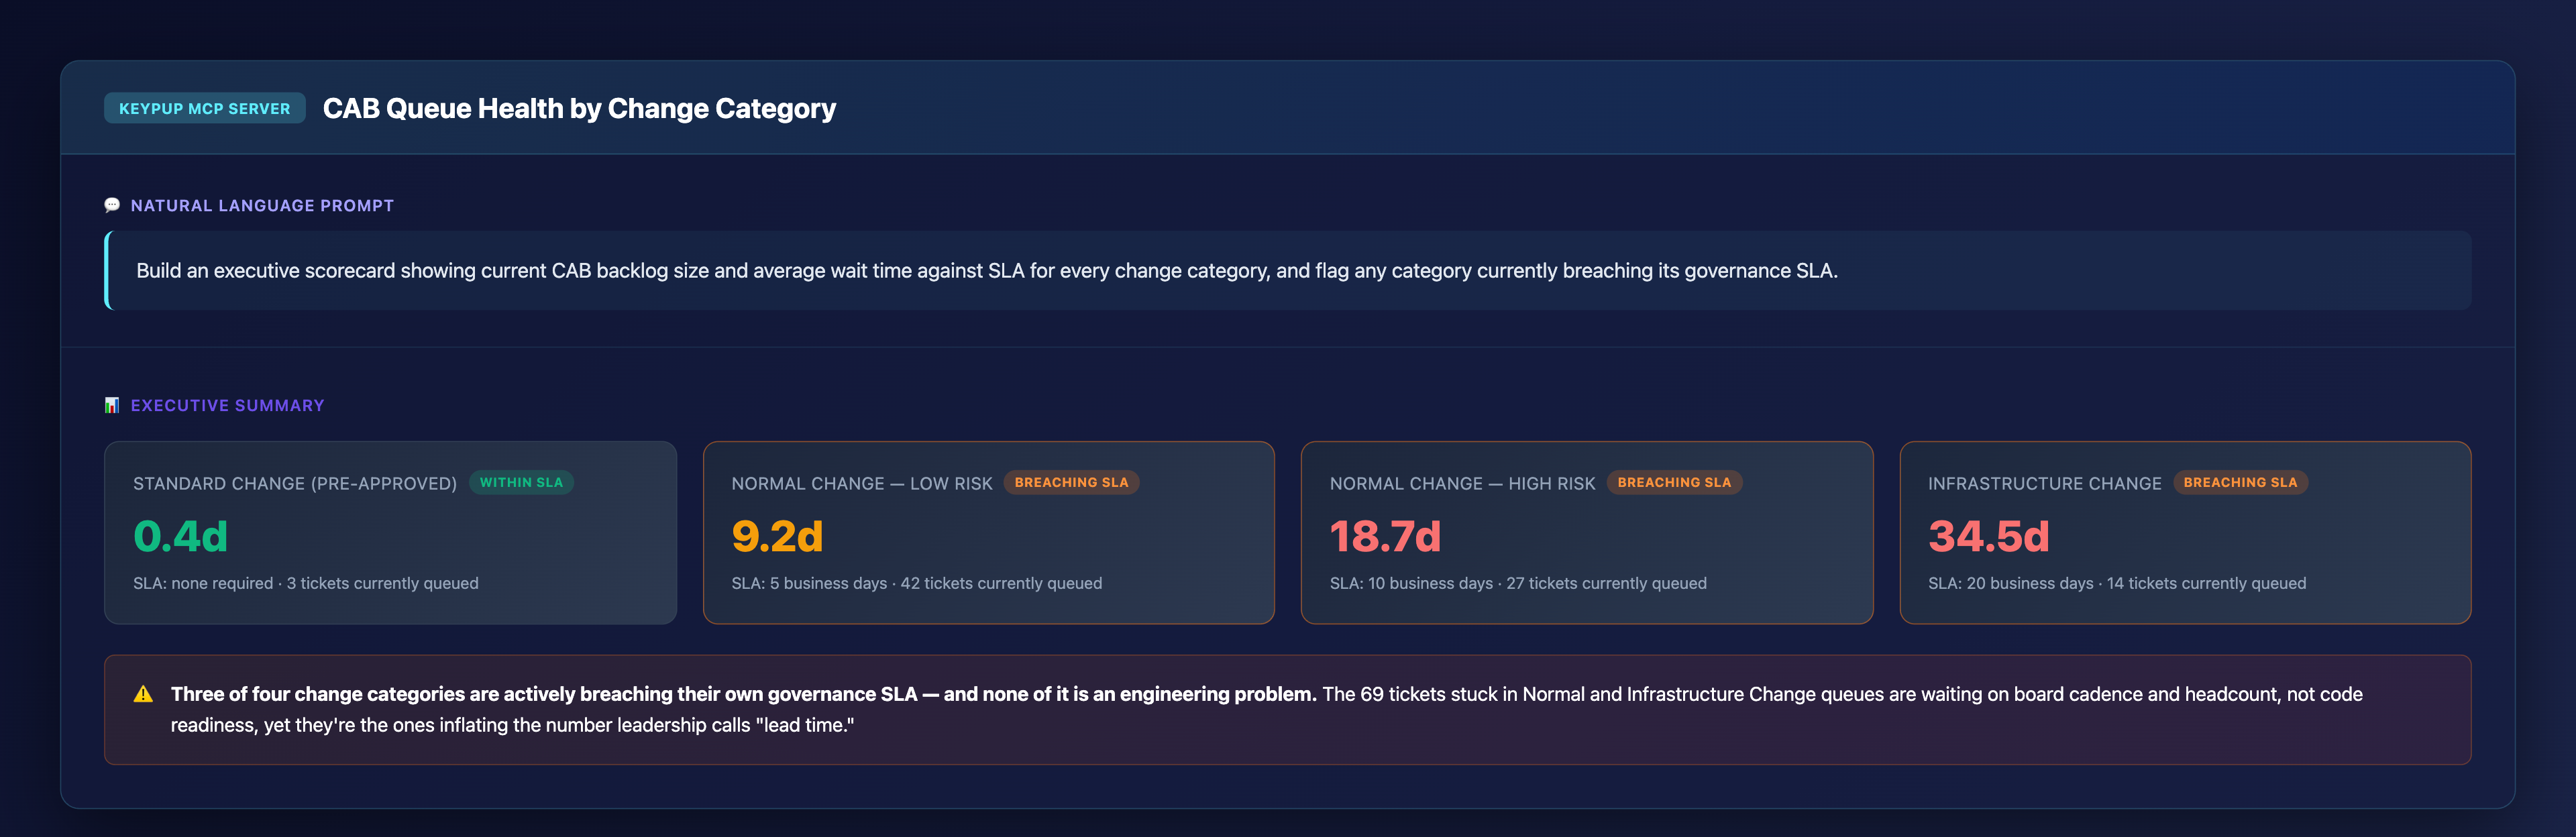
Build an executive scorecard showing current CAB backlog size
and average wait time against SLA for every change category, and
flag any category currently breaching its governance SLA.
Output: CAB Queue Health by Change Category
Key Insight: Three of four change categories are actively breaching their own governance SLA — and none of it is an engineering problem. The 69 tickets stuck in Normal and Infrastructure Change queues are waiting on board cadence and headcount, not code readiness, yet they're the ones inflating the number leadership calls "lead time."
The Technical Implementation: How Keypup MCP Separates the Two Clocks
Stage-Level Timestamps, Not Just Start and End
Keypup MCP tracks the full lifecycle of a change — first commit, merge-ready, CAB submission, CAB approval, scheduled release — as distinct timestamps, not a single created-to-deployed span. That's what makes decomposing "Lead Time for Changes" into engineering time and governance time possible in the first place.
Change-Category-Aware SLA Tracking
Because ITIL change types (Standard, Normal, Emergency, Infrastructure) carry fundamentally different governance requirements, Keypup MCP lets you tag each ticket's change category and its own SLA, instead of forcing every change into one universal "lead time" benchmark that fits none of them well.
Natural-Language Querying Across Both Clocks
No custom dashboard or SQL required. Engineering leaders, PMO, and compliance teams can all ask the same underlying data different questions — "how fast is engineering," "how backed up is CAB," "which category is breaching SLA this month" — and get an answer scoped to exactly what they asked, not a blended number that answers none of them well.
Real-World Impact: Enterprise Case Studies
Case Study 1: Global Regional Bank
Before Keypup MCP:
Executive Lead Time for Changes dashboard showed a steady climb from 8 to 12 days over two quarters, triggering repeated "velocity" reviews with the engineering VP
Engineering leadership had no data-backed way to show that coding and review time were essentially unchanged
Sprint planning was adjusted twice in response to the trend, with no measurable effect on the reported number
After Keypup MCP:
Lead Time decomposed into engineering time and CAB queue time in the same board reporting package used for the original "velocity" reviews
Engineering-controlled time confirmed flat at ~3.6 hours across the same period the aggregate metric had climbed 50%
CAB backlog reporting adopted by the PMO as a standing item, redirecting the conversation from engineering headcount to review board capacity
"We stopped having the same defensive conversation every quarter the moment we could show the board two lines instead of one. One line was flat. One line tracked exactly with CAB volume. Nobody asked us to 'go faster' again after that meeting — they asked the PMO about CAB staffing instead."
— VP Engineering, Regional Bank
Case Study 2: Multi-State Healthcare Payer
Before Keypup MCP:
Infrastructure changes were routinely taking over a month end to end, with no visibility into how much of that was engineering versus the monthly Infrastructure CAB cadence
Compliance and engineering blamed each other informally, with no shared data either side trusted
No per-change-category SLA existed, so "slow" had no agreed definition
After Keypup MCP:
Per-category SLA and actual wait time published jointly by engineering and the compliance office, replacing informal blame with a shared, documented baseline
Infrastructure Change backlog became a tracked KPI reviewed monthly instead of surfacing only when a release slipped
Engineering's reported "lead time" stopped being conflated with compliance wait time in quarterly business reviews going forward
"Once the SLA table existed, the conversation changed from 'engineering is slow' to 'this specific queue is breaching its own target by two weeks.' That's a staffing and cadence conversation, not a code quality conversation — and it's the first time both sides agreed on what the number even meant."
— Director of Compliance & Release Management, Healthcare Payer
Implementation: Getting Started with Keypup MCP
1. Decompose Before You Defend
Before responding to any "why is lead time rising" conversation, get the engineering-controlled time and the governance queue time as two separate numbers. You can't defend a number you haven't broken apart yet.
2. Attach an SLA to Every Change Category, Not Just One Global Target
Standard, Normal, Emergency, and Infrastructure changes carry fundamentally different risk profiles and should carry fundamentally different SLAs. A single "lead time" target flattens that distinction and hides exactly which category is actually the problem.
3. Query in Natural Language, No Dashboard Required
Just ask:
"What percentage of our lead time is CAB queue wait versus engineering time this month?"
"Which change categories are currently breaching their governance SLA?"
"Has the CAB review cadence changed in the last two quarters?"
"Show engineering-controlled time next to DORA-reported lead time for the board deck"
4. Automate Recurring Governance Reporting
Schedule recurring queries for:
Monthly Lead Time decomposition ahead of every leadership review
SLA breach alerts by change category as soon as a queue crosses its threshold
Quarterly trend charts proving (or disproving) whether engineering time is actually changing
CAB backlog scorecards feeding directly into PMO and compliance reporting
The Bottom Line: A Compliance Calendar Isn't a Velocity Problem
DORA's Lead Time for Changes was never built to distinguish active engineering work from mandatory governance wait — and in a regulated enterprise, that distinction is the entire story. Fixing it requires:
✅ Decomposing "lead time" into engineering time and CAB queue time, instead of defending one blended number ✅ Attaching an SLA to every change category, not a single global governance target ✅ Proving the trend with two lines, not one, so leadership sees exactly which clock is actually moving ✅ Naming the specific queues breaching SLA, with backlog counts the PMO can act on ✅ Making the decomposition a standing report, not a one-time defense you have to repeat every quarter
Keypup MCP turns "our lead time is rising" from a recurring, defensive conversation into a precise, shared measurement — one that finally routes the compliance calendar's cost to the compliance calendar, not to engineering's scorecard.
Get Started
Ready to stop defending a metric your team doesn't fully control?
Start Free Trial — Connect your engineering stack in minutes and start decomposing Lead Time for Changes today.
Request Demo — See how engineering leaders in regulated industries use Keypup MCP to separate engineering time from governance wait time.
View MCP Documentation — Technical details for engineering and compliance teams implementing Keypup MCP.
Keywords: ITIL CAB governance lead time, Change Advisory Board bottleneck metrics, DORA Lead Time for Changes regulated industries, lead time telemetry distortion, engineering metrics compliance queue, CAB SLA breach reporting, enterprise change management analytics, regulated enterprise DORA metrics, MCP server ITIL governance, finance healthcare telecom release governance
Ready to Transform Your Analytics?
Join teams already using AI to make data-driven decisions faster than
ever.
Centralizing SDLC data across ten business units exposes a governance vacuum long before it delivers insight: seven competing "story point" scales, four business units with no named data owner, and a workflow taxonomy nobody was ever assigned to define. This isn't a GDPR problem — it's a political and technical negotiation over who owns what data, and who is accountable when a poorly maintained JIRA board quietly skews a portfolio-wide metric. Discover how Keypup MCP makes data ownership, definition consistency, and governance maturity measurable across every business unit.
Rolling out SDLC analytics across an enterprise takes more than an engineering VP's buy-in. If HR misreads flow metrics in performance reviews, or Product Management keeps demanding features while ignoring system health, the initiative quietly becomes an "engineering-only project" that never earns organization-wide trust. Discover how Keypup MCP builds the guardrails, translations, and cross-functional accountability that make SDLC analytics stick beyond engineering.
Enterprises already juggle dozens of tools for project management, CI/CD, monitoring, and HR. Before adding a Software Engineering Intelligence platform, IT architects and procurement teams need to weigh true integration cost, training burden, and vendor lock-in risk — not just the license fee. Discover how Keypup MCP delivers engineering insight through the tools your teams already use, with no new dashboard, no new login, and a fraction of the total cost of ownership.