The Headcount Paradox: Why Hiring More Engineers Didn't Speed Up Delivery
Engineering headcount grew 50%, yet merged pull requests and delivered Jira issues barely moved. Learn what engineering leaders on Reddit say about hiring that slows teams down, and how Keypup MCP uses pull request, review and Jira data to show where the extra capacity goes: review queues, overloaded reviewers and work that now spans several repositories.
TL;DR: Most growing engineering organizations see the same pattern: headcount goes up 50%, merged pull requests go up 10%, and delivered Jira issues barely move. This is the headcount paradox. New engineers don't write code more slowly. Their pull requests wait in review queues that a handful of senior reviewers can't absorb, and more of the work now crosses repository and team boundaries. The Keypup MCP Server reads every pull request with its author, repository, first commit, review request, first review and merge dates, every review with its reviewer, and every Jira issue with the pull requests linked to it. Your AI assistant can then compare output per active author before and after hiring, split cycle time into coding, waiting and review, measure how concentrated reviews are, find the repositories where growth slowed delivery the most, and show how much work now needs several repositories to ship.
The board approved the hiring plan because the roadmap was late. A year later the team is 60% bigger, the payroll is 60% bigger, and the roadmap is still late. The CFO asks the obvious question: what did we get for the money? Most engineering leaders can't answer it with data, because the data that would explain it sits across Git, code review and Jira.
The Friction: More People, Same Output
Fred Brooks wrote in 1975 that adding people to a late project makes it later. Fifty years on, enterprises still plan capacity as if it scales linearly:
Budgets assume linear capacity. Roadmaps are sized in engineer-quarters. Ten more engineers should mean ten engineer-quarters more each quarter.
Onboarding is measured, absorption isn't. Organizations track how fast new hires ship their first pull request. Few track what their pull requests do to everyone else's.
Review capacity doesn't grow with headcount. New engineers open pull requests from week two. They are rarely trusted to approve someone else's for months.
Teams split, and work starts crossing boundaries. Growing teams are divided into smaller ones, each owning fewer repositories. A feature that one team shipped alone now needs two.
The outcome: headcount grows in a straight line, and output grows along a curve that flattens.
Why This Matters: The Real Cost of the Headcount Paradox
The Budget Problem
An engineer in a large organization costs $150,000 to $250,000 a year fully loaded. Adding 120 engineers adds $20–30 million a year. If they add a sixth of the output of the existing team per person, most of that spend buys queue time.
The Credibility Problem
When delivery doesn't speed up after a hiring plan, the conclusion leadership draws is usually "engineering is inefficient". The real cause — review capacity and coordination — is structural and fixable, but invisible without data.
The Senior-Engineer Problem
The few engineers trusted to review absorb most of the growth. Their own work slows, their review load doubles, and they become the first people to leave. Losing one of them makes the queue worse.
The Enterprise Discussion: What Engineering Leaders Are Actually Saying
"We doubled the team and shipped less", "all my seniors do is review" and "every feature needs three teams now" come up again and again wherever engineering directors and VPs compare notes. The quotes below are representative of recurring threads on r/ExperiencedDevs, r/EngineeringManagers and r/cscareerquestions.
"We went from 120 to 200 engineers in a year. The board expected the roadmap to move 60% faster. It moved maybe 10%. I can't explain it with anything but anecdotes, and anecdotes don't survive a budget meeting."
Principal Engineer, E-commerce Platform (r/ExperiencedDevs)
"Since the hiring wave I spend four hours a day reviewing PRs from people who joined in the last six months. My own work happens after 6 p.m. Management sees velocity going up because more PRs are opened. Nobody sees the queue."
"We split two teams into five to make room for the new hires. Now every feature touches three repos owned by three teams, and half our cycle time is waiting for the other team to review or merge."
The pattern holds: organizations measure headcount and output separately, and almost none of them measure what happens between the two.
How Keypup MCP Explains Where the Extra Capacity Went
The Keypup Model Context Protocol (MCP) Server gives your AI assistant structured access to the data Keypup imports from GitHub, GitLab, Bitbucket and Azure DevOps and from Jira. For this analysis, what matters is every pull request — its author, repository, creation, first commit, review request, first review and merge dates — every review with its reviewer and submission date, and every Jira issue with the pull requests linked to it and their repositories and authors.
Keypup doesn't import HR data, so it doesn't know your headcount. It measures active authors: the distinct people who authored at least one merged pull request in the period. That is the part of headcount that ships code, and it moves with hiring. Bot accounts are excluded by username. All comparisons below use the last full quarter, 2026-Q3, against the same quarter a year earlier, 2025-Q3.
1. Checking Whether Hiring Sped Up Delivery
The first question is the one the board asks.
MCP Prompt:
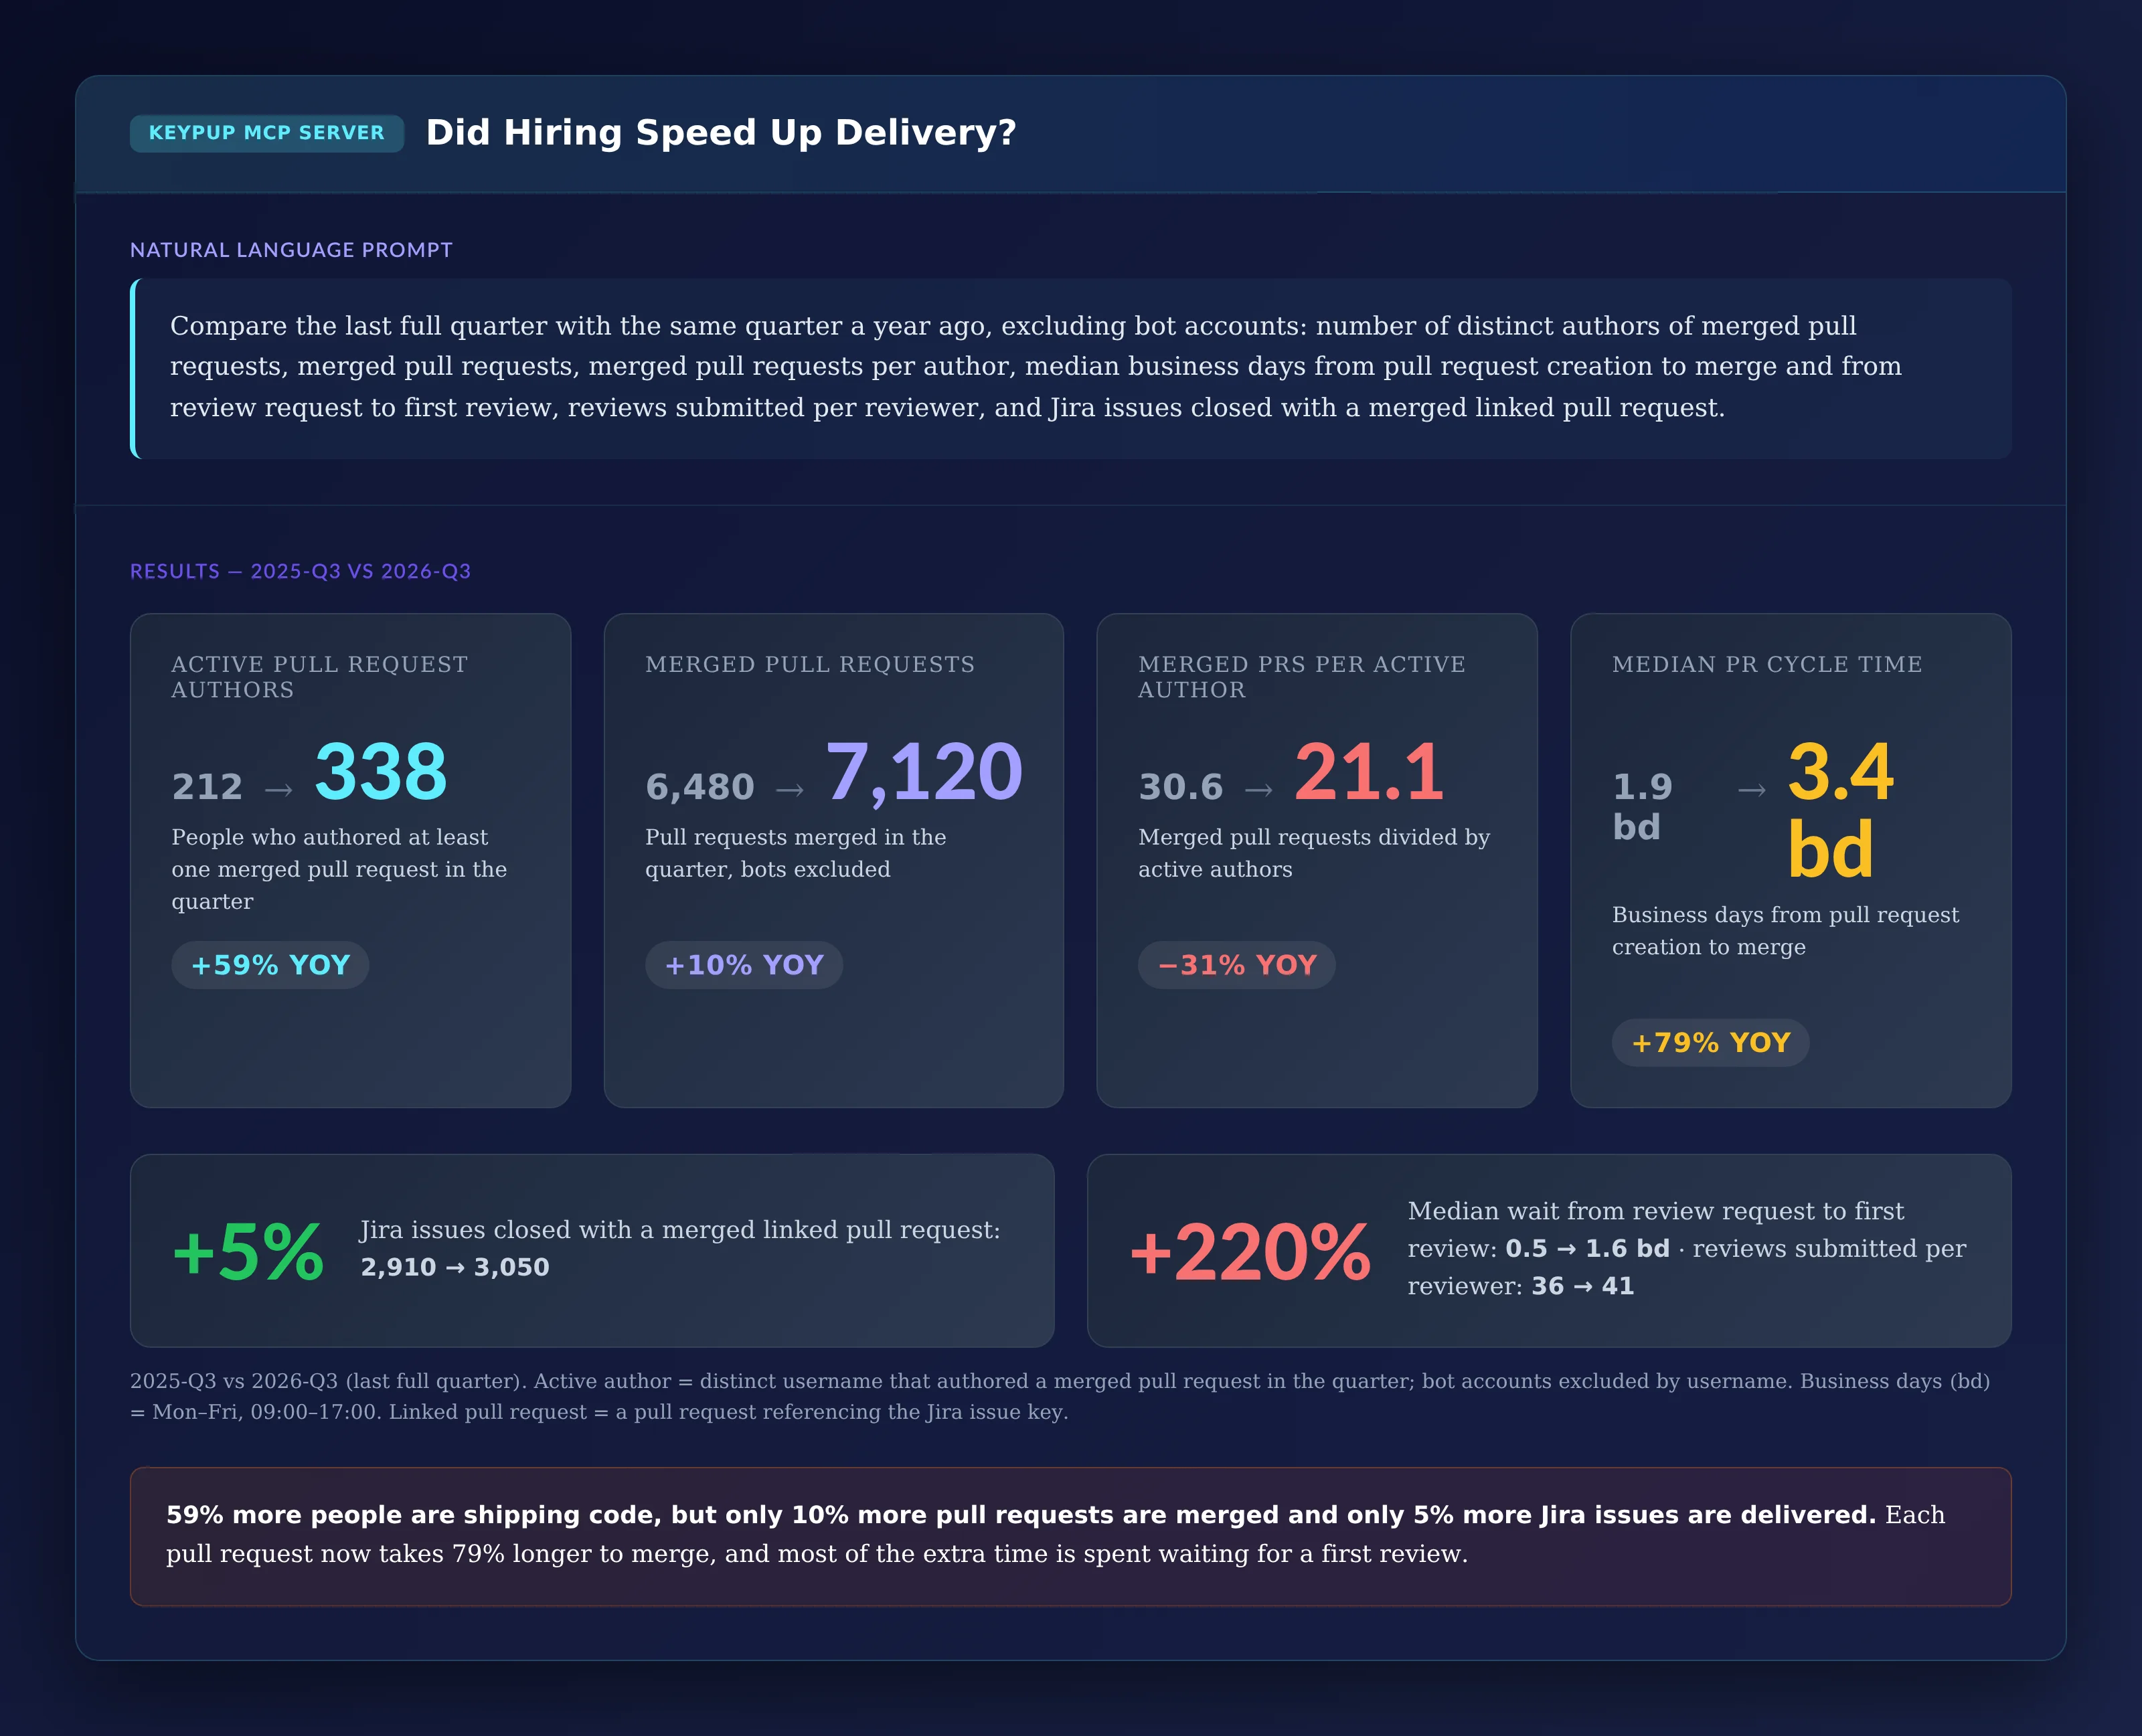
Compare the last full quarter with the same quarter a year ago,
excluding bot accounts: number of distinct authors of merged pull
requests, merged pull requests, merged pull requests per author,
median business days from pull request creation to merge and from
review request to first review, reviews submitted per reviewer, and
Jira issues closed with a merged linked pull request.
Output: Did Hiring Speed Up Delivery?
Key Insight: 59% more people shipped code, but merged pull requests rose 10% and delivered Jira issues 5%. Output per author fell by almost a third and each pull request takes 79% longer to merge. The largest single change is the wait for a first review, which more than tripled.
2. Following Throughput Quarter by Quarter
A year-over-year comparison can hide when the change happened. The quarterly trend shows whether output per person fell when hiring started.
MCP Prompt:
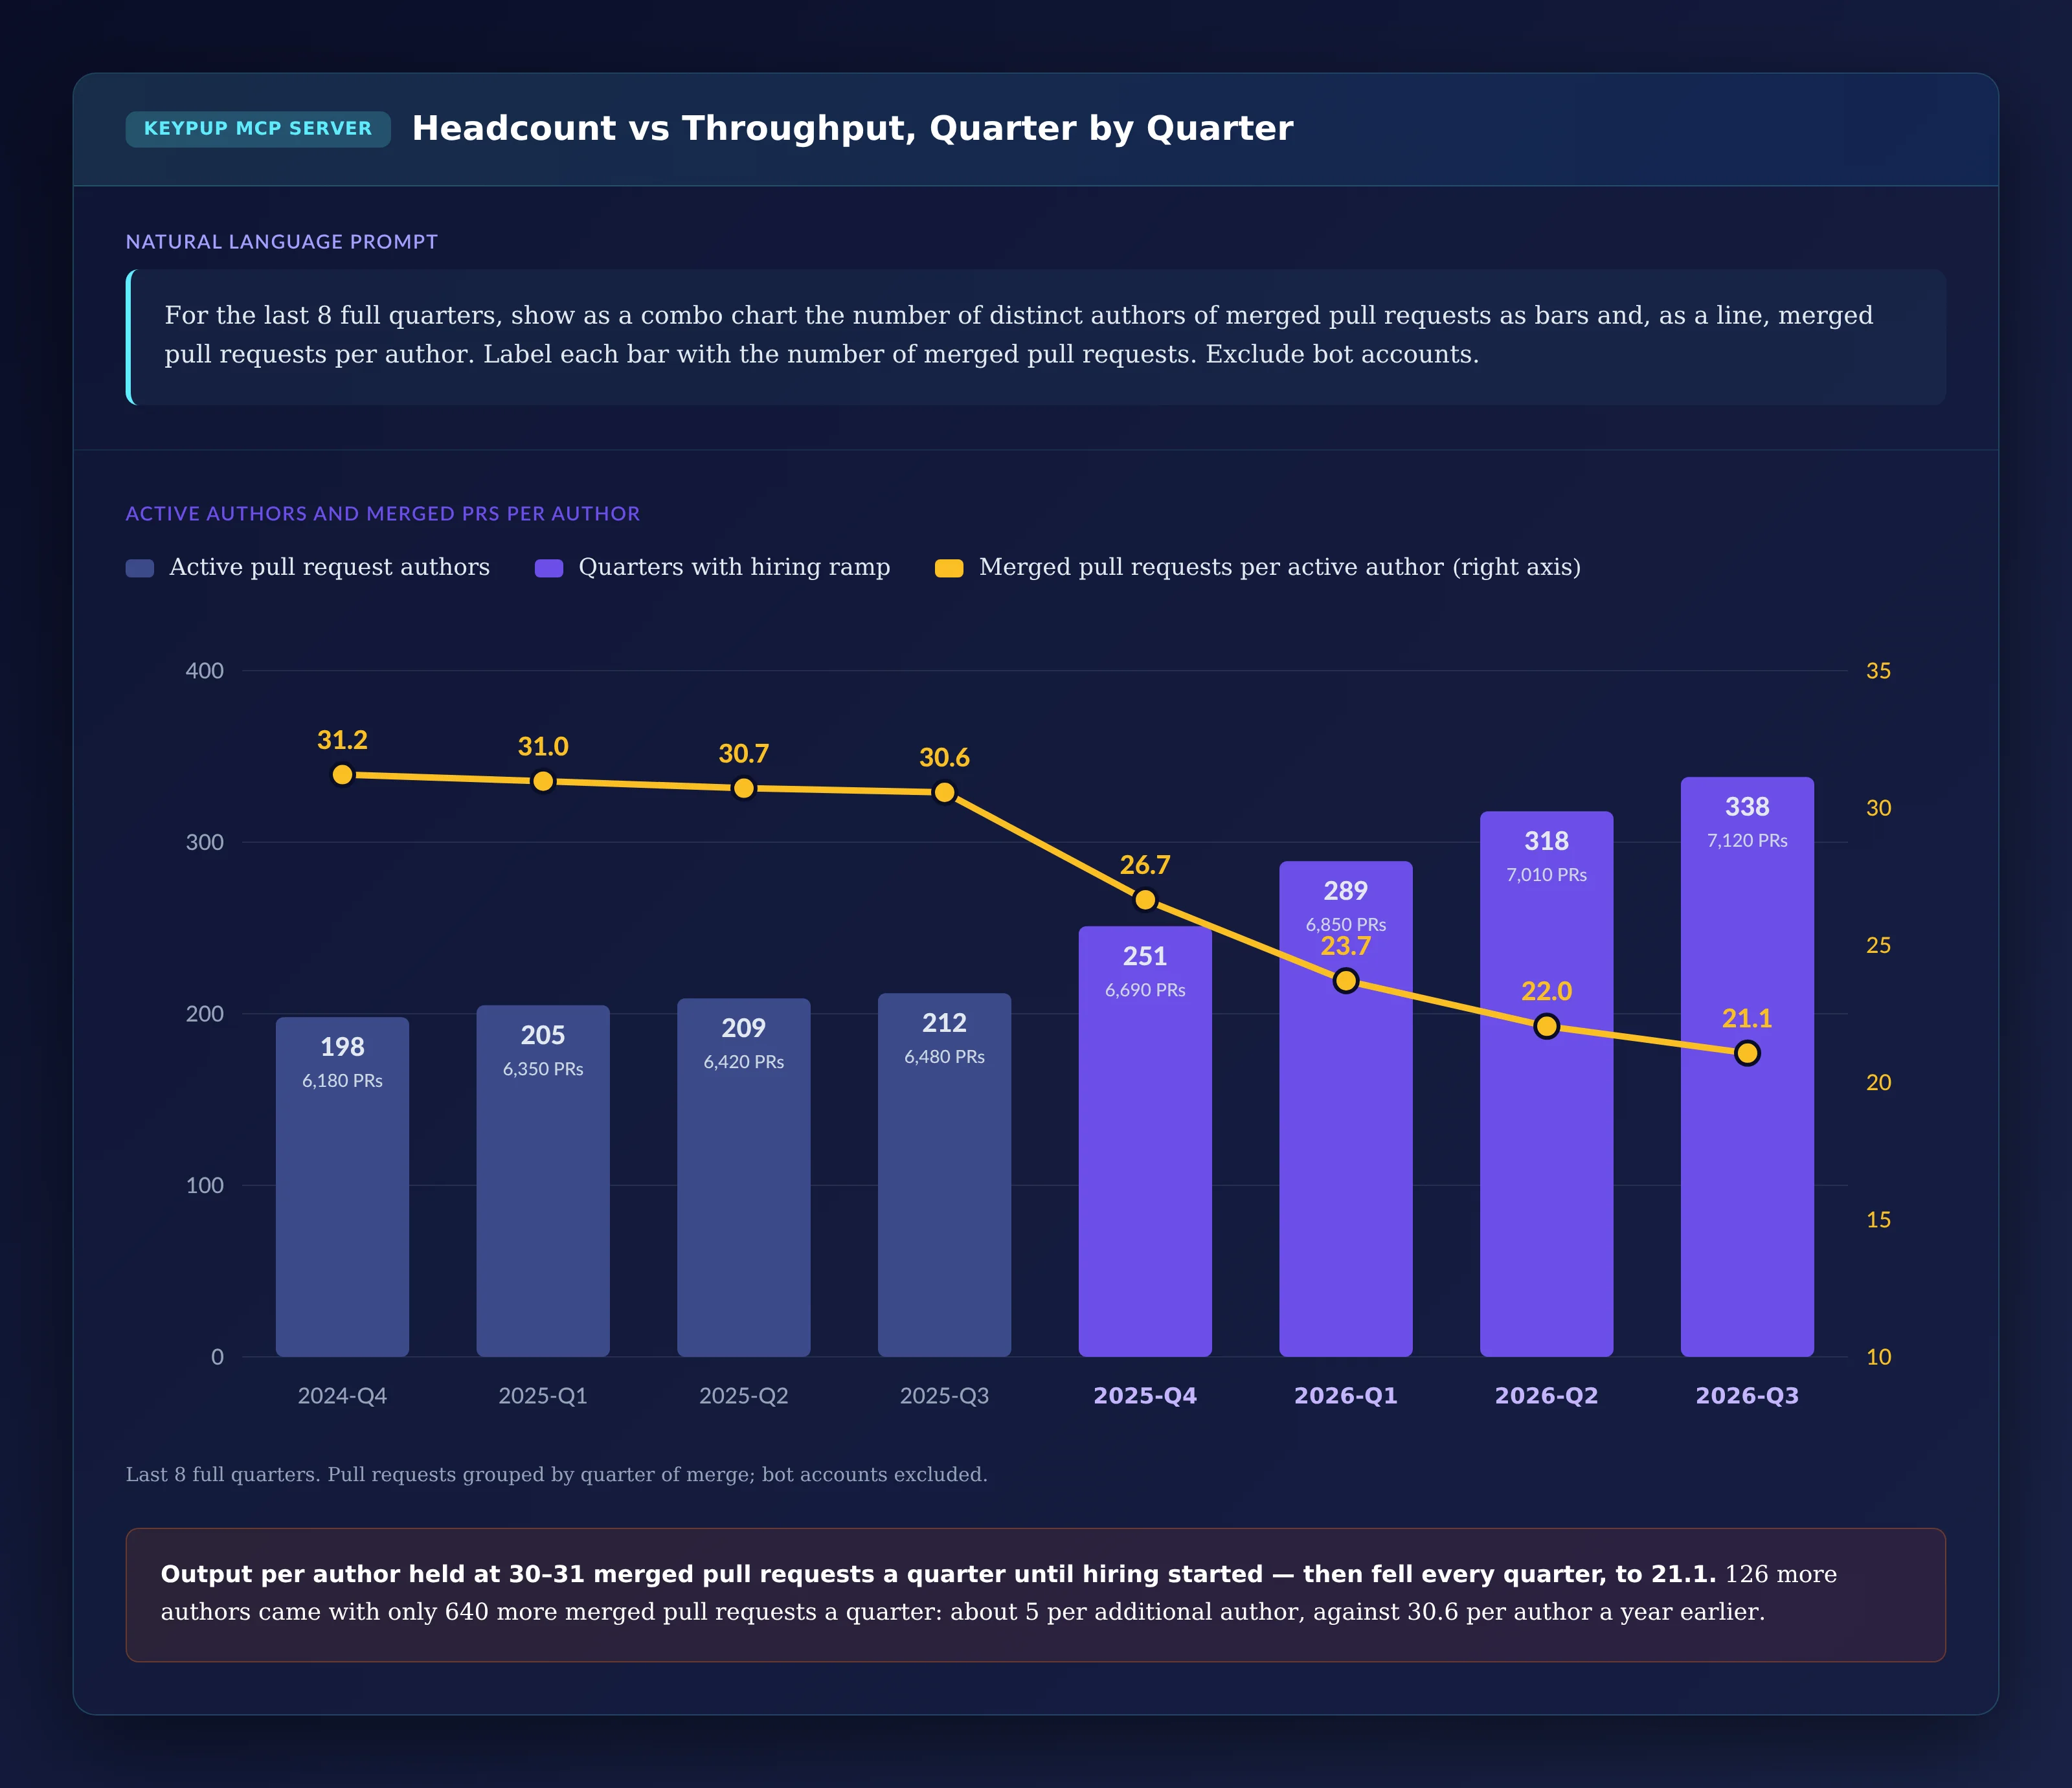
For the last 8 full quarters, show as a combo chart the number of
distinct authors of merged pull requests as bars and, as a line,
merged pull requests per author. Label each bar with the number of
merged pull requests. Exclude bot accounts.
Output: Headcount vs Throughput, Quarter by Quarter
Key Insight: Output per author held at 30–31 merged pull requests a quarter for a year, then fell every quarter once author numbers started rising. Between 2025-Q3 and 2026-Q3, 126 more authors came with only 640 more merged pull requests: about five per additional author, against 30.6 per author a year earlier.
3. Splitting Cycle Time Into Coding, Waiting and Review
If new engineers were simply slower, coding time would grow. Splitting the pull request lifecycle shows where the time actually went.
MCP Prompt:
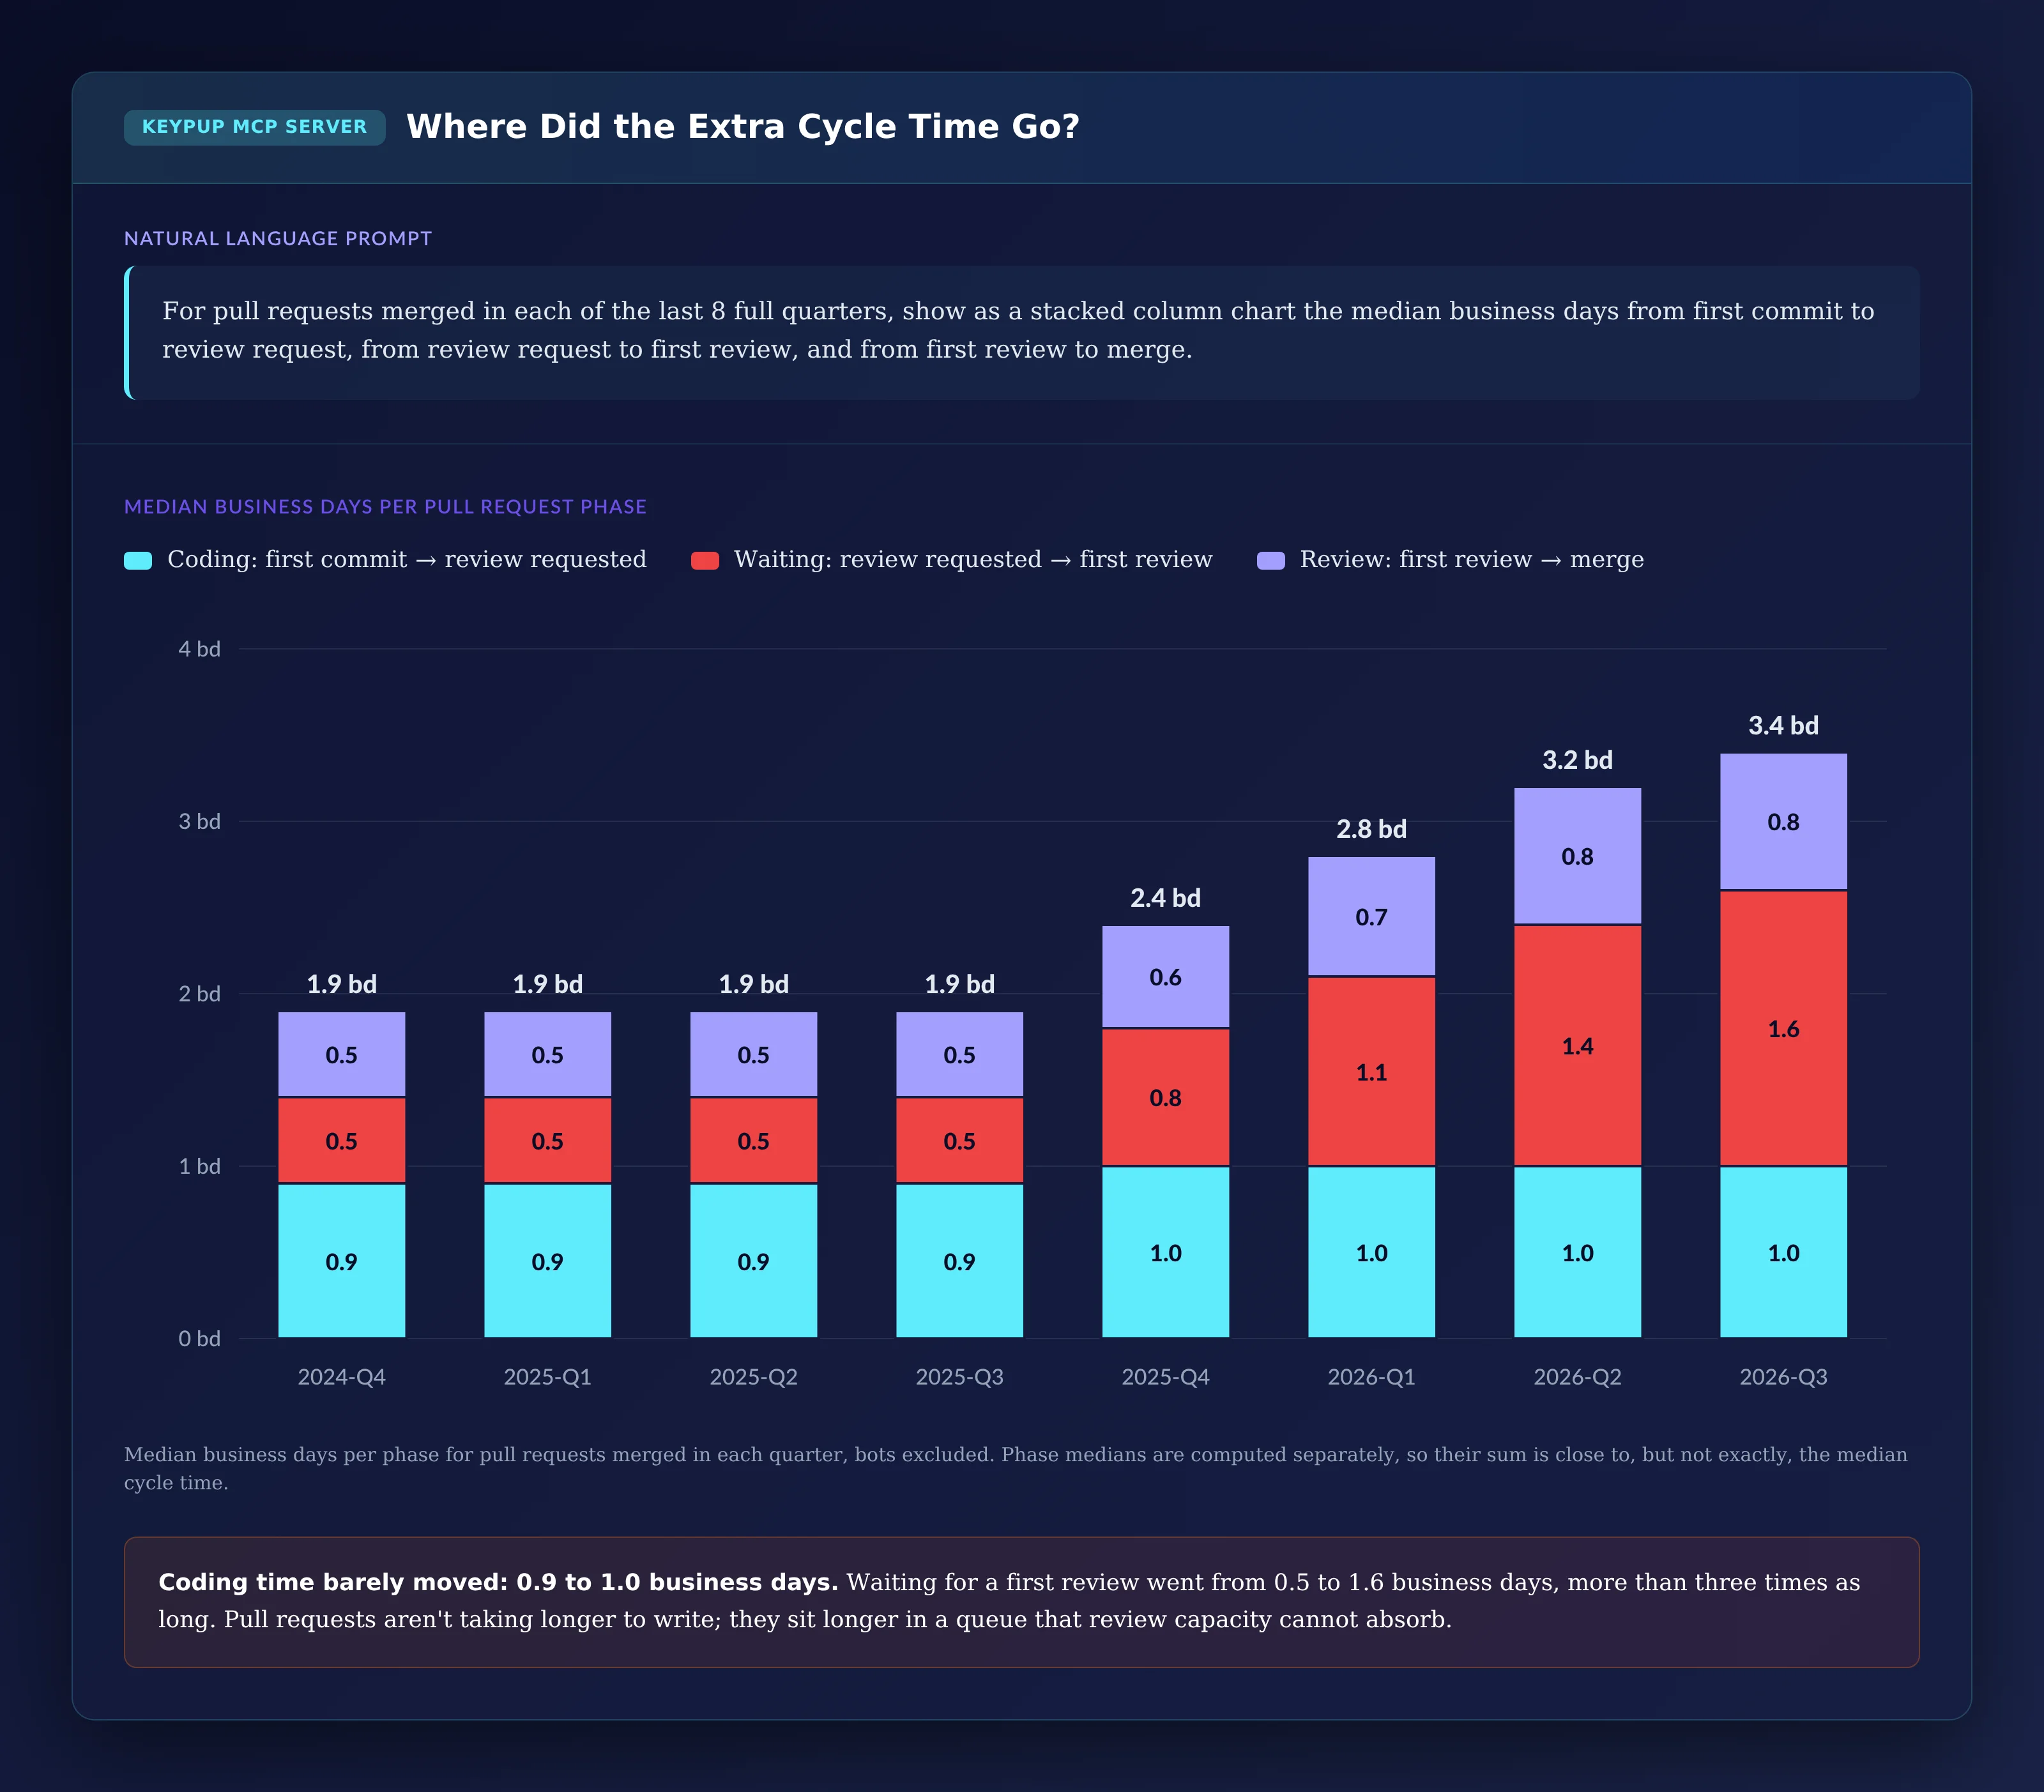
For pull requests merged in each of the last 8 full quarters, show
as a stacked column chart the median business days from first
commit to review request, from review request to first review, and
from first review to merge.
Output: Where Did the Extra Cycle Time Go?
Key Insight: Coding time per pull request barely moved, from 0.9 to 1.0 business days. Waiting for a first review went from 0.5 to 1.6 business days. Pull requests aren't taking longer to write; they sit longer in a queue that review capacity can't absorb.
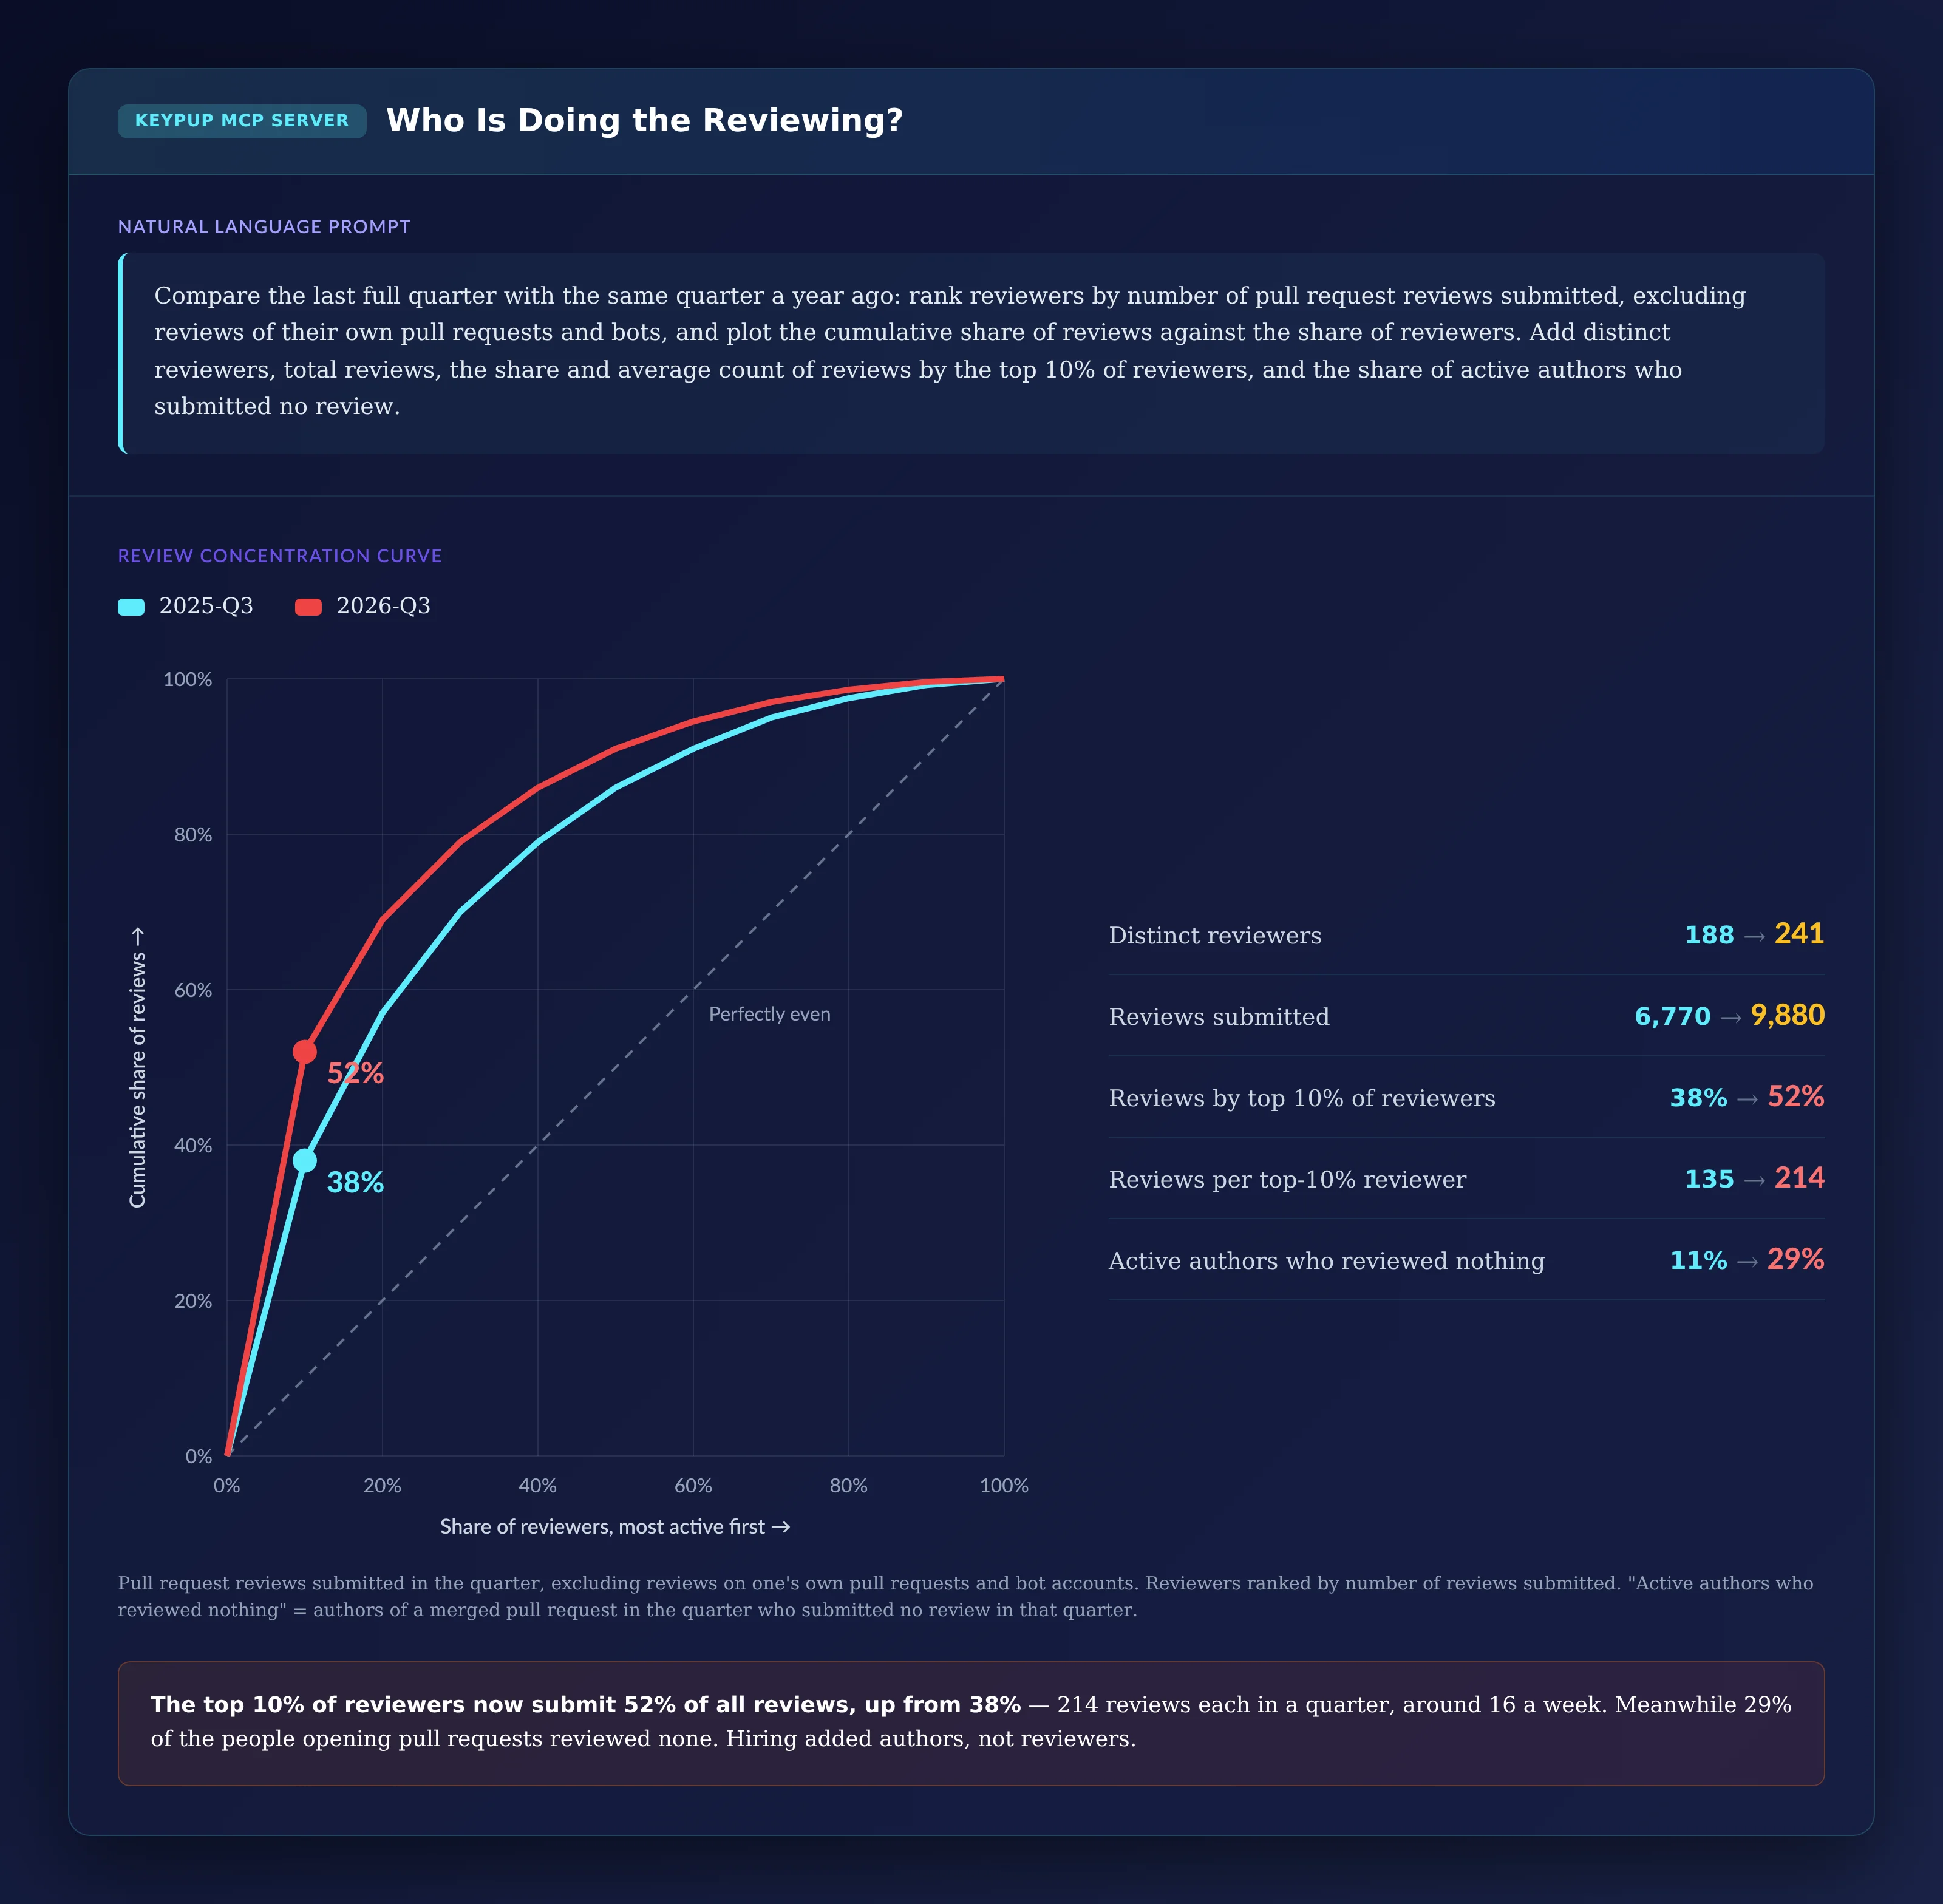
4. Measuring How Concentrated Reviews Are
A queue forms when reviews depend on a few people. A concentration curve shows how few.
MCP Prompt:
Compare the last full quarter with the same quarter a year ago: rank
reviewers by number of pull request reviews submitted, excluding
reviews of their own pull requests and bots, and plot the cumulative
share of reviews against the share of reviewers. Add distinct
reviewers, total reviews, the share and average count of reviews by
the top 10% of reviewers, and the share of active authors who
submitted no review.
Output: Who Is Doing the Reviewing?
Key Insight: The top 10% of reviewers now submit 52% of all reviews, up from 38% — 214 reviews each in a quarter, around 16 a week. Meanwhile 29% of the people opening pull requests reviewed none. Hiring added authors, not reviewers.
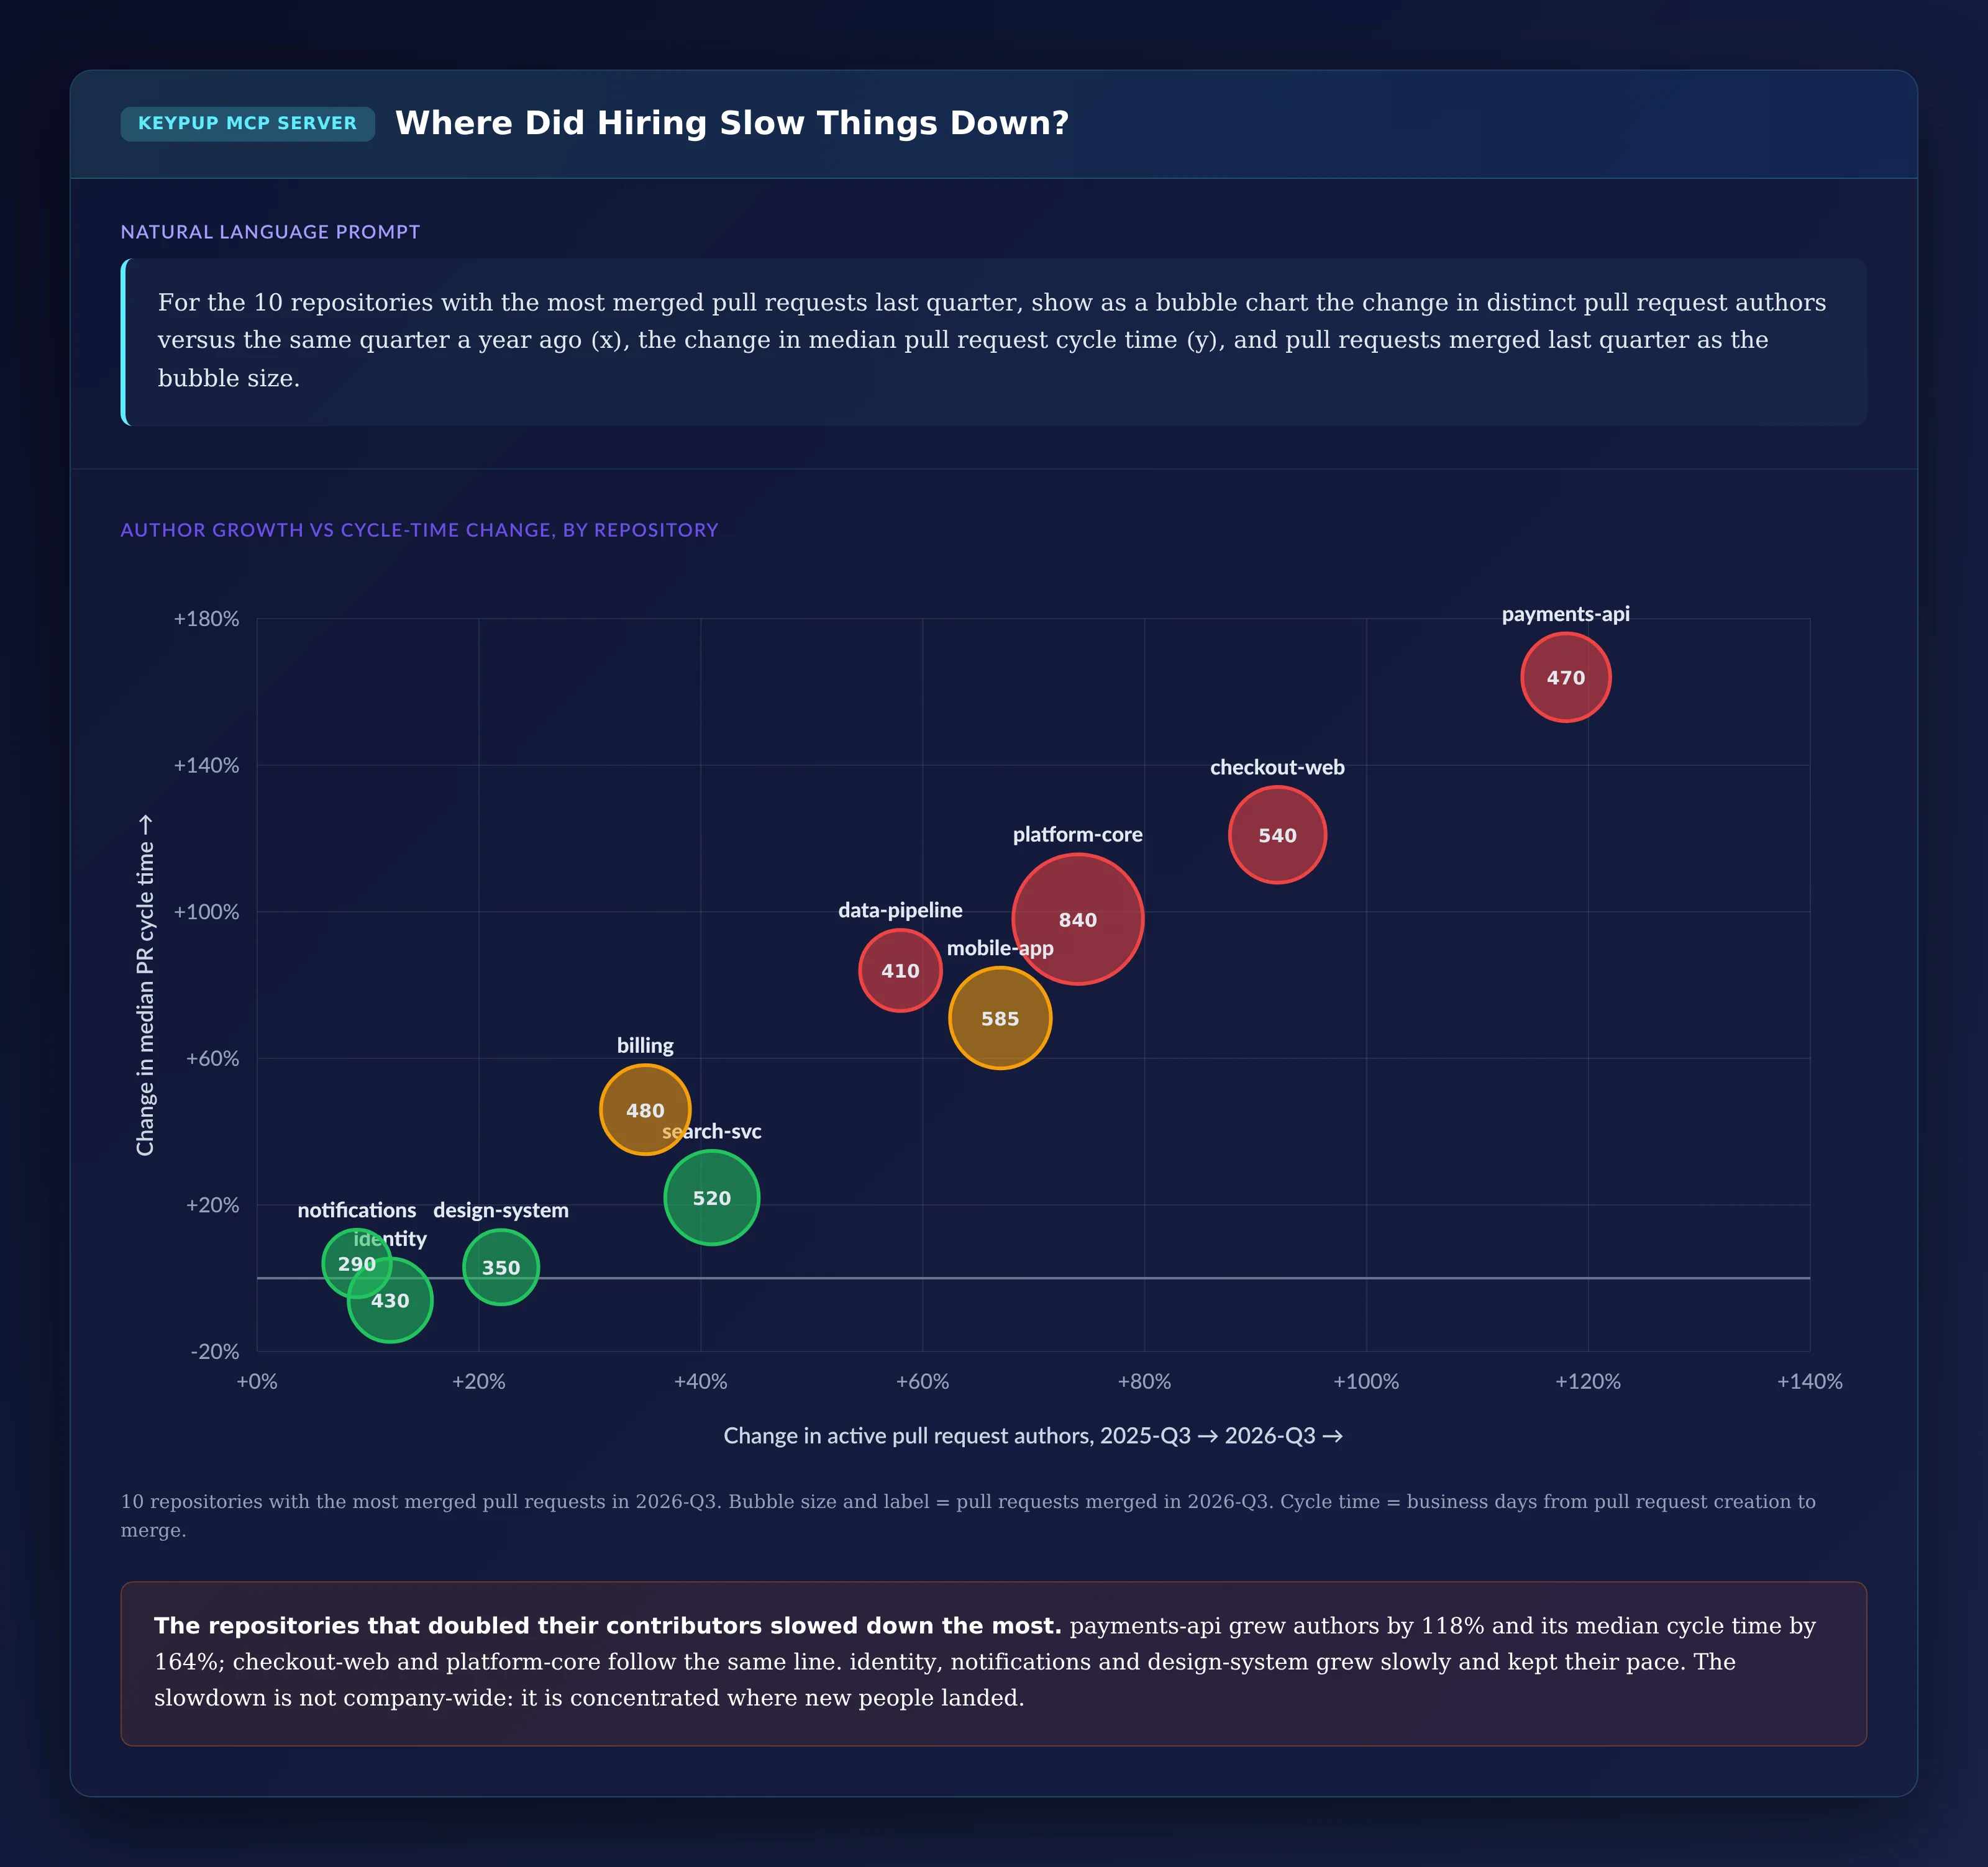
5. Finding Where Growth Slowed Delivery the Most
Hiring is rarely spread evenly. Comparing author growth with cycle-time change by repository shows where it hurt.
MCP Prompt:
For the 10 repositories with the most merged pull requests last
quarter, show as a bubble chart the change in distinct pull request
authors versus the same quarter a year ago (x), the change in median
pull request cycle time (y), and pull requests merged last quarter
as the bubble size.
Output: Where Did Hiring Slow Things Down?
Key Insight: The repositories that doubled their contributors slowed down the most. payments-api grew authors by 118% and its median cycle time by 164%; checkout-web and platform-core follow the same line. identity, notifications and design-system grew slowly and kept their pace. The slowdown isn't company-wide: it is concentrated in the repositories with the most new contributors.
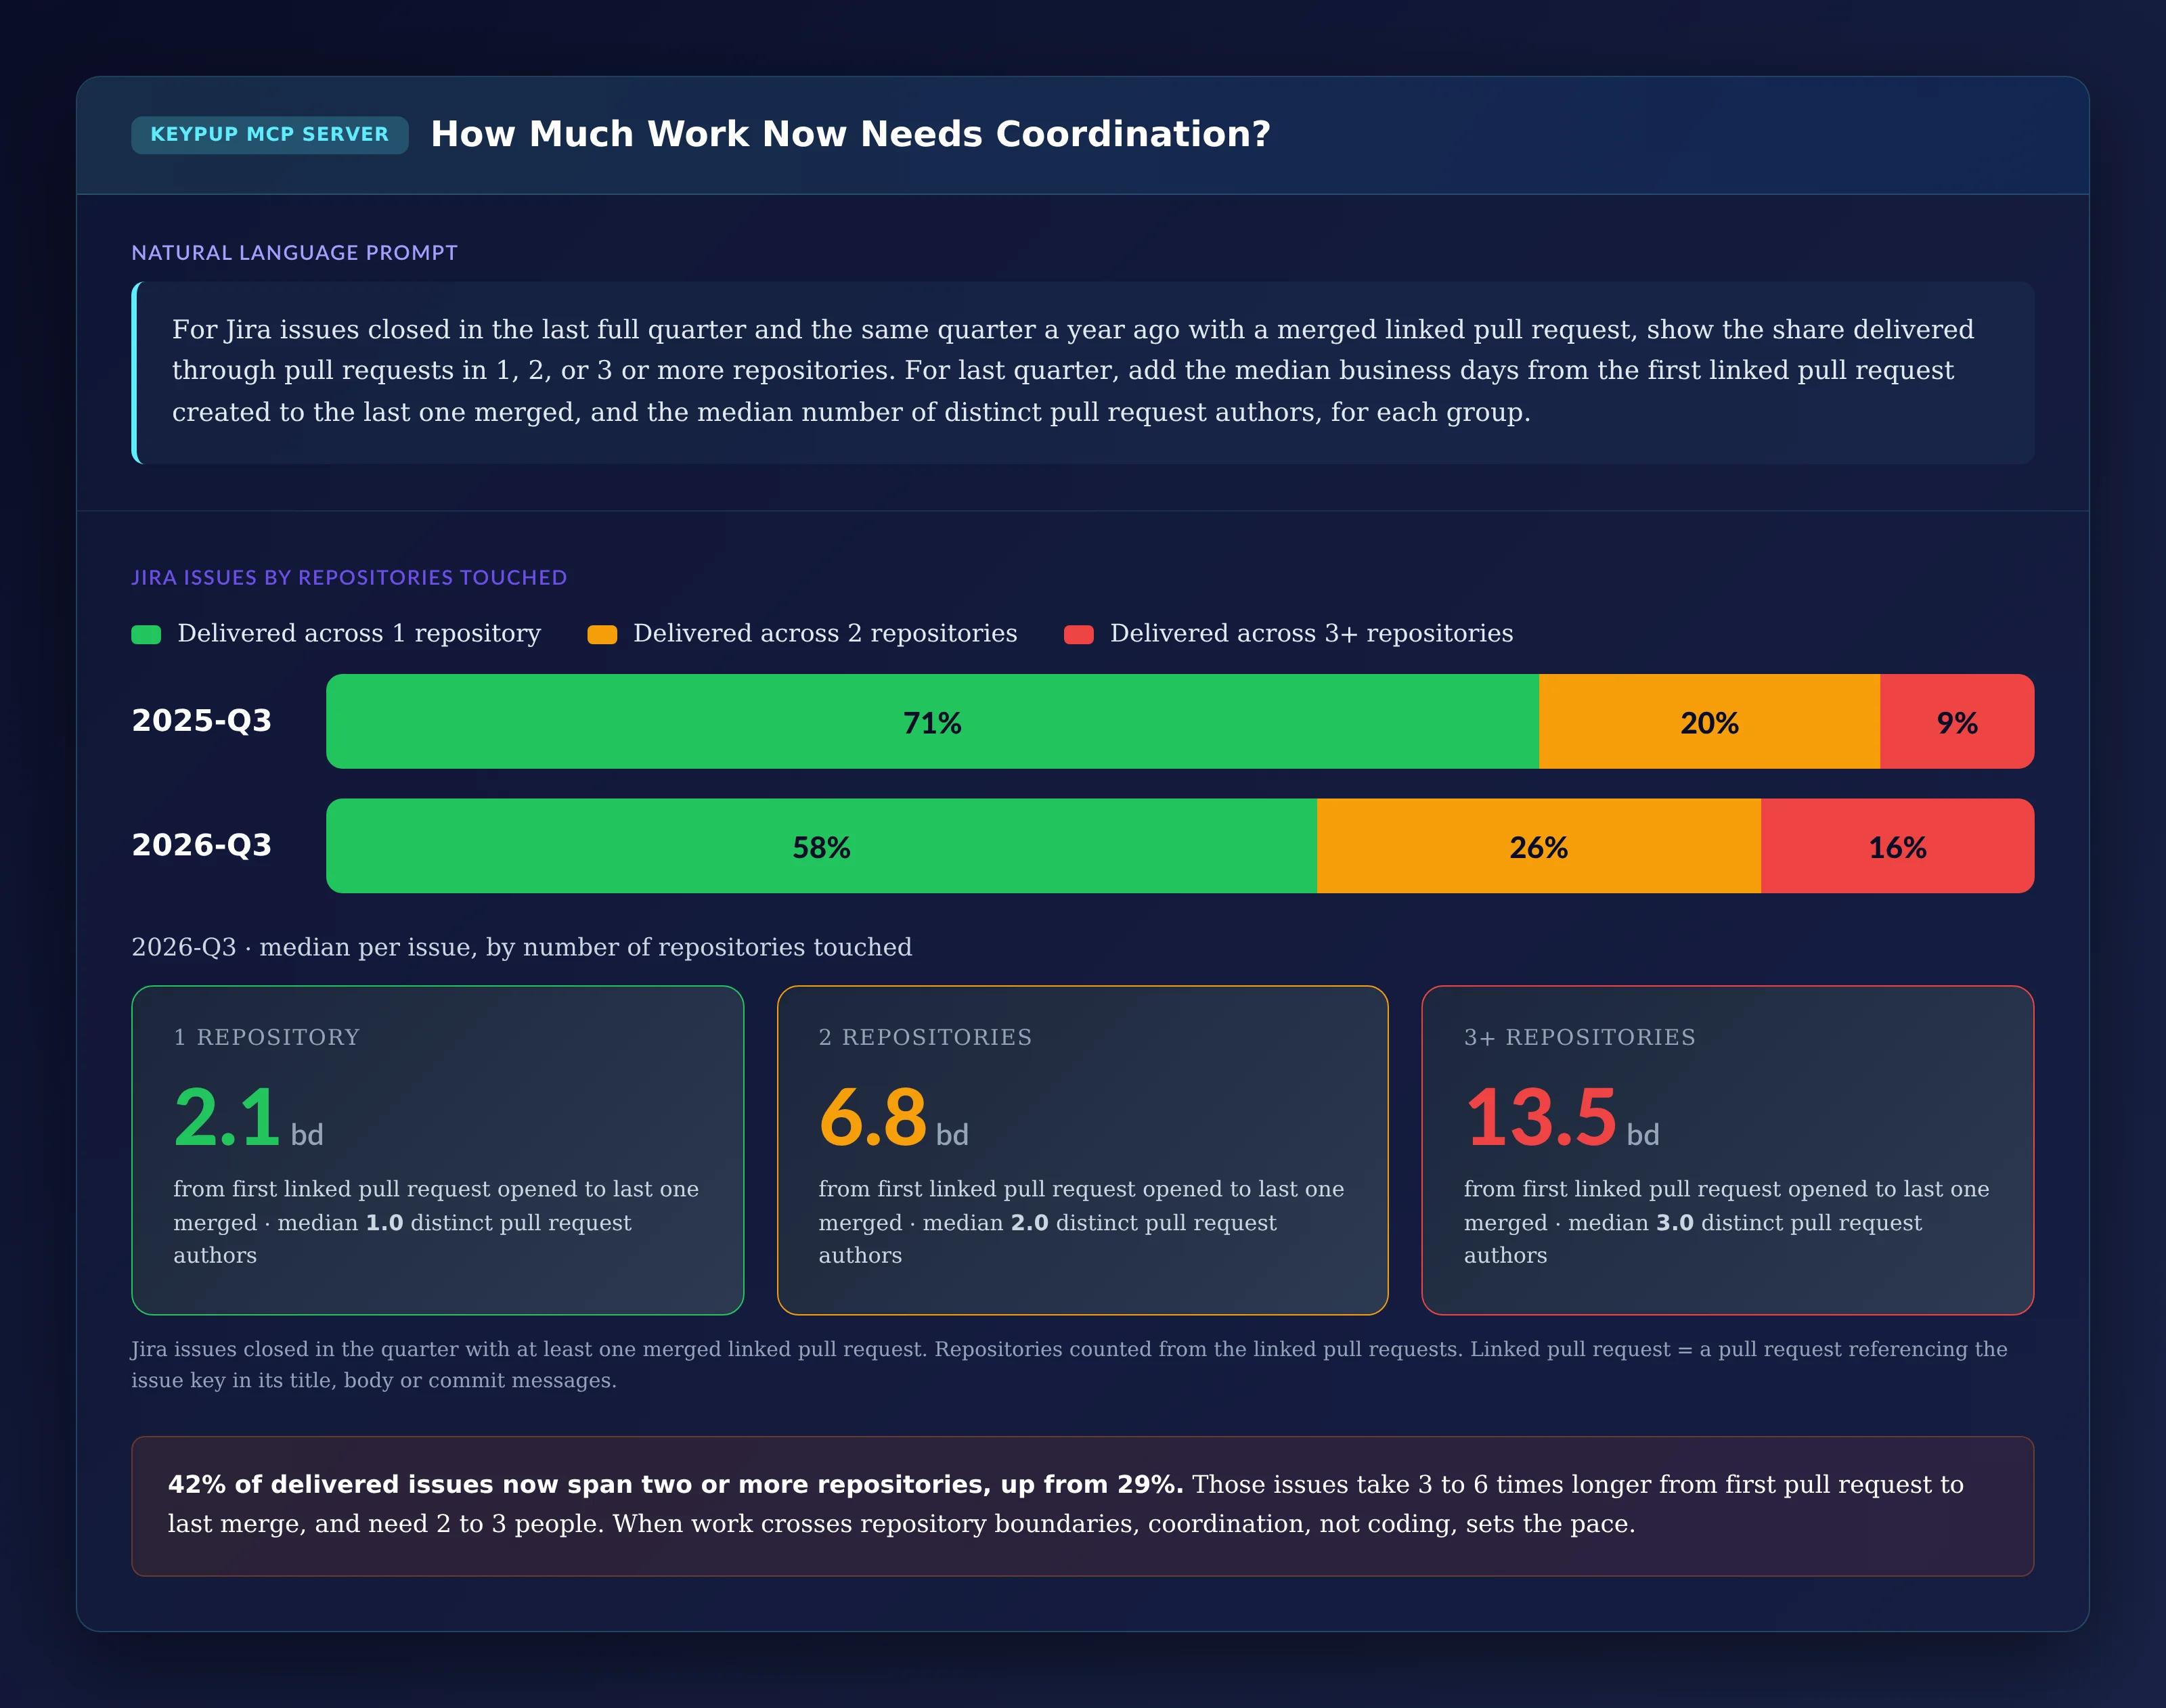
6. Measuring How Much Work Now Needs Coordination
When teams split, a feature that one team shipped alone needs pull requests in several repositories. Jira issues and their linked pull requests show how much.
MCP Prompt:
For Jira issues closed in the last full quarter and the same quarter
a year ago with a merged linked pull request, show the share
delivered through pull requests in 1, 2, or 3 or more repositories.
For last quarter, add the median business days from the first linked
pull request created to the last one merged, and the median number
of distinct pull request authors, for each group.
Output: How Much Work Now Needs Coordination?
Key Insight: 42% of delivered issues now span two or more repositories, up from 29%. Those issues take 3 to 6 times longer from first pull request to last merge and involve 2 to 3 authors. Keypup doesn't record reorganizations, but if your teams were split to absorb new hires, this is where it shows: more work crosses repository boundaries, and coordination, not coding, sets the pace.
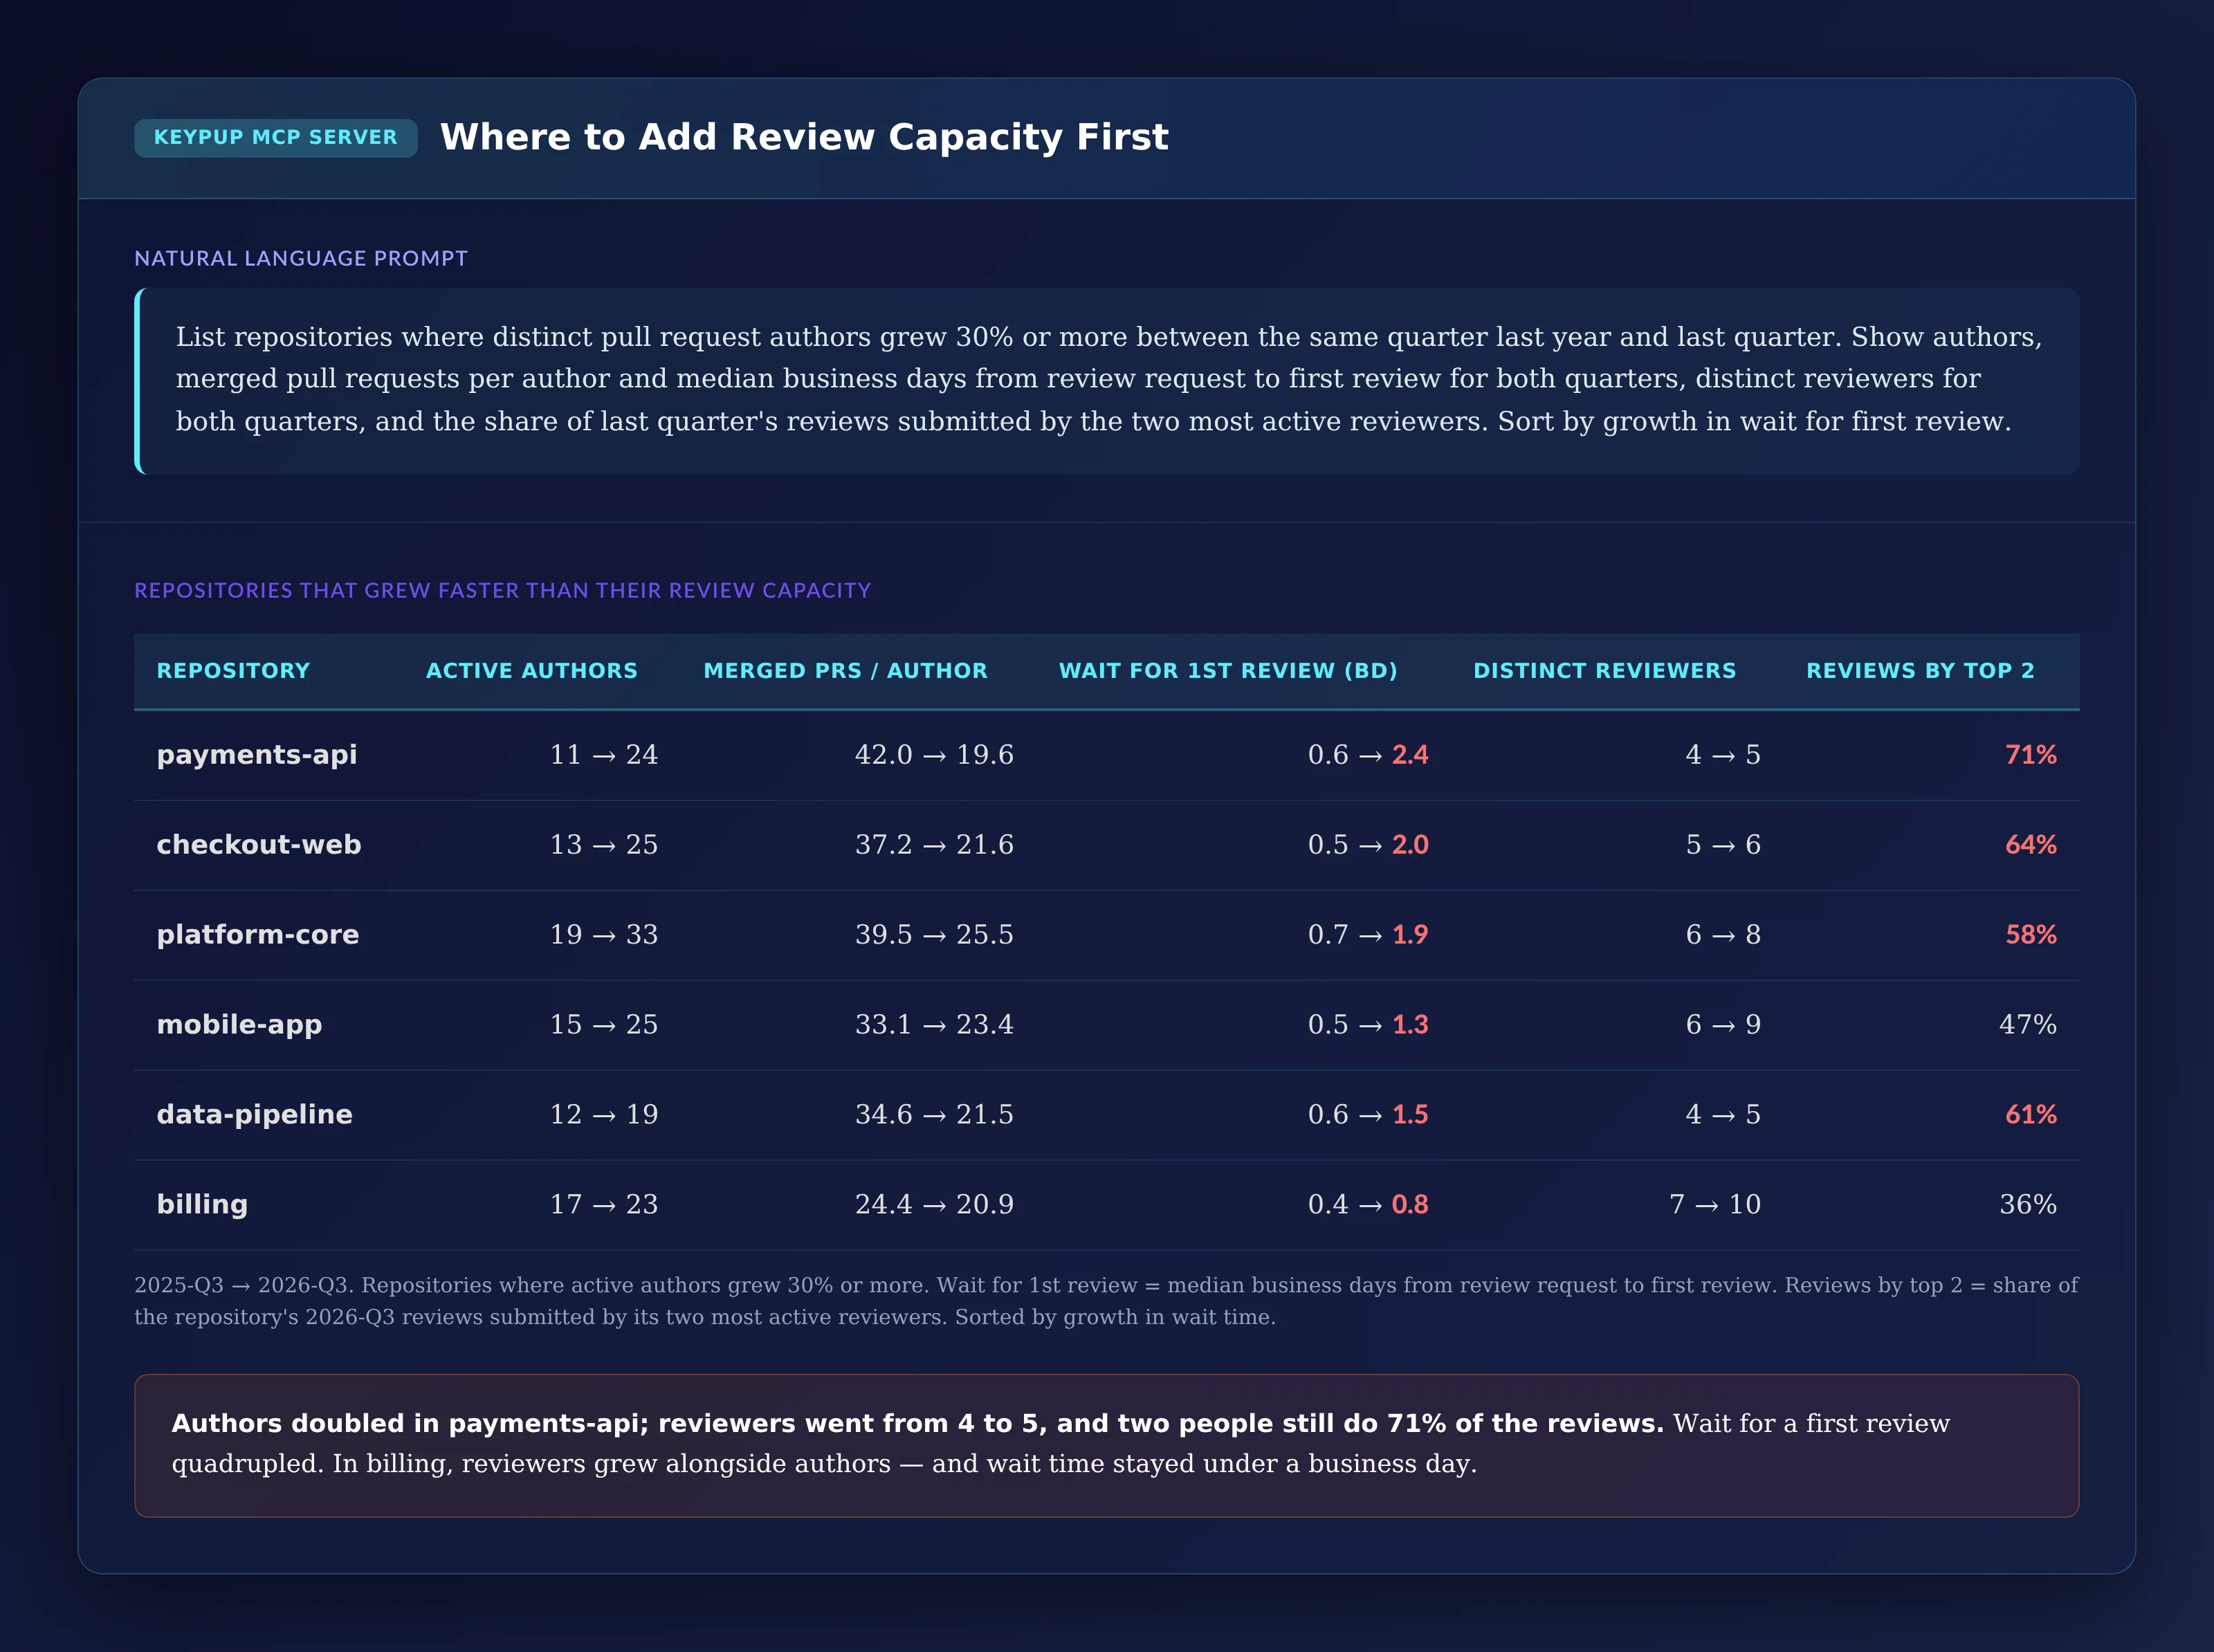
7. Deciding Where to Add Review Capacity First
The last step turns the analysis into a short list of repositories where review capacity hasn't kept up with authors.
MCP Prompt:
List repositories where distinct pull request authors grew 30% or
more between the same quarter last year and last quarter. Show
authors, merged pull requests per author and median business days
from review request to first review for both quarters, distinct
reviewers for both quarters, and the share of last quarter's reviews
submitted by the two most active reviewers. Sort by growth in wait
for first review.
Output: Where to Add Review Capacity First
Repository
Active authors
Merged PRs / author
Wait for 1st review (bd)
Distinct reviewers
Reviews by top 2
payments-api
11 → 24
42.0 → 19.6
0.6 → 2.4
4 → 5
71%
checkout-web
13 → 25
37.2 → 21.6
0.5 → 2.0
5 → 6
64%
platform-core
19 → 33
39.5 → 25.5
0.7 → 1.9
6 → 8
58%
mobile-app
15 → 25
33.1 → 23.4
0.5 → 1.3
6 → 9
47%
data-pipeline
12 → 19
34.6 → 21.5
0.6 → 1.5
4 → 5
61%
billing
17 → 23
24.4 → 20.9
0.4 → 0.8
7 → 10
36%
Key Insight: In payments-api, authors more than doubled; reviewers went from 4 to 5, and two people still submit 71% of the reviews. The wait for a first review quadrupled. In billing, reviewers grew alongside authors — and the wait stayed under a business day. The fix isn't fewer hires; it's growing review capacity with them.
The Technical Implementation: What Keypup MCP Actually Reads
Every number above comes from data Keypup already imports from your Git platforms and Jira. It helps to be precise about what it is — and what it isn't.
Active Authors Are Not Headcount
Keypup doesn't import HR or payroll data. It counts active authors: distinct usernames that authored a merged pull request in the period. Engineering managers, architects and people who mostly review won't appear as authors, and someone using two accounts counts twice. To compare with your real headcount, put the two numbers side by side yourself.
Bots Are Excluded by Username
Dependency and release bots open many pull requests. Keypup doesn't flag bot accounts on its own; the prompts exclude them by username, for example with a pattern such as [bot] or a list of your service accounts. Agree on that list once and reuse it.
Cycle-Time Phases Come From Pull Request Dates
Each pull request carries its first commit, review request, first review and merge dates. The phases are the business days between them, with Keypup's BUSINESS_DAYS function (Monday to Friday, 09:00 to 17:00, time zone configurable). A pull request opened without a formal review request has no waiting phase; ask your assistant to fall back to the creation date for those. Business days don't account for public holidays.
Reviews Come From the Review Dataset
Each submitted review carries its reviewer, its state and the pull request it belongs to, including that pull request's author and repository. Review concentration and reviews per reviewer come from it. Authors who never review are found by comparing the authors of merged pull requests with the reviewers of the same quarter, which your assistant does with one query on each dataset. Comments left outside a formal review aren't counted as reviews.
Cross-Repository Work Depends on Issue Links
Keypup links a pull request to a Jira issue when the pull request references the issue key — in its title, or in its body or a commit message after a closing keyword such as "fixes" or "resolves". Each issue then carries its linked pull requests, their repositories, authors, and first creation and last merge dates. If many pull requests don't reference a key, the cross-repository view only covers the ones that do: check the share of merged pull requests linked to an issue first.
Repositories Stand In for Teams
The analysis uses repositories because that's what every pull request carries. If your teams map to Jira projects, labels or groups of repositories, give that mapping to your assistant and it will group the results by team.
Real-World Impact: Enterprise Case Studies
Case Study 1: European Payments Company
Before Keypup MCP:
180 to 290 engineers in 14 months, funded by a growth round
Roadmap commitments missed for three quarters running
A board narrative of "onboarding takes time" with no data to support or refute it
After Keypup MCP:
The phase breakdown showed coding time flat and first-review wait up 3x, which moved the conversation from hiring quality to review capacity
The concentration curve identified 22 reviewers carrying half of all reviews; each team then named two new reviewers per quarter from engineers with six months' tenure, and reviews by the top 10% fell from 49% to 34%
Median wait for a first review dropped from 1.7 to 0.7 business days in two quarters, and merged pull requests per author recovered by 24% without further hiring
"The board thought we had hired the wrong people. The data showed we had hired the right people and given them nobody to review their code. That's a much easier problem to fix."
— CTO, European Payments Company
Case Study 2: North American Enterprise Software Vendor
Before Keypup MCP:
600 engineers reorganized from 12 to 31 teams to absorb a hiring wave
Feature lead times up 70% after the reorganization
Each team reporting healthy cycle times for its own pull requests
After Keypup MCP:
The cross-repository view showed 46% of delivered issues spanning two or more repositories, against 27% before the reorganization
Multi-repository issues took 5x longer from first pull request to last merge, which no team-level dashboard had shown
Nine teams were merged back into four around shared repositories; the multi-repository share fell to 31% and feature lead time dropped by 35%
"Every team's dashboard was green. The work just kept falling between them. Seeing how many issues needed three repositories made the reorganization problem obvious."
— SVP Engineering, North American Enterprise Software Vendor
Implementation: Getting Started with Keypup MCP
1. Connect Your Git Platforms and Jira
Connect GitHub, GitLab, Bitbucket or Azure DevOps and Jira to Keypup. Pull requests, reviews, commits and issues are imported automatically, including history.
2. List Your Bot Accounts
Write down the usernames of bots and service accounts so every prompt excludes them the same way.
3. Check How Many Pull Requests Reference an Issue Key
Ask your assistant for the share of merged pull requests linked to a Jira issue, by repository. Where it's low, agree on a convention — the issue key at the start of every pull request title is the easiest to enforce.
4. Map Repositories to Teams
If teams don't map one-to-one to repositories, give your assistant the mapping, so results come out by team as well as by repository.
5. Connect the MCP Server to Your AI Assistant
Follow the MCP documentation to connect Keypup to Claude, ChatGPT, Cursor or any MCP-compatible assistant.
6. Make It Part of Every Hiring Plan
Run the throughput comparison and the review concentration curve each quarter of a hiring plan, and track the wait for a first review in each repository that is growing. Add reviewers before the queue forms, not after.
Because new engineers add work to shared bottlenecks before they add capacity to them. Their pull requests need reviews from experienced engineers, and growing organizations split teams so more work crosses team boundaries. Output per person falls until review capacity and team structure catch up.
How do you measure engineering productivity after a hiring wave?
Compare merged pull requests and delivered issues per active author before and after hiring, and split pull request cycle time into coding, waiting for review and review. If coding time is stable and waiting time grows, the problem is review capacity, not the new hires.
What is review concentration and why does it matter?
Review concentration is the share of all code reviews submitted by the most active reviewers. When a small group submits half or more of all reviews, every new author lengthens their queue, and losing one of them slows everyone.
Can Keypup measure headcount?
No. Keypup doesn't import HR data. It measures active authors — people who authored a merged pull request in the period — which is the part of headcount that ships code. Compare it with your HR headcount to see how much of the organization contributes code directly.
The Bottom Line
Hiring is the most expensive lever an engineering leader has. Keypup MCP shows whether it's working:
✅ Comparing output per active author before and after hiring ✅ Following throughput quarter by quarter to see when it changed ✅ Splitting cycle time into coding, waiting for review and review ✅ Measuring review concentration and the authors who never review ✅ Finding the repositories where growth slowed delivery the most ✅ Measuring cross-repository work that needs several teams to ship ✅ Listing where to add review capacity first
Microservices promised independent teams. In many enterprises, a single Jira story still needs coordinated pull requests in four or five repositories. Learn what engineering leaders on Reddit say about distributed monoliths, lockstep releases and cross-repository changes, and how Keypup MCP links Jira issues to the pull requests that resolve them to measure how many changes span several repositories, what each extra repository costs in cycle time, and which repositories always change together.
Compare the 6 best engineering metrics software for board reporting in 2026 — Keypup, Swarmia, Code Climate Velocity, Jellyfish, Faros and LinearB — on board-ready reporting clarity, business context mapping, non-technical accessibility, DORA Metrics, customization and AI capabilities. Learn which metrics belong in an engineering board report and how to translate them into language your board understands.
Software capitalization, client billing and R&D tax credits all run on Jira time logs that engineers fill in on Friday afternoon, from memory. Learn what engineering and finance leaders on Reddit say about time tracking nobody trusts, and how Keypup MCP compares Jira worklogs with linked pull requests, commits and merges to show when time is logged, how late it arrives, and which hours have code behind them.