The Distributed Monolith Tax: When One Jira Story Needs Pull Requests in Five Repositories
Microservices promised independent teams. In many enterprises, a single Jira story still needs coordinated pull requests in four or five repositories. Learn what engineering leaders on Reddit say about distributed monoliths, lockstep releases and cross-repository changes, and how Keypup MCP links Jira issues to the pull requests that resolve them to measure how many changes span several repositories, what each extra repository costs in cycle time, and which repositories always change together.
TL;DR: Many enterprises split their platform into dozens or hundreds of repositories and services, yet a large share of their Jira stories still need coordinated pull requests in several repositories to ship. This is the distributed monolith tax: the coupling of a monolith with the coordination cost of microservices. It rarely shows up on a dashboard, because Git analytics look at one repository at a time and Jira doesn't look at repositories at all. The Keypup MCP Server links each Jira issue to the pull requests that resolve it, with their repository, authors, merge dates and lines changed. Your AI assistant can then measure how many issues span several repositories, what each extra repository adds to cycle time, how long repositories wait for each other between the first and last merge, which repository pairs always change together, and which half-shipped changes to unblock this week.
Every architecture review shows the same slide: clean boxes, one per service, each owned by one team, each deployable on its own. Then a product manager writes a story for a new checkout option, and five teams open five pull requests in five repositories, and the release waits for the slowest of them. The boxes are independent on the slide. The work isn't.
The Friction: Independent Services, Lockstep Changes
Splitting a platform into services is supposed to let teams ship without waiting for each other. In large organizations, several forces quietly undo that promise:
Shared contracts move together. A shared schema, protobuf or client library repository means any contract change lands in the contract repository, then in every producer and consumer.
Boundaries follow the org chart of five years ago. Services were cut along team lines that have since changed. Today's features cross those lines by default.
Front ends and gateways sit in the middle. A new field in a back-end service needs the gateway, the web app and the mobile app to follow.
Nobody measures it. Git analytics report per repository; Jira reports per project. A story that needed five repositories looks like five small, healthy pull requests and one slow ticket.
The result is a platform that has the operational cost of microservices and the coordination cost of a monolith.
Why This Matters: The Real Cost of the Distributed Monolith
The Lead Time Problem
When a change needs several repositories, its cycle time is the cycle time of the slowest one. Every review queue, every failing pipeline and every on-call interruption in any of the repositories adds to the whole story. Adding repositories multiplies the number of places the story can wait.
The Release Risk Problem
Pull requests in different repositories rarely merge on the same day. In between, one side runs new code against a partner that hasn't changed yet. Teams compensate with feature flags, version negotiation and "deploy in this order" instructions — the kind of process that fails at 2 a.m.
The Architecture Investment Problem
Platform teams spend quarters extracting services, and leadership approves the budget on the promise of team autonomy. Without delivery data, no one can tell whether the new boundaries actually reduced coordination — or simply added one more repository to every change.
The Enterprise Discussion: What Engineering Leaders Are Actually Saying
"We built a distributed monolith", "every feature touches six repos" and "we can't deploy one service without the others" come up again and again wherever architects, staff engineers and engineering directors compare notes. The quotes below are representative of recurring threads on r/ExperiencedDevs, r/softwarearchitecture, r/EngineeringManagers and r/devops.
Principal Engineer, Retail Platform (r/softwarearchitecture)
"We have 140 microservices and I can't remember the last feature that touched only one of them. Every story is a coordinated release across four teams. We got all the network hops of microservices and kept all the coupling of the monolith."
Director of Engineering, Fintech (r/EngineeringManagers)
"Our DORA numbers look great per repo: small PRs, fast reviews, daily merges. Product still says features take forever. It took us months to realize the delay is between the repos, not inside them. No dashboard we had could show it."
Staff Engineer, Insurance Group (r/ExperiencedDevs)
"The shared models library is the real monolith. Any change there means a PR in the library, a version bump and then PRs in every service that uses it. Half our 'quick fixes' are actually five-repo changes with a release order written in the ticket comments."
The pattern holds: organizations invest heavily in service boundaries, but almost none of them measure how often their work actually crosses those boundaries.
How Keypup MCP Measures Cross-Repository Changes
The Keypup Model Context Protocol (MCP) Server gives your AI assistant structured access to the data Keypup imports from Jira and from GitHub, GitLab, Bitbucket and Azure DevOps. For this analysis, what matters is that each Jira issue carries the list of pull requests that resolve it, and for those pull requests: their repositories, their authors, the dates of their first and last merge, and the lines changed. Each issue also has its creation and closure dates, type, parent and Jira project, and each pull request has its own state and creation date.
A pull request is linked to an issue when it references the issue key with a closing keyword such as "fixes", "closes" or "resolves". An issue touches a repository when at least one of its linked pull requests belongs to that repository. Cycle time is the number of business days from the issue's creation to its closure. Merge spread is the number of business days between the first and the last merge of its linked pull requests. All figures below cover the last 12 full months, October 2025 to September 2026.
1. Measuring How Much Work Crosses Repository Boundaries
The first question: how many of your changes need more than one repository, and how much of your code do they account for?
MCP Prompt:
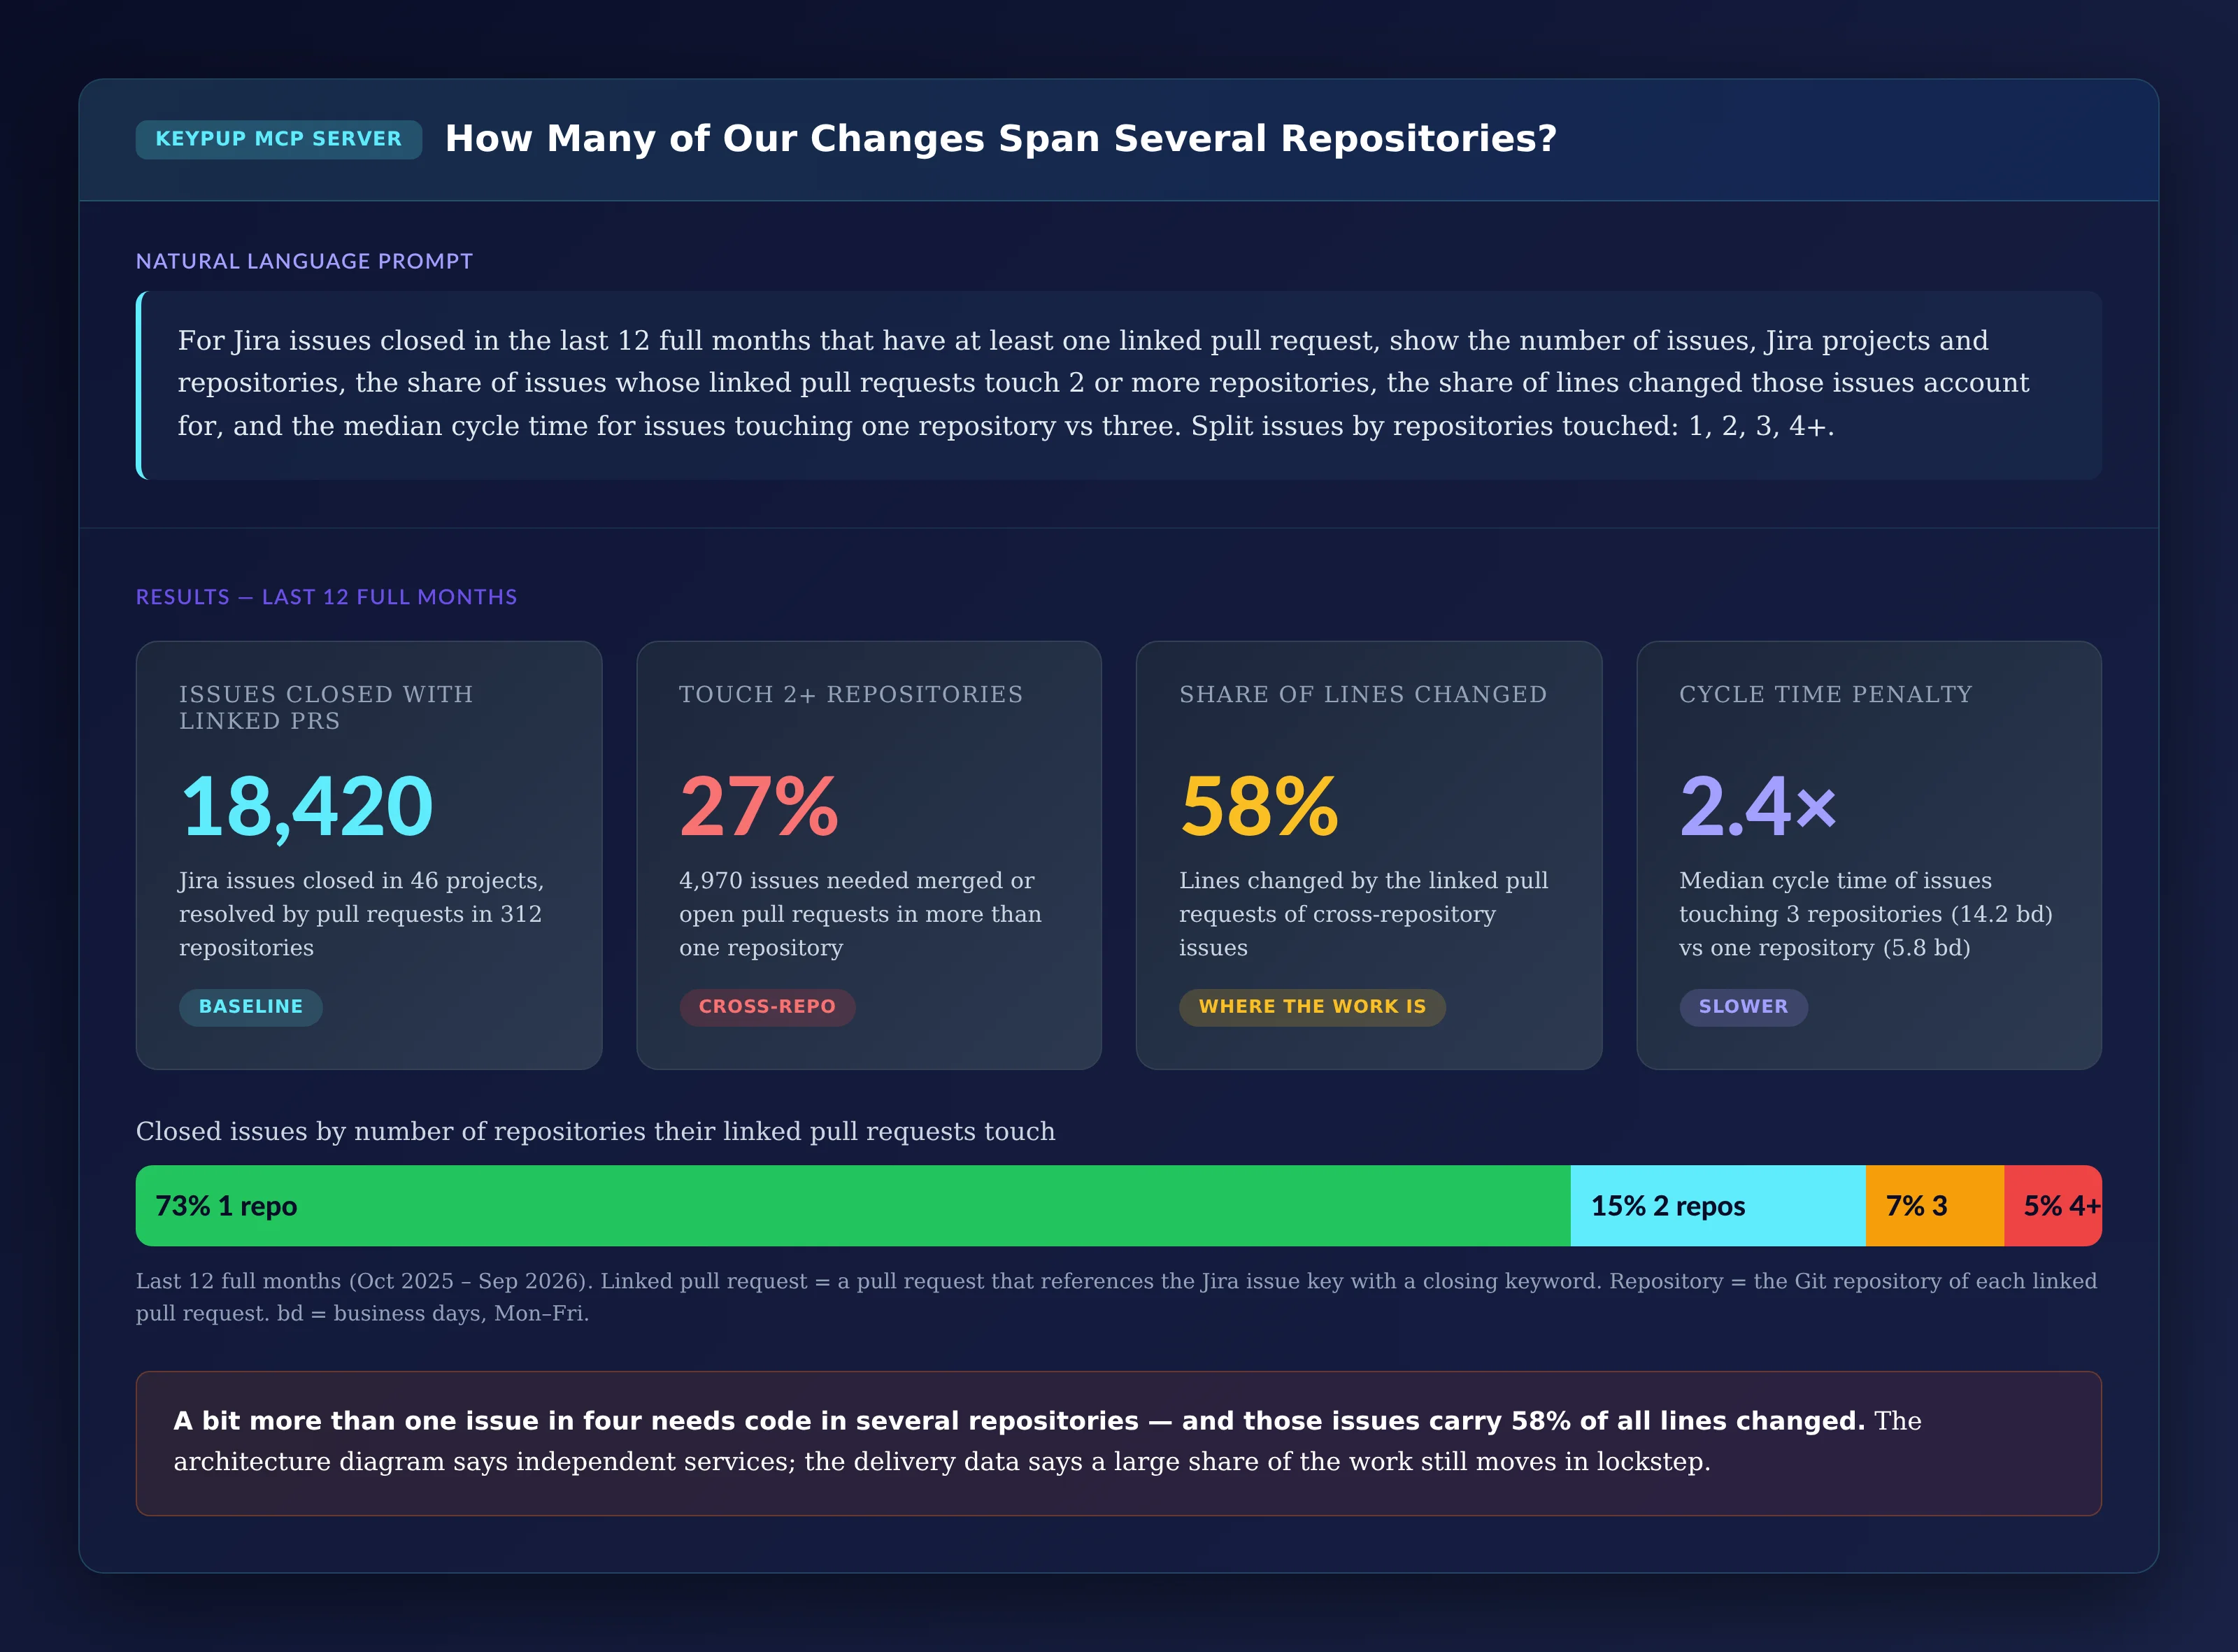
For Jira issues closed in the last 12 full months that have at
least one linked pull request, show the number of issues, Jira
projects and repositories, the share of issues whose linked pull
requests touch 2 or more repositories, the share of lines changed
those issues account for, and the median cycle time for issues
touching one repository vs three. Split issues by repositories
touched: 1, 2, 3, 4+.
Output: How Many of Our Changes Span Several Repositories?
Key Insight: 27% of issues need pull requests in more than one repository, and they account for 58% of all lines changed. Cross-repository work isn't the exception at the edges of the system; it's where most of the code goes.
2. Pricing Each Extra Repository
If coordination has a cost, cycle time should rise with every repository a change touches.
MCP Prompt:
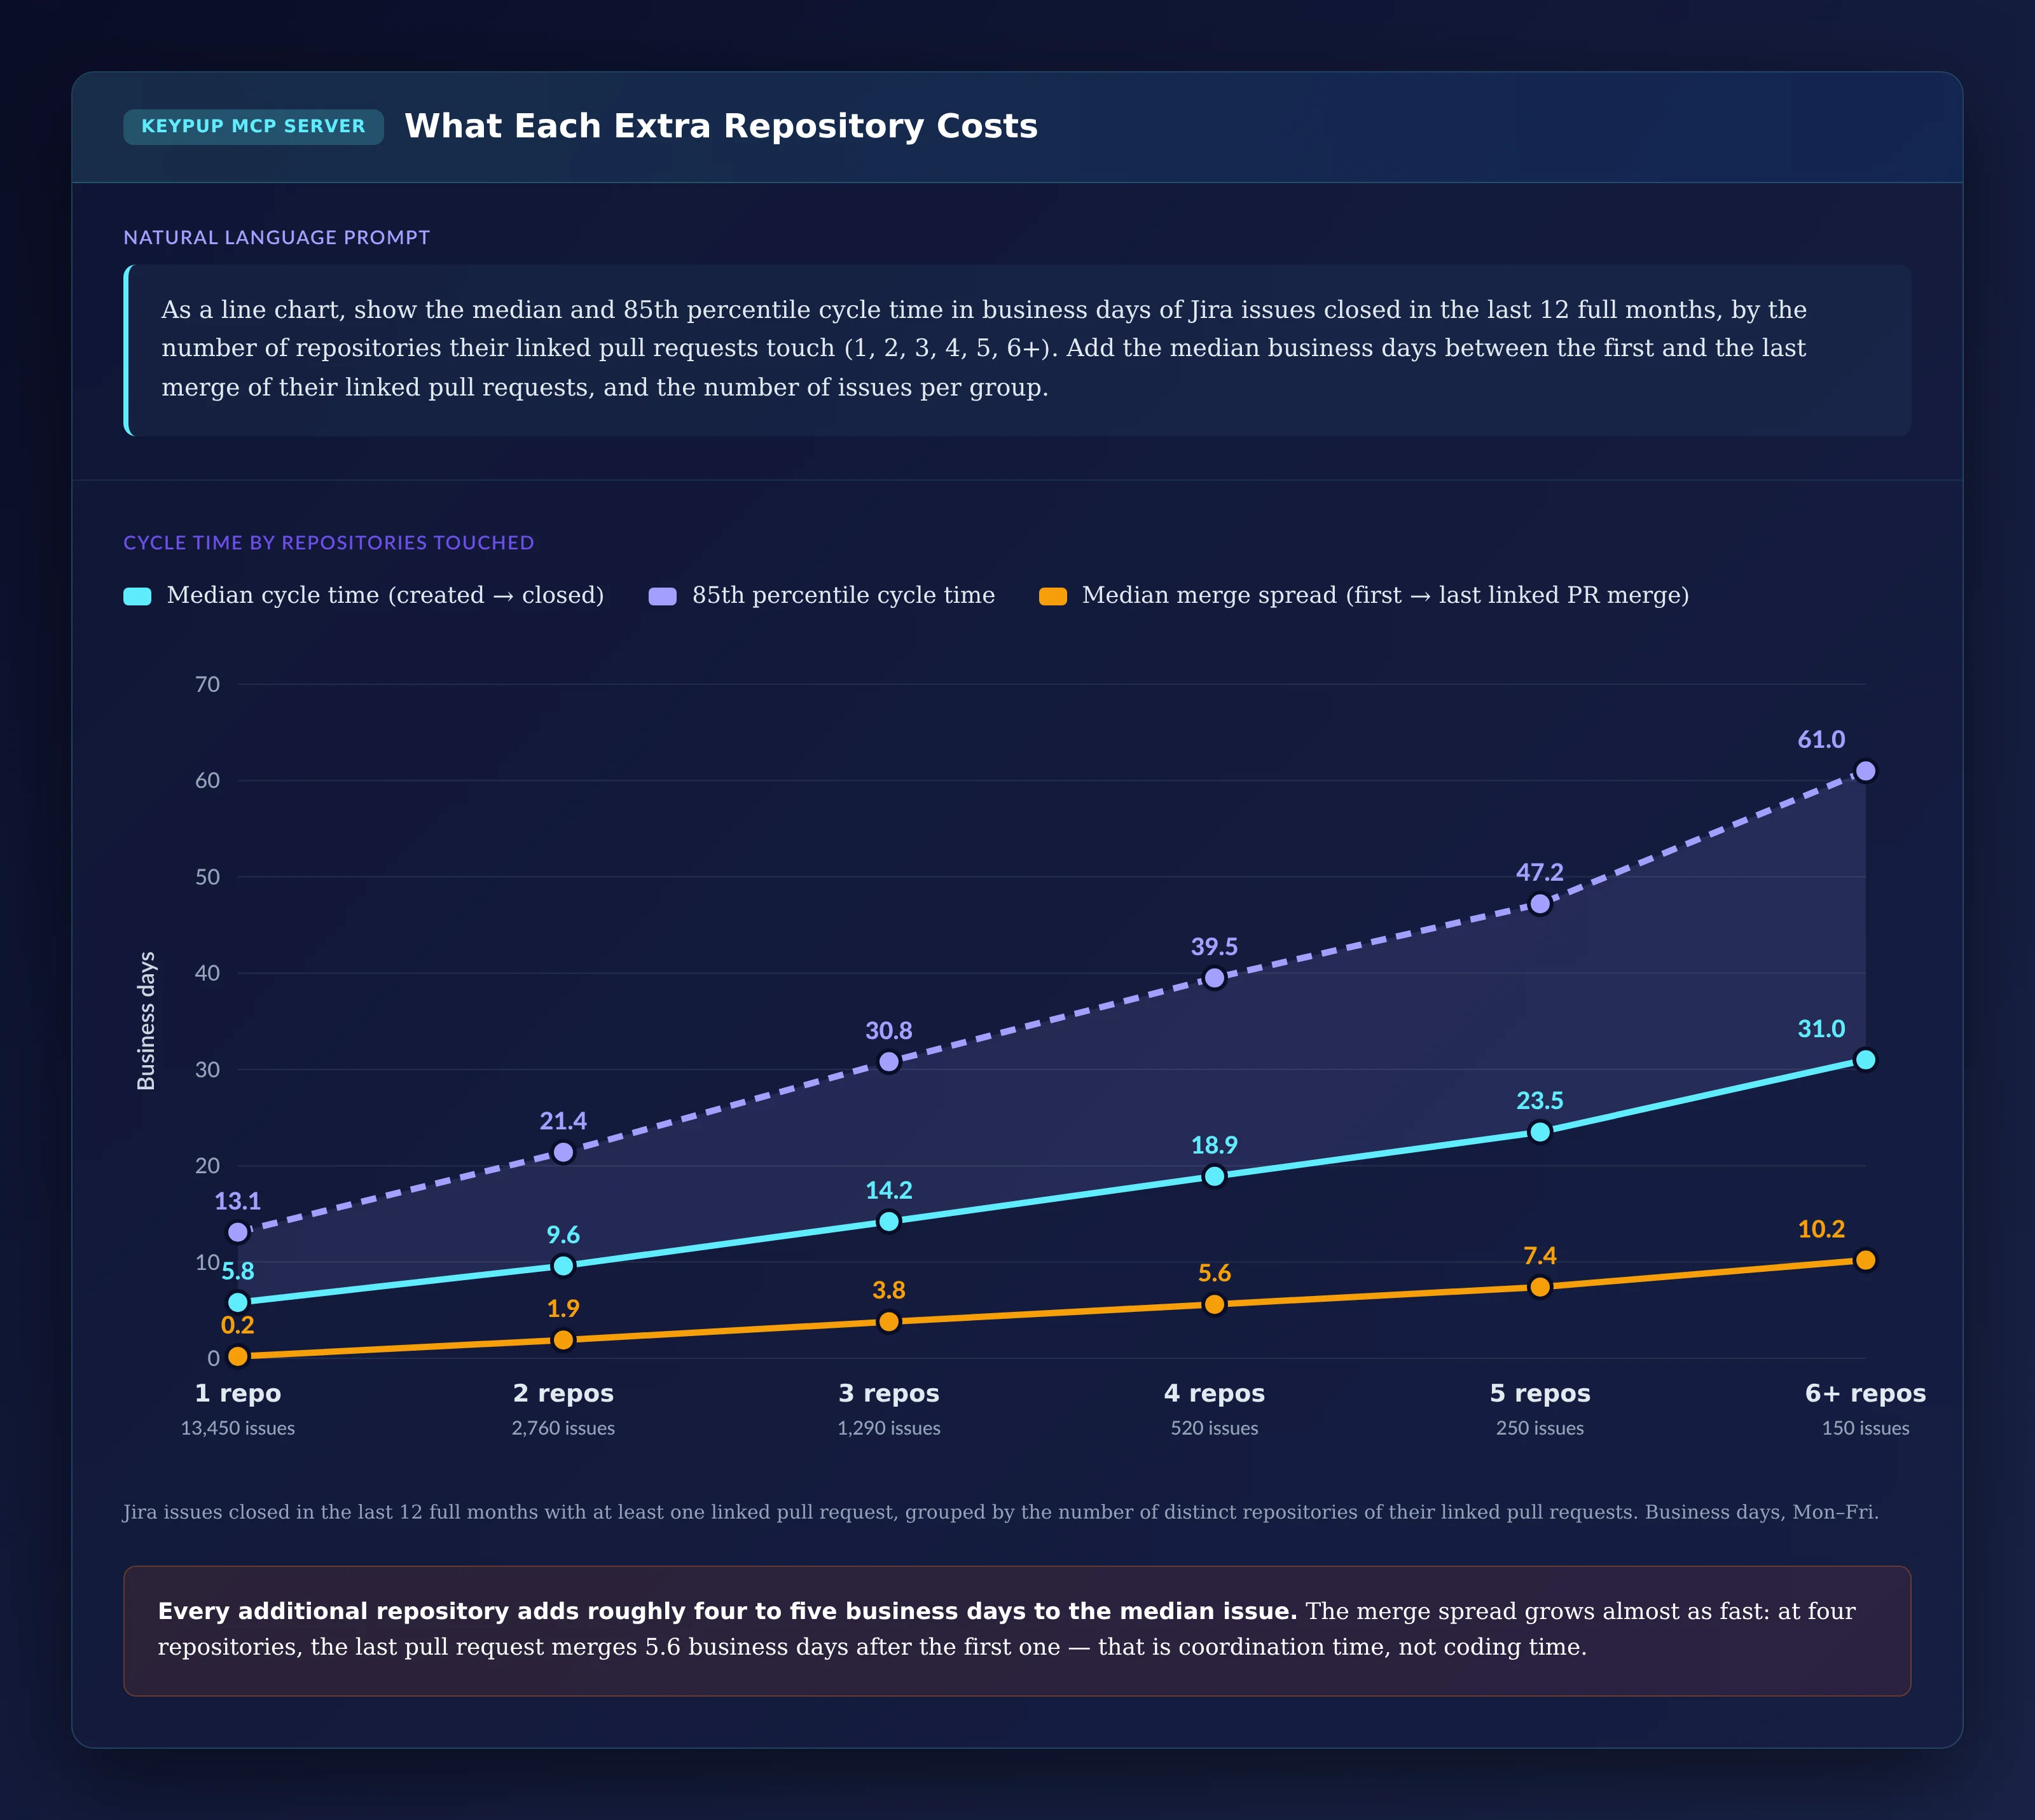
As a line chart, show the median and 85th percentile cycle time in
business days of Jira issues closed in the last 12 full months, by
the number of repositories their linked pull requests touch (1, 2,
3, 4, 5, 6+). Add the median business days between the first and
the last merge of their linked pull requests, and the number of
issues per group.
Output: What Each Extra Repository Costs
Key Insight: Each additional repository adds roughly four to five business days to the median issue, and the 85th percentile climbs twice as fast. The merge spread line explains a large part of it: at four repositories, the last pull request merges 5.6 business days after the first. That's time spent waiting on other teams, not writing code. Cycle time also depends on scope — bigger features naturally touch more repositories — so compare issues of the same type before drawing conclusions about a specific team.
3. Tracking Whether Coupling Is Improving
Architecture programs are long. The trend tells you whether they are working.
MCP Prompt:
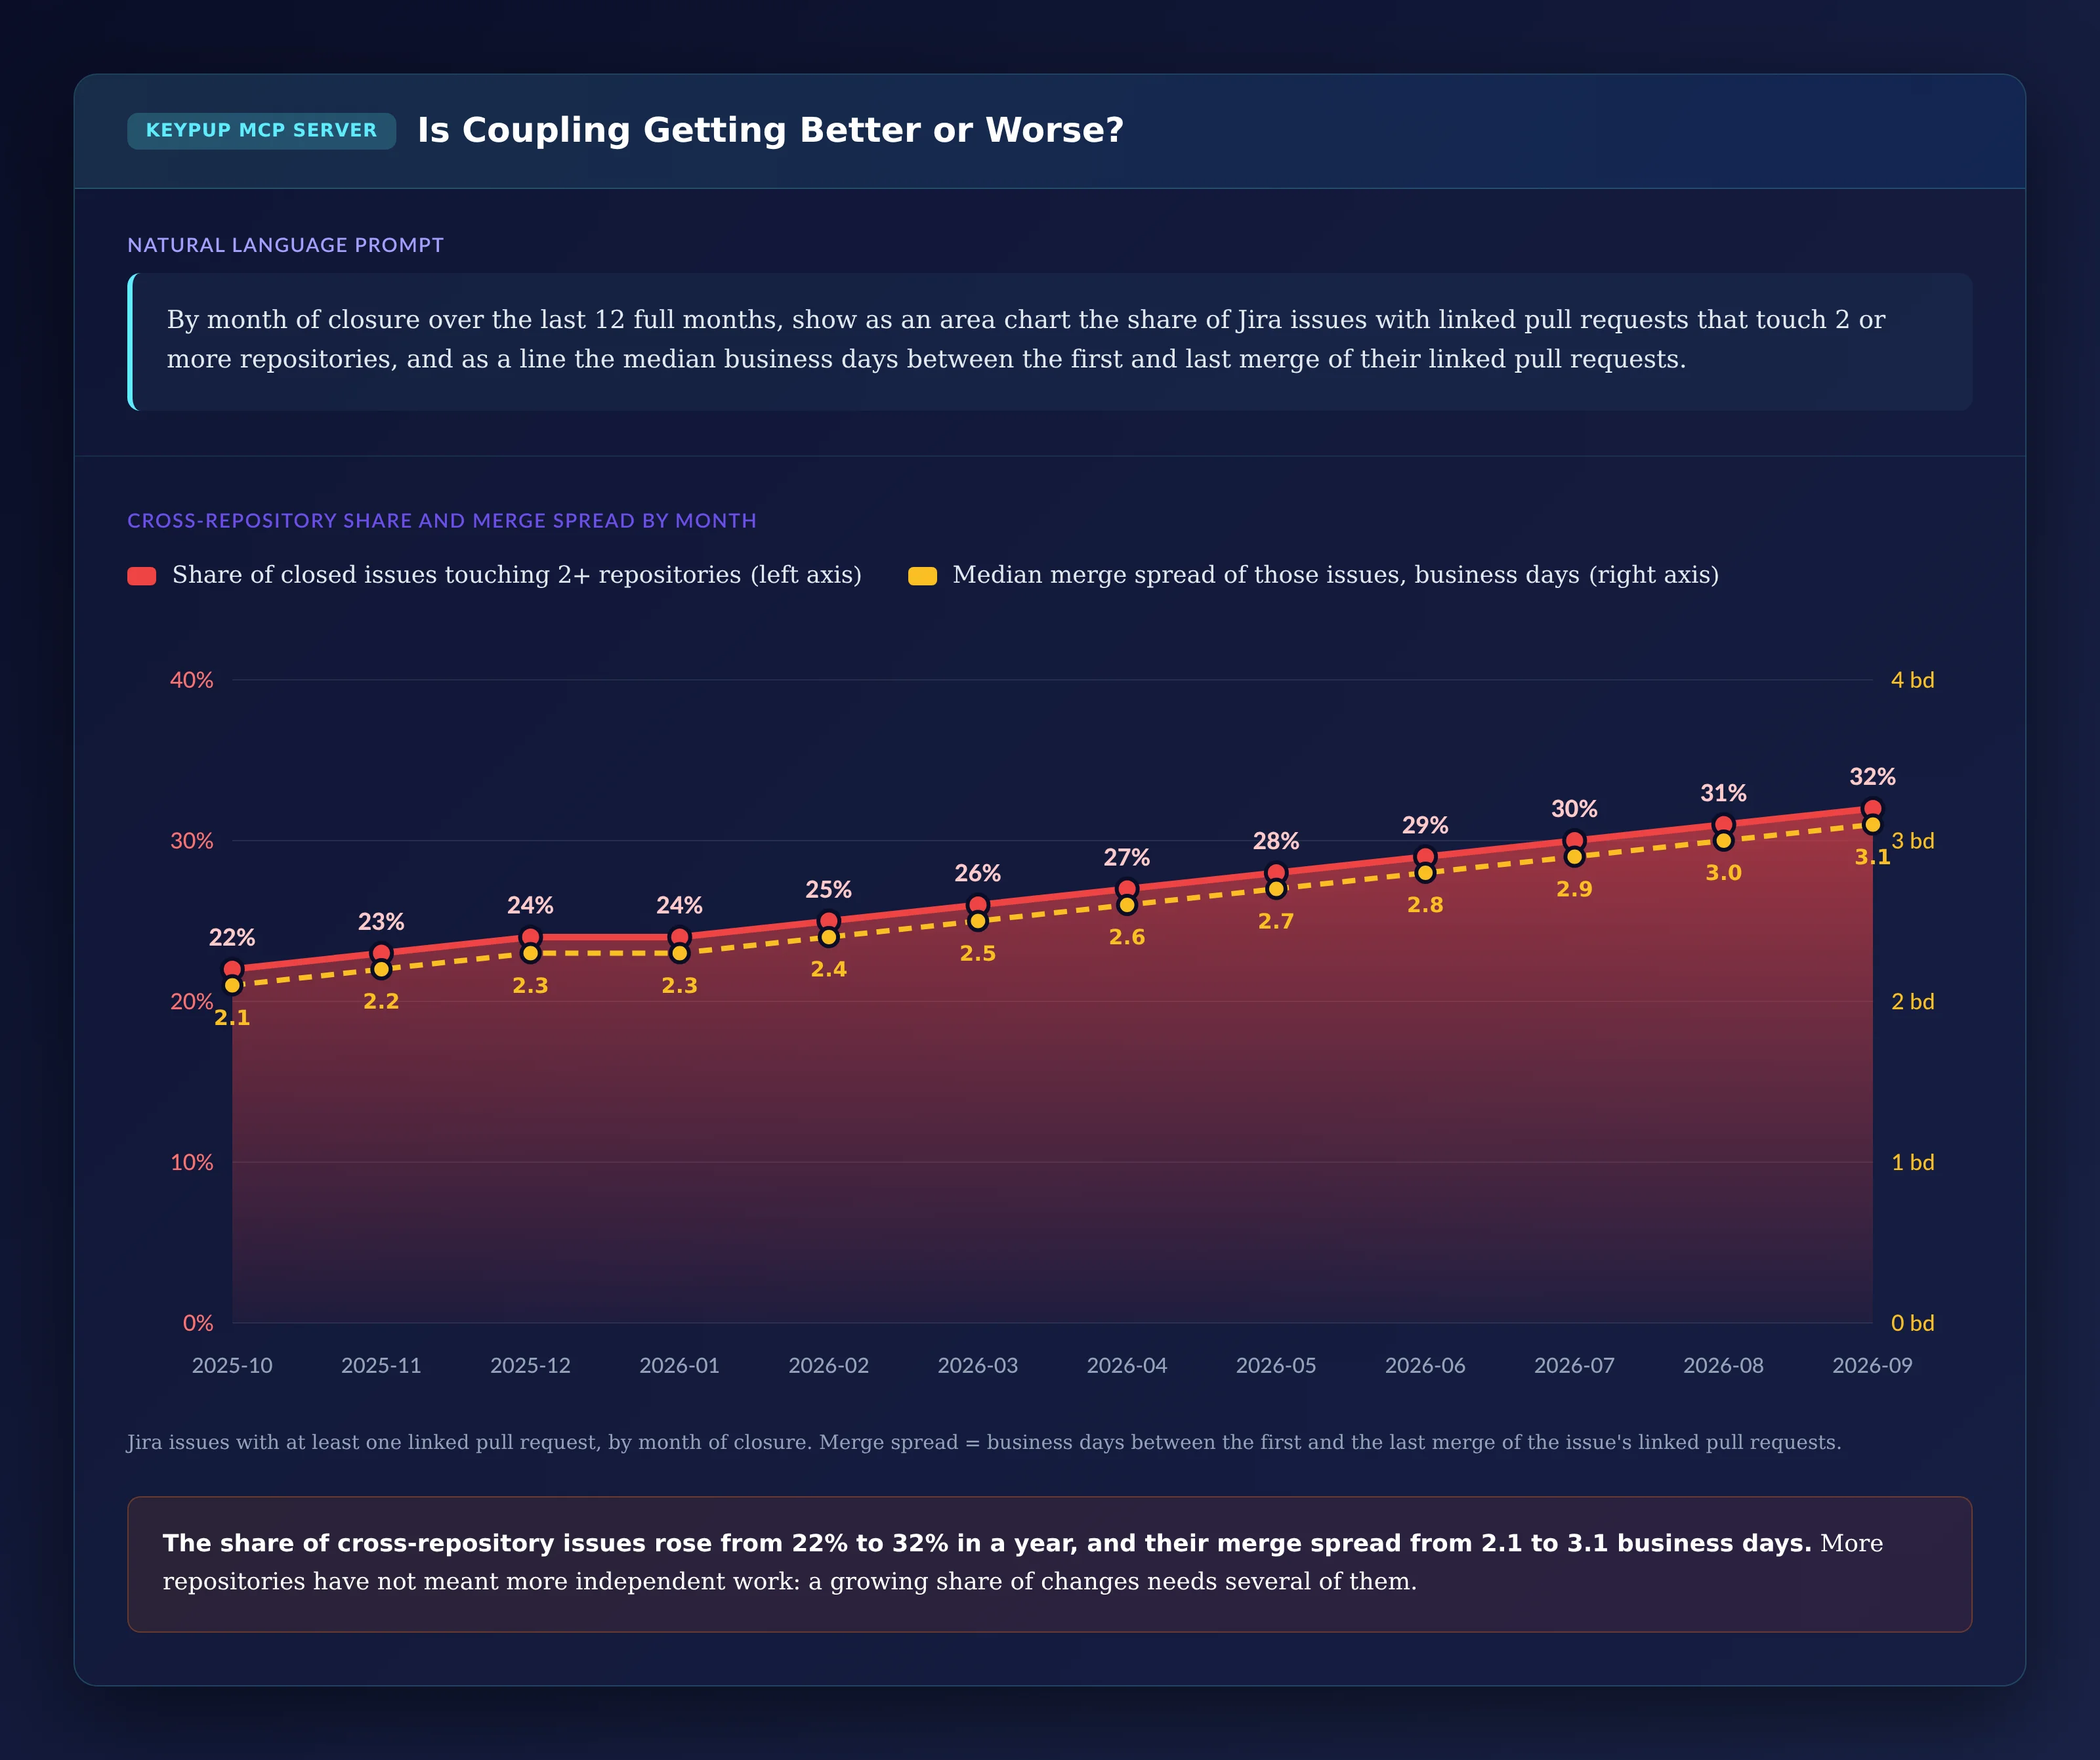
By month of closure over the last 12 full months, show as an area
chart the share of Jira issues with linked pull requests that
touch 2 or more repositories, and as a line the median business
days between the first and last merge of their linked pull
requests.
Output: Is Coupling Getting Better or Worse?
Key Insight: The share of cross-repository issues rose from 22% to 32% in a year, and their merge spread from 2.1 to 3.1 business days. If your organization extracted services over the same period, this is the chart to bring to the next architecture review: more repositories didn't mean more independent work.
4. Finding the Repositories That Always Change Together
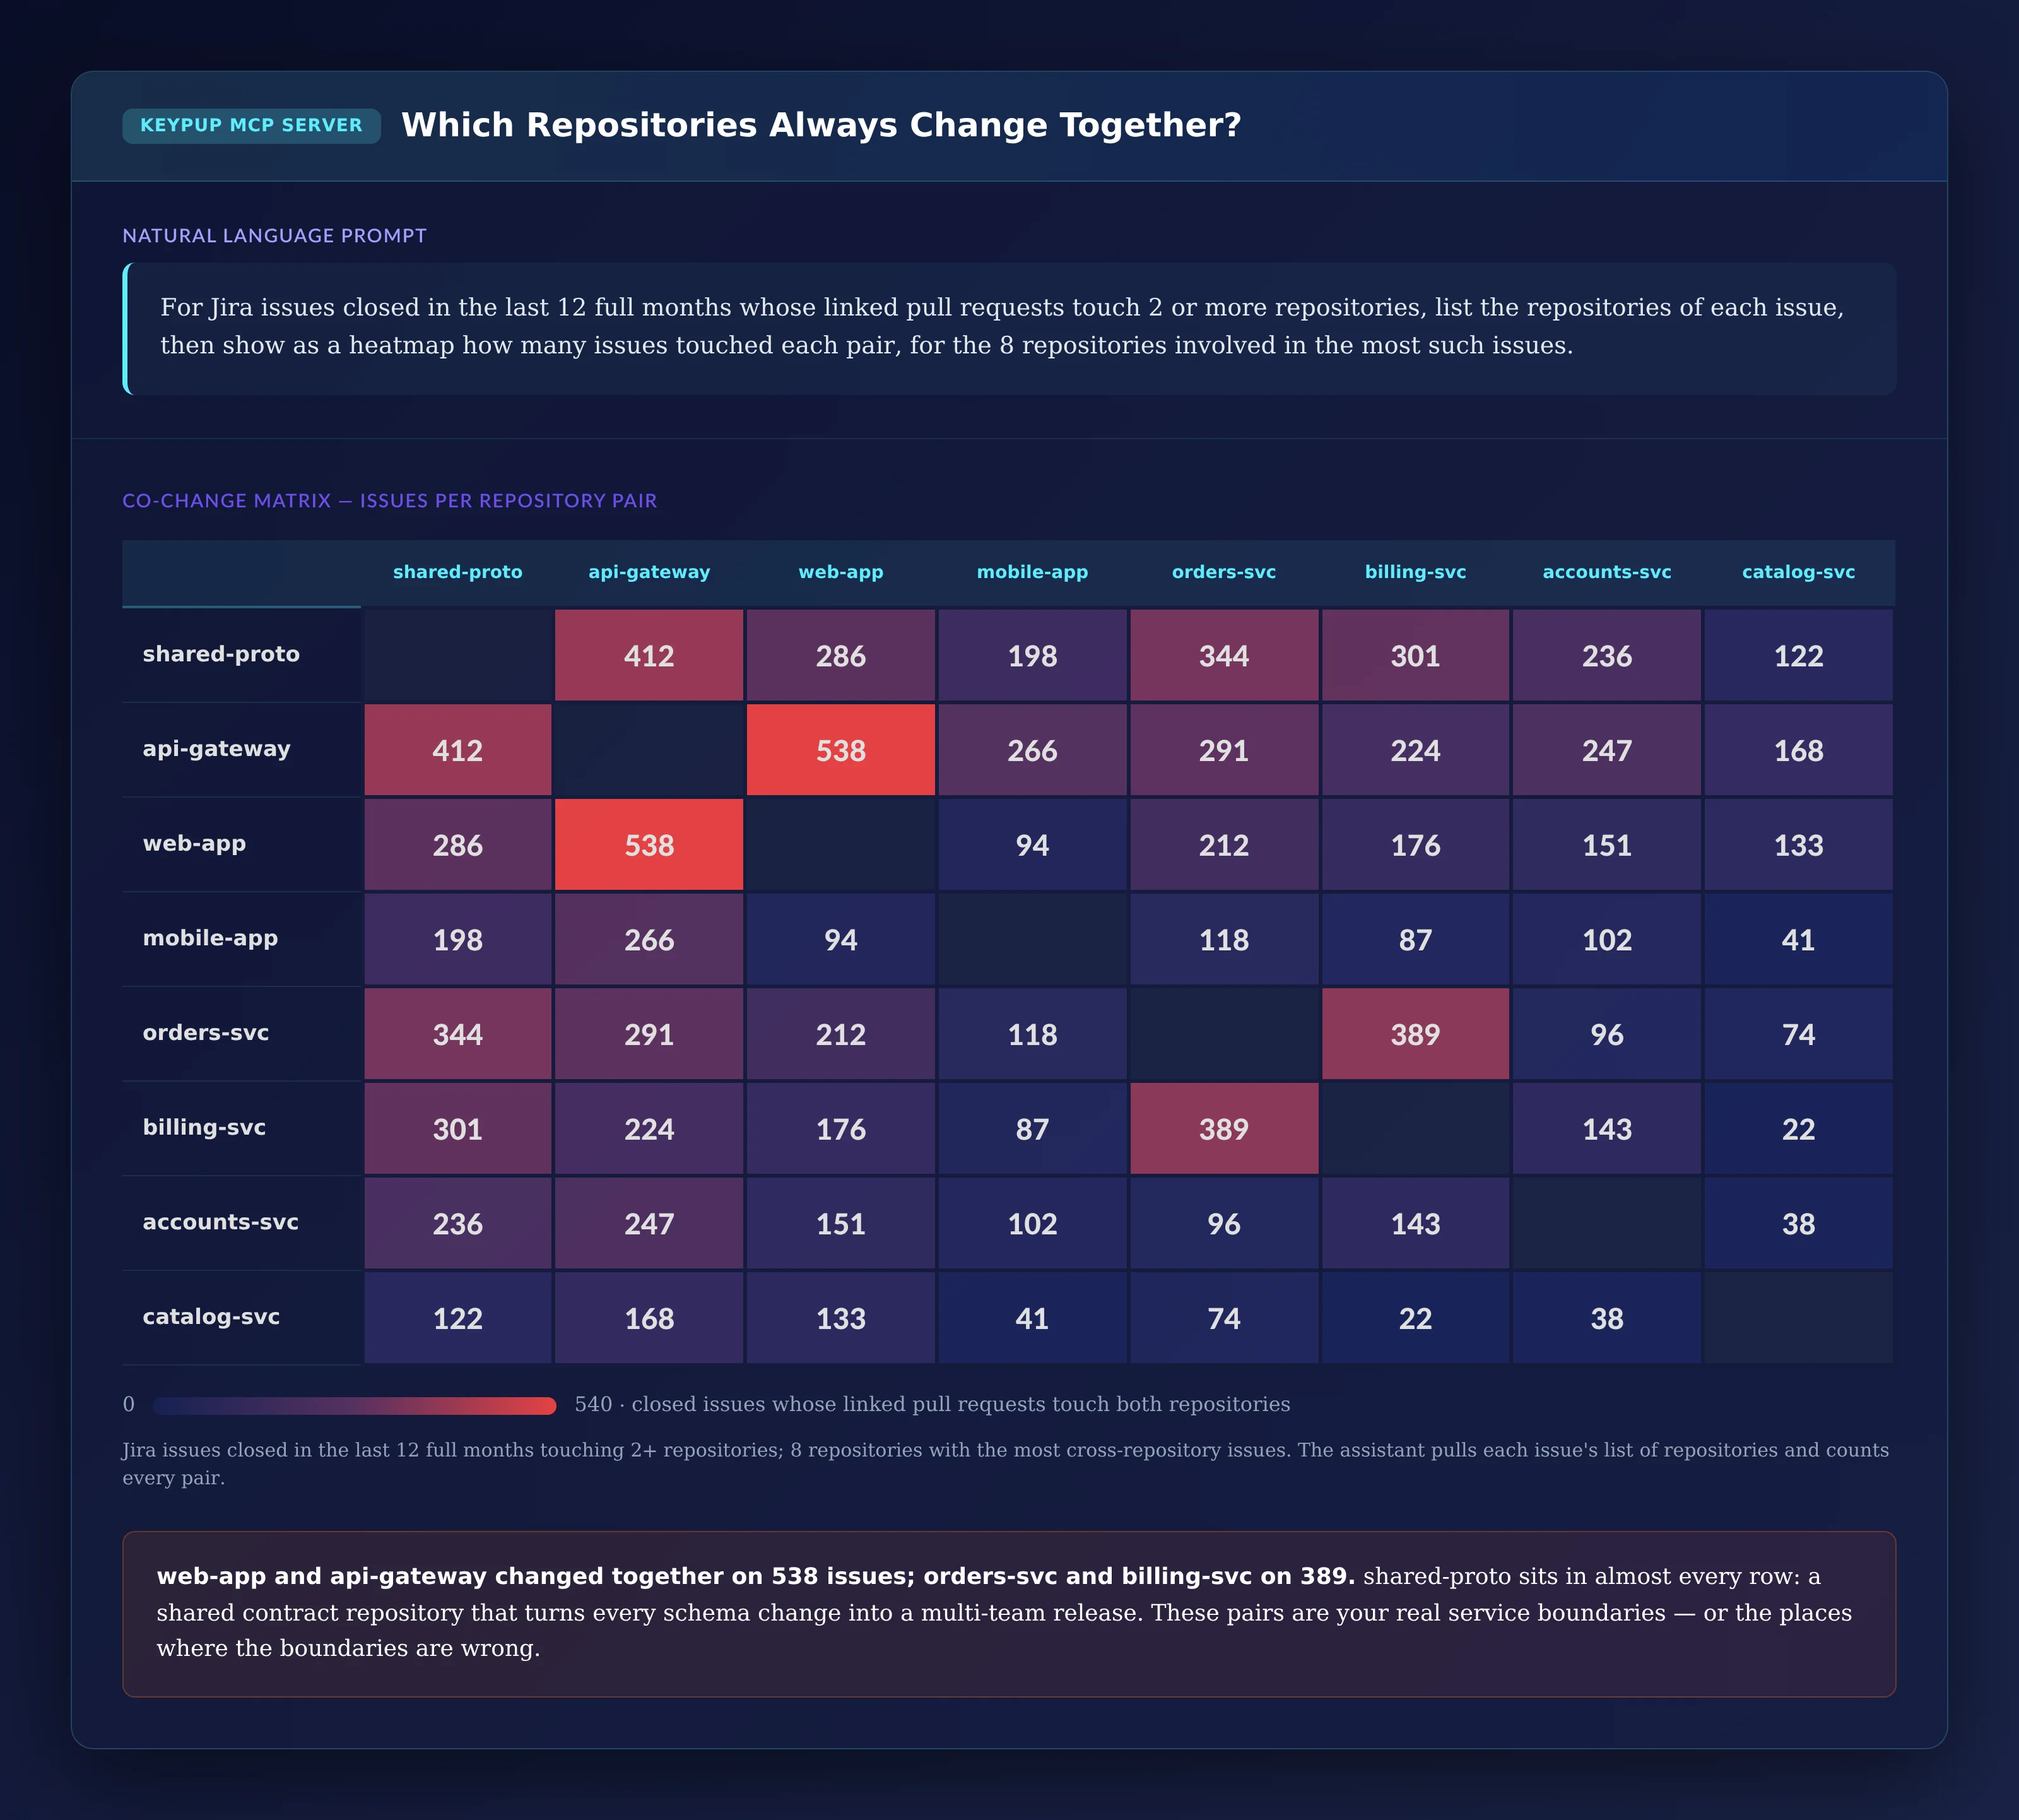
The most actionable view is the co-change matrix: which pairs of repositories keep appearing on the same issue.
MCP Prompt:
For Jira issues closed in the last 12 full months whose linked pull
requests touch 2 or more repositories, list the repositories of
each issue, then show as a heatmap how many issues touched each
pair, for the 8 repositories involved in the most such issues.
Output: Which Repositories Always Change Together?
Key Insight: web-app and api-gateway changed together on 538 issues; orders-svc and billing-svc on 389. shared-proto appears in almost every row: a shared contract repository that turns each schema change into a multi-team release. These pairs are your real service boundaries — or the places where the boundaries are wrong. Behind the heatmap, the assistant pulls each issue's list of repositories and counts the pairs itself; Keypup returns the per-issue lists.
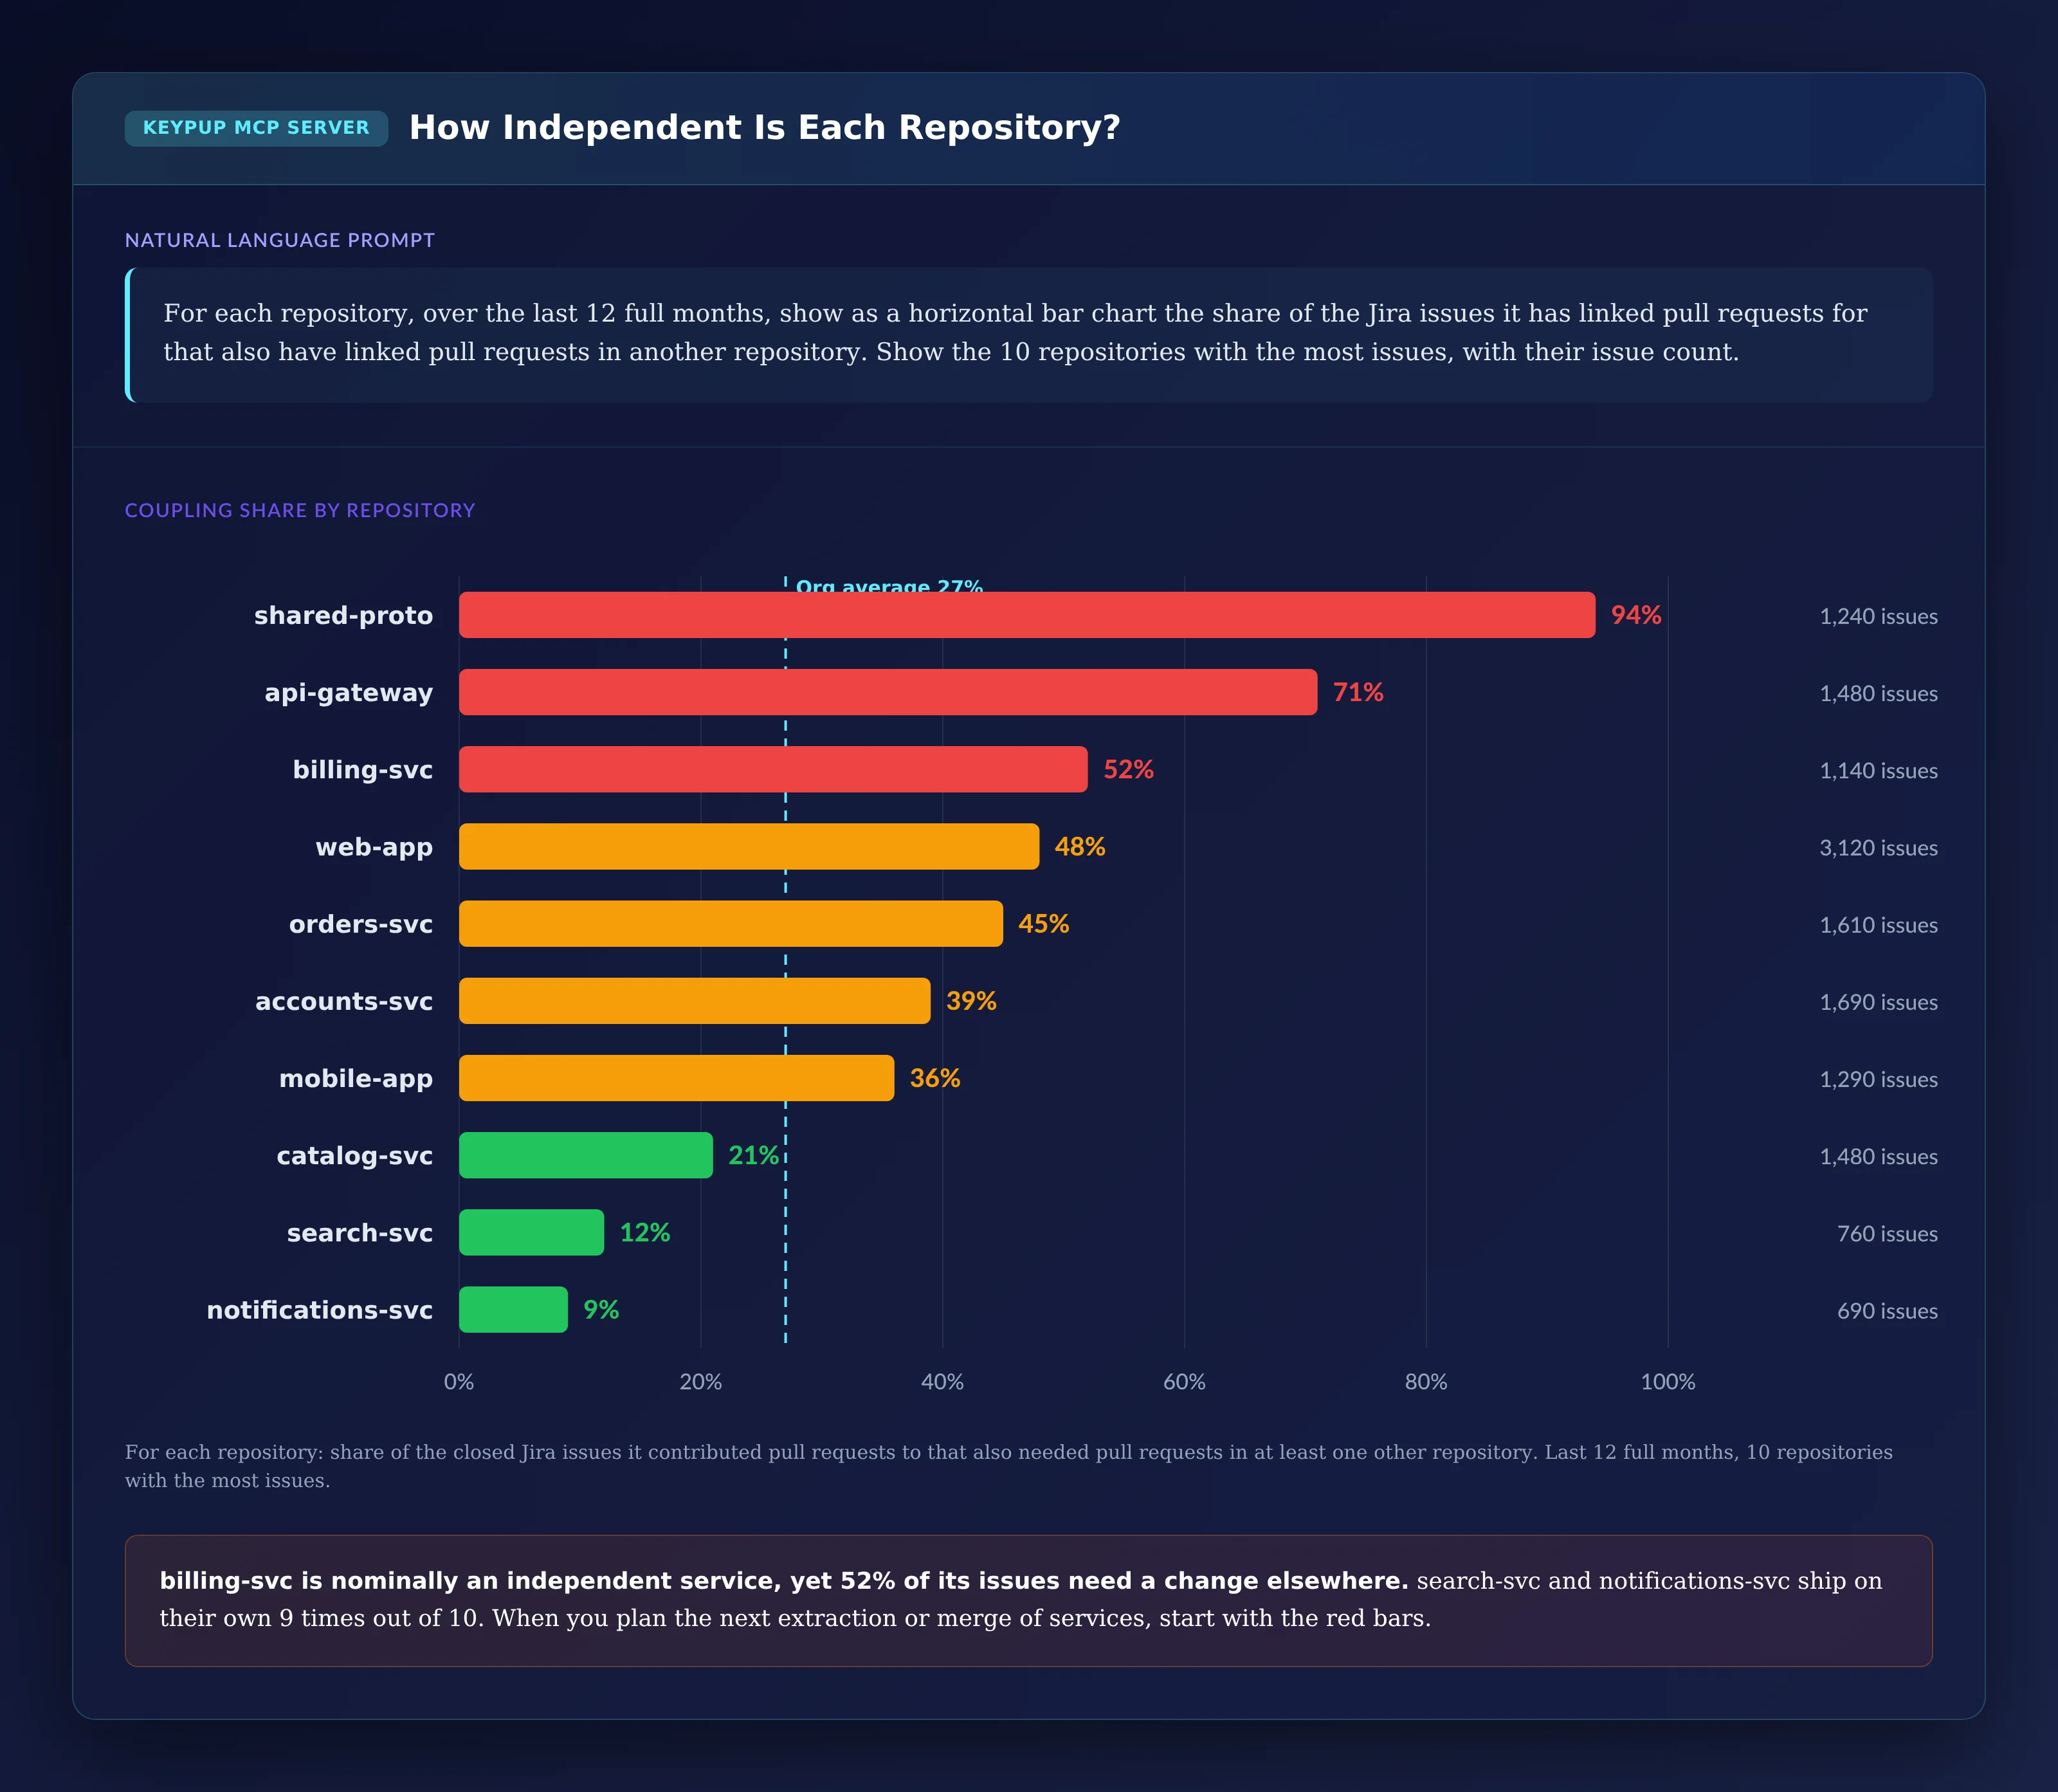
5. Scoring Each Repository's Independence
The matrix shows pairs. Leaders also need one number per repository to decide where to invest.
MCP Prompt:
For each repository, over the last 12 full months, show as a
horizontal bar chart the share of the Jira issues it has linked
pull requests for that also have linked pull requests in another
repository. Show the 10 repositories with the most issues, with
their issue count.
Output: How Independent Is Each Repository?
Key Insight: A shared contract repository and a gateway are expected to be coupled; that's their job. billing-svc is not: it's nominally an independent service, yet 52% of its issues need a change elsewhere. search-svc and notifications-svc ship on their own nine times out of ten. When you plan the next service extraction or consolidation, start with the red bars that aren't supposed to be red.
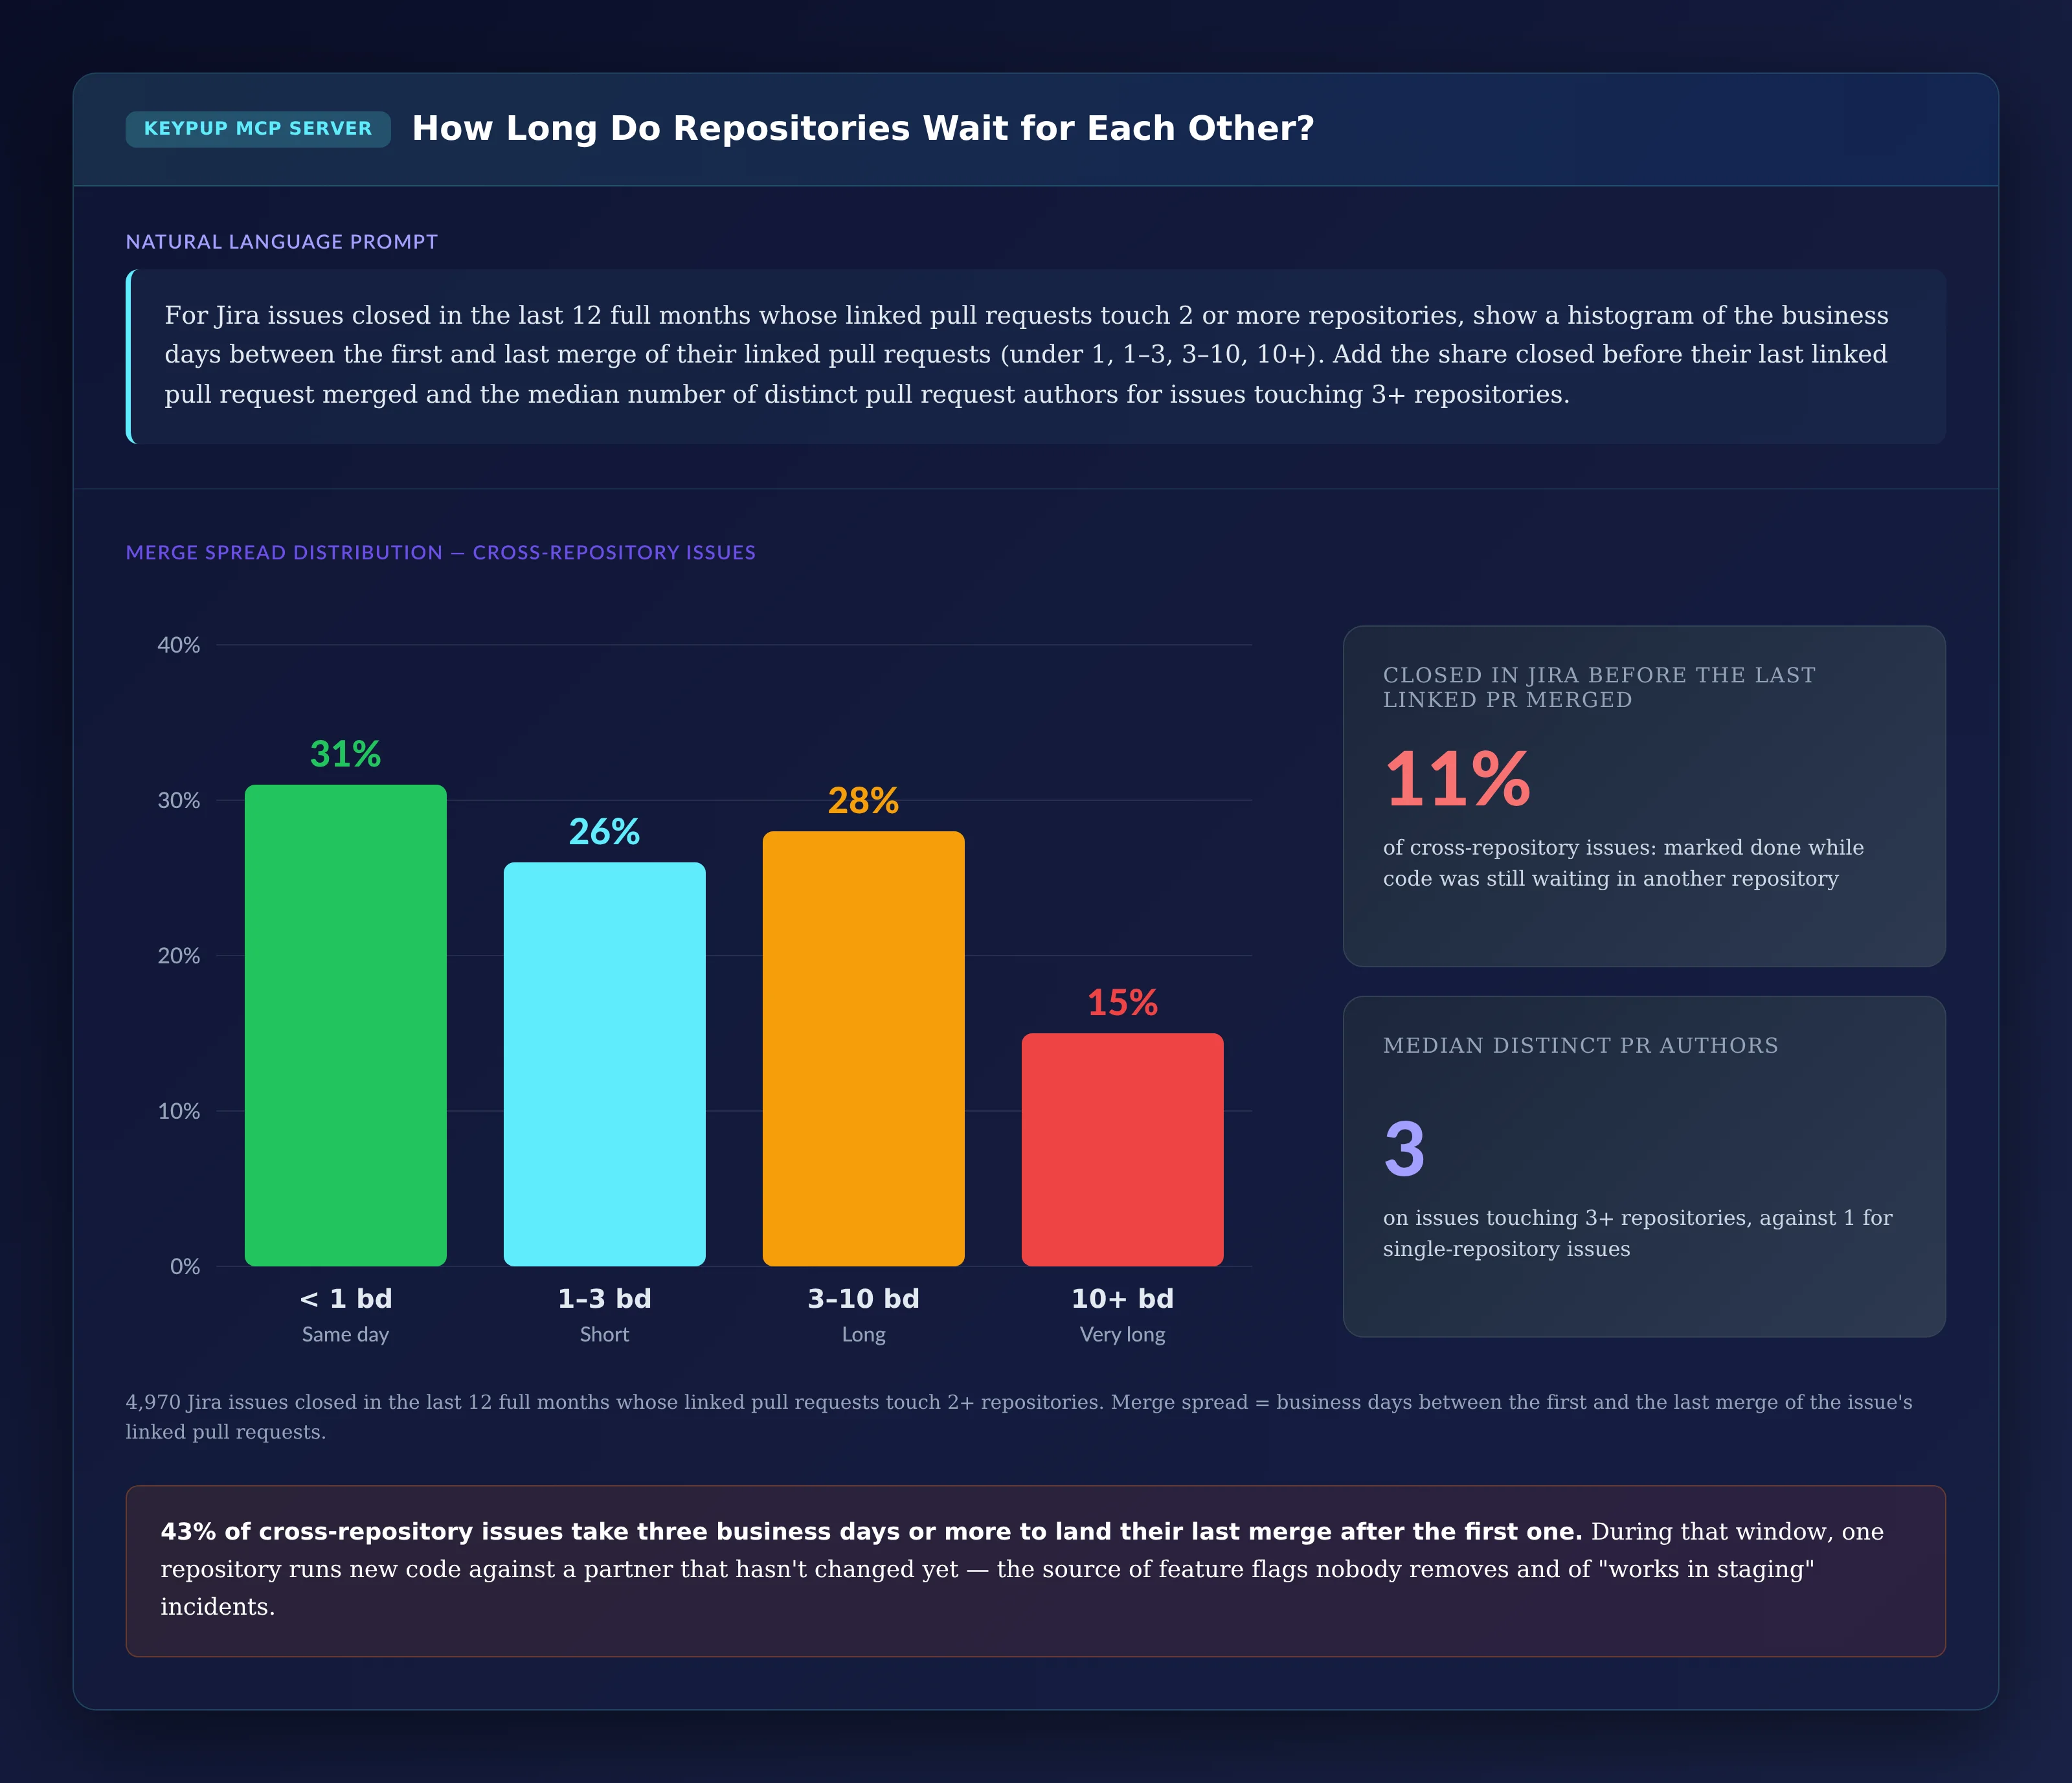
6. Measuring How Long Repositories Wait for Each Other
The merge spread is the window during which one part of a change is live and the other isn't.
MCP Prompt:
For Jira issues closed in the last 12 full months whose linked pull
requests touch 2 or more repositories, show a histogram of the
business days between the first and last merge of their linked
pull requests (under 1, 1-3, 3-10, 10+). Add the share closed
before their last linked pull request merged and the median number
of distinct pull request authors for issues touching 3+
repositories.
Output: How Long Do Repositories Wait for Each Other?
Key Insight: 43% of cross-repository issues take three business days or more between their first and last merge. And 11% were closed in Jira before their last linked pull request merged: the board says done while code still waits in another repository. Issues touching three or more repositories involve a median of three pull request authors — three people who need to land their work in the right order.
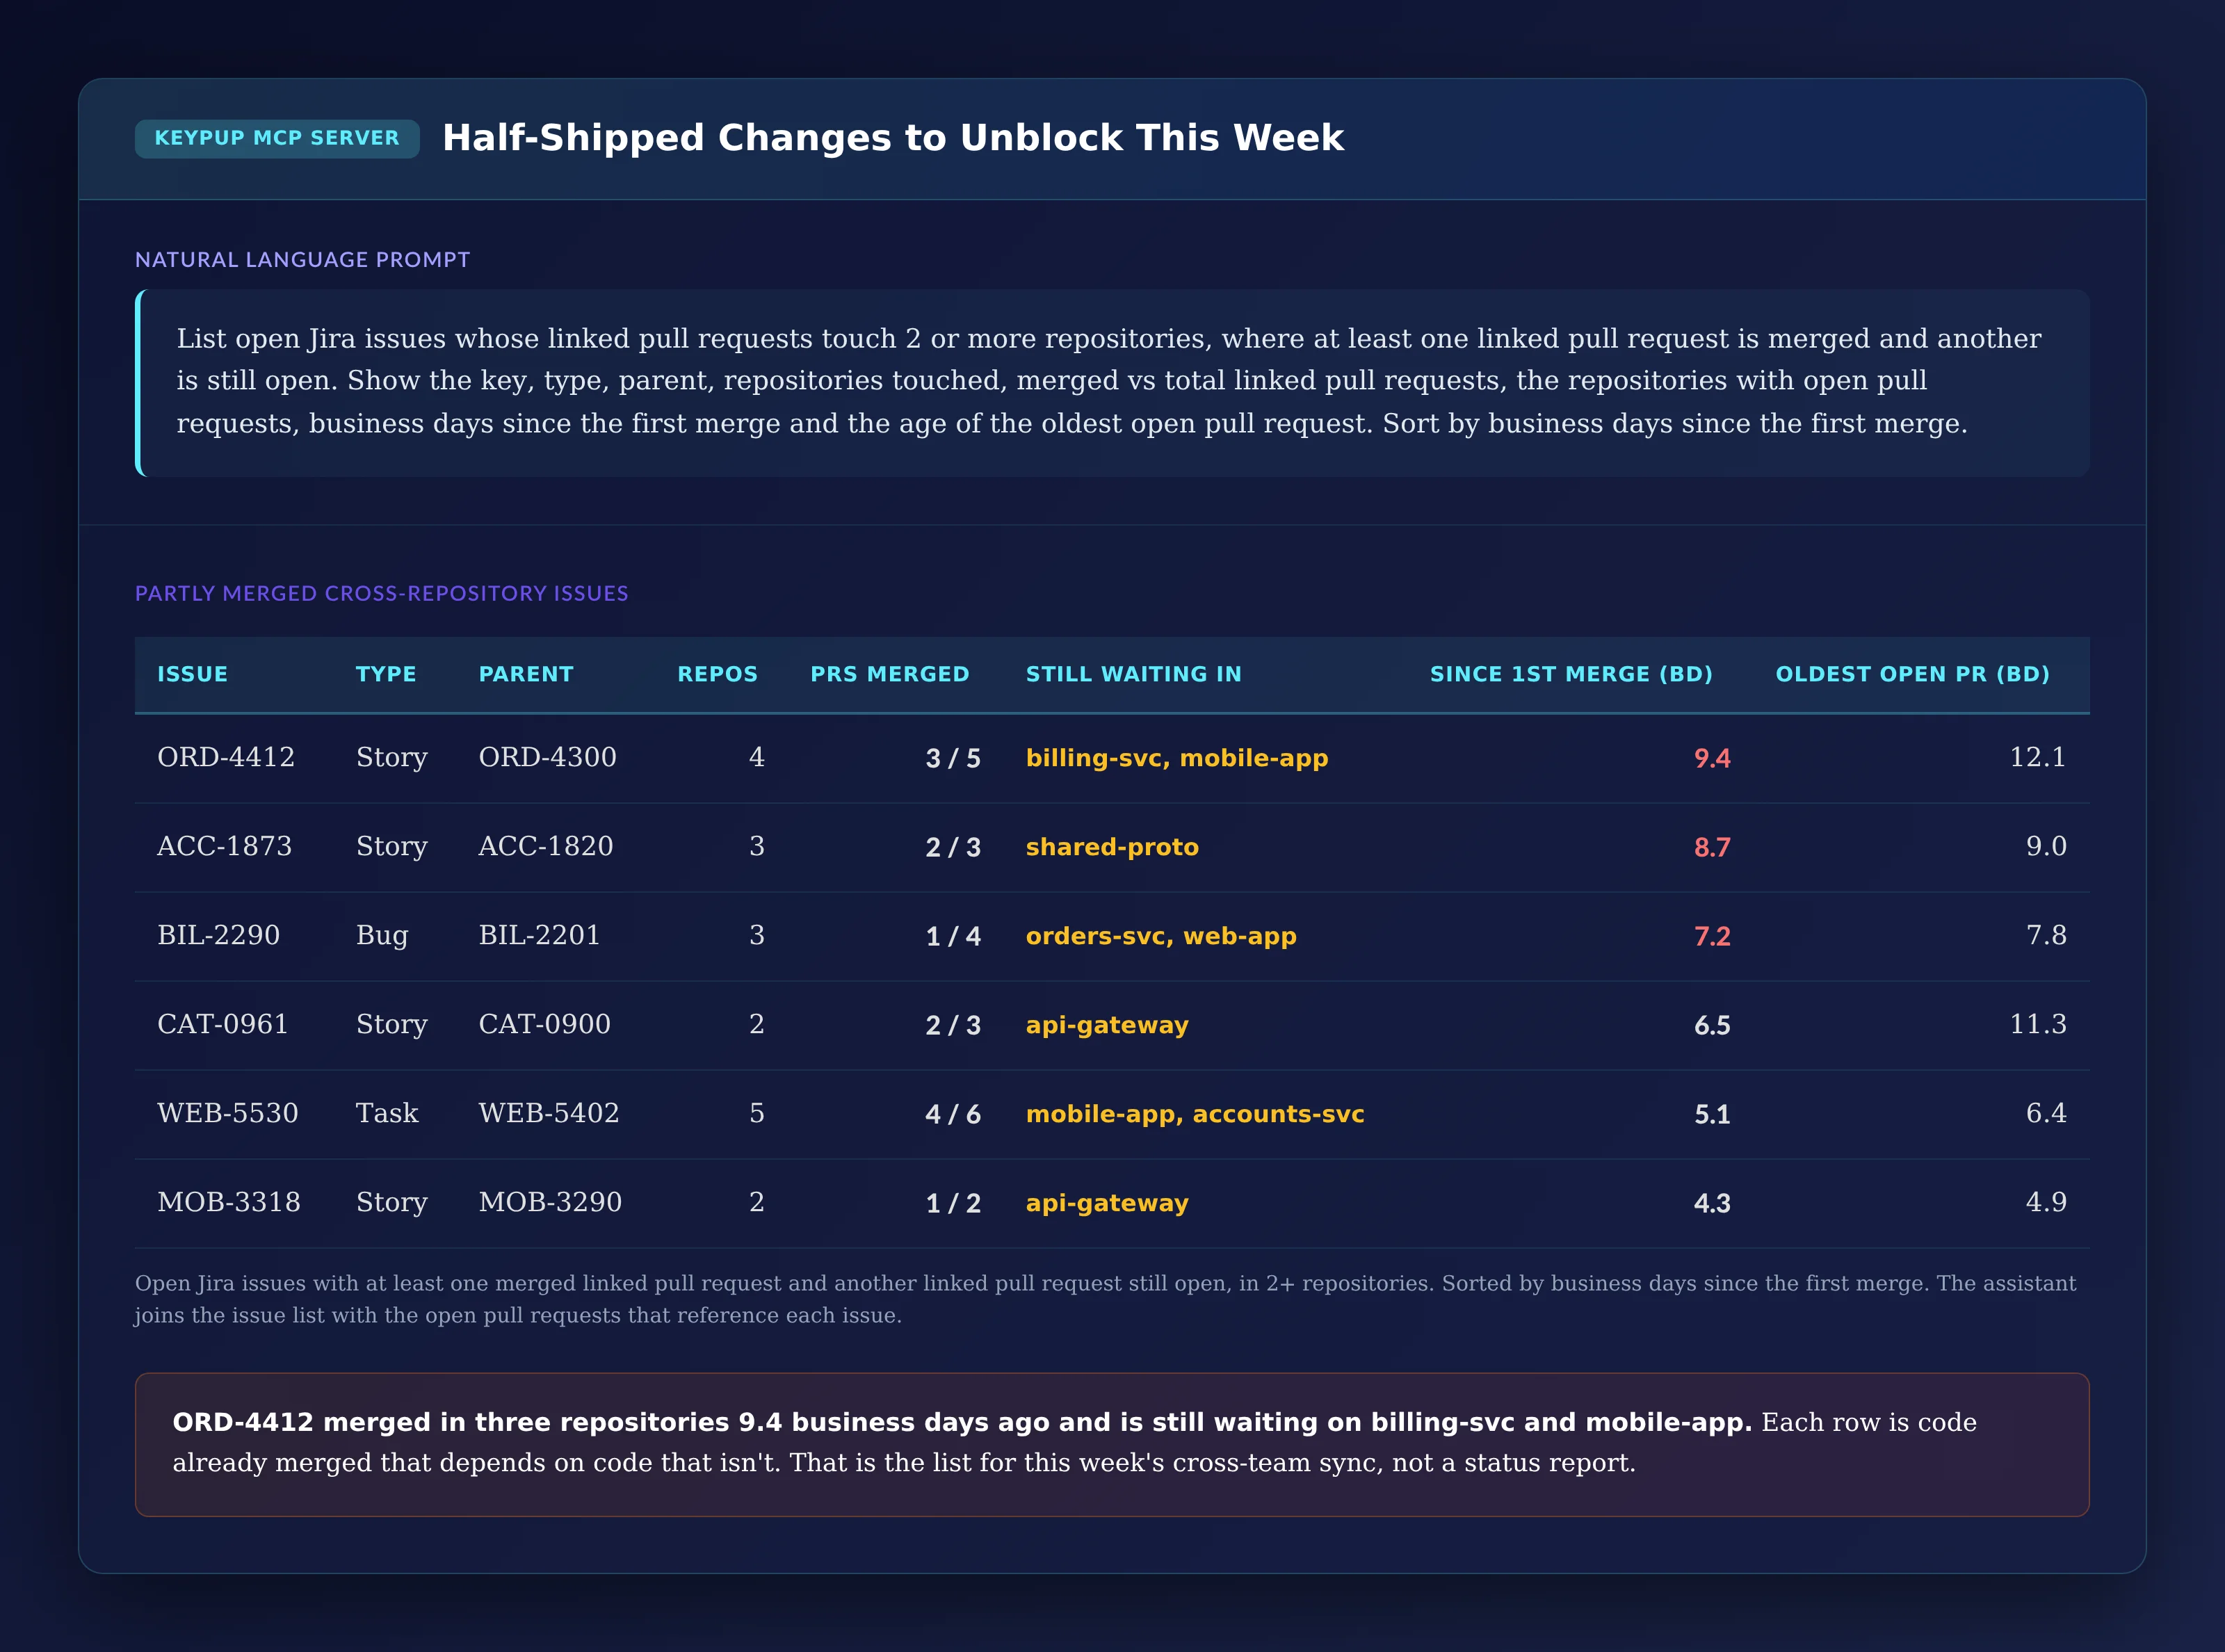
7. Listing the Half-Shipped Changes to Unblock This Week
The last step turns the analysis into a list for this week's cross-team sync.
MCP Prompt:
List open Jira issues whose linked pull requests touch 2 or more
repositories, where at least one linked pull request is merged and
another is still open. Show the key, type, parent, repositories
touched, merged vs total linked pull requests, the repositories
with open pull requests, business days since the first merge and
the age of the oldest open pull request. Sort by business days
since the first merge.
Output: Half-Shipped Changes to Unblock This Week
Issue
Type
Parent
Repos
PRs merged
Still waiting in
Since 1st merge (bd)
Oldest open PR (bd)
ORD-4412
Story
ORD-4300
4
3 / 5
billing-svc, mobile-app
9.4
12.1
ACC-1873
Story
ACC-1820
3
2 / 3
shared-proto
8.7
9.0
BIL-2290
Bug
BIL-2201
3
1 / 4
orders-svc, web-app
7.2
7.8
CAT-0961
Story
CAT-0900
2
2 / 3
api-gateway
6.5
11.3
WEB-5530
Task
WEB-5402
5
4 / 6
mobile-app, accounts-svc
5.1
6.4
MOB-3318
Story
MOB-3290
2
1 / 2
api-gateway
4.3
4.9
Key Insight: ORD-4412 merged in three repositories 9.4 business days ago and is still waiting on billing-svc and mobile-app. Each row is code already merged that depends on code that isn't. Behind the table, the assistant runs two queries — open issues with their linked pull requests, and open pull requests with the issues they reference — and joins them by issue.
The Technical Implementation: What Keypup MCP Actually Reads
Every number above comes from fields Keypup already imports from Jira and your Git platforms. It helps to be precise about what they are — and what they aren't.
Links Come From Closing Keywords
Keypup links a pull request to a Jira issue when the pull request references the issue key with a closing keyword such as "fixes", "closes" or "resolves". Each issue then carries the list of its linked pull requests and the repositories they belong to. If many pull requests don't reference an issue that way, cross-repository work will be undercounted: check the share of merged pull requests linked to an issue, by repository, before reading the rest, and agree on a convention where it's low.
Repositories Are Git Repositories, Not Services
Keypup sees repositories, not deployable services. In a monorepo, a change touching five services is one repository and won't appear here; split by directory isn't available from pull request data. In a polyrepo setup where some repositories hold infrastructure, documentation or configuration, ask your assistant to exclude them so the coupling numbers only cover application code.
Merge Dates Are Not Deployment Dates
Merge spread uses the merge dates of linked pull requests. Keypup doesn't import deployment events, so it doesn't know when each repository reached production. A short merge spread is a necessary condition for a coordinated release, not proof of one.
Cycle Time Depends on Your Jira Workflow
Cycle time runs from the issue's creation to its closure in Jira. If teams create issues long before work starts, or close them long after the last merge, cycle time will reflect that. Compare like with like: same issue types, same Jira projects.
Pair Counts Are Computed by the Assistant
Keypup returns, for each issue, the list of repositories its linked pull requests touch. The co-change heatmap is built by the assistant from those lists, counting each pair of repositories once per issue. For large organizations, ask for the top repositories first so the list stays manageable.
Business Days
Cycle time, merge spread and pull request age are counted in business days, Monday to Friday, with Keypup's BUSINESS_DAYS function, which accepts a time zone and working hours. It doesn't know about public holidays: Keypup doesn't import calendars.
Real-World Impact: Enterprise Case Studies
Case Study 1: European E-Commerce Group
Before Keypup MCP:
600 engineers, 180 repositories after a three-year microservices migration
Per-repository metrics all green; product leadership still reporting slow feature delivery
An architecture roadmap planning ten more service extractions
After Keypup MCP:
The repositories-touched view showed 34% of issues needed two or more repositories, and those issues had a median cycle time 2.6 times longer
The co-change heatmap revealed that three "independent" order-management services changed together on most issues; they were merged back into one repository owned by one team
Two of the ten planned extractions were cancelled after the co-change data showed the target code changed with its neighbours on most issues
"We were about to spend a year splitting services that the data showed always changed together. The co-change matrix was the first architecture document that described how we actually work."
— VP Engineering, European E-Commerce Group
Case Study 2: North American Financial Services Platform
Before Keypup MCP:
1,100 engineers across 46 Jira projects and more than 300 repositories
A shared contract repository used by every service, with frequent multi-team release trains
Incidents traced to partially deployed changes several times a quarter
After Keypup MCP:
The coupling bars made the shared contract repository's cost visible: 90% of its issues needed changes elsewhere, with a median merge spread of more than four business days
The platform team introduced backward-compatible contract versioning, and the share of cross-repository issues fell from 31% to 22% in three quarters
The half-shipped list became the agenda of a weekly cross-team sync, replacing release-order instructions written in ticket comments
"Everyone knew the shared models library was a bottleneck. Nobody could say how big. Once we had the number of issues waiting on it every week, the versioning project was approved in one meeting."
— Head of Platform Engineering, Financial Services Platform
Implementation: Getting Started with Keypup MCP
1. Connect Jira and Your Git Platforms
Connect Jira and GitHub, GitLab, Bitbucket or Azure DevOps to Keypup. Issues and pull requests are imported automatically, across all your repositories.
2. Check How Many Pull Requests Reference an Issue
Ask your assistant for the share of merged pull requests linked to an issue, by repository. Where it's low, agree on a convention: a closing keyword followed by the issue key in every pull request description.
3. Decide Which Repositories Count
List the repositories that hold infrastructure, documentation or configuration, and exclude them in every prompt so the numbers describe application coupling.
4. Connect the MCP Server to Your AI Assistant
Follow the MCP documentation to connect Keypup to Claude, ChatGPT, Cursor or any MCP-compatible assistant.
5. Bring the Data to Architecture Reviews
Run the co-change heatmap and the coupling bars before each architecture review, and check the trend after every service extraction or consolidation. Use the half-shipped list in the weekly cross-team sync.
Frequently Asked Questions
What is a distributed monolith?
A distributed monolith is a system split into separate services or repositories that still have to change and release together. It has the operational cost of microservices — networks, pipelines, versioning — without their main benefit, which is letting teams ship independently.
How do you measure coupling between microservices?
Count how often a single unit of work needs changes in several repositories. Linking each Jira issue to the pull requests that resolve it gives the list of repositories each change touched. The share of issues touching two or more repositories, and the pairs that change together most often, measure coupling as it shows up in delivery.
Why are DORA metrics good while features are still slow?
Because most DORA dashboards measure each repository on its own. Pull requests can be small and fast in every repository while the feature waits between them. Measuring cycle time and merge spread at the level of the Jira issue, across all its linked pull requests, shows the delay that per-repository metrics miss.
Should we merge services that always change together?
Not automatically, but it's the first question to ask. Repositories that change together on most issues either belong to the same service or share a contract that needs to be versioned. The co-change data tells you where to look; the decision still depends on ownership, scale and deployment needs.
The Bottom Line
Your architecture diagram shows how the system is split. Your delivery data shows how the work is split. Keypup MCP compares the two:
✅ Measuring how many changes cross repository boundaries and how much code they carry ✅ Pricing each extra repository in cycle time and merge spread ✅ Tracking whether coupling improves as the architecture evolves ✅ Mapping the repositories that always change together ✅ Scoring each repository's independence ✅ Showing how long repositories wait for each other ✅ Listing half-shipped changes to unblock this week
Compare the 6 best engineering metrics software for board reporting in 2026 — Keypup, Swarmia, Code Climate Velocity, Jellyfish, Faros and LinearB — on board-ready reporting clarity, business context mapping, non-technical accessibility, DORA Metrics, customization and AI capabilities. Learn which metrics belong in an engineering board report and how to translate them into language your board understands.
Engineering headcount grew 50%, yet merged pull requests and delivered Jira issues barely moved. Learn what engineering leaders on Reddit say about hiring that slows teams down, and how Keypup MCP uses pull request, review and Jira data to show where the extra capacity goes: review queues, overloaded reviewers and work that now spans several repositories.
Software capitalization, client billing and R&D tax credits all run on Jira time logs that engineers fill in on Friday afternoon, from memory. Learn what engineering and finance leaders on Reddit say about time tracking nobody trusts, and how Keypup MCP compares Jira worklogs with linked pull requests, commits and merges to show when time is logged, how late it arrives, and which hours have code behind them.