📌 TL;DR: The Key Takeaways
- Traditional velocity metrics (like story points or PRs merged) often lack crucial context, leading to misinterpretations and the 'micromanagement trap.'
- True engineering velocity encompasses sustainable delivery, quality, and value, requiring a holistic view of DORA metrics, cycle time, and beyond.
- Keypup's AI autonomously unifies disparate Git, Jira, and other data, providing the missing context to understand the why behind velocity fluctuations.
- Shift the focus from individual performance to systemic SDLC bottlenecks, fostering a culture of continuous improvement, not blame.
- Leverage AI-powered, prescriptive analytics to diagnose issues, identify root causes, and accelerate software development and delivery performance.
The Elusive Truth of Engineering Velocity
In the fast-paced world of software development, engineering velocity is a concept frequently discussed but rarely truly understood. At its core, engineering velocity measures the rate at which engineering teams deliver value. However, the common misconception is that it's simply about 'going faster' – pushing more code, closing more tickets, or completing more story points. This reductive view has plagued the industry for years, leading to frustration, misaligned efforts, and a continuous struggle to define and measure true SDLC performance effectively.
Organizations grapple with questions like: Are we truly improving? Is our team productive? Why are we falling behind schedule? Traditional approaches, often reliant on isolated metrics, consistently fall short in providing satisfactory answers. To move forward, we need a more nuanced understanding of what truly constitutes meaningful engineering velocity, one that moves beyond raw output to encompass the holistic health and efficiency of the software delivery pipeline. This requires not just data, but context.
The Traps of Traditional Metrics: Why Raw Numbers Mislead
Relying solely on simplistic engineering velocity metrics like story points completed, lines of code written, or raw PR counts is a common pitfall that often leads to more problems than solutions. These isolated metrics, while easy to track, are notorious for being easily 'gamed' and for incentivizing the wrong behaviors. Developers, feeling the pressure to demonstrate productivity, might artificially inflate story point estimates, split work into tiny, meaningless pull requests, or prioritize quantity over quality. This environment quickly devolves into the dreaded 'micromanagement trap,' where metrics become weapons rather than tools for improvement.
The fundamental flaw lies in the lack of context. An increase in PRs merged might look good on a dashboard, but it doesn't tell you if those PRs were for high-value features, critical bug fixes, or minor refactors. A dip in story points might signal a problem, but without knowing if the team was battling an unexpected outage or tackling complex technical debt, it's impossible to diagnose the real issue or celebrate genuine, albeit less visible, improvements.
The developer community's frustration with these metrics is palpable:
My manager uses Jira velocity against us. It feels like a productivity weapon, not a tool for improvement. We game the system to look busy, not actually deliver value.
We chase story points, but the actual impact to users barely moves. Are we really going faster or just looking busy? The numbers don't tell the real story of our engineering velocity.
DORA metrics are great in theory, but without context, they just become another way to micromanage and blame individuals. We need to understand the 'why' behind the numbers, not just the 'what'.
These sentiments highlight the critical need to move beyond raw, uncontextualized numbers and embrace a more sophisticated approach to measuring and understanding engineering performance.
Beyond the Data: Defining True, Contextual Engineering Velocity
True engineering velocity is far more than just speed; it's about efficient software delivery performance that consistently delivers high-quality, sustainable value. It shifts the focus from mere output to impactful outcomes. This involves a holistic view of critical factors, including:
- Reducing Lead Time for Changes: The time it takes for a change to go from commit to production.
- Improving Cycle Time Engineering: The duration from work start to release, broken down by stages.
- Maintaining High Deployment Frequency: How often an organization successfully releases to production.
- Ensuring Low Mean Time to Recovery (MTTR): How quickly an organization can recover from failures in production.
These are the foundational DORA metrics, vital for assessing DevOps metrics and SDLC performance. However, even these powerful agile engineering metrics only become truly valuable when understood within their broader context. What caused a spike in MTTR? Was it a complex new feature, a legacy system failure, or a team capacity issue?
True engineering velocity also considers:
- Technical Debt: The unseen burden that slows down future development.
- Unplanned Work: Interruptions, hotfixes, and unexpected issues that derail planned efforts.
- Team Health and Morale: A productive team is a healthy, motivated team.
- Value Stream Management: How efficiently the entire process, from idea to customer value, flows.
By integrating these contextual elements, we can transition from simply tracking engineering productivity metrics to truly understanding and optimizing software delivery performance. It's about data-driven software development that reveals the why behind the what, enabling teams to diagnose systemic issues rather than just observing symptoms.
Keypup's AI: Unifying Data for Unprecedented Velocity Insights
The solution to the contextual gap in engineering velocity lies in unifying and making sense of fragmented engineering data. This is where Keypup's AI-powered engineering intelligence platform shines. Keypup moves beyond traditional dashboards by using Natural Language Processing (NLP) to autonomously connect and interpret data from disparate sources like:
- Git repositories: GitHub, GitLab, Bitbucket, ADO (commits, pull requests, branches)
- Project management tools: Jira, Trello, ClickUp, GitHub Projects (issues, epics, story points, sprints)
This autonomous unification creates a single source of truth, providing a holistic, real-time view of your SDLC performance. Keypup's AI understands the relationships between seemingly disconnected activities—a commit to a specific branch, a pull request review, a linked Jira ticket, a deployment event—and stitches them together to paint a comprehensive picture. This enables you to go beyond superficial metrics and gain unprecedented velocity insights by asking natural language questions directly to your data.
Here’s how Keypup’s AI helps you unlock these insights:
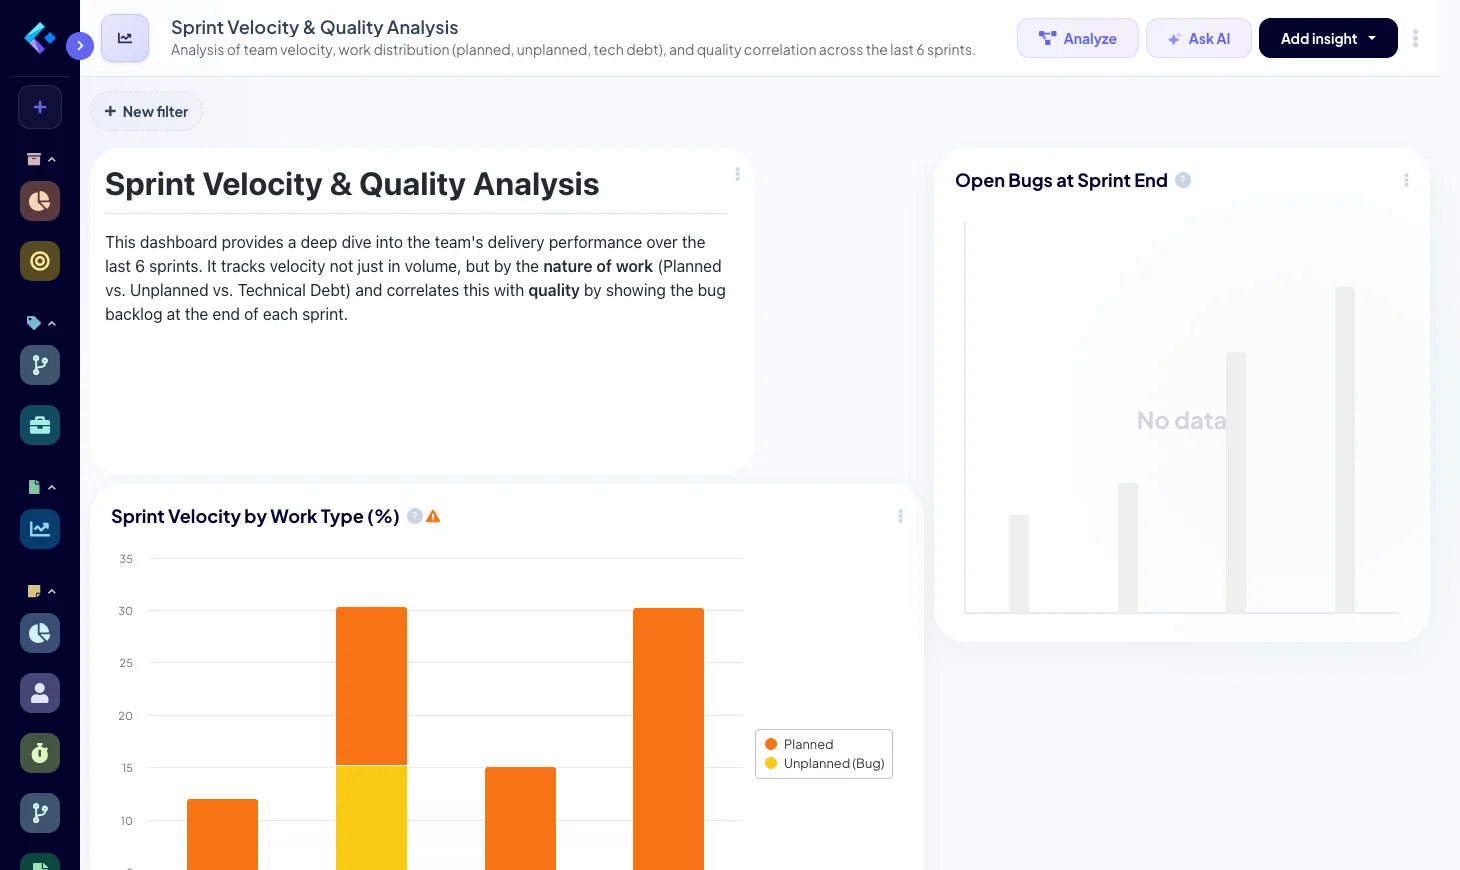
Sprint Velocity vs. Unplanned Work & Context
Prompt to the Keypup platform
Show me our team's sprint velocity for the last 6 sprints, broken down by the percentage of planned work, unplanned work, and technical debt tasks completed. Also, provide a correlation with the number of open bugs at the end of each sprint.
Context: Traditional sprint velocity often only accounts for 'planned' story points. This prompt helps engineering leaders understand how external factors like unplanned work (interrupts, hotfixes) and accumulating technical debt actively cannibalize planned velocity and impact quality. It solves the problem of misinterpreting 'low velocity' as a lack of effort rather than a symptom of systemic issues.
Analysis from Keypup AI
Key Insights 📊
- A clear visualization of how high unplanned work or technical debt consistently reduces the capacity for planned feature delivery.
- Identification of specific sprints where velocity dropped due to a surge in bug fixes or urgent requests.
- Insights into the trade-off between speed and quality, showing if faster delivery consistently leads to more bugs later. ⚠️ Bottlenecks and Problem Areas
- Systemic capacity reduction due to a high volume of unplanned work and unaddressed technical debt.
- Potential trade-off issues between delivery speed and software quality, where prioritizing one negatively impacts the other. 💡 Recommendations
- Initiate data-driven conversations about resource allocation, strategies for technical debt repayment, and smarter workload prioritization.
- Re-evaluate sprint planning to explicitly account for a realistic percentage of unplanned work. 🚀 Priority Actions
- Implement explicit capacity allocation for unplanned work and technical debt in future sprint planning.
- Prioritize technical debt repayment based on its identified impact on planned velocity and bug accumulation.
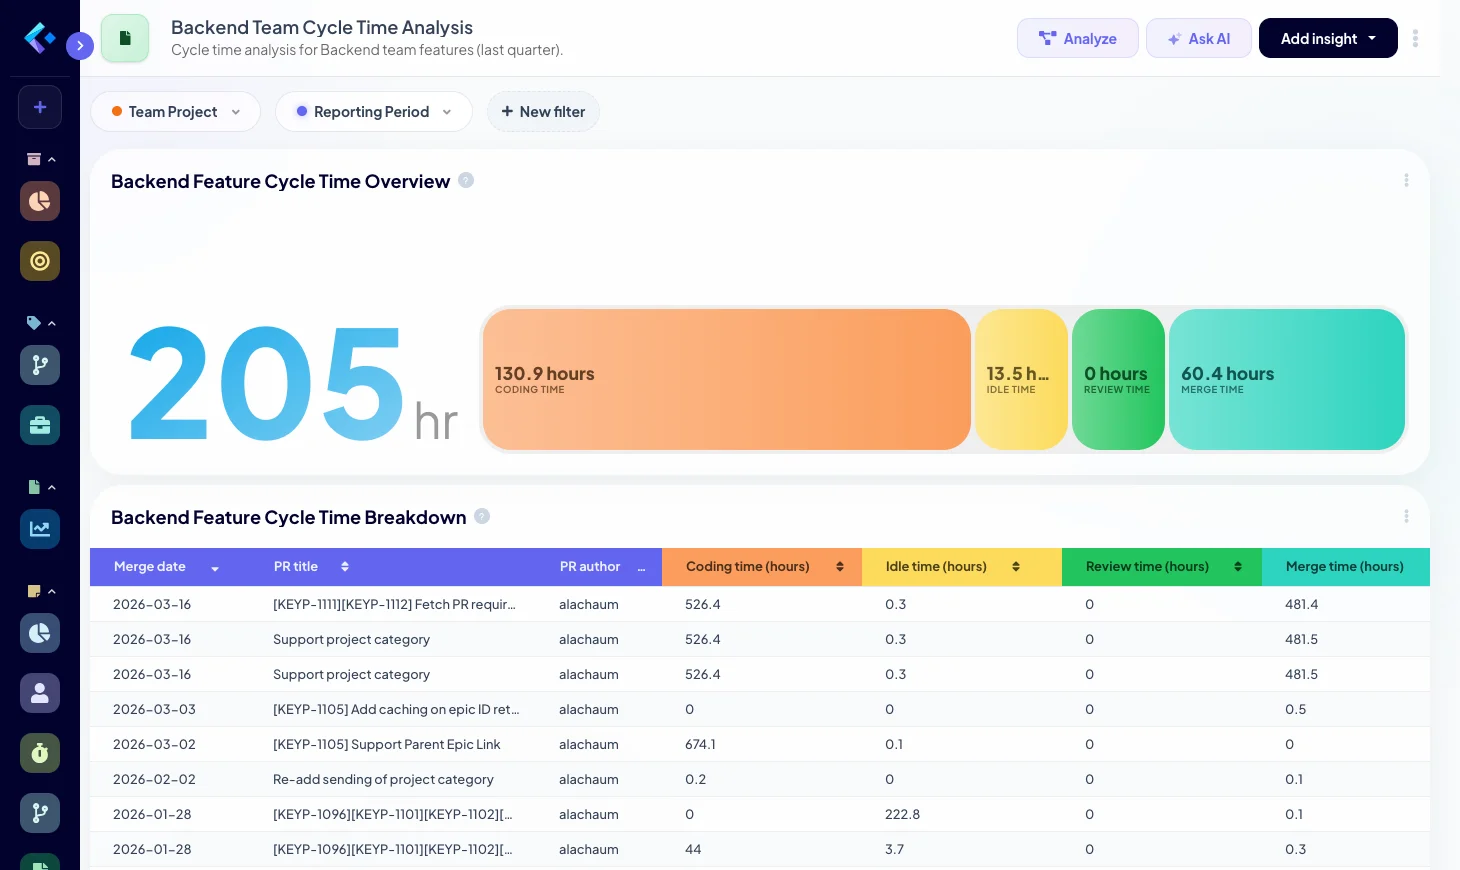
Detailed Feature Cycle Time Bottleneck Analysis
Prompt to the Keypup platform
Analyze the average cycle time for new features from commit to deployment over the last quarter for our 'Backend' team. Break down this cycle time into its constituent stages: coding, pull request review, testing, and deployment. Highlight the stage with the longest average duration and any significant variations.
Context: Optimizing cycle time engineering is critical for improving overall software delivery performance. However, knowing the total cycle time isn't enough; you need to pinpoint where the delays occur. This prompt helps identify specific bottlenecks within the software development lifecycle (SDLC), enabling targeted interventions rather than vague attempts at 'speeding things up.'
Analysis from Keypup AI
Key Insights 📊
- A precise breakdown revealing, for example, that 'PR review time' consistently accounts for 40% of the total cycle time, or that 'testing' stages are highly variable.
- Identification of specific features that had unusually long cycle times and the exact stages where they got stuck. ⚠️ Bottlenecks and Problem Areas
- Consistently long durations in specific stages (e.g., PR review, testing) indicating potential process inefficiencies or resource constraints.
- High variability in stage durations, suggesting inconsistent practices or unpredictable workloads. 💡 Recommendations
- Focus improvement efforts precisely on the identified bottleneck stages—e.g., by implementing better code review practices, automating more tests, or streamlining deployment pipelines.
- Conduct a deeper dive into features with unusually long cycle times to understand specific blockers. 🚀 Priority Actions
- Initiate a process review for the stage consuming the most time (e.g., optimize code review workflows).
- Invest in test automation to reduce testing variability and duration.
- Evaluate and refine deployment pipelines for greater efficiency and predictability.
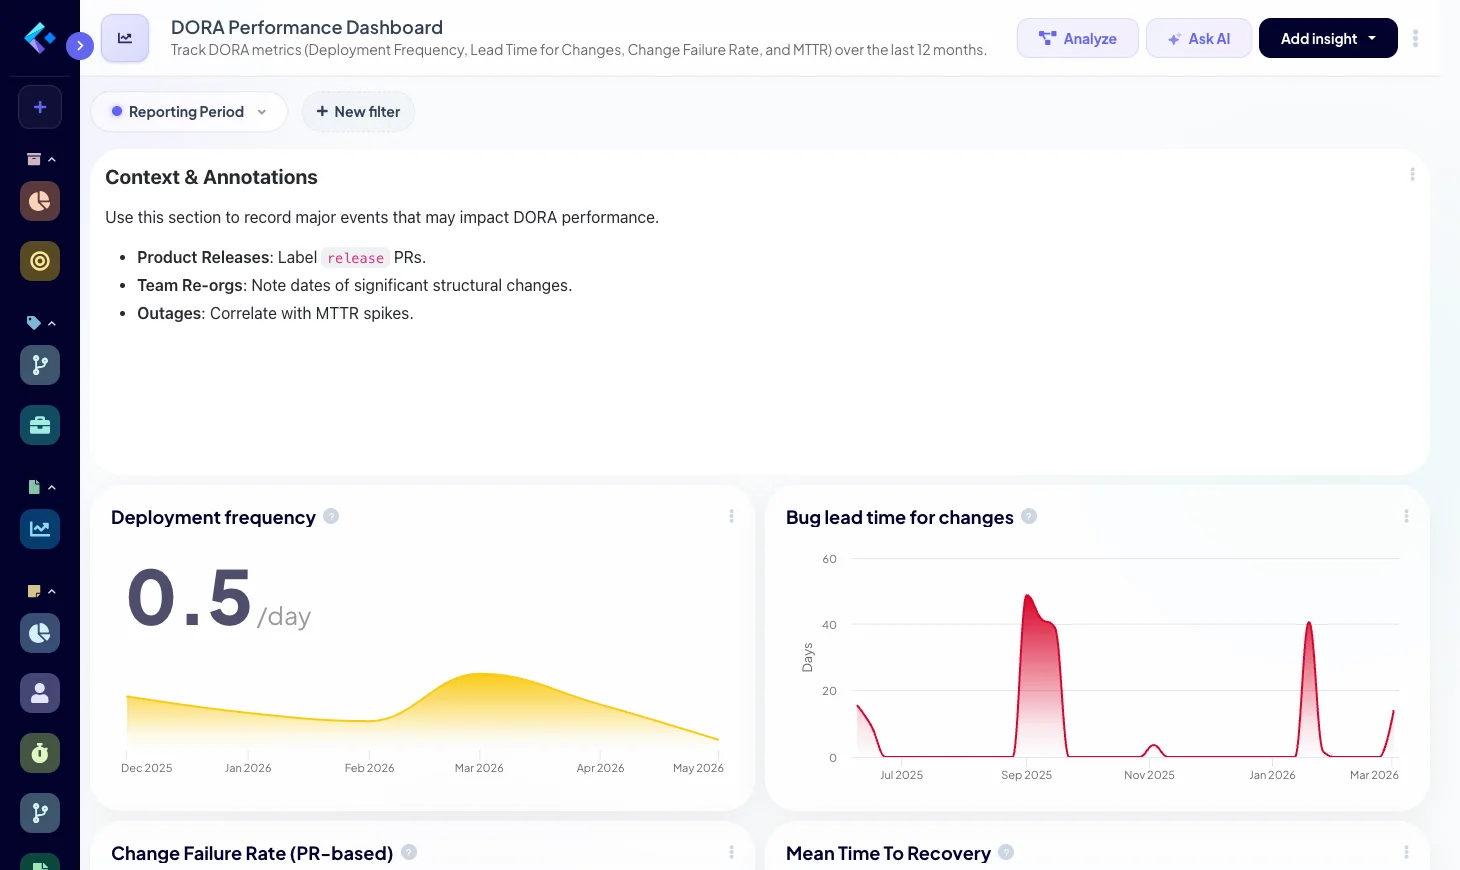
DORA Metrics Trend with Major Release and Team Event Correlation
Prompt to the Keypup platform
Generate a dashboard displaying our DORA metrics (Lead Time for Changes, Deployment Frequency, Change Failure Rate, Mean Time to Recover) over the last 12 months. Overlay this data with annotations for major product releases, significant team re-organizations, and major outages.
Context: DORA metrics are foundational for assessing SDLC performance and DevOps metrics, but their raw trends often lack crucial explanatory context. This prompt helps engineering leaders understand why these metrics fluctuate, correlating performance changes with actual events in the engineering organization or product lifecycle. It moves beyond just 'what' happened to 'why' it happened, essential for true engineering intelligence and value stream management.
Analysis from Keypup AI
Key Insights 📊
- Visual correlation showing, for instance, a dip in Deployment Frequency or an increase in Change Failure Rate immediately following a major, complex release, indicating potential release process issues.
- Identification of improvements in Lead Time for Changes after a team re-organization, suggesting better focus or optimized team structures.
- A clear narrative of how organizational and product events impact core software delivery performance. ⚠️ Bottlenecks and Problem Areas
- Negative impacts on DORA metrics correlating with major, complex releases (e.g., indicating release process fragility or insufficient testing).
- Potential performance degradation during periods of significant organizational change if not managed effectively. 💡 Recommendations
- Learn from past events to refine release processes, improve change management strategies, and better prepare for high-impact product launches.
- Leverage the data narrative to strategically improve engineering productivity metrics and overall SDLC health. 🚀 Priority Actions
- Conduct in-depth post-mortem analyses for all significant DORA metric dips correlated with major events.
- Develop and refine playbooks for major releases or team re-organizations to mitigate potential negative impacts on delivery performance.
From Insights to Action: Optimizing Your SDLC with AI
Keypup's platform goes far beyond mere reporting. It transforms raw, contextualized data into prescriptive analytics and actionable insights, enabling true data-driven software development. With Keypup, you can:
- Identify Root Causes: Pinpoint the exact reasons behind SDLC bottlenecks, whether it's extended PR review times, insufficient test coverage, or an overwhelming amount of unplanned work.
- Suggest Improvements: The AI can highlight areas where process changes, automation, or resource re-allocation would yield the greatest impact on engineering productivity metrics and overall software delivery performance.
- Enable Proactive Optimization: Shift from a reactive approach—fixing problems after they occur—to proactive SDLC optimization. Keypup helps you anticipate issues before they become critical, allowing you to implement preventative measures and continuous improvement cycles.
- Foster a Culture of Improvement: By providing objective, contextual data, Keypup helps teams move past blame and towards collaborative problem-solving. The focus shifts from "who is slow?" to "where is our process broken?", fostering psychological safety and empowering teams to take ownership of their performance.
This comprehensive approach ensures that every improvement effort is targeted, measurable, and contributes directly to accelerating your software development lifecycle and enhancing your engineering intelligence.
Frequently Asked Questions About Engineering Velocity Metrics
What is the difference between velocity and true engineering velocity?
Traditional 'velocity' often refers to a quantitative measure like story points completed or PRs merged. True engineering velocity, as defined by Keypup, encompasses not just speed but also the quality, sustainability, and business value delivered, understood through a contextual lens of DORA metrics, cycle time, technical debt, and unplanned work.
How does Keypup's AI provide context to engineering metrics?
Keypup's AI uses Natural Language Processing (NLP) to autonomously analyze and connect data from disparate sources like Git repositories and Jira tickets. It understands the relationships between commits, PRs, issues, and discussions, identifying intent, scope, and impact to provide a holistic, contextual view that raw metrics alone cannot.
Can Keypup help us avoid the 'micromanagement trap' with metrics?
Absolutely. By providing deep, contextual insights, Keypup shifts the focus from individual performance to systemic bottlenecks in your SDLC. Instead of asking 'Who is slow?', teams can ask 'Where is our process broken?' This fosters a culture of continuous improvement, not surveillance, transforming engineering productivity metrics into tools for collaboration and growth.
What kind of teams benefit most from Keypup's contextual velocity metrics?
Any software development team struggling with visibility into their true delivery performance, experiencing disconnects between project management and engineering, or aiming to improve their SDLC efficiency and DORA metrics will benefit. This includes engineering managers, VPs of Engineering, CTOs, and even individual contributors seeking to understand and improve their impact.