The Bus Factor Bomb: How Key-Person Dependency Risk Is Quietly Threatening Your Enterprise Codebase
Every enterprise engineering org has at least one critical service that only one person truly understands — and no dashboard tracks it until that person quits, burns out, or goes on leave during an incident. Discover how Keypup MCP quantifies bus factor across your codebase, ranks services by knowledge concentration risk, and gives leadership a data-driven case for pairing and documentation before the exposure becomes an outage.
TL;DR: Enterprise codebases routinely accumulate "bus factor 1" services — critical systems where a single engineer authored the overwhelming majority of commits, holds the only real mental model of the code, and has never been meaningfully backed up by a peer. Standard engineering dashboards don't measure this at all; it only surfaces the day that engineer resigns, gets sick, or is unreachable during a production incident. The Keypup MCP Server calculates a real bus factor score per service from Git history, ranks modules by sole-owner exposure, tracks how concentration erodes over time, and gives leadership a defensible, data-backed case for pairing, documentation, and rotation investment — before the exposure turns into an outage nobody can resolve.
Ask any staff engineer at a large organization to name the one service they'd least want to touch if a specific colleague left tomorrow, and they'll answer instantly, without hesitation, without needing to check anything. That instant answer is the problem: everyone on the team already knows exactly where the risk lives, and almost nobody has ever put a number on it, staffed against it, or told leadership before it became urgent.
The Friction: A Risk Everyone Feels but No Dashboard Measures
Sprint velocity, DORA metrics, and cycle time dashboards all measure how fast work gets done. None of them measure how fragile the org is if the person doing that work disappears. Bus factor — the minimum number of team members who'd need to leave before a project stalls — is one of the oldest concepts in software engineering risk, and one of the least operationalized in enterprise reporting.
Ownership concentrates silently, one commit at a time. No single decision creates a bus-factor-1 service. It's the cumulative effect of the same engineer being the fastest, most available, or most senior person every time that codebase needs a change, for years, until nobody else has touched it enough to be trusted with it.
Org charts show reporting lines, not knowledge lines. A team can have six engineers and still have a service only one of them can safely modify. Headcount and bus factor are not the same number, and most staffing conversations conflate them.
It's invisible until the triggering event. The risk is completely real and completely dormant — right up until the sole owner resigns, takes parental leave, gets paged out sick during an incident, or simply becomes unreachable at 2 a.m. when the one system only they understand goes down.
Attrition isn't even the main driver. Teams assume bus factor problems are a retention issue. Just as often, it's a rotation issue — new engineers keep joining a team, but nobody ever rotates them onto the one legacy module the tenured engineer has quietly owned since before most of the team was hired.
The result: enterprise engineering orgs routinely carry single points of failure in exactly the services that matter most, and it never becomes anyone's job to reduce that risk, because it never becomes anyone's number to report.
Why This Matters: The Cost Shows Up as an Incident, Not a Metric
The Incident-Response Problem
When a bus-factor-1 service breaks and its sole owner is unreachable, mean-time-to-resolve stops being a skills problem and becomes a search problem — someone has to reverse-engineer undocumented code under incident pressure, often for the first time, while customers are affected. The team's actual incident response capability was never as good as its dashboards implied; it was borrowed entirely from one person's availability.
The Succession Planning Problem
Without a concrete bus factor number, "what happens if this person leaves" stays a hallway conversation instead of a staffing plan. Nobody schedules pairing time against a risk that has no measurement, so the exposure simply persists — often for years — until the departure actually happens and the plan has to be improvised in real time.
The Trust Problem
Engineers who carry sole ownership of a critical system know it, and it's rarely a compliment to them — it's a burden. They can't take real vacations without anxiety about being paged, can't move teams without guilt about what breaks behind them, and get asked to review every single change to "their" code indefinitely. Leadership has no data to notice this is happening until the person burns out or leaves, at which point the org discovers the risk and the departure simultaneously.
The Enterprise Discussion: What Engineers Are Actually Saying
This exact anxiety is one of the most recurring threads wherever engineers at large organizations compare notes on technical debt, on-call load, and team resilience.
"There's a payment reconciliation service that exactly one person on our team of nine understands end to end. Everyone knows it. Nobody has done anything about it in three years, because it's never anyone's actual job to fix — it's just a thing we all quietly avoid touching, and pray that person never leaves. Our roadmap has never once had a line item for 'reduce bus factor on the reconciliation service,' because there's no metric that would ever surface it as a priority."
Engineering Manager, Healthcare Data Platform (r/ExperiencedDevs)
"Our most senior engineer put in his notice and it was like a fire drill nobody had planned for, even though everyone had privately worried about it for two years. He was the only person who understood our HL7 integration layer. We spent six weeks of pure knowledge transfer before he left, and it still wasn't enough — we're still finding gaps eight months later. The frustrating part is we absolutely could have started that transfer two years earlier if we'd had any way to show leadership how concentrated the risk actually was."
The pattern holds: engineers already know exactly which services are one departure away from a crisis — what's missing is a number that turns that shared anxiety into a staffing decision leadership will actually fund.
How Keypup MCP Solves the Bus Factor Problem
The Keypup Model Context Protocol (MCP) Server calculates a real bus factor score directly from Git commit history and issue-tracker activity, ranks services and modules by ownership concentration, tracks how that concentration changes over time, and quantifies which teams are carrying the heaviest single-point-of-failure risk — all through natural-language prompts against your existing GitHub and Jira data.
1. Surfacing How Much of the Critical Surface Area Is Actually Exposed
Before ranking individual services, leadership needs a top-line view of how widespread the exposure actually is.
MCP Prompt:
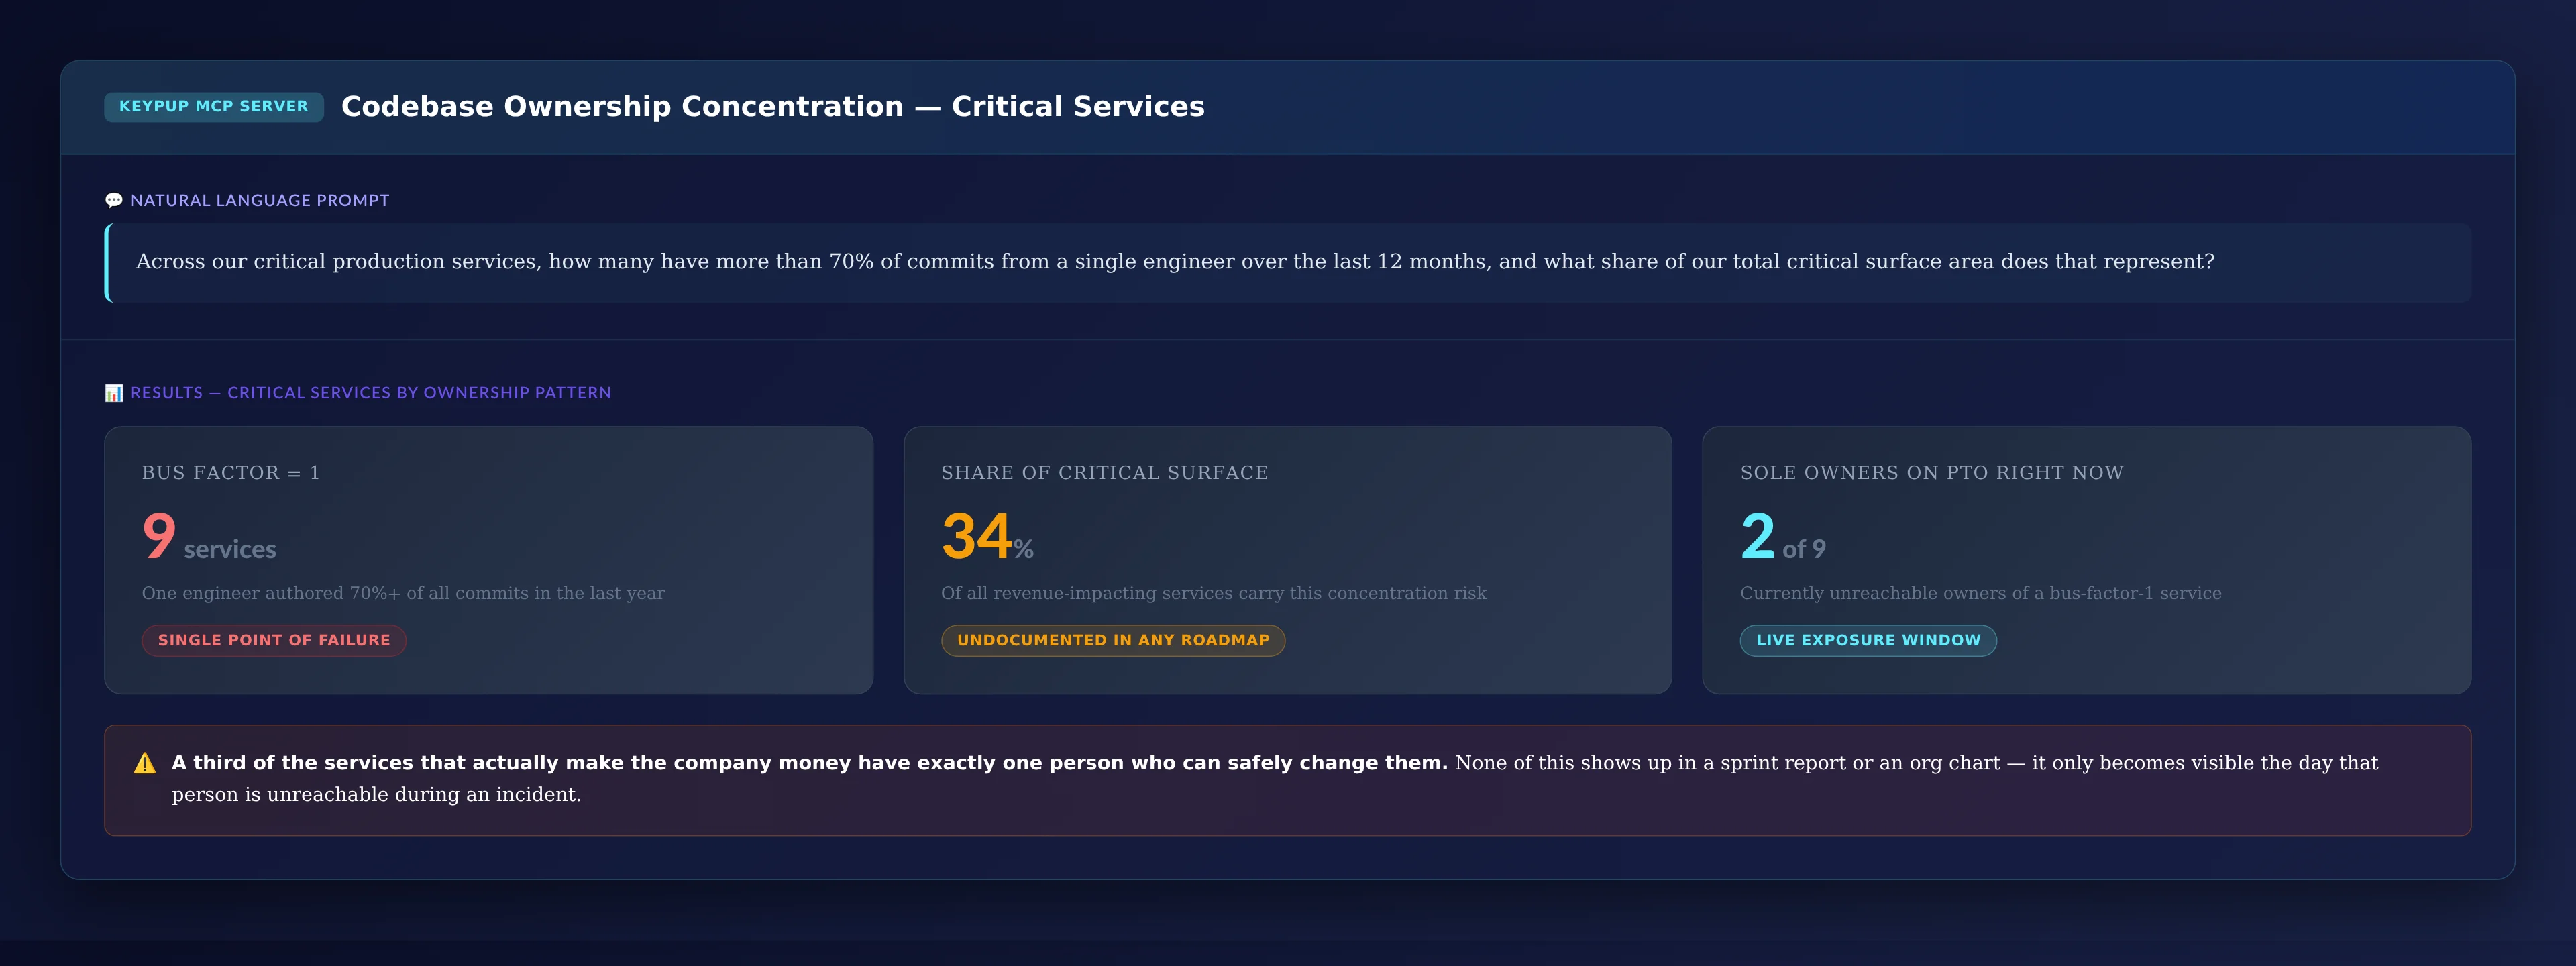
Across our critical production services, how many have more than 70%
of commits from a single engineer over the last 12 months, and what
share of our total critical surface area does that represent?
Key Insight: A third of the services that actually make the company money have exactly one person who can safely change them. None of this shows up in a sprint report or an org chart — it only becomes visible the day that person is unreachable during an incident.
2. Ranking Services by Bus Factor Score
Once the scale of the exposure is clear, leadership needs to know precisely which services are riskiest, ranked by an actual score instead of anecdote.
MCP Prompt:
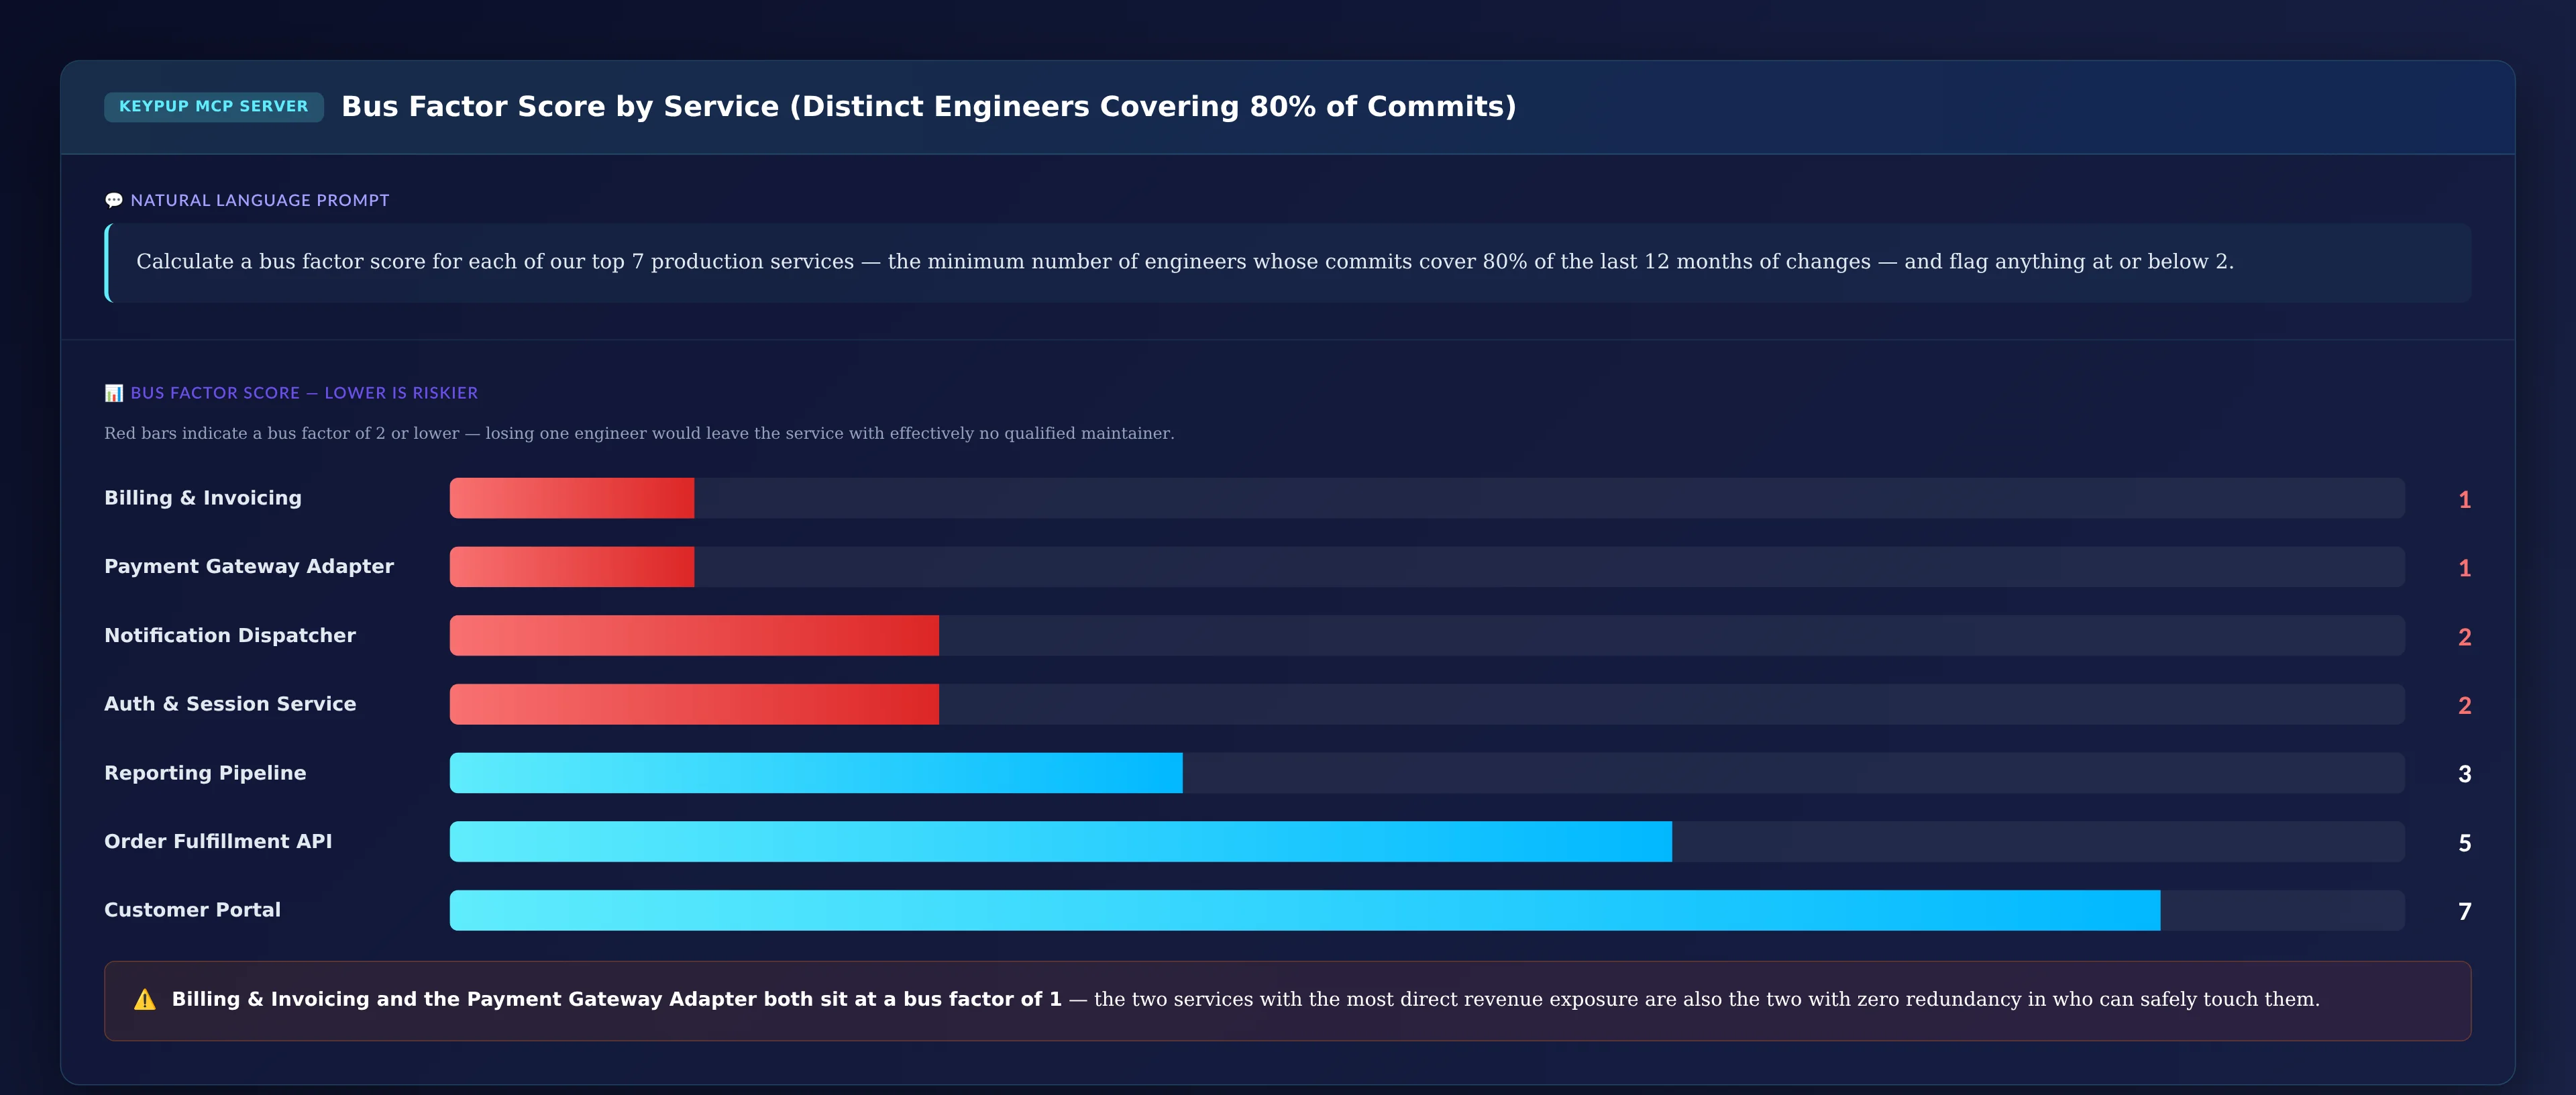
Calculate a bus factor score for each of our top 7 production services
— the minimum number of engineers whose commits cover 80% of the last
12 months of changes — and flag anything at or below 2.
Output: Bus Factor Score by Service
Key Insight: Billing & Invoicing and the Payment Gateway Adapter both sit at a bus factor of 1 — the two services with the most direct revenue exposure are also the two with zero redundancy in who can safely touch them.
3. Diagnosing Why Ownership Concentrated in the First Place
A score alone doesn't tell leadership what to do about it. The next question is why concentration happened, since the fix is different for legacy debt than for a tenured engineer who never rotated off.
MCP Prompt:
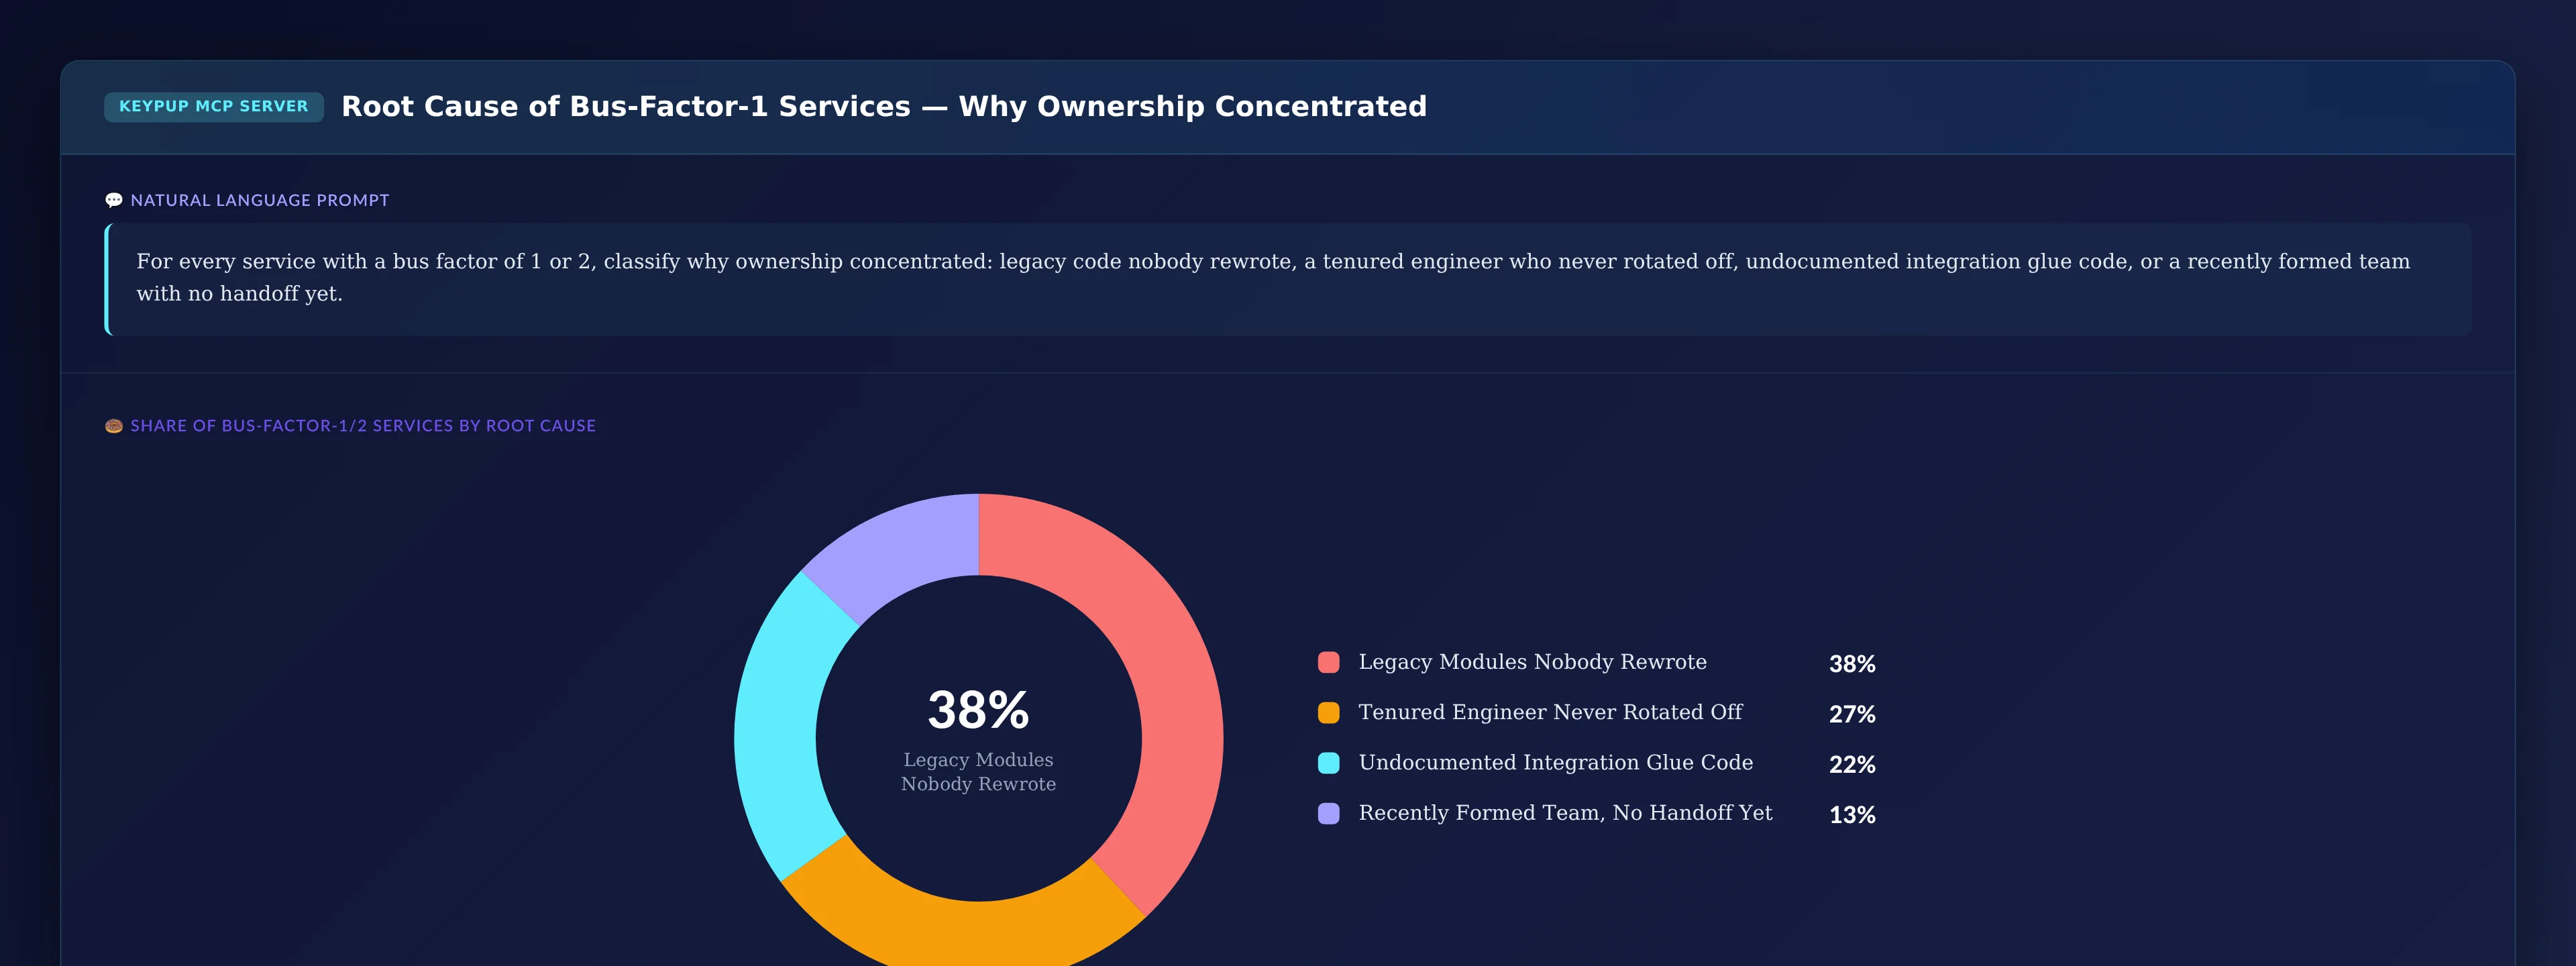
For every service with a bus factor of 1 or 2, classify why ownership
concentrated: legacy code nobody rewrote, a tenured engineer who never
rotated off, undocumented integration glue code, or a recently formed
team with no handoff yet.
Output: Root Cause of Bus-Factor-1 Services
Key Insight: 65% of concentration risk traces back to legacy modules nobody rewrote and tenured engineers who never rotated off. Neither is a hiring problem — both are solvable with deliberate pairing and documentation sprints, if leadership can see where to point them.
4. Getting the Specific Receipts on Each At-Risk Module
For a governance conversation, leadership needs the underlying detail: who the sole owner actually is, how stale peer review is, and whether documentation exists at all.
MCP Prompt:
List our modules with the highest single-engineer commit concentration,
including who the owner is, how long since another engineer reviewed a
change there, and current documentation coverage.
Key Insight: billing-core hasn't had a change reviewed by anyone but its owner in over seven months, and carries no documentation. If E. Alvarez is unreachable during a billing incident, the team's mean-time-to-resolve isn't measured in hours — it's an open question.
5. Proving Concentration Erosion Tracks Rotation Failure, Not Just Attrition
A single snapshot is useful. A trend proves whether the risk is getting worse because people are leaving, or because new hires are simply never rotated onto the riskiest code.
MCP Prompt:
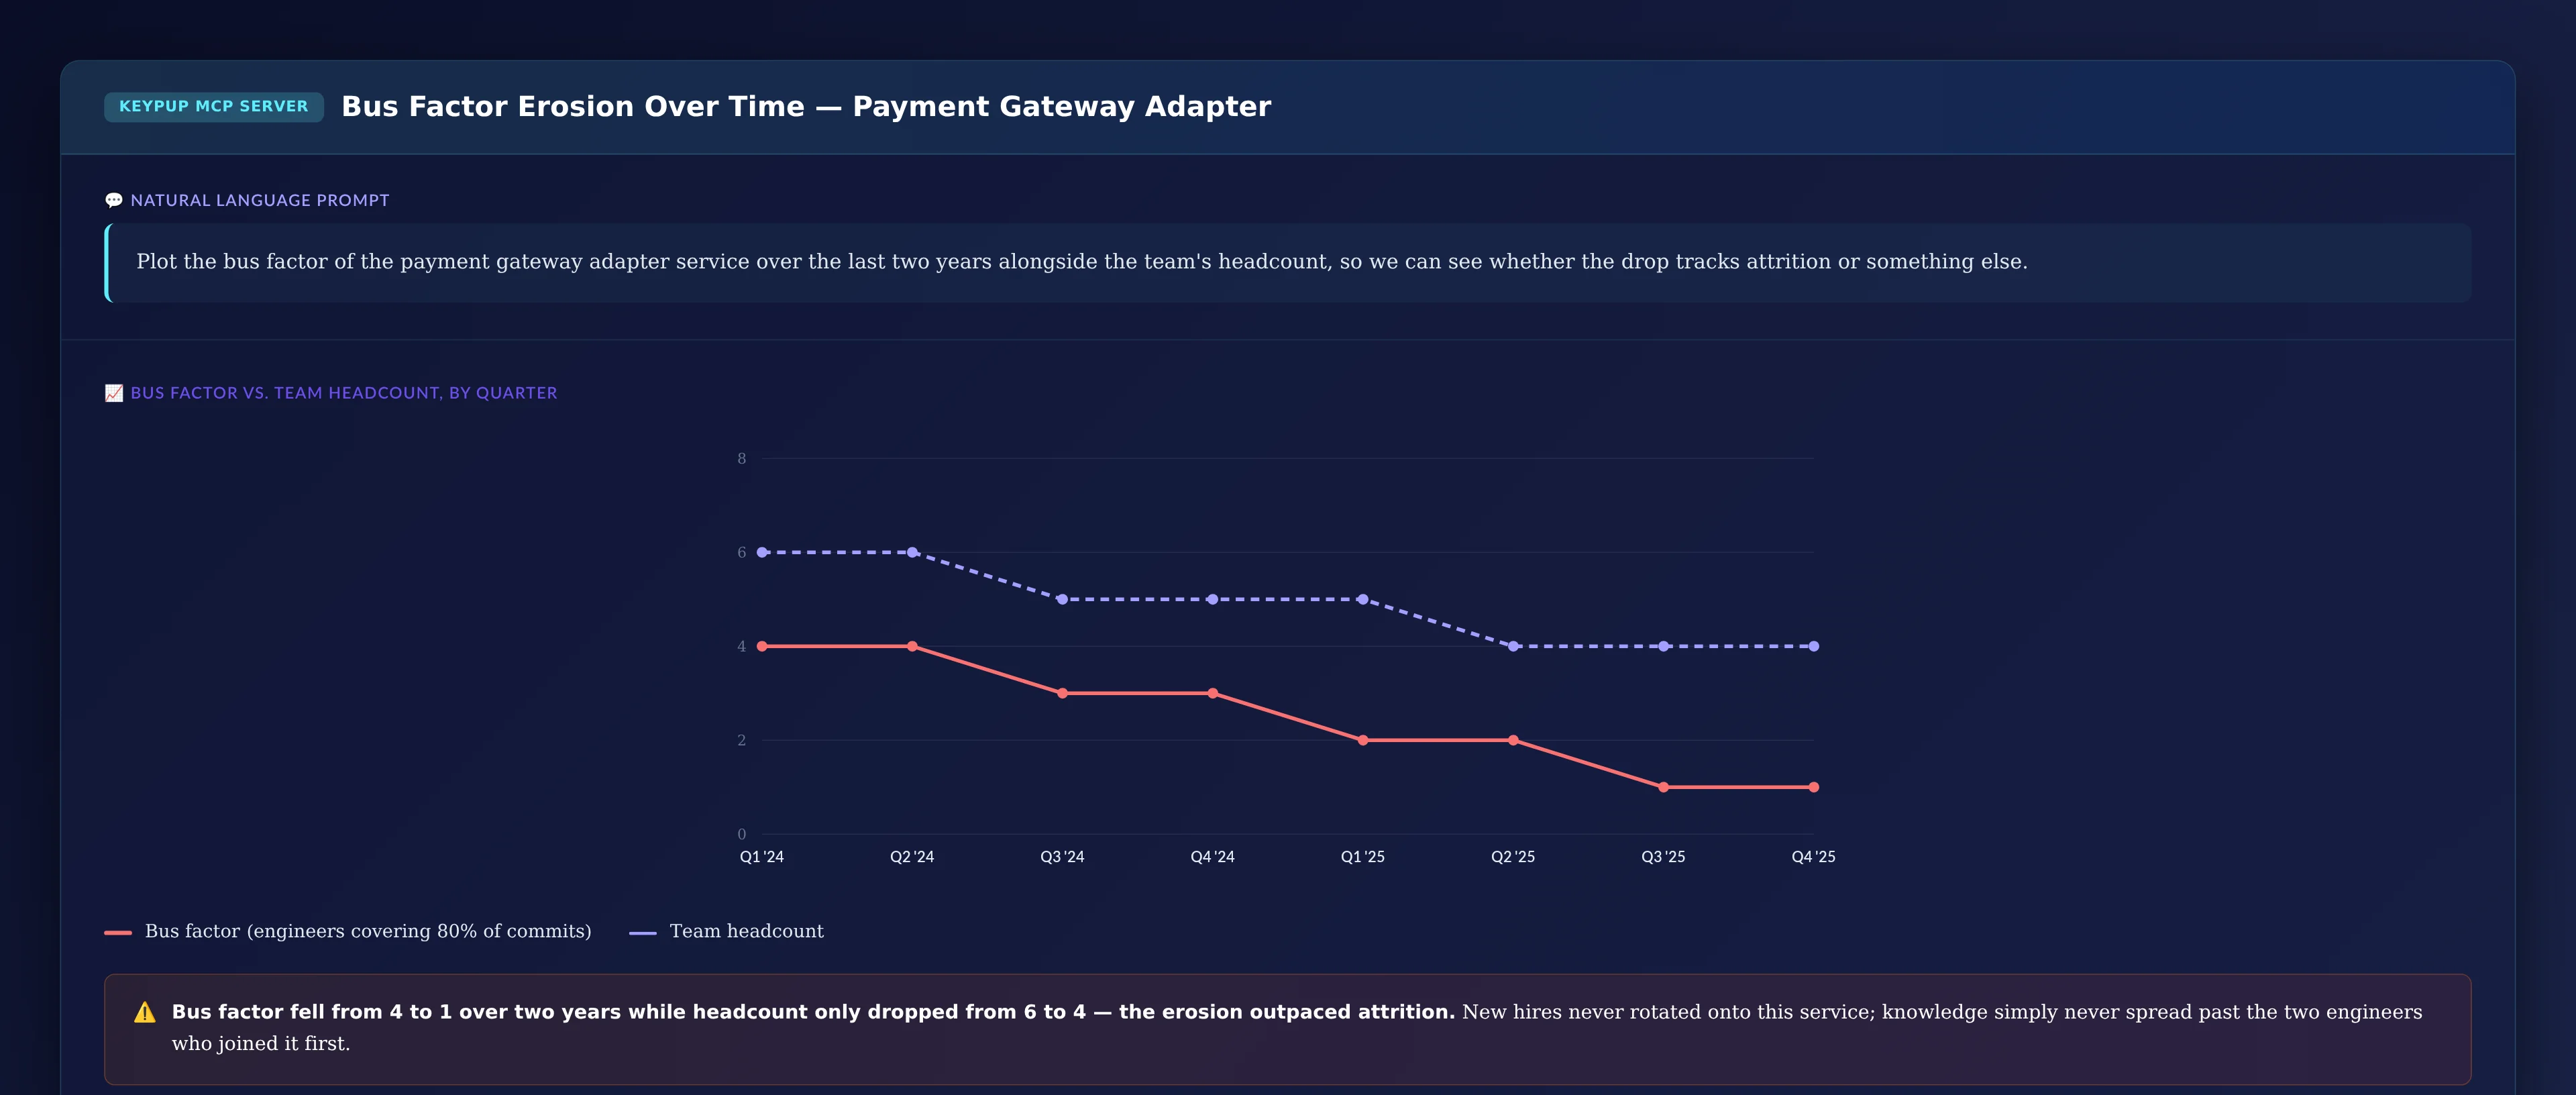
Plot the bus factor of the payment gateway adapter service over the
last two years alongside the team's headcount, so we can see whether
the drop tracks attrition or something else.
Output: Bus Factor Erosion Over Time — Payment Gateway Adapter
Key Insight: Bus factor fell from 4 to 1 over two years while headcount only dropped from 6 to 4 — the erosion outpaced attrition. New hires never rotated onto this service; knowledge simply never spread past the two engineers who joined it first.
6. Giving Leadership a Standing View of Which Teams Carry the Heaviest Concentration Risk
Once the pattern is proven for one service, leadership needs an ongoing view across every team, to fund pairing and rotation where it will actually reduce exposure.
MCP Prompt:
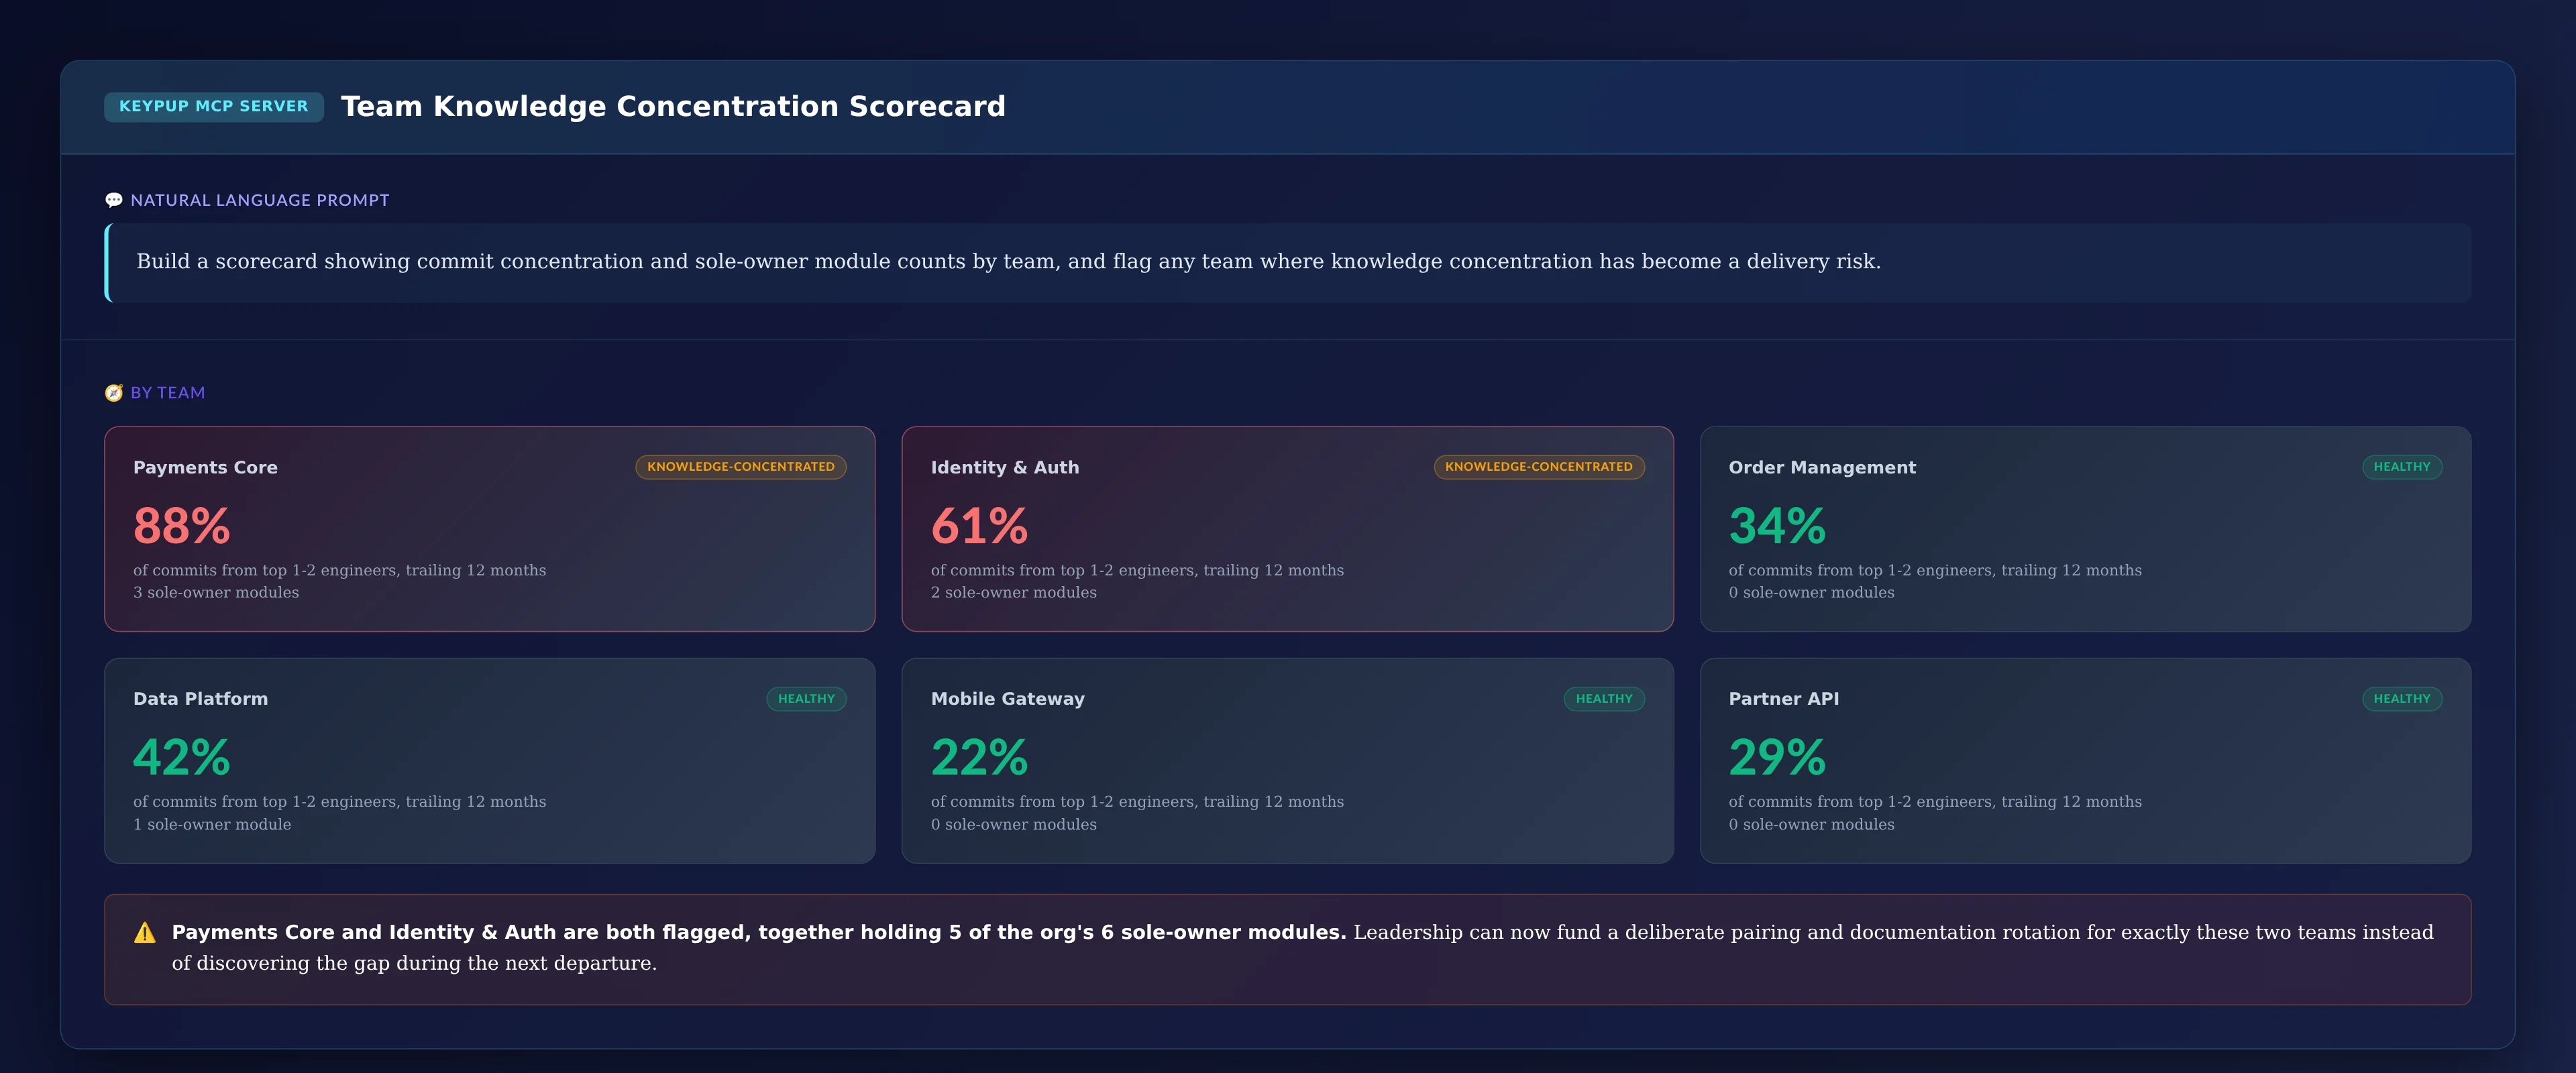
Build a scorecard showing commit concentration and sole-owner module
counts by team, and flag any team where knowledge concentration has
become a delivery risk.
Output: Team Knowledge Concentration Scorecard
Key Insight: Payments Core and Identity & Auth are both flagged, together holding 5 of the org's 6 sole-owner modules. Leadership can now fund a deliberate pairing and documentation rotation for exactly these two teams instead of discovering the gap during the next departure.
The Technical Implementation: How Keypup MCP Calculates Real Bus Factor
Deriving Ownership From Actual Commit and Review History
Keypup MCP computes bus factor from real Git activity — not from self-reported ownership in a wiki that's usually out of date — by analyzing the minimum number of contributors whose commits cover a defined threshold of changes to a module over a rolling window, and cross-referencing who has actually reviewed those changes, not just authored them.
Distinguishing Attrition Risk From Rotation Failure
Rather than treating a falling bus factor as a single undifferentiated signal, Keypup MCP tracks it alongside team headcount over time, so leadership can tell whether concentration is being driven by people leaving or by new hires never being deliberately rotated onto the riskiest legacy code.
Documentation and Review Freshness as Leading Indicators
Because a sole owner with recent peer reviews and current documentation is a materially different risk than one with neither, Keypup MCP surfaces documentation coverage and days-since-last-peer-review alongside the raw concentration percentage, so remediation effort goes to the modules that are actually undocumented and unreviewed, not just concentrated.
Real-World Impact: Enterprise Case Studies
Case Study 1: Regional Insurance Carrier
Before Keypup MCP:
A claims-adjudication service had been maintained by a single senior engineer for six years, with no formal documentation and no other engineer having touched the core logic in over a year
Leadership had no visibility into the exposure until that engineer announced his retirement with three months' notice
The team's initial knowledge-transfer plan assumed two weeks would be enough; it wasn't, because nobody had ever measured how deep the undocumented complexity actually went
After Keypup MCP:
Bus factor scoring across the full claims platform surfaced four additional bus-factor-1 modules the team hadn't flagged as urgent, all owned by engineers approaching retirement eligibility
A structured, data-justified 18-month rotation plan was funded, pairing junior engineers onto each at-risk module with tracked commit-share targets instead of ad-hoc shadowing
The retiring engineer's actual knowledge transfer succeeded on schedule, because the plan started the moment retirement eligibility was visible in the data, not the moment notice was given
"We'd talked about 'key person risk' for years in the abstract. The moment we could see an actual bus factor score, ranked by module, tied to real commit and review data, it stopped being a philosophical risk conversation and became a staffing plan with a budget line. That's the difference between hoping it works out and actually managing it."
— VP Engineering, Regional Insurance Carrier
Case Study 2: Enterprise Logistics Platform
Before Keypup MCP:
Three separate incidents in one year required paging the same senior engineer outside business hours because he was the only person who understood the route-optimization service
The engineer had raised burnout concerns twice, but leadership had no data showing how disproportionate his on-call load actually was relative to the rest of the team
No budget existed for a documentation or pairing initiative because the risk had never been quantified in terms leadership could act on
After Keypup MCP:
The route-optimization service was confirmed at a bus factor of 1, with the engineer authoring 89% of all commits and reviewing 100% of the remaining 11% himself
A two-quarter pairing rotation was funded and tracked, with bus factor as the explicit success metric, moving the service from a score of 1 to 3 within six months
On-call load for the affected engineer dropped by more than half, and the team survived his eventual move to a different group without a knowledge-transfer crisis
"Before this, we had a great engineer quietly heading toward burnout and no way to justify pulling two other people off roadmap work to fix it. Once bus factor was a number on a dashboard instead of a hallway worry, the pairing investment approved itself. Nobody had to argue for it."
— Director of Platform Engineering, Enterprise Logistics Platform
Implementation: Getting Started with Keypup MCP
1. Connect Your Git History First
Bus factor scoring depends on real commit and review data going back at least 12 months — make sure your Git provider and issue tracker are both connected before running any concentration analysis, so ownership calculations reflect actual activity, not assumptions.
2. Stop Treating "Key Person Risk" as a Feeling
Report a real bus factor score per critical service, every quarter, so a concentration problem gets flagged while there's still time to fix it with pairing — not after the departure notice has already been submitted.
3. Query in Natural Language, Across Every Service
No manual spreadsheet audits required. Just ask:
"Which of our services have a bus factor of 1 or 2 right now?"
"Who is the sole owner of our highest-risk modules, and when did someone else last review their code?"
"Has bus factor on this service gotten worse or better over the last four quarters?"
"Which teams are carrying the most sole-owner modules relative to their headcount?"
4. Automate Recurring Root-Cause Reporting
Schedule recurring queries for:
Quarterly bus factor scoring across all critical production services
Root-cause classification for every bus-factor-1 or bus-factor-2 module
Trend tracking of concentration versus headcount, to separate attrition risk from rotation failure
Standing team knowledge-concentration scorecards ahead of headcount and budget planning
The Bottom Line: A Delivery Risk Needs to Be a Number, Not a Hallway Conversation
A risk that everyone feels but nobody measures will always lose the budget argument to a risk that shows up on a dashboard — not occasionally, but every single planning cycle, in every enterprise carrying real single points of failure. Fixing it requires:
✅ Calculating a real bus factor score from actual commit and review history, not self-reported ownership ✅ Classifying why concentration happened, so pairing and documentation investment targets the actual root cause ✅ Tracking concentration over time against headcount, to separate attrition risk from rotation failure ✅ Giving leadership a standing, team-level view of knowledge concentration risk, before the departure notice arrives
The Keypup MCP Server turns the risk every engineer already knows about into a metric leadership can actually fund a fix for — before the bus factor bomb goes off during an incident nobody can resolve.
Ready to Transform Your Analytics?
Join teams already using AI to make data-driven decisions faster than
ever.
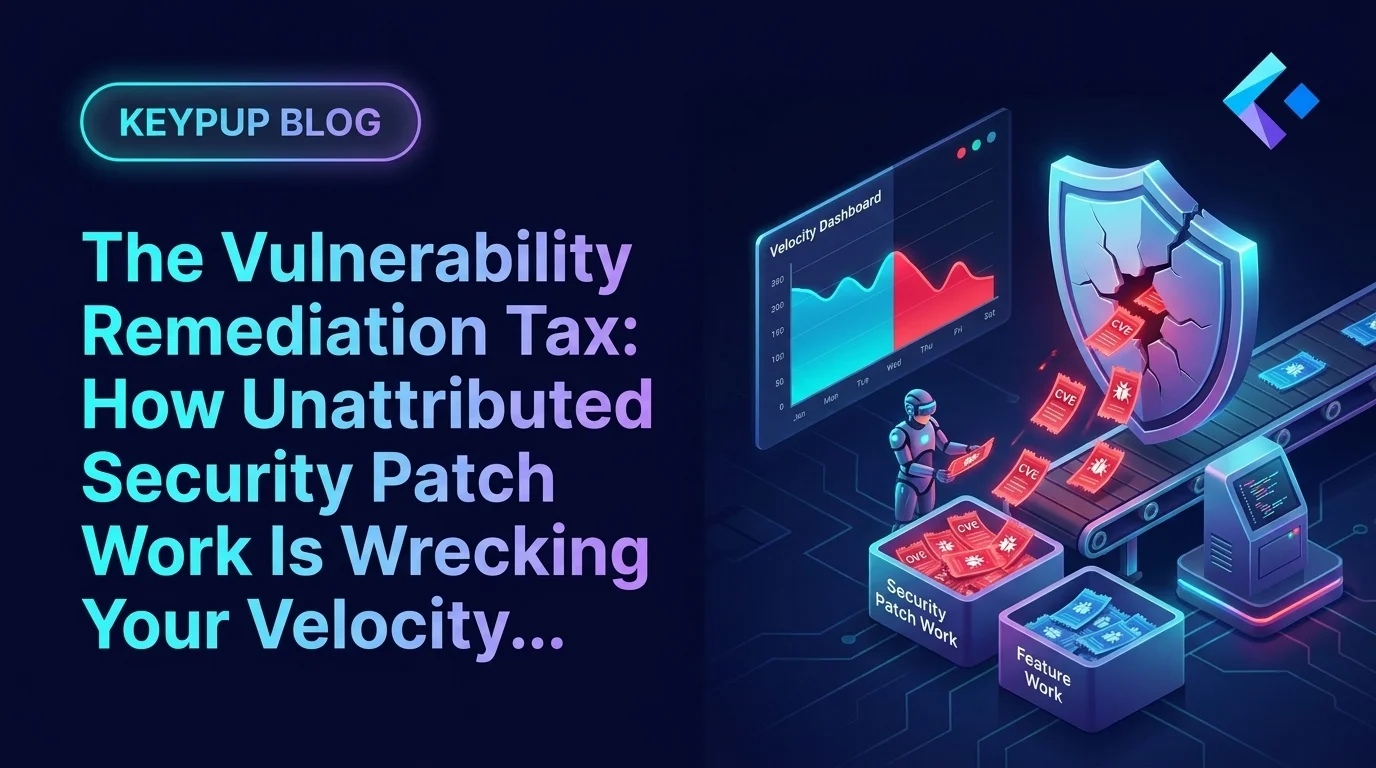
Every enterprise engineering org absorbs CVE patching, dependency upgrades, and vendor-driven security fixes as "just part of the job" — and none of it shows up on a roadmap. When sprint velocity drops, leadership reads it as a productivity problem. Discover how Keypup MCP surfaces the hidden vulnerability remediation tax, separates it from real engineering decline, and gives leadership the data to staff for it instead of penalizing teams for it.
Acquiring a company means acquiring its engineering org — and its deployment frequency, its review culture, and its three-day-old Bitbucket habit. Here's how to measure the integration gap instead of guessing at it.
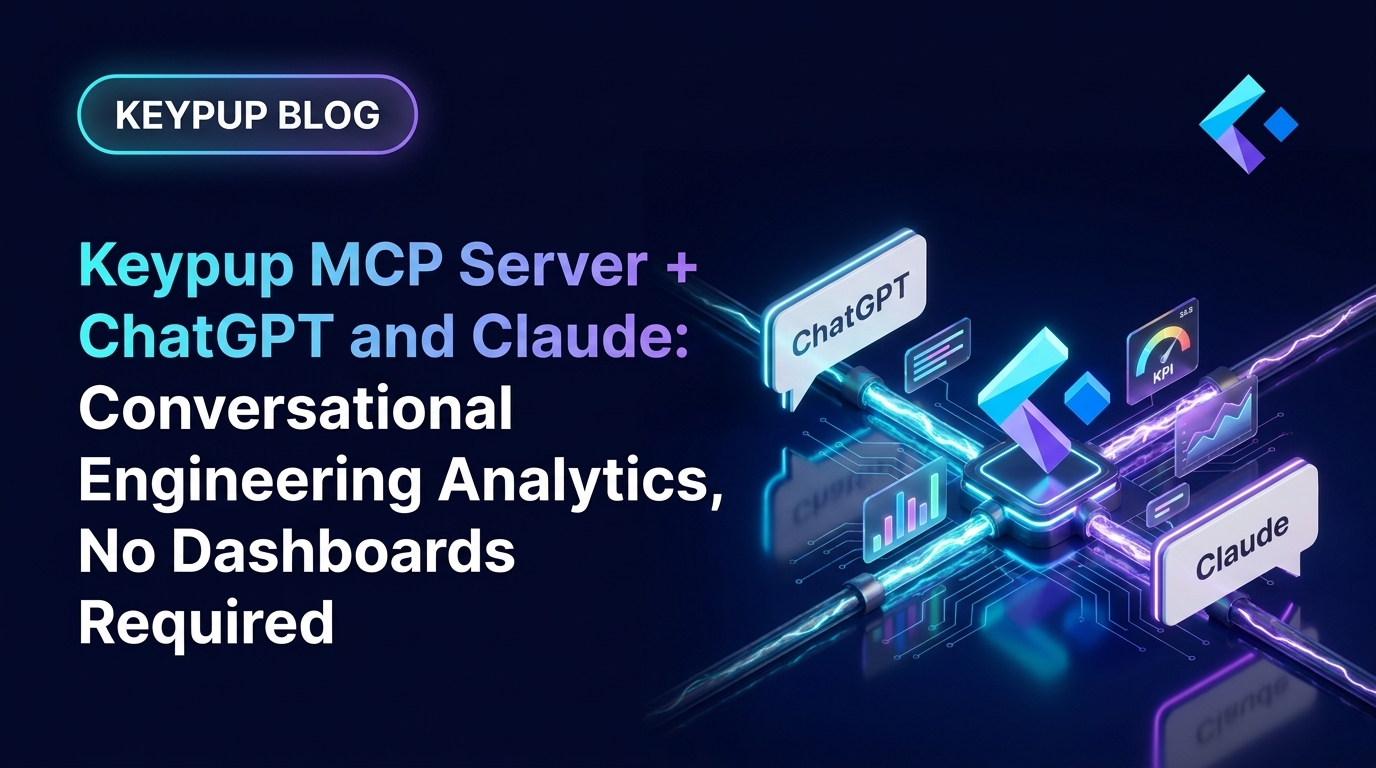
Keypup's MCP server now connects directly to ChatGPT and Claude, letting engineering leaders ask plain-language questions about DORA metrics, cycle time, throughput, and team performance and get instant, formatted answers — charts, tables, and KPIs included. This guide walks through how both integrations work, the concrete benefits over traditional dashboards, and five real prompt-and-output examples spanning delivery velocity, quality, cycle time, and team performance.