Bridging the CFO Translation Gap: How Engineering Analytics Can Finally Speak Finance
Enterprise CFOs need financial outcomes—revenue growth, cost reduction, EBITDA impact, and R&D capitalization. Yet engineering teams track deployment frequency and PR cycle time. Discover how the Keypup MCP bridges this critical translation gap, automatically mapping technical delivery metrics to financial impact and enabling accurate CapEx/OpEx categorization for R&D tax credits.
TL;DR: CFOs and engineering teams speak different languages—one tracks EBITDA impact, CapEx/OpEx ratios, and R&D tax credit eligibility, the other tracks deployment frequency and PR cycle time. This translation gap forces engineering leaders to maintain parallel accounting systems and manually defend million-dollar tax claims. The Keypup MCP Server automatically maps technical delivery data to financial outcomes, generating audit-ready CapEx/OpEx classification, R&D tax credit evidence, and EBITDA impact analysis on demand.
Enterprise CFOs and executive boards operate in a language that engineering teams rarely speak fluently. While developers celebrate improvements in deployment frequency or reduced PR cycle time, C-suite executives focus on financial outcomes: revenue growth, cost reduction, EBITDA impact, and R&D tax credit eligibility.
This fundamental disconnect—what we call the CFO Translation Gap—creates massive friction in enterprise organizations. Engineering directors find themselves maintaining parallel accounting systems, manually auditing automated dashboards, and struggling to prove the business value of their $50M+ R&D budgets.
The Core Problem: Two Languages, One Budget
What CFOs Actually Care About
When presenting to the board, CFOs need answers to questions like:
What percentage of our engineering spend qualifies as CapEx vs OpEx? (This has direct tax implications)
How much of our R&D budget creates capitalizable intellectual property? (Essential for balance sheet optimization)
What's the EBITDA impact of our engineering investments? (The metric that drives valuation)
Can we defend our R&D tax credit claims? (Worth millions in tax benefits)
Which engineering efforts drive revenue growth vs cost maintenance? (Resource allocation decisions)
What Engineering Teams Measure
Meanwhile, engineering analytics platforms focus on:
Deployment frequency and lead time for changes
Pull request cycle time and review duration
Code churn and defect density
Sprint velocity and story point completion
Developer productivity and commit frequency
These metrics are valuable for optimizing engineering processes, but they don't answer the CFO's questions. And that's the problem.
The Enterprise Discussion: Reddit Engineering Directors Speak Out
On engineering leadership forums and Reddit, VPs and directors express frustration with current SDLC analytics tools. The consensus? Automated code metrics cannot distinguish between capitalizable work and operational maintenance.
Engineering Director (r/ExperiencedDevs)
"We bought Jellyfish to prove R&D tax eligibility, but the automated dashboards still require heavy manual auditing. We ended up maintaining separate Excel sheets for finance anyway. The tool is secondary."
VP of Engineering (r/devops)
"Our CFO asked: 'How much of last quarter's engineering time built new features vs fixed bugs?' LinearB couldn't answer that. We had to manually categorize 3 months of tickets."
The pattern is clear: Current tools measure engineering activity, not financial impact.
The Specific Friction Point: CapEx vs OpEx Classification
Why This Matters
In enterprise accounting, distinguishing between Capital Expenditures (CapEx) and Operational Expenditures (OpEx) isn't academic—it's worth millions:
CapEx (new IP development) can be capitalized on the balance sheet and depreciated over time, reducing taxable income
OpEx (maintenance, bug fixes, support) is expensed immediately
R&D tax credits require detailed evidence that engineering hours were spent on eligible innovation activities
The Current Manual Nightmare
Here's what enterprise engineering finance teams do today:
Export raw engineering data from JIRA, GitHub, and other tools
Manually review ticket descriptions to classify work as "new feature" vs "bug fix"
Estimate engineering hours per ticket (since most platforms don't track actual time spent)
Categorize each project as CapEx-eligible or OpEx
Compile evidence folders for auditors (R&D tax credit claims are frequently audited)
Update monthly for financial reporting
Hope nothing gets flagged during the audit
This process takes finance teams 40-80 hours per quarter and still produces questionable accuracy because:
Ticket titles don't reflect actual work complexity
"Bug fixes" in legacy systems often require substantial new code
"New features" might be mostly configuration work
Manual categorization is subjective and inconsistent
How Keypup MCP Solves the Translation Gap
The Keypup Model Context Protocol (MCP) doesn't just bridge the gap—it eliminates it entirely. Here's how:
1. Automatic CapEx/OpEx Categorization by Work Type
Instead of manual ticket review, Keypup MCP analyzes actual engineering activity and automatically categorizes work.
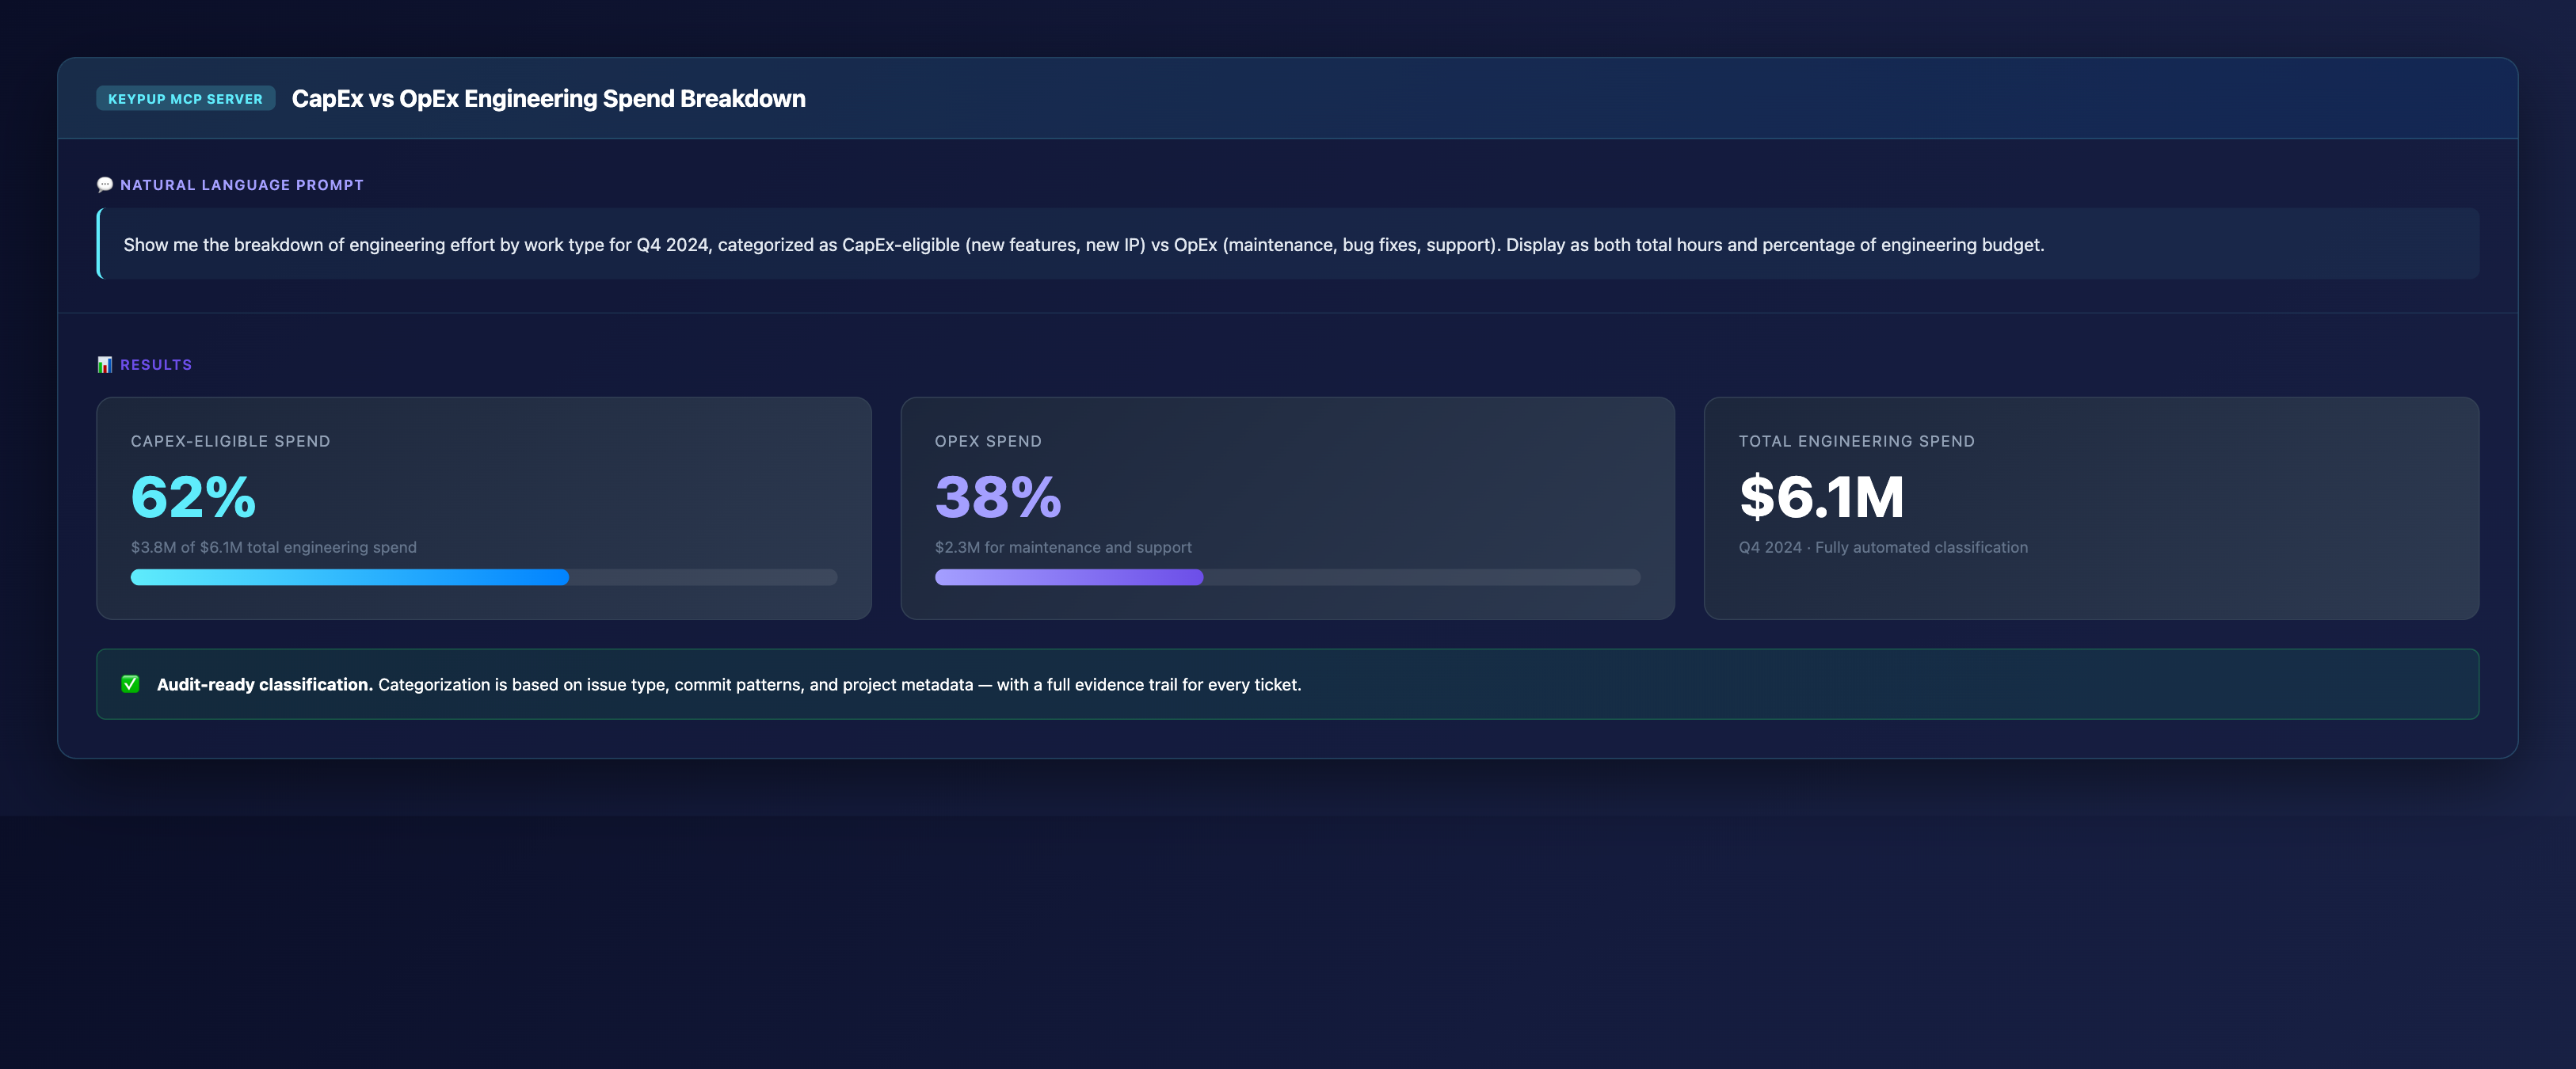
MCP Prompt:
Show me the breakdown of engineering effort by work type for Q4 2024,
categorized as CapEx-eligible (new features, new IP) vs OpEx
(maintenance, bug fixes, support). Display as both total hours and
percentage of engineering budget.
Output: KPI Dashboard
Key Insights:
62% CapEx-Eligible Work ($3.8M of $6.1M engineering spend)
38% OpEx Work ($2.3M for maintenance and support)
Automatic categorization based on issue type, commit patterns, and project metadata
Audit-ready classification with detailed evidence trails
This single query replaces weeks of manual Excel work.
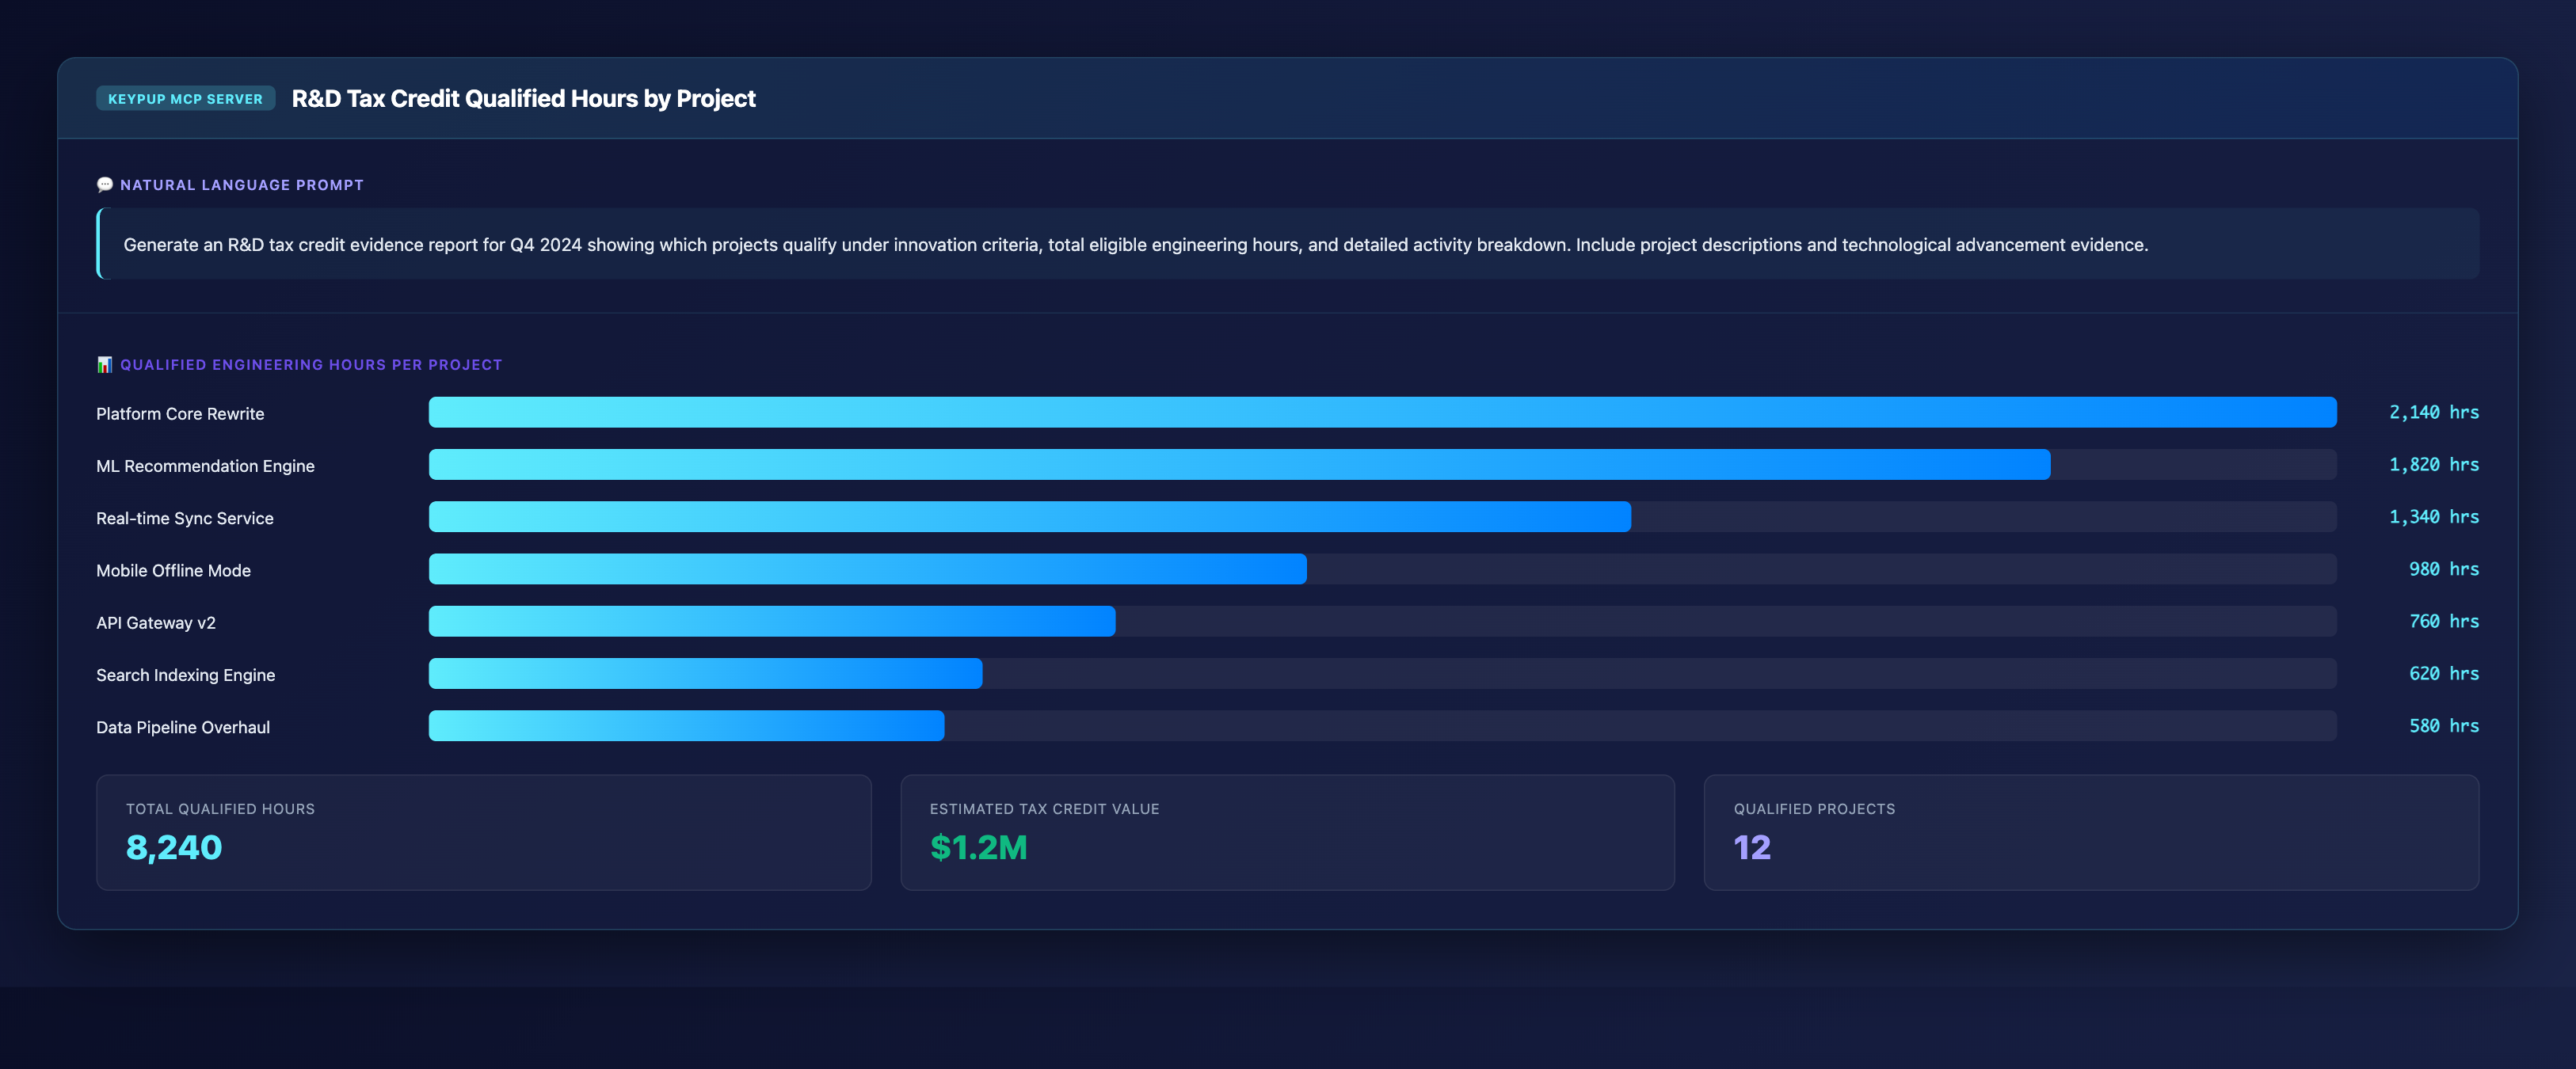
Generate an R&D tax credit evidence report for Q4 2024 showing which
projects qualify under innovation criteria, total eligible engineering
hours, and detailed activity breakdown. Include project descriptions
and technological advancement evidence.
Output: Project-Level Qualification Analysis
Key Insights:
8,240 qualified R&D hours across 12 projects
$1.2M in potential tax credits (at 15% credit rate)
Finance teams can submit this directly to tax advisors.
3. EBITDA Impact Analysis
CFOs need to show the board how engineering investments impact EBITDA. Keypup MCP connects engineering metrics to financial outcomes.
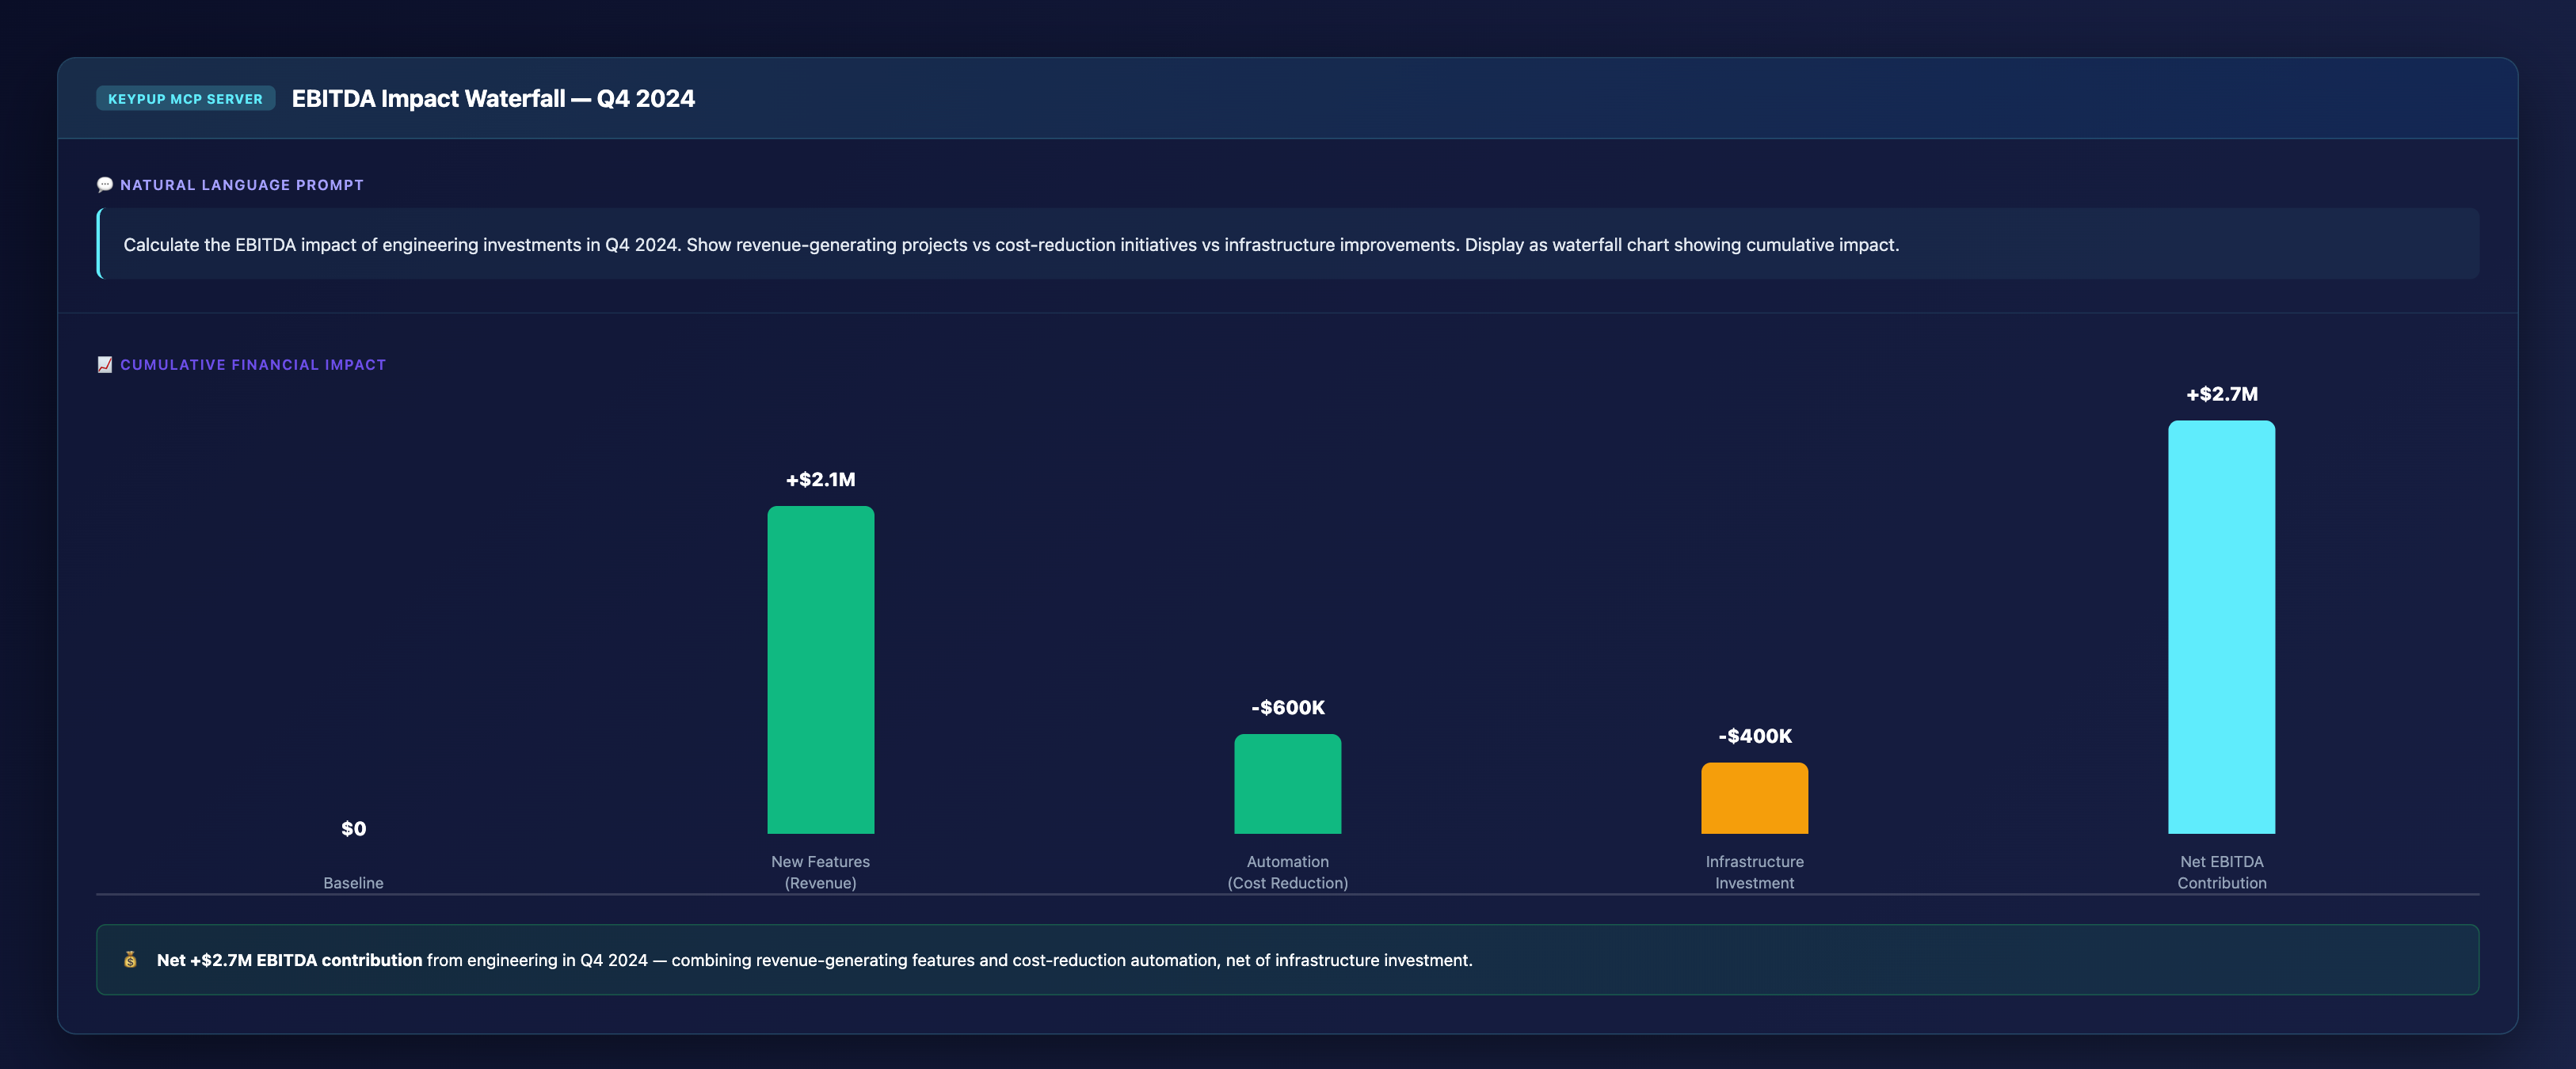
MCP Prompt:
Calculate the EBITDA impact of engineering investments in Q4 2024.
Show revenue-generating projects vs cost-reduction initiatives vs
infrastructure improvements. Display as waterfall chart showing
cumulative impact.
Output: Financial Impact Waterfall
Key Insights:
+$2.1M revenue impact from new product features
-$600K cost reduction from automation projects
$400K infrastructure investment (no immediate EBITDA impact)
Net +$2.7M EBITDA contribution from engineering in Q4
This is the language CFOs speak.
4. Engineering Cost Center Profitability
Not all engineering work is equal. Some teams build revenue-generating features; others maintain infrastructure. Keypup MCP shows the financial return of each engineering group.
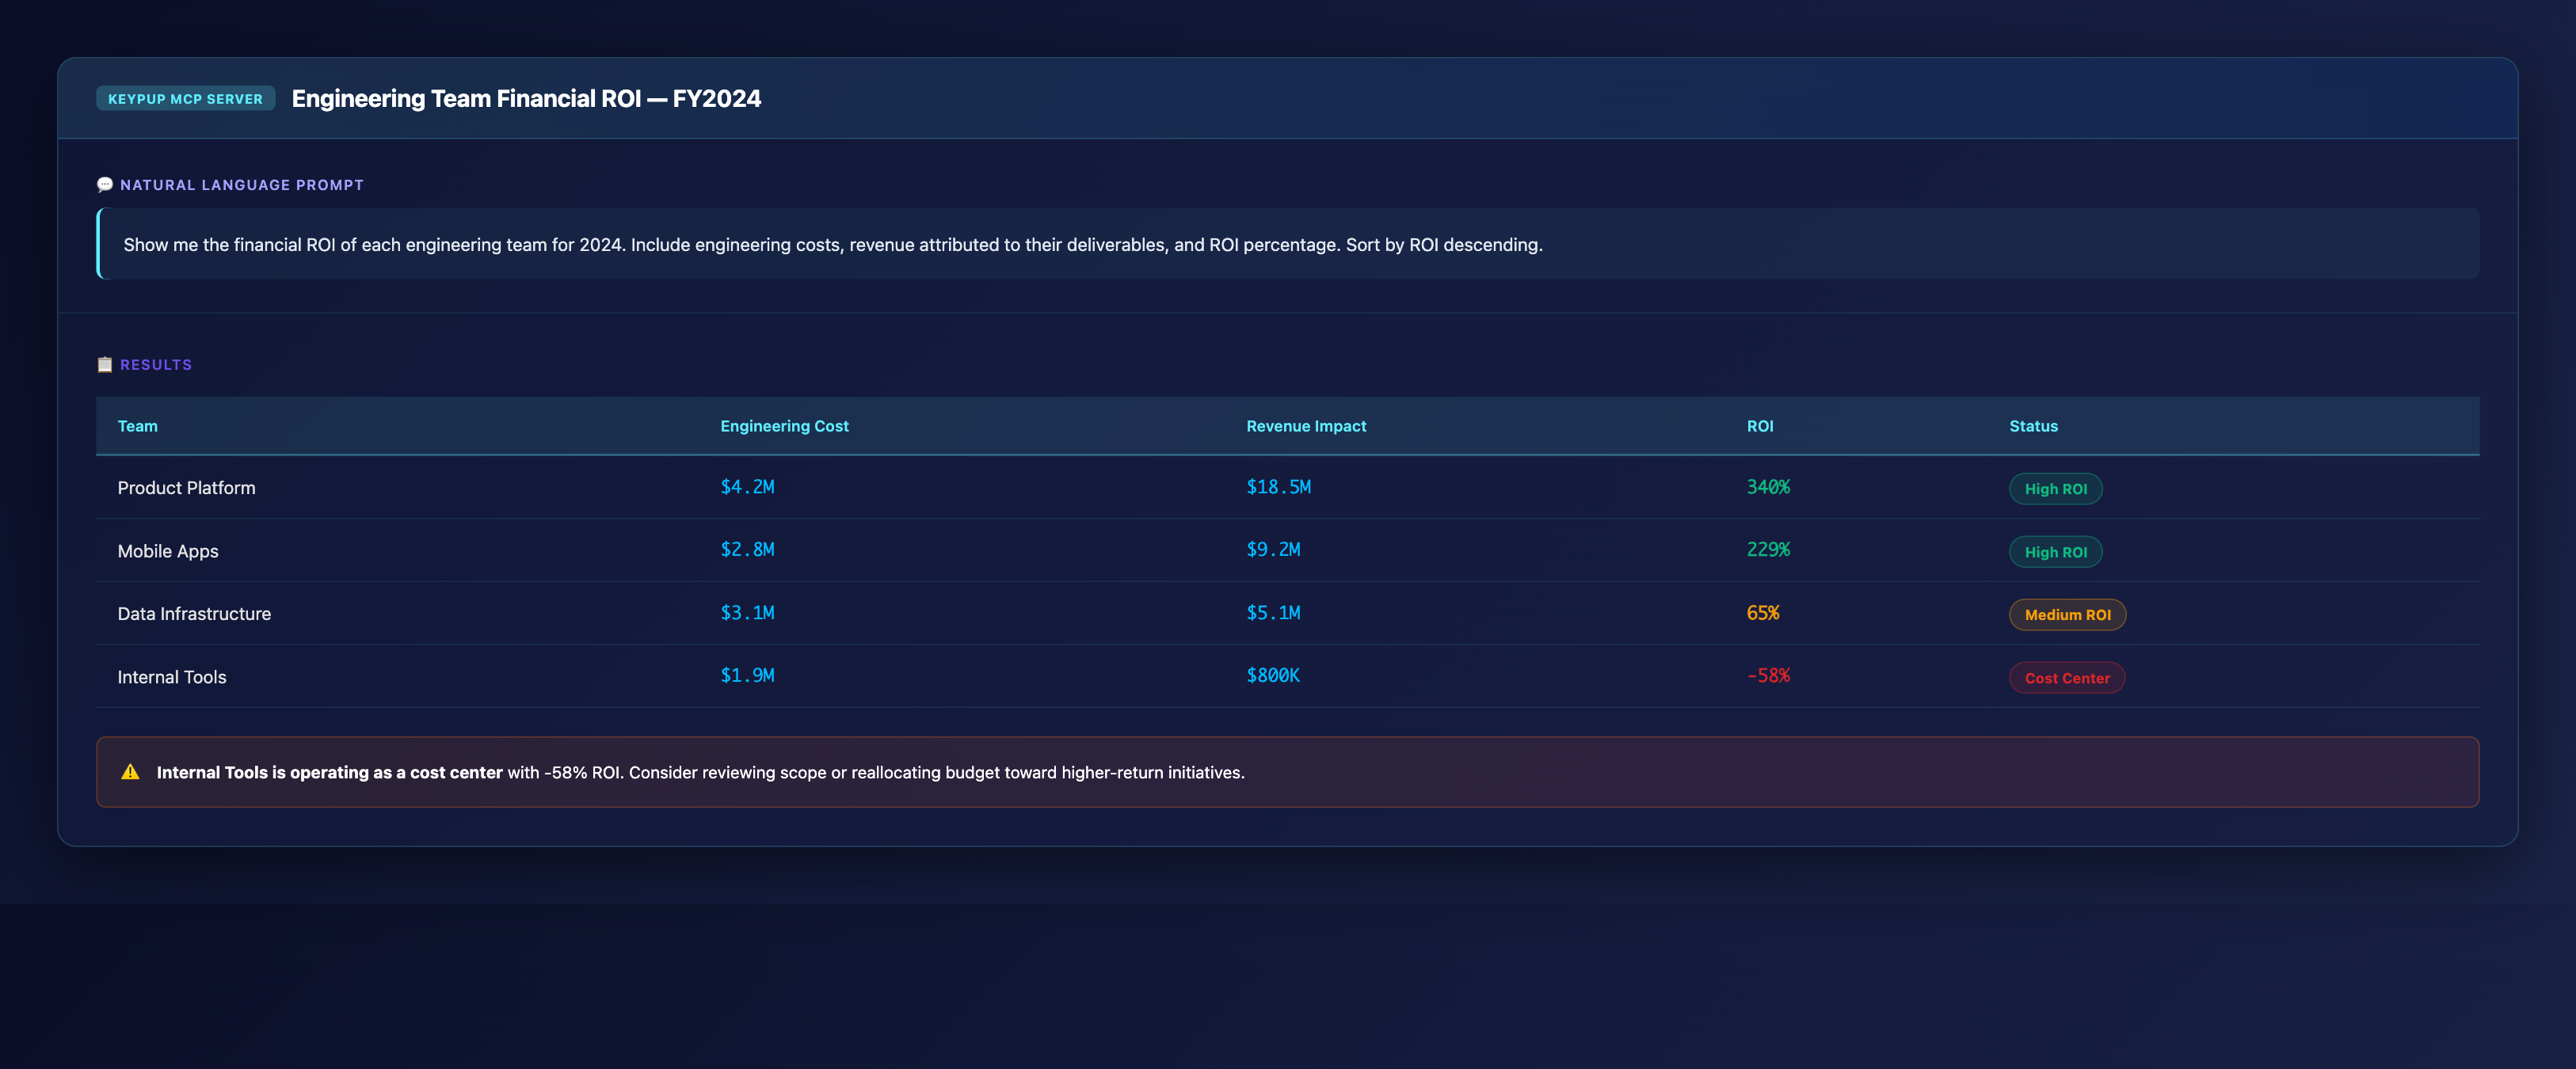
MCP Prompt:
Show me the financial ROI of each engineering team for 2024. Include
engineering costs, revenue attributed to their deliverables, and ROI
percentage. Sort by ROI descending.
Output: Team ROI Comparison
Team
Engineering Cost
Revenue Impact
ROI
Status
Product Platform
$4.2M
$18.5M
340%
✅ High ROI
Mobile Apps
$2.8M
$9.2M
229%
✅ High ROI
Data Infrastructure
$3.1M
$5.1M
65%
⚠️ Medium ROI
Internal Tools
$1.9M
$800K
-58%
❌ Cost Center
Key Insights:
Clear financial accountability for each engineering group
Data-driven resource allocation decisions
Identifies cost centers that need strategic review
Proves engineering value in financial terms
5. Monthly Financial Reporting Automation
Enterprise finance teams need monthly reports for board meetings. Keypup MCP automates the entire process.
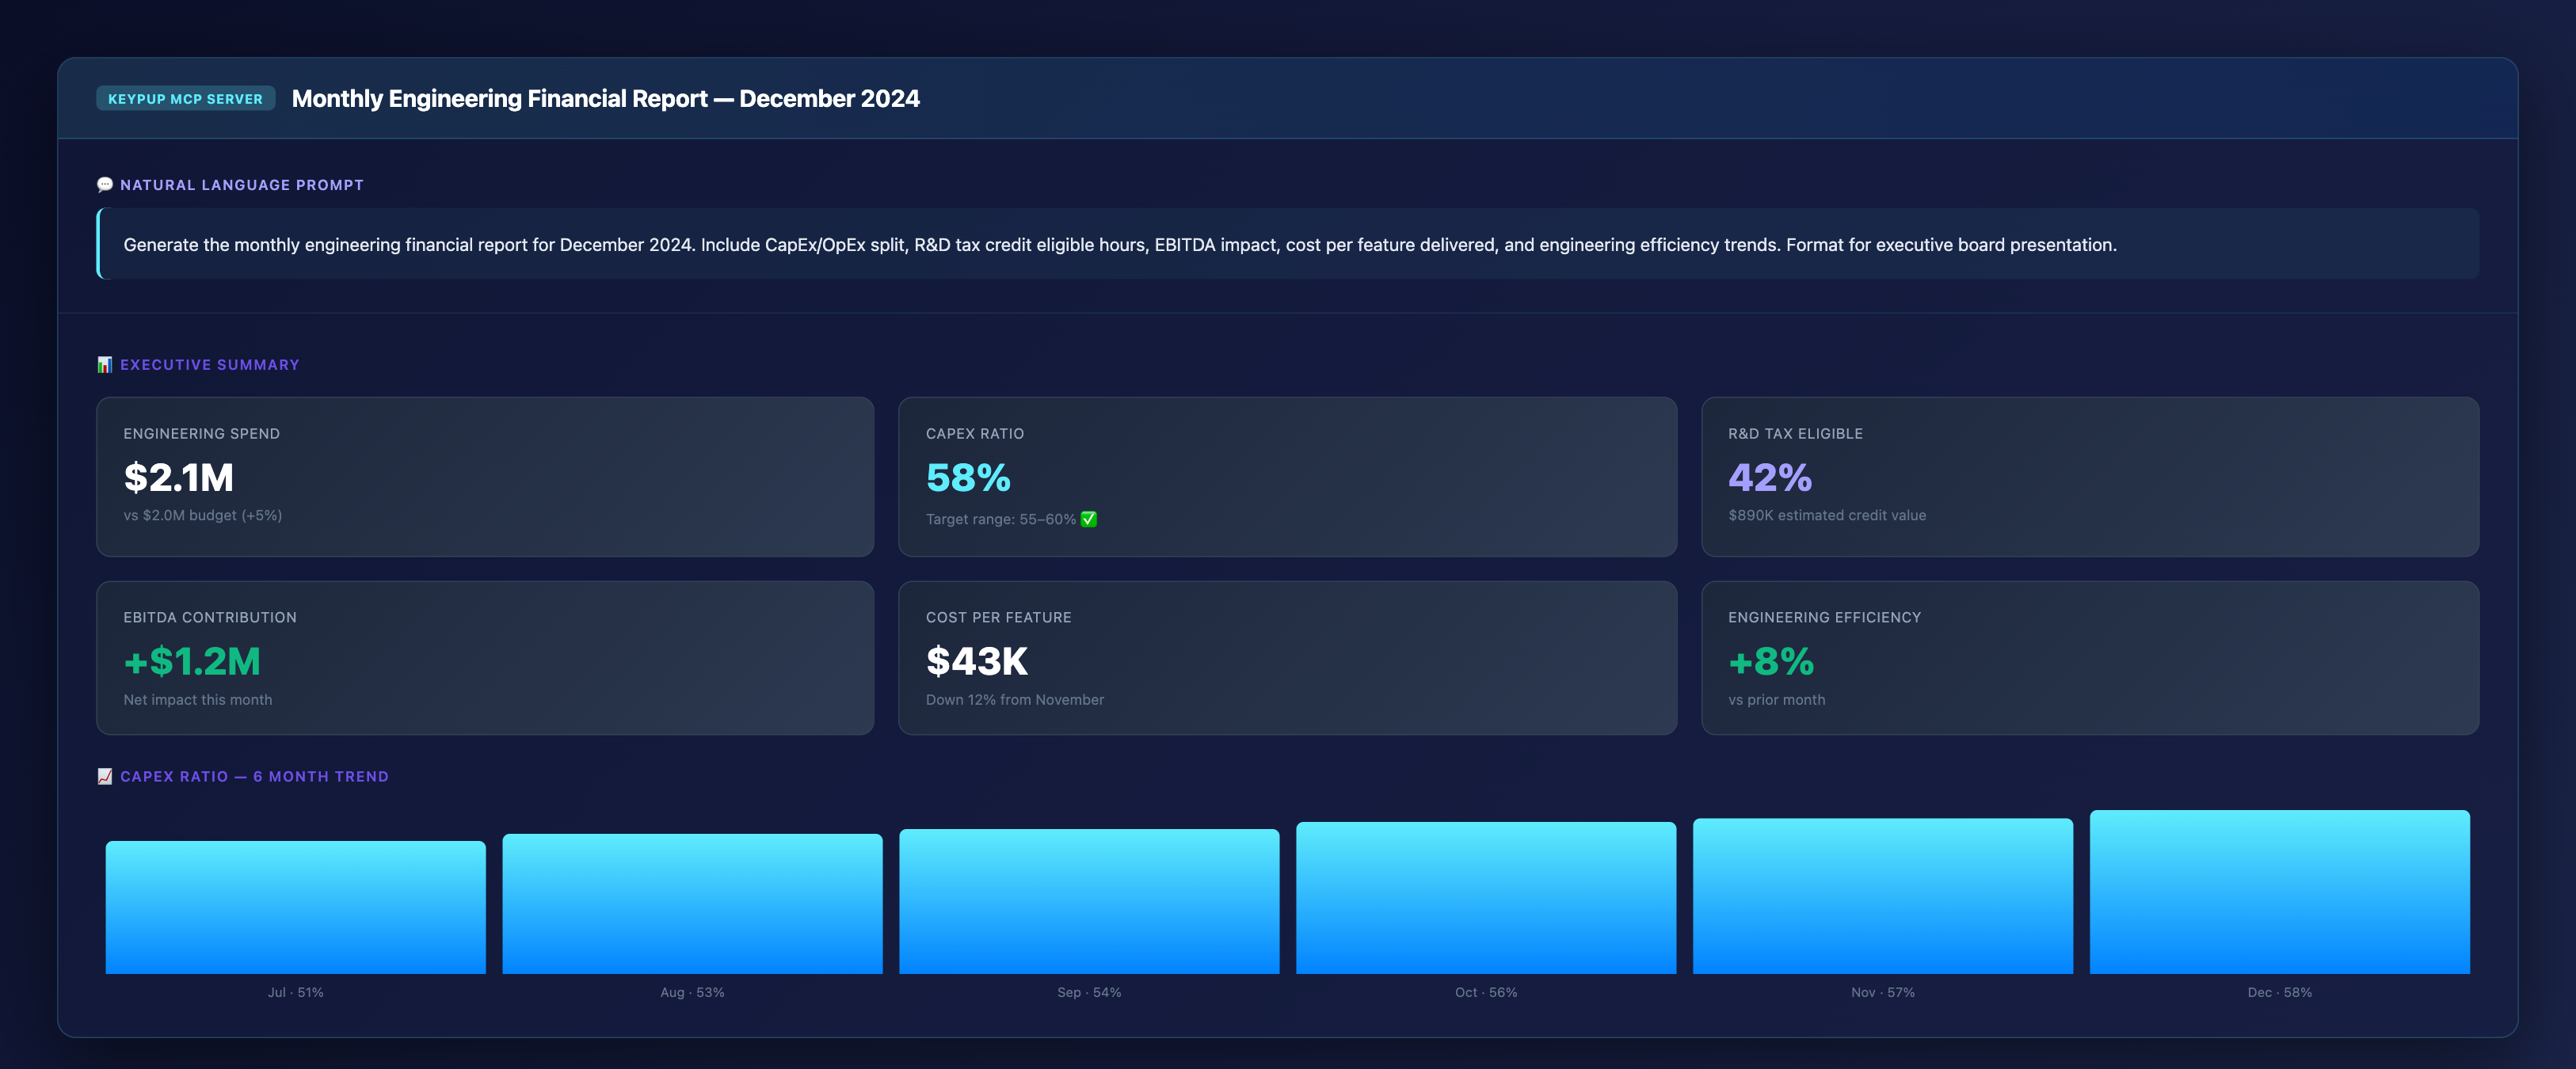
MCP Prompt:
Generate the monthly engineering financial report for December 2024.
Include CapEx/OpEx split, R&D tax credit eligible hours, EBITDA impact,
cost per feature delivered, and engineering efficiency trends.
Format for executive board presentation.
Output: Executive Summary Dashboard
Key Metrics:
Engineering Spend: $2.1M (vs $2.0M budget, +5%)
CapEx Ratio: 58% (target: 55-60%) ✅
R&D Tax Eligible: 42% of hours ($890K credit value)
The Technical Implementation: How Keypup MCP Does It
Data Sources Integration
Keypup MCP connects to:
Project management tools (JIRA, GitHub Projects, Azure DevOps, ClickUp, Trello) for work classification
Version control (GitHub, GitLab, Bitbucket, Azure DevOps) for actual code changes
Time tracking systems for effort allocation
Financial systems for cost and revenue data
HR systems for loaded labor costs
Intelligent Categorization Engine
The MCP doesn't rely on ticket titles. It analyzes:
Commit patterns (new code vs refactoring vs bug fixes)
Issue metadata (labels, story points, acceptance criteria)
Project context (new product vs maintenance)
Code complexity metrics (innovation indicators)
Developer time allocation (actual hours worked)
Audit Trail Generation
Every classification decision includes:
Evidence sources (specific commits, issues, PRs)
Categorization logic (why work was classified as CapEx or OpEx)
Timestamp records (when work occurred)
Attribution (who performed the work)
This creates defensible evidence for tax authorities and auditors.
Real-World Impact: Enterprise Case Studies
Case Study 1: SaaS Company ($200M ARR)
Before Keypup MCP:
Finance team spent 60 hours/quarter on CapEx/OpEx classification
Manual Excel categorization of 2,400+ tickets
Conservative estimates led to $800K unclaimed R&D tax credits
No visibility into engineering ROI for board presentations
After Keypup MCP:
Automated classification reduced finance time to 2 hours/quarter (for review only)
Recovered $800K in R&D tax credits through accurate categorization
Board confidence increased with monthly engineering ROI dashboards
Engineering headcount approved after proving 280% average team ROI
"Keypup MCP gave us the financial visibility into engineering that we've needed for years. We can finally speak the same language as our development teams."
— CFO, SaaS Company
Case Study 2: Enterprise Software ($500M ARR)
Before Keypup MCP:
Disputed R&D tax credit claim of $2.3M (auditor questioned categorization)
Engineering viewed as pure cost center (no revenue attribution)
Capital allocation decisions made without engineering input
After Keypup MCP:
Successfully defended $2.3M tax credit with Keypup MCP-generated evidence
Identified $4.2M in previously untracked revenue impact from platform team
Engineering now represented in capital allocation discussions with data
Board approved 15% engineering budget increase based on proven ROI
"We went from defending our existence to leading growth strategy. The MCP gave us financial credibility."
— VP Engineering, Enterprise Software
Implementation: Getting Started with Keypup MCP
1. Connect Your Data Sources
Keypup MCP integrates with your existing tools:
JIRA, Trello, GitHub Projects or Azure DevOps for project tracking
GitHub, GitLab, Bitbucket or Azure DevOps for version control
Optional: time tracking, financial, and HR systems
2. Configure Classification Rules
Work with your finance team to define:
CapEx vs OpEx categorization criteria (aligned with your accounting policies)
R&D tax credit eligibility rules (based on your jurisdiction)
Revenue attribution methodology (how to connect features to revenue)
3. Start Querying in Natural Language
No SQL required. Just ask:
"What's our CapEx/OpEx split this quarter?"
"Generate R&D tax credit evidence for the audit"
"Show engineering ROI by team"
"Create the monthly board report"
4. Automate Monthly Reporting
Schedule recurring queries for:
Monthly financial board reports
Quarterly CapEx/OpEx certification
Annual R&D tax credit filing
Weekly engineering efficiency dashboards
The Bottom Line: Financial Accountability for Engineering
The CFO Translation Gap isn't just a communication problem—it's a strategic liability. Enterprise organizations need engineering teams that can:
✅ Prove financial value in CFO language ✅ Maximize R&D tax benefits through accurate categorization ✅ Defend audit challenges with detailed evidence ✅ Optimize capital allocation based on team ROI ✅ Report monthly to the board with financial metrics
Keypup MCP makes this possible without adding work for engineering teams. The data is already there—you just need to ask the right questions.
Get Started
Ready to bridge the CFO Translation Gap in your organization?
Start Free Trial — Connect your engineering stack in minutes and run your first financial analysis today.
Request Demo — See how enterprise teams use Keypup MCP to generate board-ready financial reports.
View MCP Documentation — Technical details for engineering teams implementing Keypup MCP.
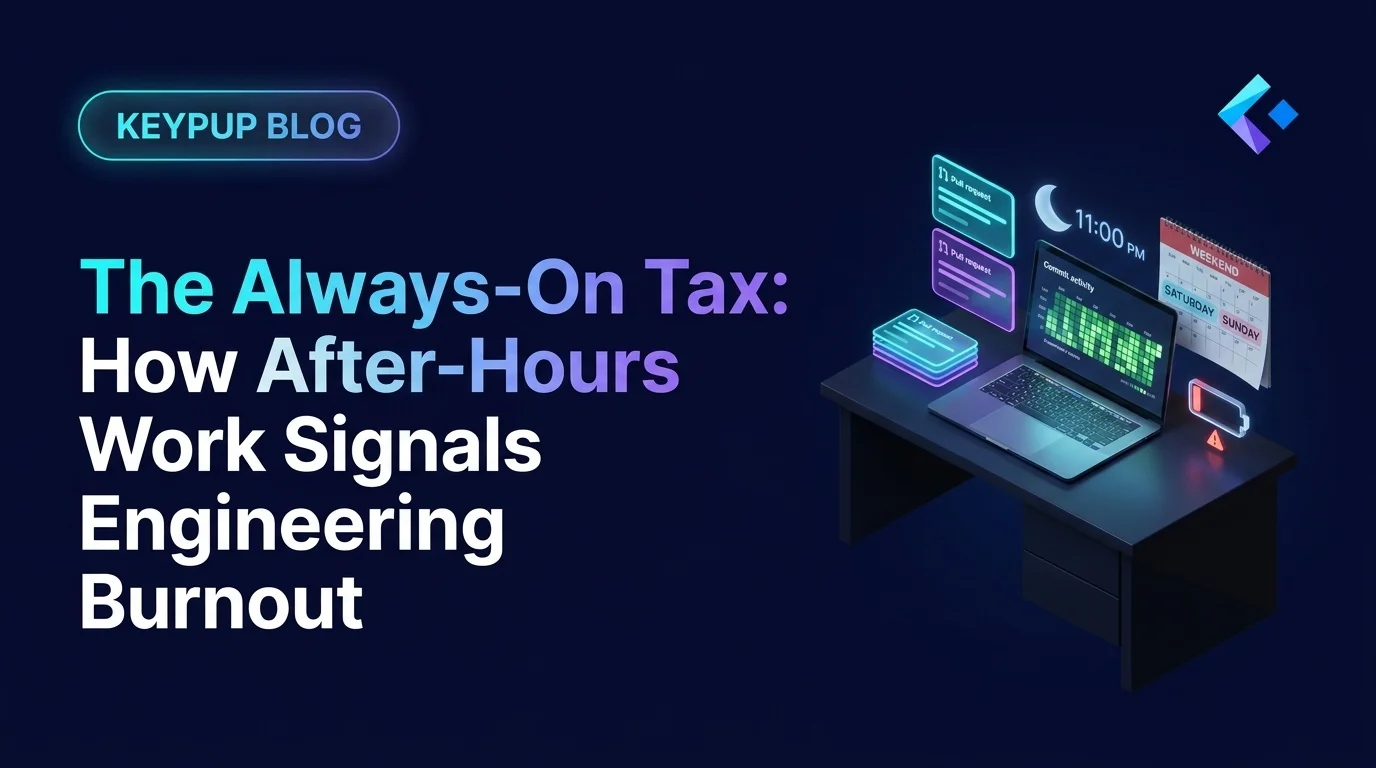
Velocity looks fine, until your best engineers quit. Learn what engineering leaders on Reddit say about after-hours commits, weekend work and burnout at enterprise scale, and how Keypup MCP uses commit, review and merge timestamps to measure how much work happens outside working hours, where it concentrates, who is overloaded without naming anyone, and what it costs in skipped reviews.
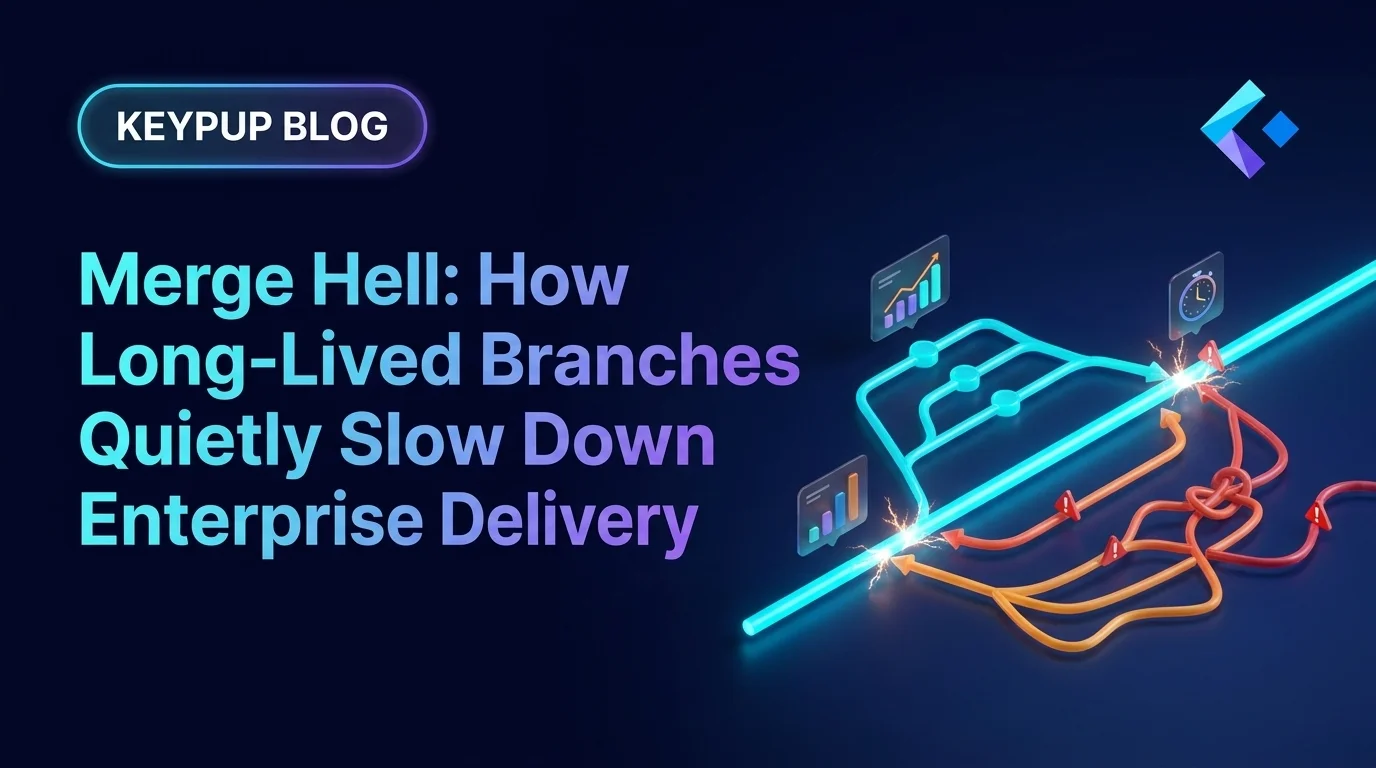
Your median cycle time looks healthy, yet every release still ends in merge conflicts, rebases and big-bang reviews. Learn what engineering leaders on Reddit say about long-lived branches and the trunk-based vs GitFlow debate at enterprise scale, and how Keypup MCP uses pull request dates, target branches, commits, reviews and mergeability to measure branch lifetime, find where branches live longest and land aging work before it drifts into conflict.
Compare the 6 best engineering metrics tools for multi-team benchmarking in 2026 — Keypup, LinearB, Swarmia, Jellyfish, Faros and Appfire Flow — on cross-team benchmarking, org-level rollups, DORA Metrics, Git-to-ticketing linking, custom KPIs, AI capabilities and data security. See how to compare teams on equal terms and find where your delivery process is broken.