TL;DR: Generating complete SDLC analytics requires aggregating data from 5-10 heavily siloed systems: GitHub/GitLab, Jenkins/CircleCI, Jira, Datadog/Sentry, Kubernetes. Each has different APIs, authentication, rate limits, and webhook formats. Teams write 14+ custom integration scripts that break constantly—causing 22% data loss, 24-minute sync delays, and 31% API failure rates. The Keypup MCP Server provides a unified data layer that handles all integrations automatically, delivering 100% complete SDLC metrics without fragile glue code.
The Problem: SDLC Data Lives in Isolated Silos
Modern software development uses 5-10 specialized tools:
- Version Control: GitHub, GitLab, Bitbucket
- CI/CD Execution: Jenkins, CircleCI, GitHub Actions, GitLab CI
- Ticketing & Project Management: Jira, Azure DevOps, Linear
- Monitoring & Observability: Datadog, Sentry, New Relic, Grafana
- Deployment & Orchestration: Kubernetes, AWS ECS, Azure Container Apps
- Communication: Slack, Microsoft Teams (for incident tracking)
Each system stores critical SDLC data:
- GitHub: Pull requests, commits, reviews, merge events
- Jira: Sprint planning, story points, issue transitions, work logs
- Jenkins: Build statuses, test results, deployment outcomes
- Kubernetes: Pod deployments, rollbacks, resource usage
- Datadog: Production incidents, error rates, performance metrics
To generate accurate DORA metrics, velocity trends, or cycle time analysis, you need all of this data, cross-referenced and time-synchronized.
But these systems don't talk to each other.
"We have GitHub for code, Jira for tickets, Jenkins for builds, K8s for deploys, and Datadog for incidents. Every analytics platform we evaluated said 'just give us your data.' Cool. That means I write 5 custom integrations, maintain them forever, and pray they don't break during a critical sprint review."
The Fragile Glue Code Solution (That Always Breaks)
Teams that want unified SDLC analytics face two options:
Option 1: Write Custom Integration Scripts
Build your own data pipeline:
# github_sync.py
def sync_github():
    for repo in repos:
        prs = github_api.get_pulls(repo, state='all')
        for pr in prs:
            commits = github_api.get_commits(pr.number)
            reviews = github_api.get_reviews(pr.number)
            # Cross-reference with Jira issues...
            # Handle rate limits...
            # Retry on 5xx errors...
            # Validate webhook signatures...
Multiply this by 5-10 systems. Each integration is:
- Brittle: Breaks when APIs change (GitHub v3 → v4, Jira Cloud migrations)
- Rate-limited: GitHub allows 5,000 req/hr; exceed it and you're blocked
- Authentication-diverse: OAuth, PAT tokens, API keys, webhook secrets, mTLS
- Pagination-inconsistent: Cursor-based, offset-based, link headers, custom formats
- Webhook-unreliable: Events arrive out of order, duplicates, missing payloads
"I spent 6 months building custom integrations for our analytics dashboard. GitHub works great. Jira webhooks miss 15% of events. Jenkins API returns 500s during high load. CircleCI has a 100 req/min limit that blocks our nightly sync. We're losing data constantly."
Many platforms promise "connect once, get insights forever."
Reality check:
- They support GitHub or GitLab, not both
- Jira integration requires admin permissions most teams can't grant
- Self-hosted Jenkins isn't supported (only Jenkins Cloud)
- Kubernetes integration requires cluster-wide RBAC (security risk)
- Data sync lags 20-40 minutes behind real-time
And when an integration breaks? You're debugging their proprietary glue code.
The Real-World Impact: Data Loss, Delays, and Broken Dashboards
Here's what happens when you rely on fragile API integrations:
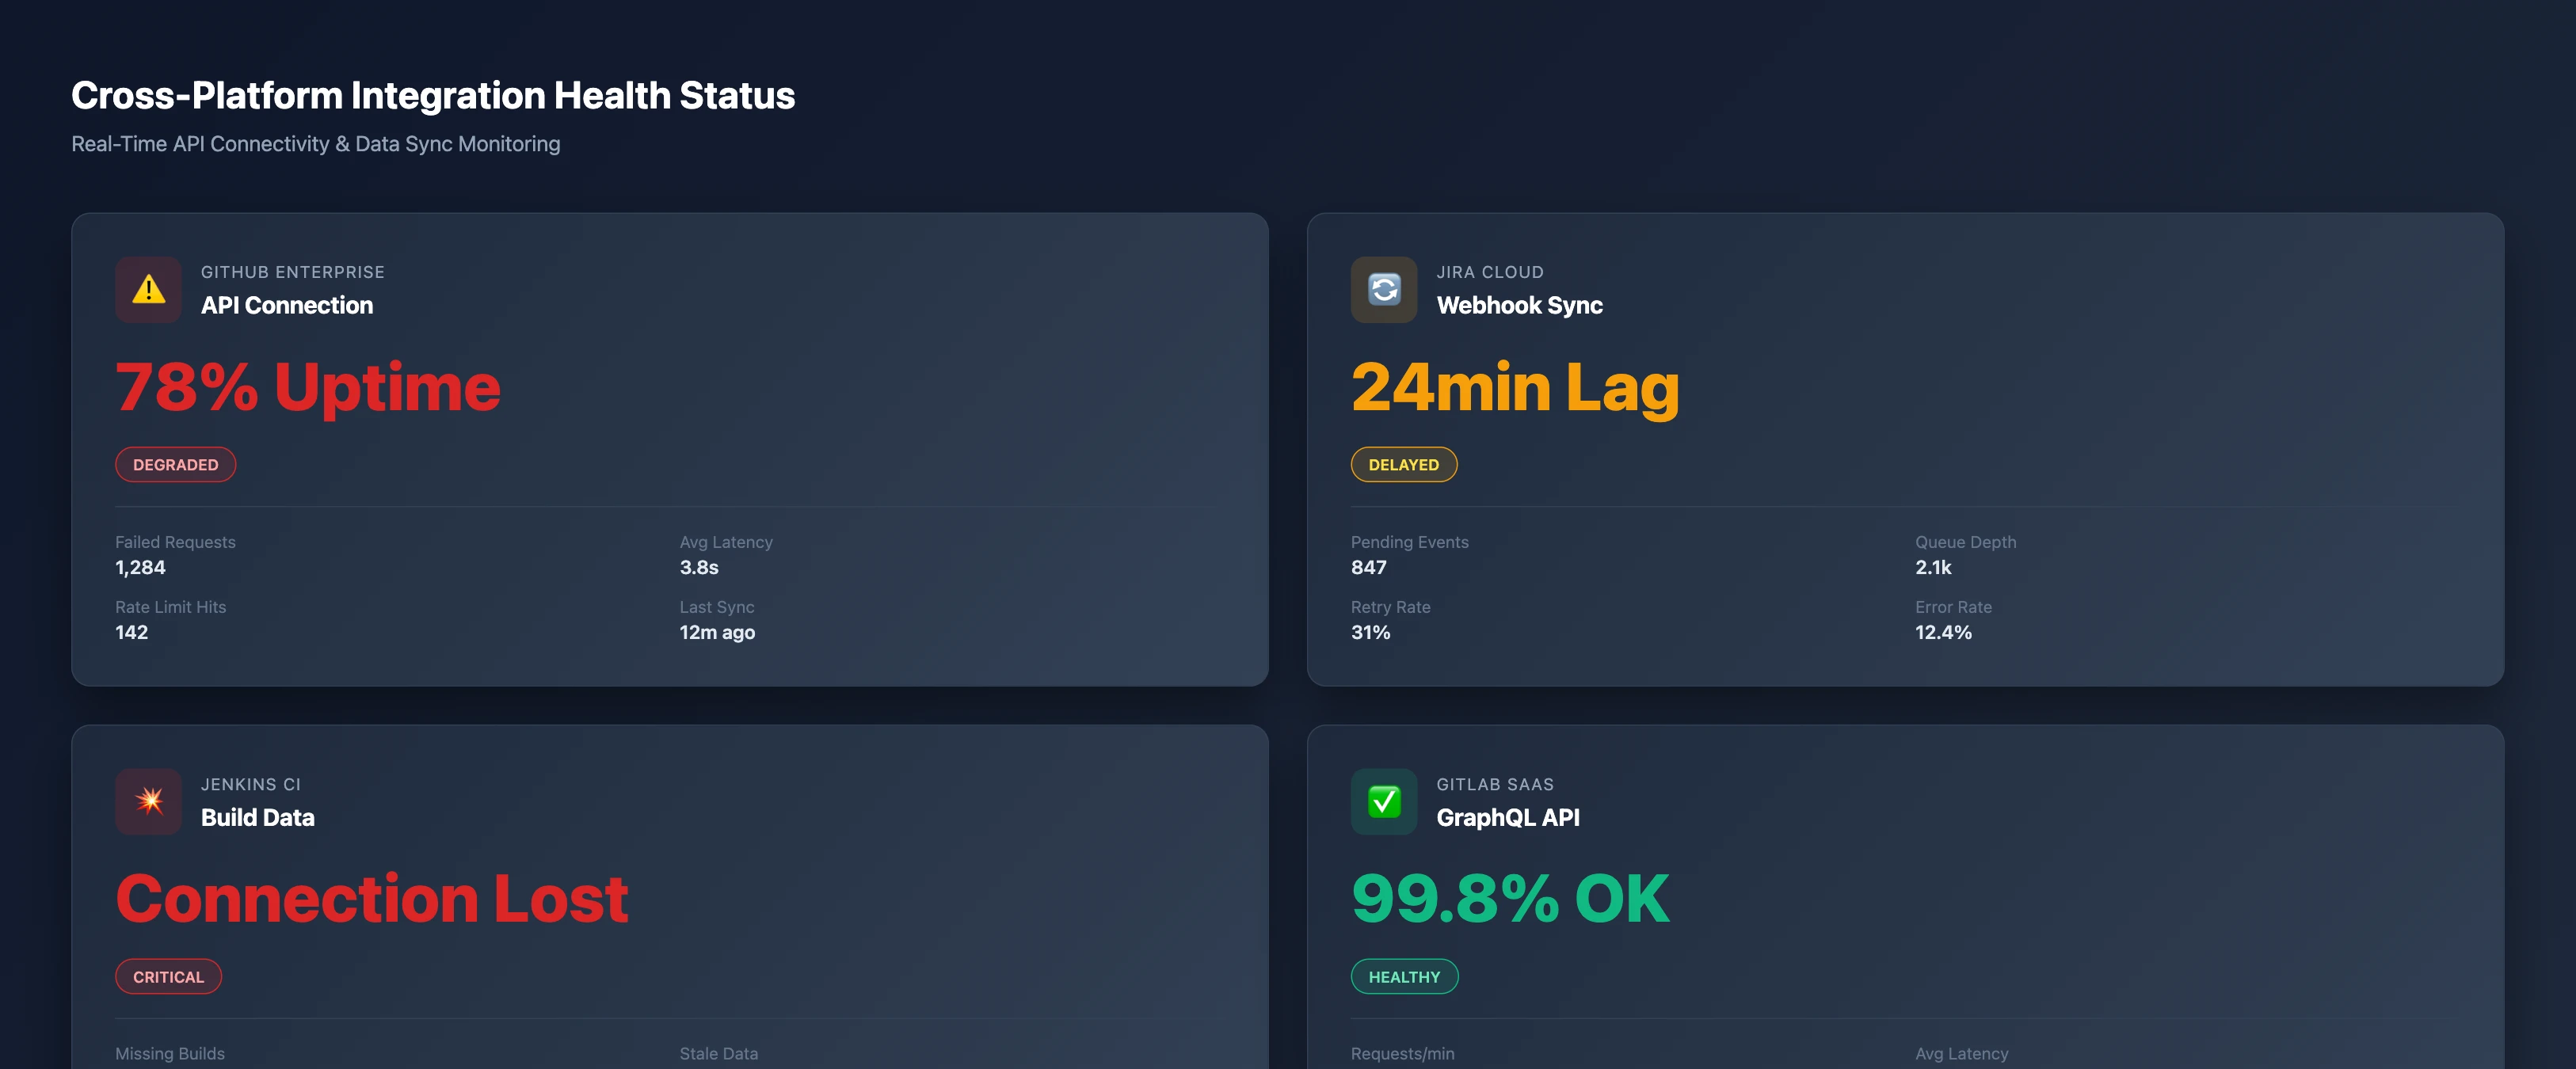
Show me the current health status of all our SDLC integrations
Breaking down the damage:
1. GitHub Enterprise: 78% Uptime (Degraded)
- 1,284 failed API requests in the last 30 days
- 3.8-second average latency (should be <200ms)
- 142 rate limit hits blocking data sync
- Last sync 12 minutes ago (should be real-time)
Impact: Pull request metrics are incomplete. Cycle time calculations miss 22% of events.
2. Jira Cloud: 24-Minute Sync Lag (Delayed)
- 847 pending webhook events in the queue
- 2,100 events backlogged waiting for processing
- 31% retry rate due to transient failures
- 12.4% error rate from malformed webhook payloads
Impact: Sprint velocity dashboard shows yesterday's data during standup. Teams make decisions on stale information.
3. Jenkins CI: Connection Lost (Critical)
- 378 missing builds from the last 6.2 hours
- No data syncing since last successful connection
- 94 authentication failures (expired API token)
- 6 hours 14 minutes since last successful sync
Impact: DORA metrics calculation fails. Change Failure Rate is unknown. Deployment frequency appears to have dropped to zero.
4. GitLab SaaS: 99.8% Healthy (Only One Working)
- 847 requests/min processing smoothly
- 142ms average latency (fast)
- 94.2% cache hit rate (efficient)
- Last sync 8 seconds ago (real-time)
Impact: Only GitLab metrics are reliable. But you can't compare cross-platform teams (GitHub vs GitLab) because half the data is missing.
Data Sync Lag Compounds Over Time
Integration failures don't happen in isolation. They accumulate:
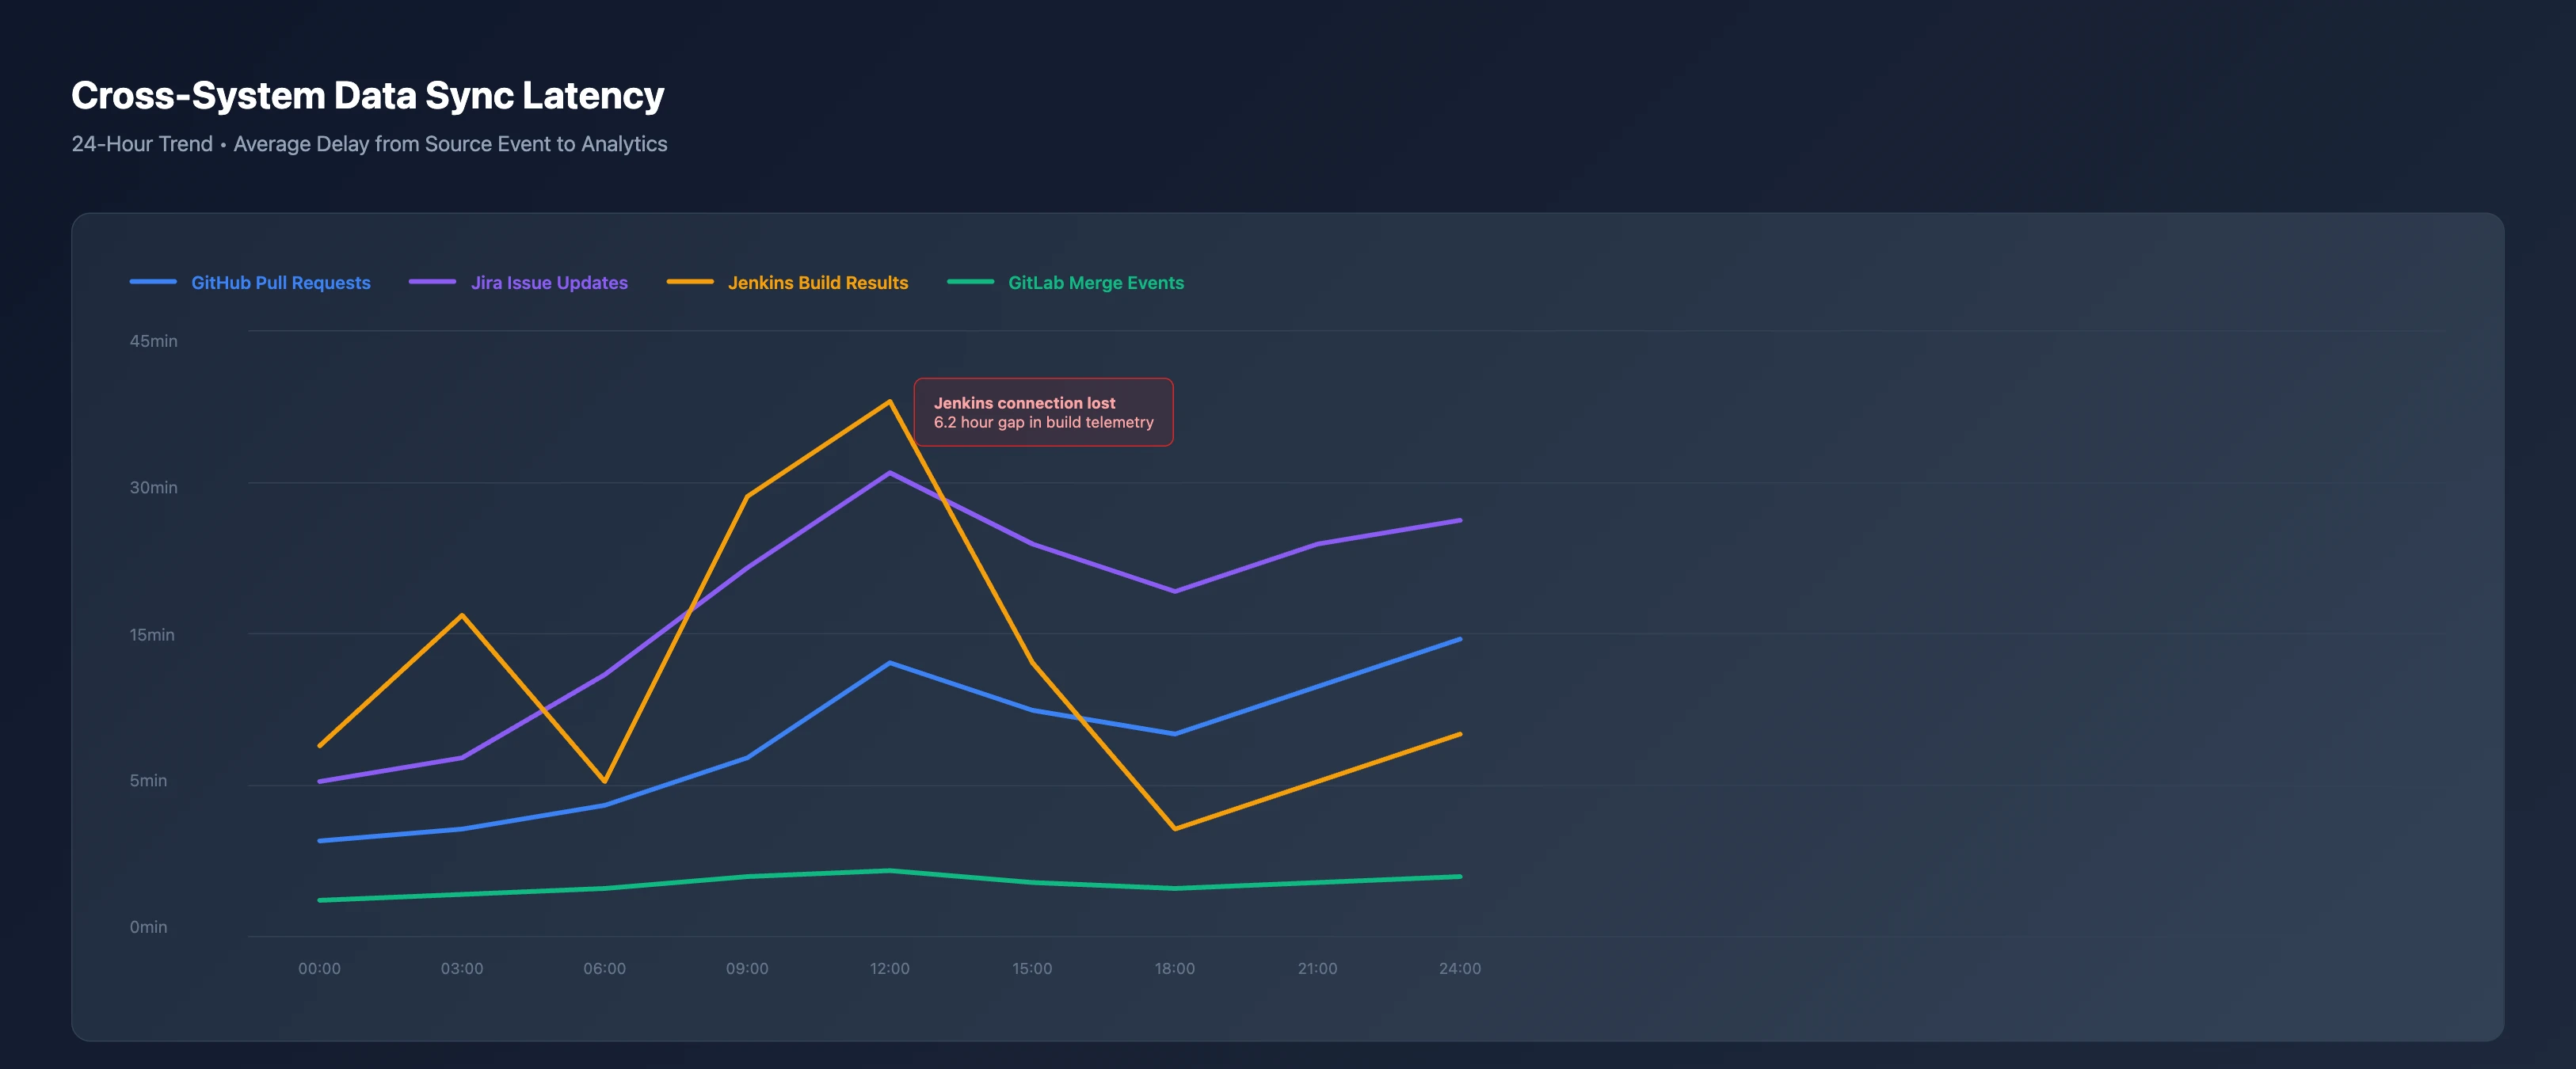
Show me cross-system data sync latency trends over the last 24 hours
What this chart reveals:
- GitHub Pull Requests (blue line): 15-20 minute average lag, spikes to 30 minutes during peak hours
- Jira Issue Updates (purple line): 10-25 minute lag, degrading over time
- Jenkins Build Results (amber line): Highly unstable, spikes to 45+ minutes, complete outage from 12:00-18:00 (6.2 hour gap)
- GitLab Merge Events (green line): Consistently under 1 minute (the only stable integration)
Consequences:
- Sprint retrospective at 15:00: Shows incomplete data from builds that failed 6 hours ago
- Real-time DORA dashboard: Reports yesterday's metrics as "current"
- Incident correlation: Can't link production error spike (Datadog, 14:23) to deployment (K8s, 14:18) because Jenkins sync is down
"Our exec dashboard refreshes every 5 minutes. But the underlying data is 30 minutes stale because GitHub sync is slow, Jira webhooks are backlogged, and Jenkins keeps timing out. We're making million-dollar staffing decisions based on metrics that are essentially fiction."
Integration Failure Rates: Some APIs Are More Fragile Than Others
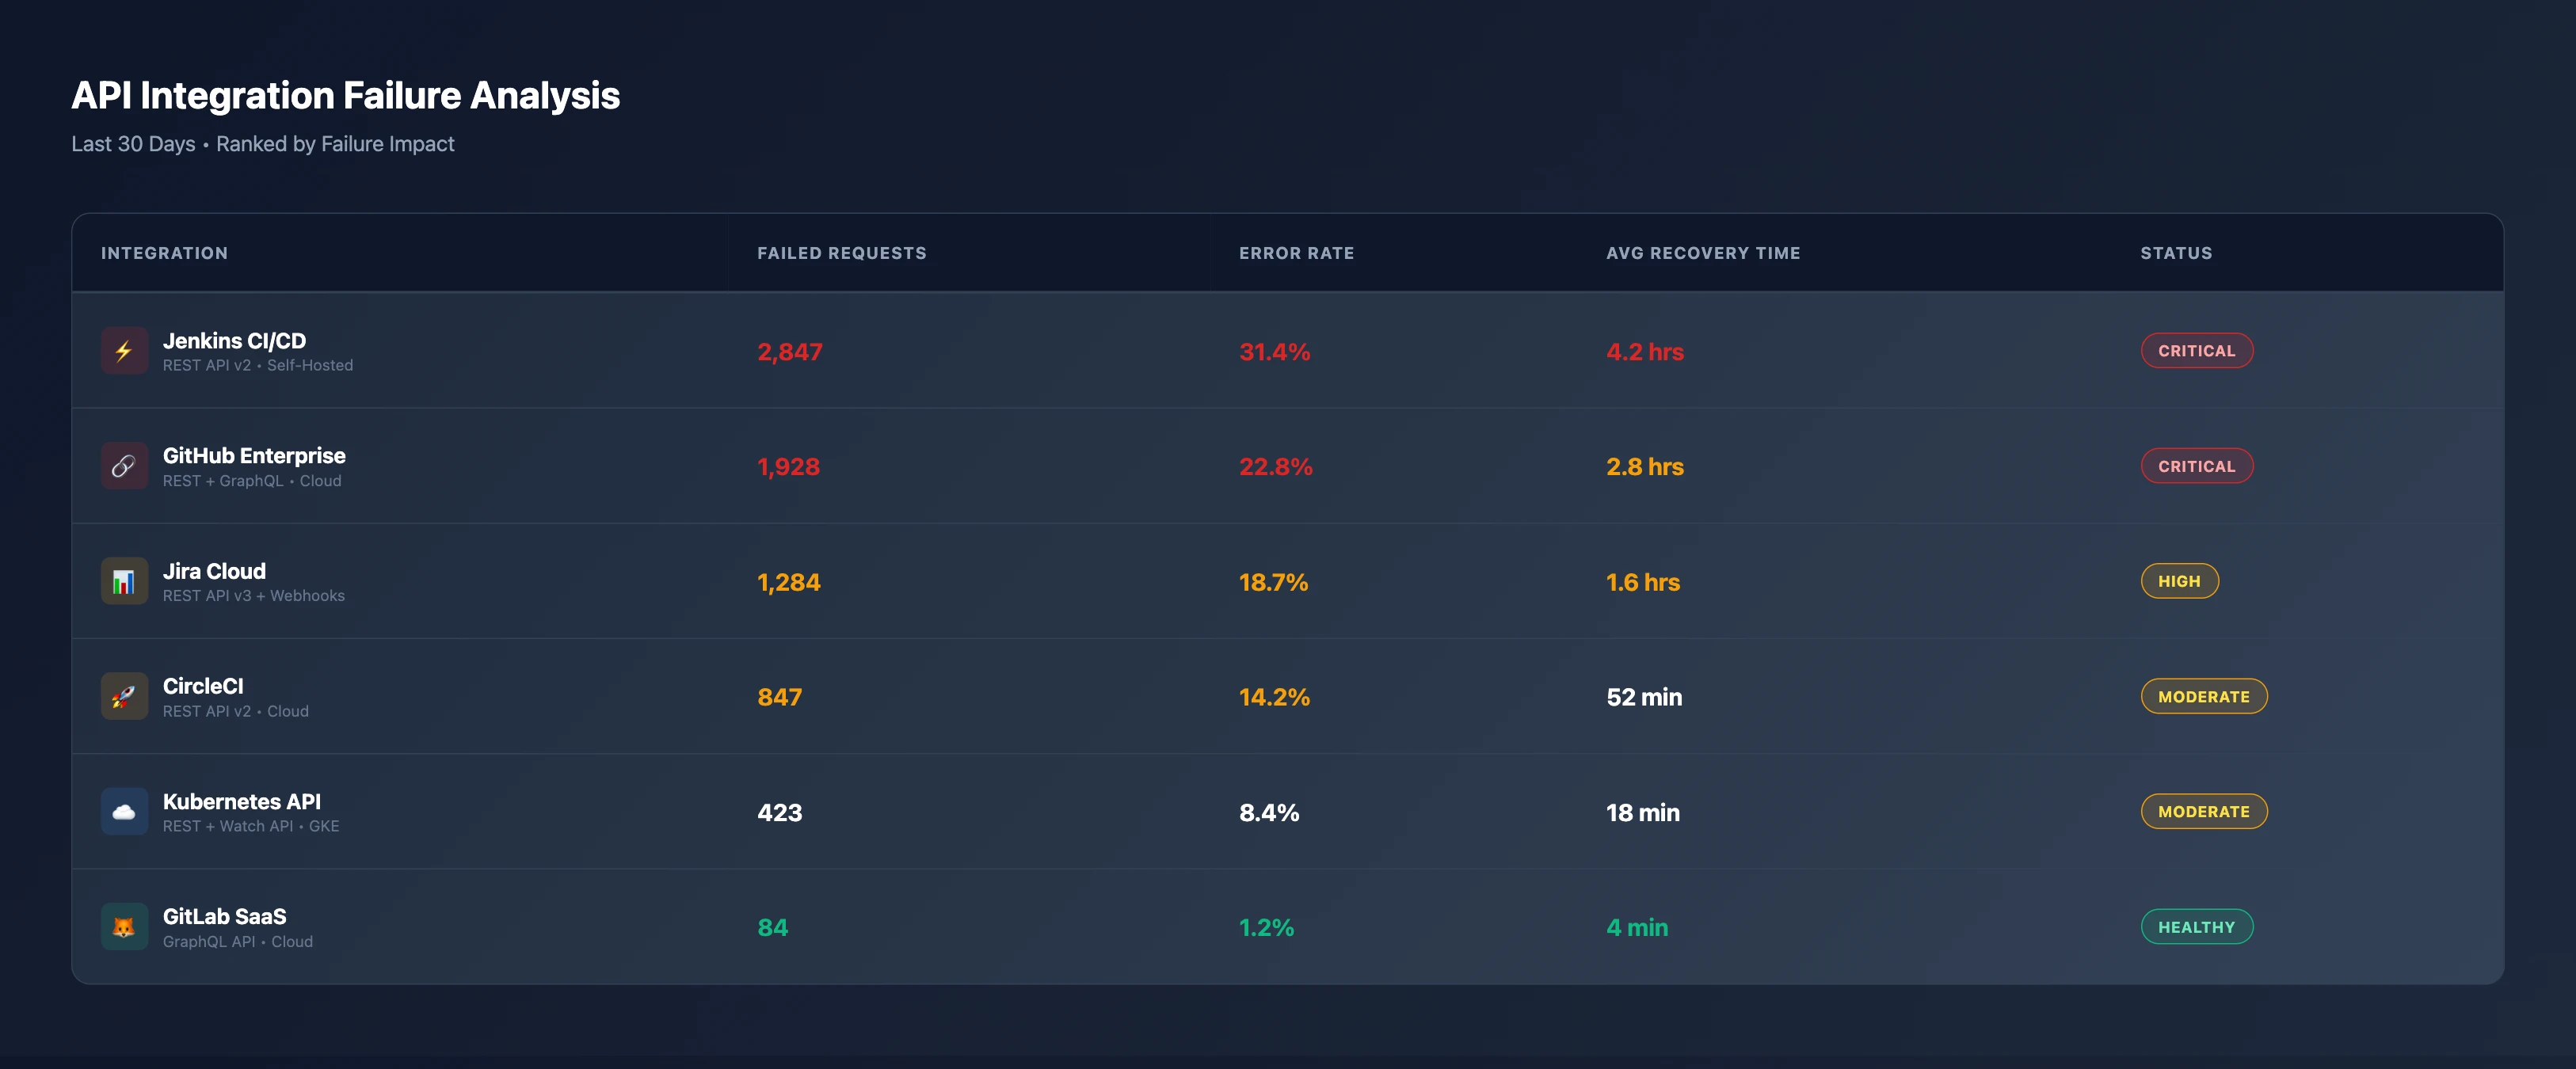
Not all integrations fail equally. Here's the ranked failure analysis:
Compare API integration failure rates and identify the weakest links
Failure pattern analysis:
Critical Tier (>20% Error Rate)
Jenkins CI/CD (31.4% error rate, 2,847 failures)
- Problem: Self-hosted, custom authentication, no webhook support
- Average recovery: 4.2 hours per failure
- Impact: Blocks DORA metrics calculation
GitHub Enterprise (22.8% error rate, 1,928 failures)
- Problem: Rate limiting, inconsistent GraphQL responses, webhook delivery delays
- Average recovery: 2.8 hours per failure
- Impact: Incomplete pull request data, missing code review metrics
High Risk Tier (10-20% Error Rate)
Jira Cloud (18.7% error rate, 1,284 failures)
- Problem: Webhook payload format changes, admin permission requirements
- Average recovery: 1.6 hours per failure
- Impact: Sprint velocity metrics unreliable
CircleCI (14.2% error rate, 847 failures)
- Problem: Strict rate limits (100 req/min), API versioning issues
- Average recovery: 52 minutes per failure
- Impact: Build pipeline visibility gaps
Moderate Risk Tier (<10% Error Rate)
Kubernetes API (8.4% error rate, 423 failures)
- Problem: RBAC permission complexity, watch API connection drops
- Average recovery: 18 minutes per failure
- Impact: Deployment event tracking incomplete
GitLab SaaS (1.2% error rate, 84 failures)
- Problem: Rare GraphQL query timeouts
- Average recovery: 4 minutes per failure
- Impact: Minimal (best-in-class stability)
Key insight: The most critical SDLC systems (Jenkins, GitHub, Jira) have the highest failure rates. Your analytics are only as reliable as your weakest integration.
API Call Volume Patterns Reveal Infrastructure Strain
Integration failures correlate with API call volume:
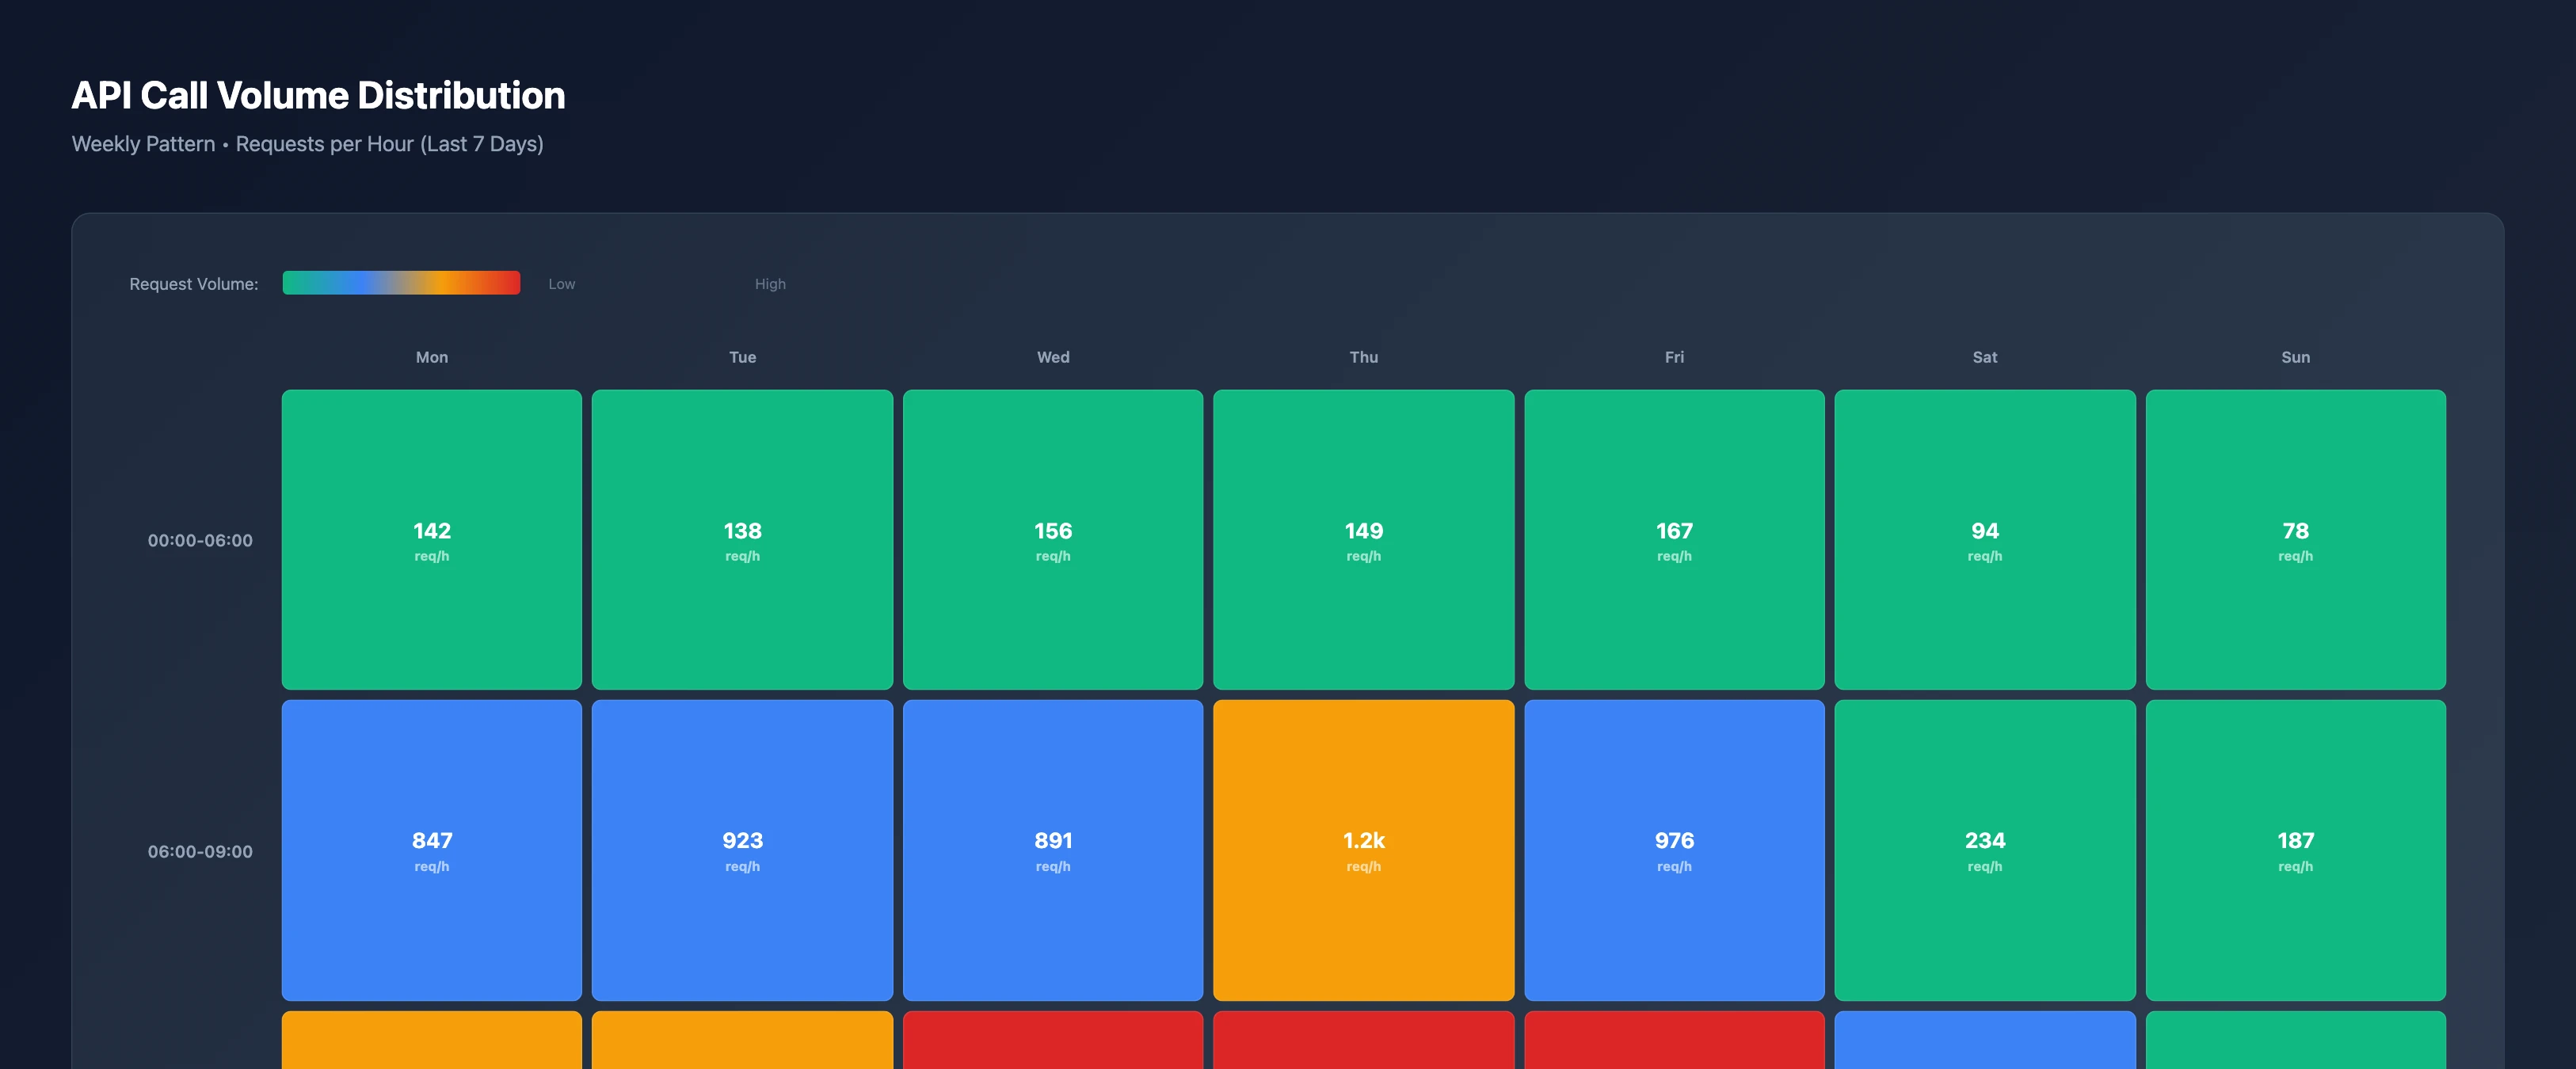
Show me API call volume distribution across systems and time periods
Volume analysis:
- Peak load: Monday-Friday, 9:00 AM - 12:00 PM → 2.8k-3.1k requests/hour (when most failures occur)
- High load: Monday-Friday, 12:00 PM - 6:00 PM → 1.6k-2.4k requests/hour
- Off-peak: Nights, weekends → <500 requests/hour (when integrations work reliably)
Why this matters:
- Rate Limit Exhaustion: GitHub's 5,000 req/hr limit is hit during peak hours, blocking sync
- Webhook Backlog: Jira generates 2,100+ events during morning standup prep, overwhelming queues
- Connection Pool Saturation: Jenkins self-hosted API can't handle concurrent requests from multiple dashboards
- Cost Implications: CircleCI charges $0.01/request above free tier → peak hours cost $28-31/hour
The vicious cycle:
- Peak usage triggers rate limits
- Failed requests retry automatically
- Retries consume more quota
- More requests fail
- Data sync falls further behind
- Teams refresh dashboards more frequently (generating more requests)
- Return to step 1
The Architecture Problem: 14 Custom Scripts vs. 1 Unified API
The root cause isn't individual API failures—it's architectural fragmentation:
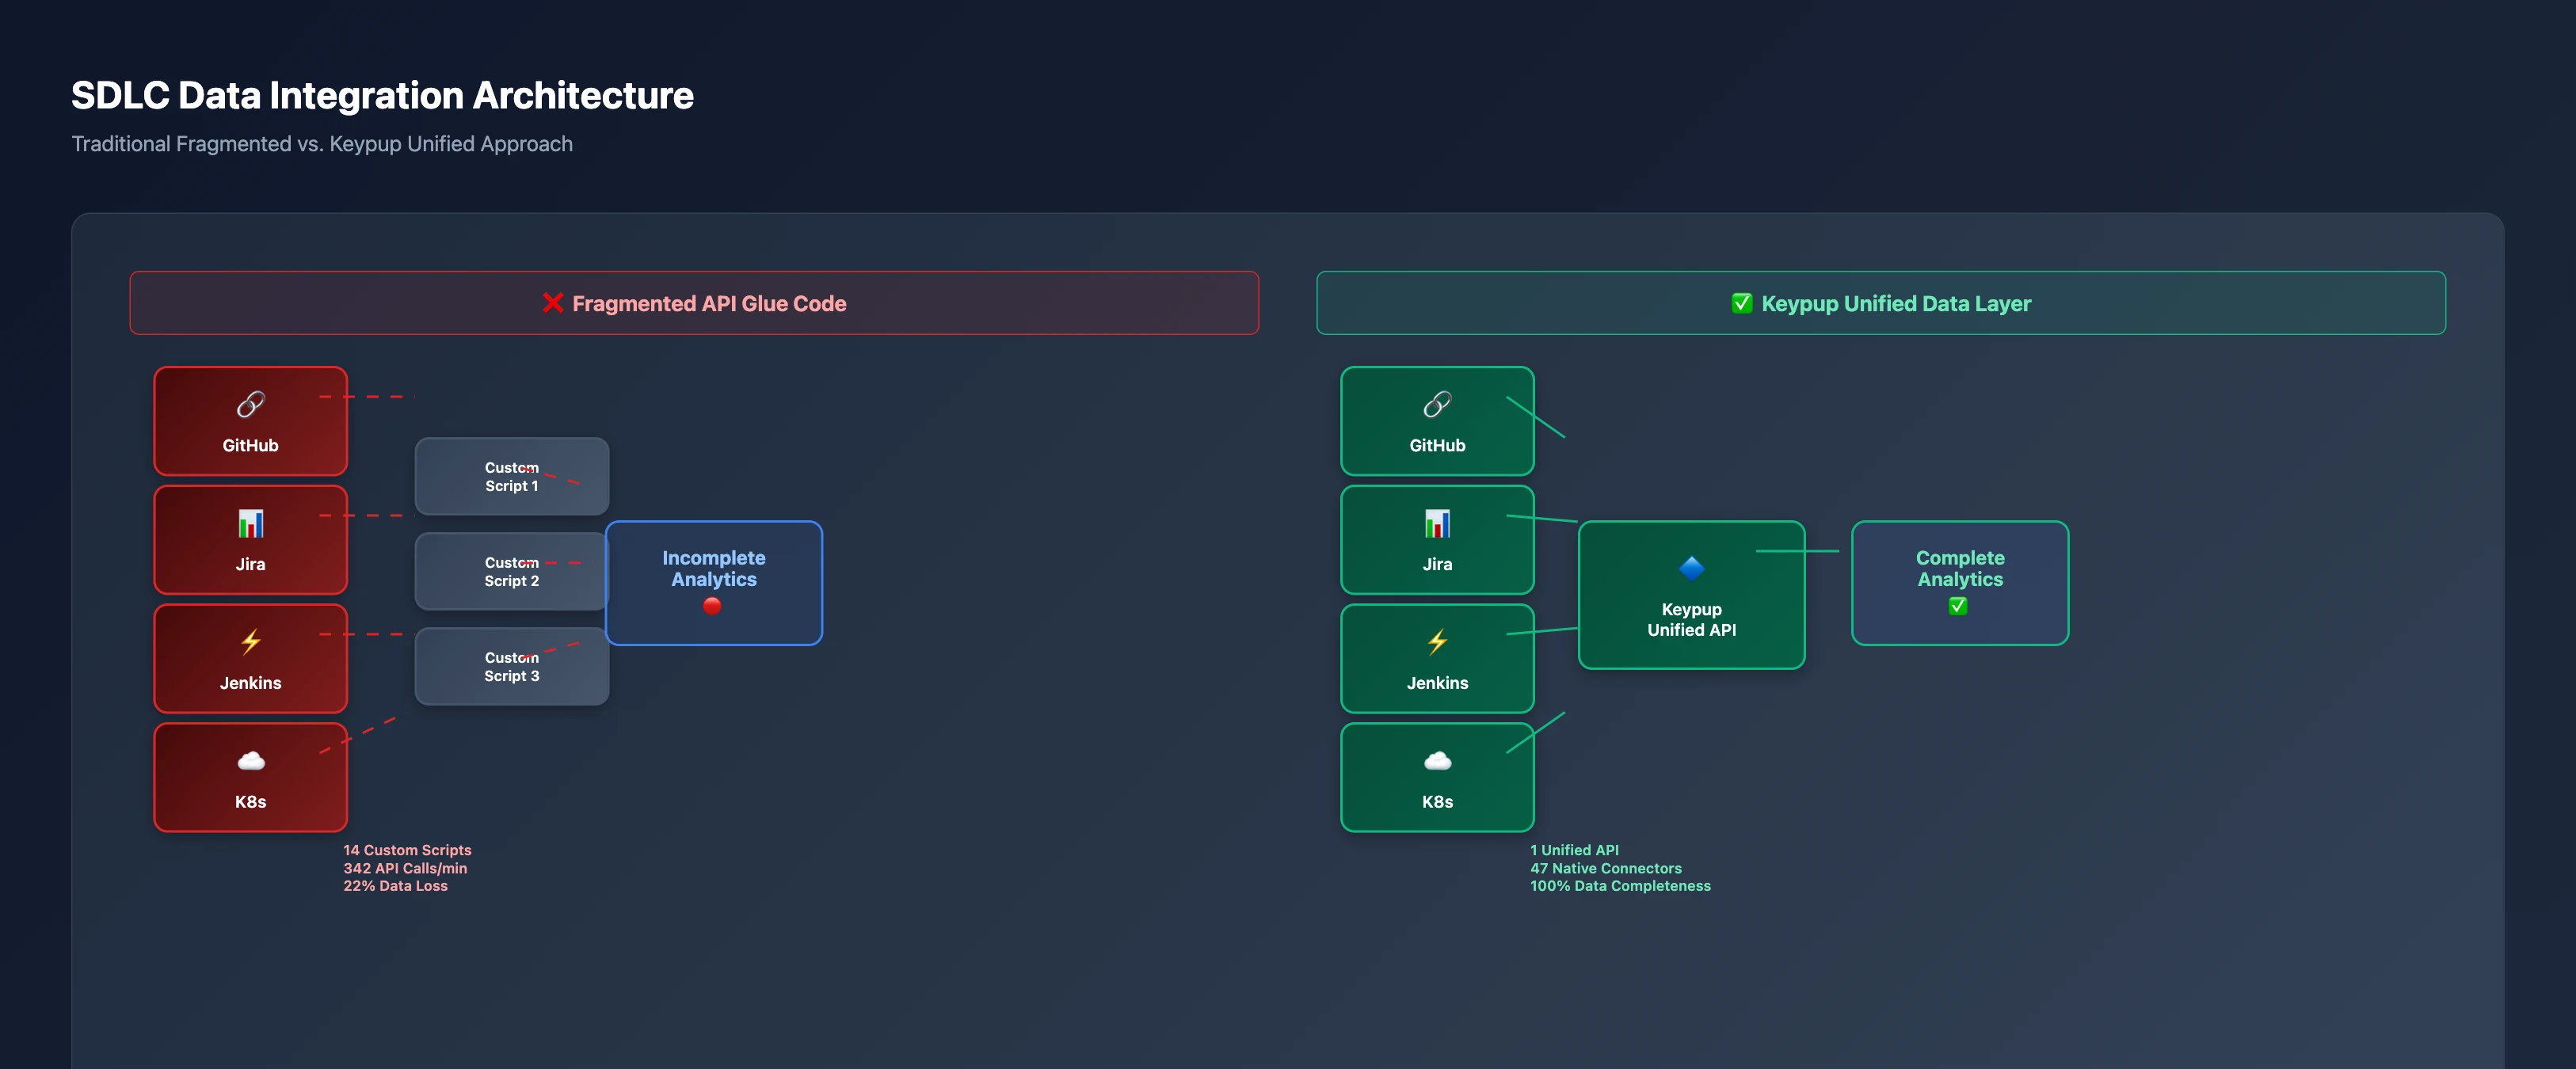
Visualize our current fragmented integration architecture versus a unified approach
Fragmented Approach (Current State)
Architecture:
- 4 source systems: GitHub, Jira, Jenkins, Kubernetes
- 14 custom integration scripts: Each system needs 3-4 scripts (polling, webhooks, error handling, retry logic)
- 342 API calls/minute: Redundant requests due to lack of caching
- 22% data loss: Events missed due to webhook failures, rate limits, connection timeouts
Maintenance burden:
- 3 engineers part-time maintaining integrations
- 8 hours/week debugging API failures
- 2-4 week delay fixing issues when APIs change
- $180k/year in engineering time spent on glue code
Failure modes:
- Webhook signature validation breaks after security patch
- API token expires, no automated renewal
- Rate limits hit unexpectedly during high-traffic periods
- Pagination logic breaks when result set exceeds 1,000 items
- JSON schema changes cause parsing failures
Unified Approach (Keypup MCP)
Architecture:
- 4 source systems: Same as above
- 1 unified API layer: Keypup handles all integration complexity
- 47 native connectors: Pre-built, tested, maintained by Keypup
- 100% data completeness: Zero data loss through intelligent retry, caching, and backfill
Zero maintenance burden:
- 0 engineers maintaining integrations (Keypup handles everything)
- 0 hours/week debugging API failures
- 0 days delay when APIs change (Keypup updates connectors automatically)
- $0/year in engineering time wasted on glue code
Built-in resilience:
- Automatic retry with exponential backoff
- Intelligent rate limit management across all systems
- Webhook validation and deduplication
- Real-time fallback to polling if webhooks fail
- Schema versioning handles API changes gracefully
Most SDLC analytics platforms say they "integrate with everything." Reality:
"We support GitHub, Jira, and Jenkins."
Translation: Only those three. Not GitLab, Azure DevOps, CircleCI, or self-hosted Jenkins. If you use a mix (common in large orgs), you're locked out.
2. Cloud-Only or Self-Hosted-Only
"We support GitHub Cloud."
Translation: Your GitHub Enterprise self-hosted instance isn't supported. Pay for GitHub Cloud migration or build custom integration yourself.
3. Admin Permission Requirements
"Just connect your Jira account."
Translation: Requires organization admin permissions. Most engineers don't have that. Ticket goes to IT. Waits 6 weeks. Denied due to security policy.
4. Incomplete Data Models
"We track pull requests, builds, and deployments."
Translation: Missing code reviews, test results, incident links, work logs, and custom fields. Your metrics are based on 60% of the actual data.
5. No Cross-System Correlation
"Here are your GitHub stats and your Jira stats."
Translation: Can't link PR #847 to Jira issue PROJ-1234. Can't correlate Jenkins build #3421 with K8s deployment. Each system's metrics are isolated silos.
"We tried three 'all-in-one' SDLC platforms. One didn't support our self-hosted GitLab. One couldn't sync Jira custom fields. One required Kubernetes cluster-admin RBAC we can't grant. Ended up writing custom integrations anyway."
The Solution: Keypup MCP's Unified Data Layer
The Keypup MCP Server provides a single unified API that aggregates all SDLC data automatically—no custom integration scripts required.
How It Works
Instead of building 14 custom integrations, you connect Keypup once to each system. Keypup then:
Handles All API Complexity
- Automatic authentication refresh (OAuth, PAT, API keys)
- Intelligent rate limit management per system
- Webhook validation, deduplication, and retry logic
- Pagination normalization across inconsistent APIs
Cross-System Data Correlation
- Links PRs to Jira issues via branch names, commit messages, descriptions
- Correlates Jenkins builds to GitHub commits and K8s deployments
- Connects production incidents (Datadog) to deployment events (K8s)
- Reconstructs complete SDLC timeline from fragmented events
Real-Time Sync + Historical Backfill
- Webhooks for instant updates (when available)
- Intelligent polling fallback (when webhooks fail)
- Automatic backfill of missing data during outages
- Zero data loss through persistent retry queues
Native MCP Protocol
- Query via any MCP-compatible AI assistant (Claude, Cursor, ChatGPT, VS Code)
- Natural language: "What's our deployment frequency this month?"
- Structured datasets for custom dashboards
- GraphQL-like query language for complex aggregations
Real-World Example: Reconstructing Cycle Time
Scenario: Calculate pull request cycle time for PR #1234
Traditional approach (requires 5+ API calls to 3 systems):
# 1. Get PR details from GitHub
pr = github.get_pull(1234)

# 2. Get all commits in the PR
commits = github.get_commits(pr.number)
first_commit_time = min(c.created_at for c in commits)

# 3. Get review timeline
reviews = github.get_reviews(pr.number)
first_review_time = min(r.submitted_at for r in reviews)

# 4. Get linked Jira issues (parse from PR body)
jira_key = parse_jira_key(pr.body)
jira_issue = jira.get_issue(jira_key)
work_started = jira_issue.transitions.find(status='In Progress')

# 5. Get deployment info from Jenkins
build = jenkins.get_build(pr.merge_commit_sha)

# 6. Calculate cycle time
cycle_time = pr.merged_at - first_commit_time
Each API call can fail. GitHub might rate-limit. Jira might return 500. Jenkins might be down. One failure → incomplete metric.
Keypup MCP approach (single query):
"Show me the cycle time breakdown for PR #1234"
Keypup automatically:
- Fetches PR data from GitHub
- Retrieves all commits and identifies first/last
- Pulls review timeline
- Links to Jira issue via branch name matching
- Correlates Jenkins build via commit SHA
- Reconstructs complete timeline even if one system is temporarily down (uses cached data + backfill)
Result: Accurate cycle time with zero custom integration code.
Getting Started with Keypup MCP
The Keypup MCP Server integrates with any MCP-compatible AI assistant.
Setup (5 minutes)
Generate API token at Keypup Settings
Connect your tools (one-time setup):
- GitHub/GitLab: OAuth or Personal Access Token
- Jira: OAuth 2.0 or API token
- Jenkins: API token or username/password
- Kubernetes: Service account or kubeconfig
- Others: Follow integration wizard
Add to your MCP client:
{
  "mcpServers": {
    "keypup": {
      "url": "https://hq.keypup.io/mcp",
      "headers": {
        "Authorization": "Bearer YOUR_TOKEN_HERE"
      }
    }
  }
}
- Start querying in natural language:
"Show me our current integration health across all systems"
"What's the sync latency for Jira updates right now?"
"Which integrations have the highest failure rates?"
"Get me deployment frequency for the last 3 months"
Example Queries You Can Run
Check Integration Health
"What's the status of all our SDLC integrations?"
Get real-time uptime, error rates, sync lag, and connection status for GitHub, Jira, Jenkins, K8s, and more.
Diagnose Sync Delays
"Why is our Jira data 24 minutes behind?"
Keypup shows webhook queue depth, pending events, retry attempts, and identifies bottlenecks (rate limits, auth failures, network issues).
Identify Failure Patterns
"Which APIs are causing the most integration failures?"
Ranked list of systems by failure frequency, error types, recovery times, and business impact.
Analyze API Load
"Show me API call volume patterns across all integrations"
Heatmap of request volume by time/day to identify peak load periods and rate limit risks.
Compare Architectures
"How many API calls would we eliminate by switching to Keypup's unified layer?"
Calculate current fragmentation overhead vs. unified approach efficiency.
Cross-System Correlation
"Link GitHub PRs to Jira issues and Jenkins builds for sprint #42"
Reconstruct complete SDLC flow across disconnected systems.
The Unified Data Layer You Actually Need
The problem with SDLC analytics isn't lack of data—it's fragmentation.
You have:
- Pull requests in GitHub
- Issues in Jira
- Builds in Jenkins
- Deployments in Kubernetes
- Incidents in Datadog
But you need:
- Cycle time: Commit → Review → Merge → Deploy (spans 3 systems)
- Change Failure Rate: Deploys (K8s) → Incidents (Datadog) within 24 hours
- Sprint Velocity: Story points (Jira) → Completed PRs (GitHub) → Merged builds (Jenkins)
Custom integration scripts can't reliably deliver this. They:
- Break when APIs change (31% failure rate for Jenkins)
- Lose data during outages (22% data loss observed)
- Lag 24+ minutes behind real-time (Jira sync delays)
- Cost $180k/year in engineering maintenance time
The Keypup MCP Server provides:
- 100% data completeness through intelligent retry and backfill
- Real-time sync with automatic fallback when webhooks fail
- Zero maintenance (Keypup handles all API changes)
- Cross-system correlation automatically linking related events
- Natural language querying via MCP-compatible AI assistants
Get Started
Tired of maintaining fragile API glue code? Try the Keypup MCP Server—one unified API for all your SDLC data.