The Bug SLA Mirage: Why Priority Fix Targets Are Missed and Nobody Knows
Your bug SLA report says 91%. Your customers experienced 65%. Learn what engineering leaders on Reddit say about P1 fix-time targets, SLA clocks that start late and bugs closed to stop the timer at enterprise scale, and how Keypup MCP measures real SLA attainment by priority and team from Jira workflow history and linked pull requests.
TL;DR: Most enterprise engineering organizations promise fix times by priority: two business days for a Highest bug, five for a High, and so on. Most of them also report hitting those targets more than 90% of the time. The catch is when the clock starts: many SLA reports time a bug from the moment someone starts working on it, not from the moment it was reported. Measured from creation, the same bugs often meet their target only about two times in three, and the gap is widest for the most urgent bugs. That's the bug SLA mirage. The Keypup MCP Server reads each Jira bug's priority, creation and closure dates, full workflow status history, resolution, reopen events and team, plus the state, merge date, review state and build status of the pull requests linked to it. Your AI assistant can then measure SLA attainment from the right starting point, show where the time goes, which teams miss which targets, which "in-SLA" closures weren't real fixes, and which overdue bugs nobody is escalating.
The quarterly business review has a slide called "Quality". It shows bug SLA attainment at 91%, green, unchanged from last quarter. Two slides later, the customer success team shows escalations up 30% and a renewal at risk because "critical issues take weeks to fix". Both slides are built from the same Jira project. Only one of them matches what customers experience.
The Friction: An SLA Clock That Starts When Engineering Is Ready
A bug SLA is a promise made to someone outside engineering: customer support, account managers, a contract. At enterprise scale, the way it is measured drifts away from that promise for structural reasons:
The clock starts late. Many SLA dashboards measure from "In Progress" to "Done", because that's the part engineering controls. The days a bug spends in triage, in the backlog or waiting for a sprint are left out, and for the customer those are most of the wait.
Priorities are set once and rarely revisited. A bug created as Highest on Monday and picked up on Thursday has already missed its two-day target before anyone opens the code.
Closing stops the clock, fixing doesn't. "Won't Do", "Duplicate" and "Cannot Reproduce" all close the ticket within SLA. So does a bug marked Done with no code change, and nothing counts it again when it's reopened a week later.
Breaches stop being visible. Once a bug is past its target, the SLA report has already counted it as missed. There's no second alarm, so the oldest breaches drift further and further.
The result: an organization that reports a green SLA metric and can't say how long a customer actually waited.
Why This Matters: The Real Cost of the SLA Mirage
The Trust Problem
Support and account teams see the real wait from the customer's side. When engineering's number says 91% and theirs says "weeks", they stop trusting engineering's reporting altogether, and every escalation becomes a negotiation.
The Contract Problem
Enterprise contracts and regulated industries often put fix times in writing. If the metric you report doesn't start the clock where the contract does, you find out during a dispute or an audit, not on your dashboard.
The Misdiagnosis Problem
When SLAs are missed, the usual reaction is "engineers need to fix bugs faster". If the time is lost in the queue before anyone picks the bug up, faster fixing changes nothing. The fix is triage, ownership and capacity, and you can only see that if you measure where the time goes.
The Enterprise Discussion: What Engineering Leaders Are Actually Saying
"Our P1 SLA is a joke", "the clock only starts when the ticket hits In Progress" and "support says weeks, our dashboard says days" come up again and again wherever engineering managers, support leaders and SREs compare notes. The quotes below are representative of recurring threads on r/ExperiencedDevs, r/EngineeringManagers, r/sre and r/jira.
"Our bug SLA report has been 90%+ green for two years. Then I found out it measures from In Progress to Done. A P1 can sit in triage for a week and still count as 'fixed in 2 days'. Support has been telling us for months the number was wrong."
Director of Support, Enterprise Software (r/ExperiencedDevs)
"Half the 'resolved within SLA' tickets I looked at were closed as cannot reproduce or duplicate, and a bunch got reopened the next week. The timer stopped. The customer's problem didn't."
Staff SRE, Fintech (r/sre)
"Nobody tracks bugs once they've breached. The dashboard counts them as missed and moves on. We had a High bug sitting open for four months because there was no alert left to fire."
The pattern holds: organizations define bug SLAs by priority, but measure them from a convenient starting point, count closures instead of fixes, and lose track of bugs once they've breached.
How Keypup MCP Measures Real Bug SLA Attainment
The Keypup Model Context Protocol (MCP) Server gives your AI assistant structured access to the data Keypup imports from Jira and from GitHub, GitLab, Bitbucket and Azure DevOps. For this analysis, what matters is that each Jira bug carries its issue type, priority, creation and closure dates, workflow status history with the time spent in each status, resolution, assignee, any custom field such as Team, and its reopen events. For the pull requests linked to it, Keypup provides their state, creation and merge dates, review state and build status.
Two conventions make the analysis possible. The SLA targets are yours: you state them in the prompt (below, 2 business days for Highest, 5 for High, 15 for Medium and 40 for Low), and the assistant compares each bug's business-day duration against them. Business days count Monday to Friday, 09:00 to 17:00, in the time zone you choose (UTC below). All figures cover the last 12 full months, November 2025 to October 2026, for an organization of around 1,500 engineers.
1. Measuring SLA Attainment From Creation, Not From In Progress
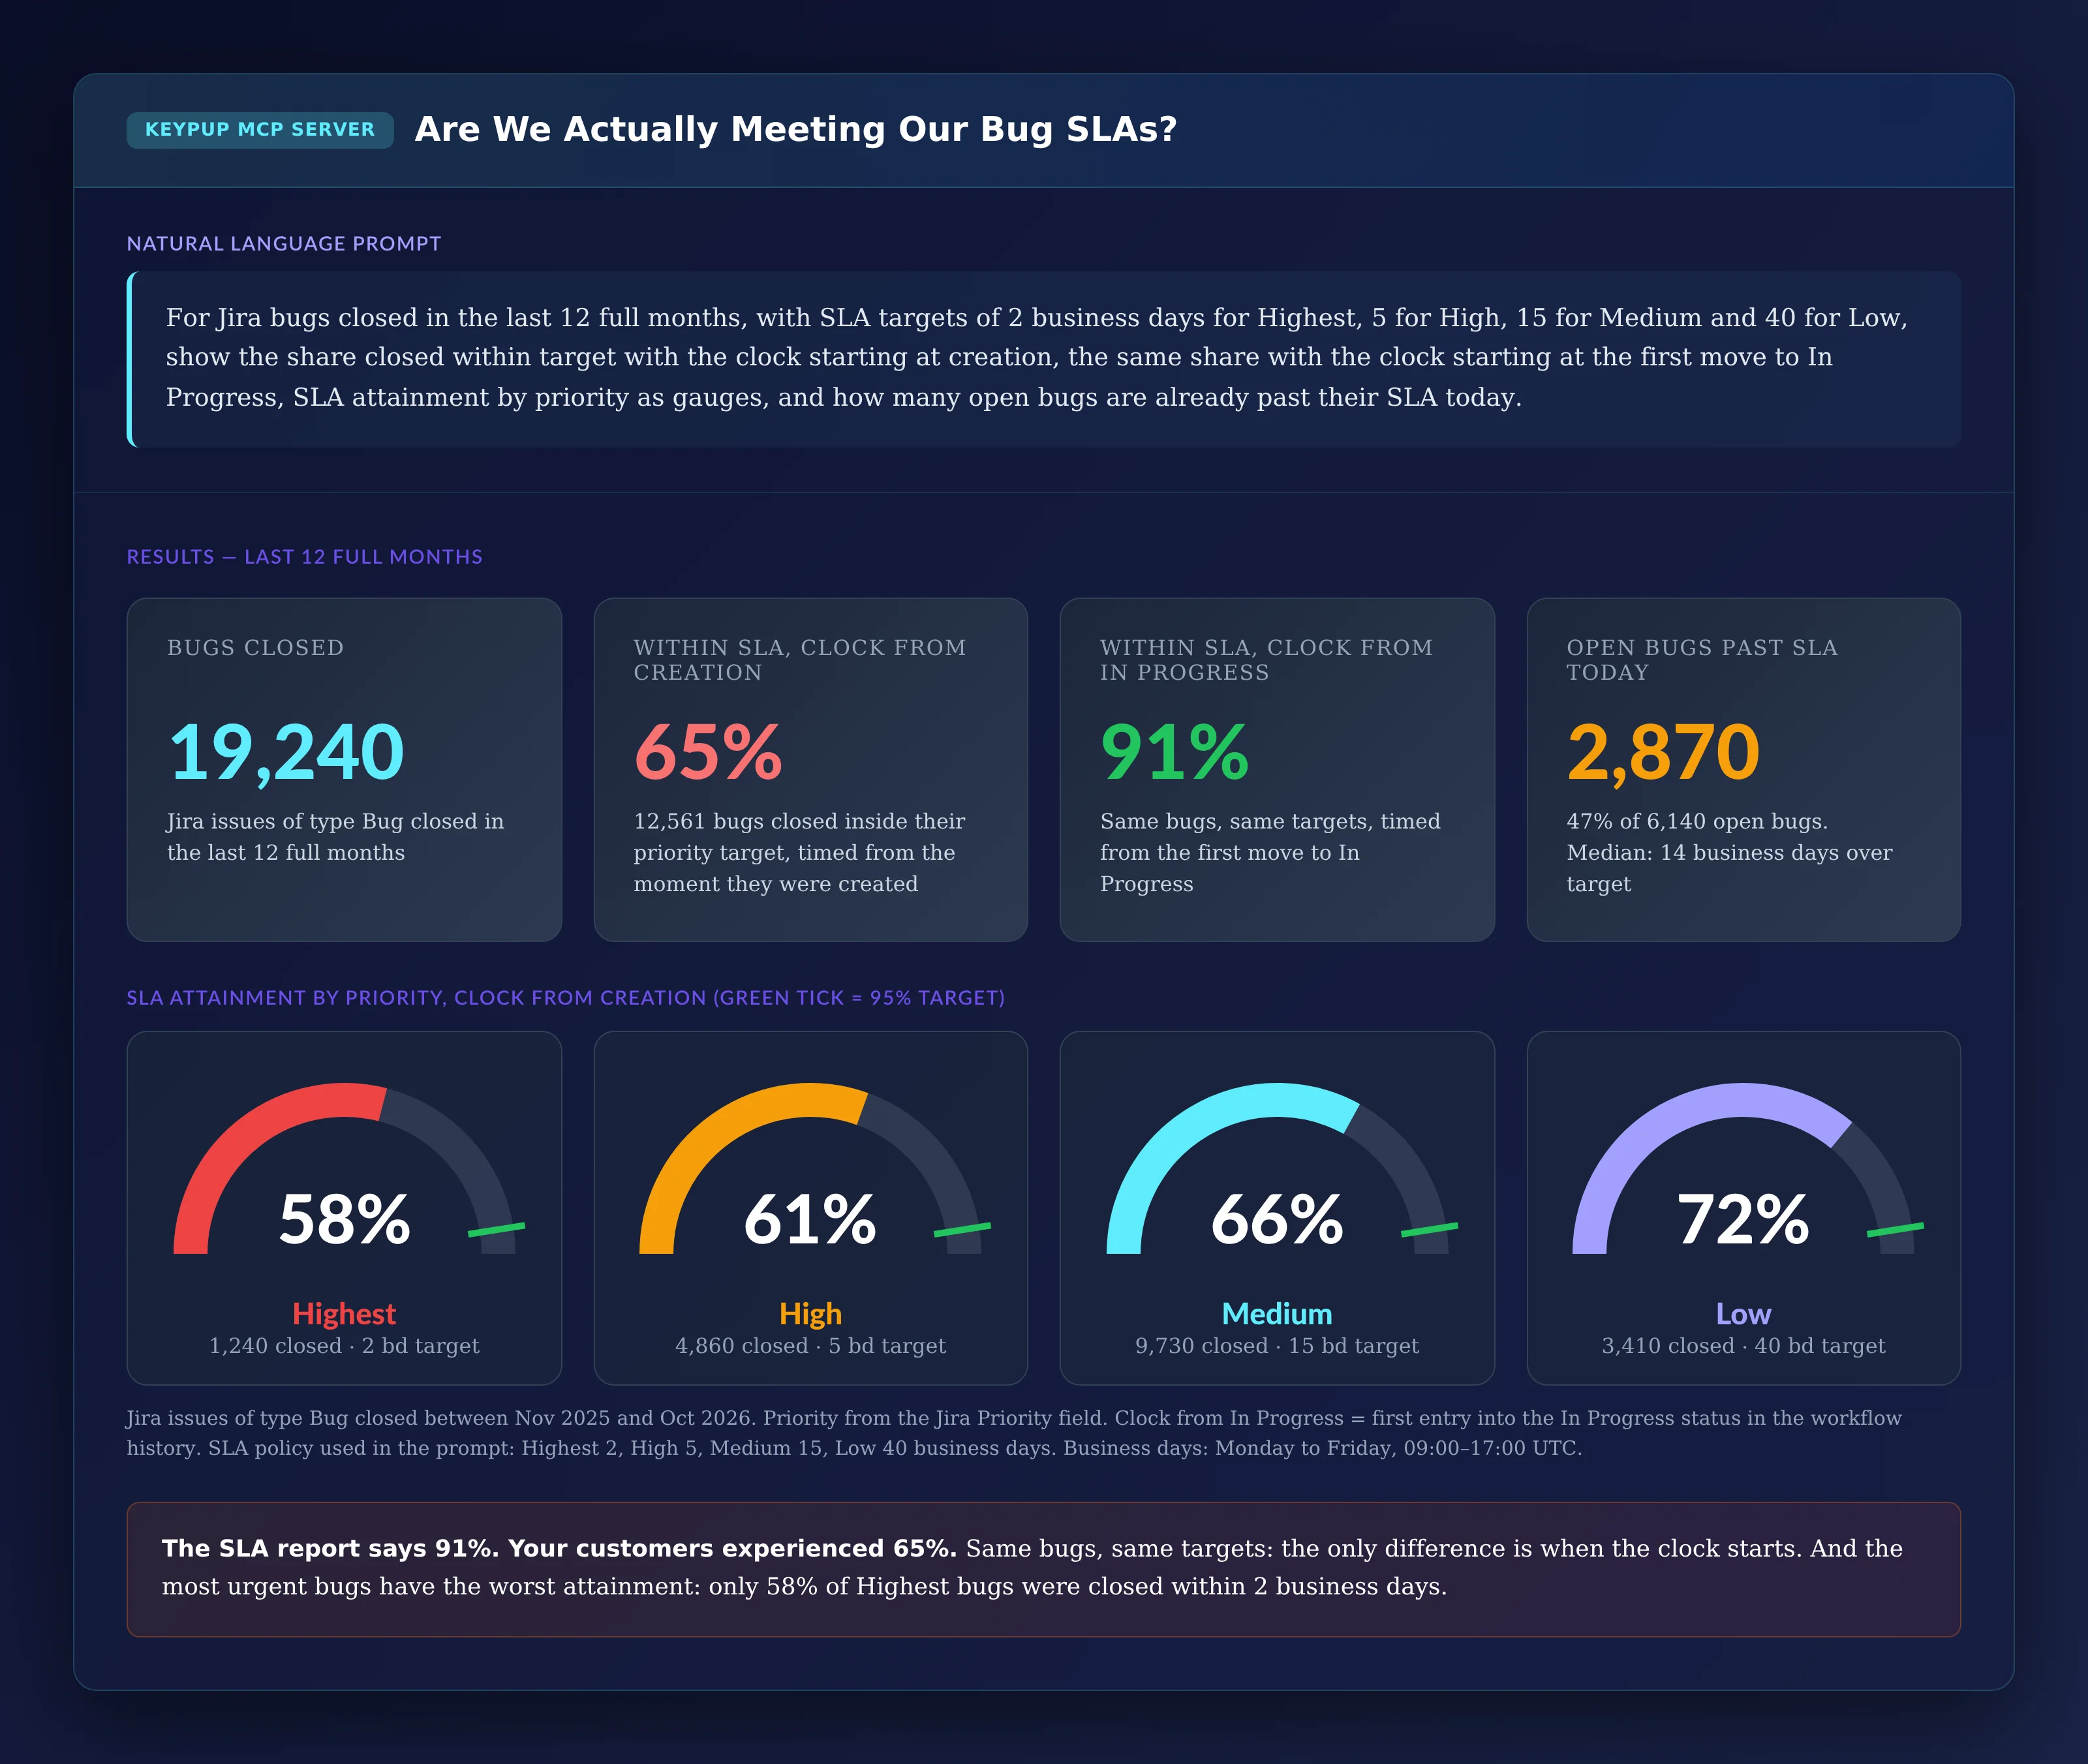
The first question: what does your SLA attainment look like when the clock starts where the customer's wait starts?
MCP Prompt:
For Jira bugs closed in the last 12 full months, with SLA targets of
2 business days for Highest, 5 for High, 15 for Medium and 40 for
Low, show the share closed within target with the clock starting at
creation, the same share with the clock starting at the first move to
In Progress, SLA attainment by priority as gauges, and how many open
bugs are already past their SLA today.
Output: Are We Actually Meeting Our Bug SLAs?
Key Insight: The SLA report says 91%. Customers experienced 65%. Same bugs, same targets: the only difference is when the clock starts. And attainment is worst where it matters most: only 58% of Highest bugs were closed within two business days of being reported.
2. Tracking Whether Attainment Is Improving or Eroding
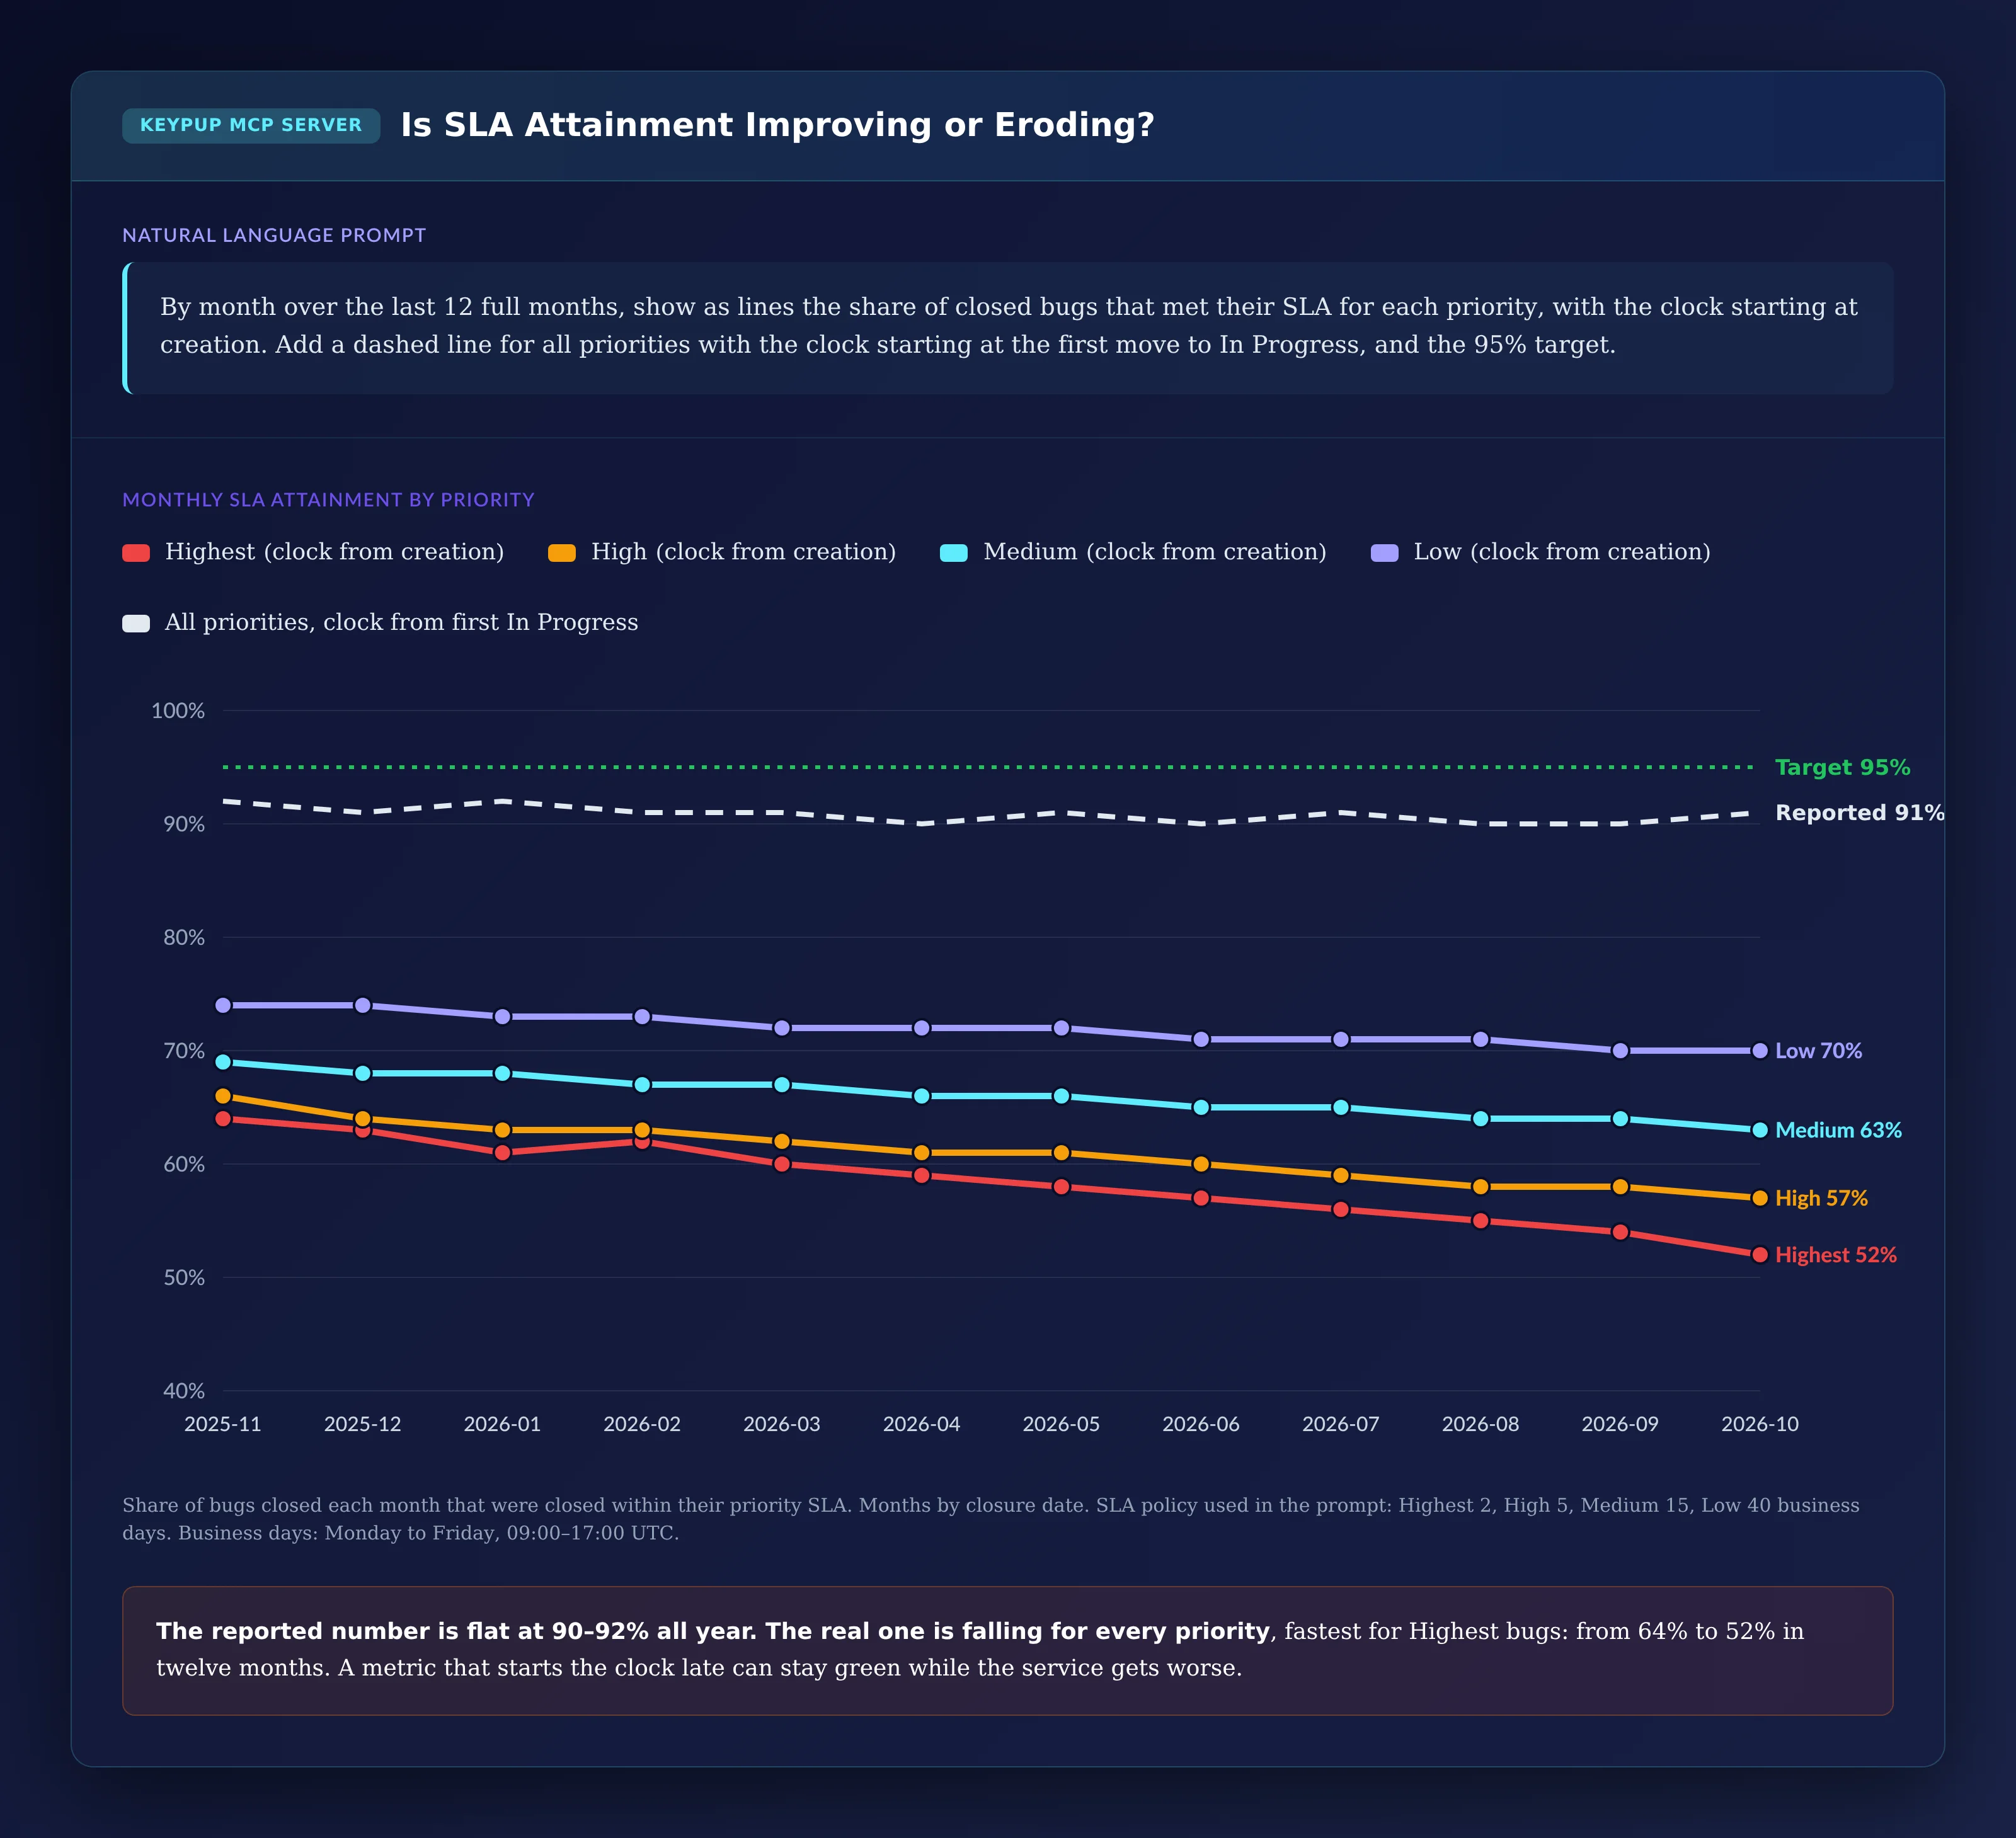
A yearly average can hide a trend. A monthly view by priority shows whether the service is getting better or worse, and how the reported metric behaves meanwhile.
MCP Prompt:
By month over the last 12 full months, show as lines the share of
closed bugs that met their SLA for each priority, with the clock
starting at creation. Add a dashed line for all priorities with the
clock starting at the first move to In Progress, and the 95% target.
Output: Is SLA Attainment Improving or Eroding?
Key Insight: The reported number is flat at 90 to 92% all year. The real one is falling for every priority, fastest for Highest bugs: from 64% to 52% in twelve months. A metric that starts the clock late can stay green while the service quietly gets worse.
3. Finding Where the SLA Time Goes
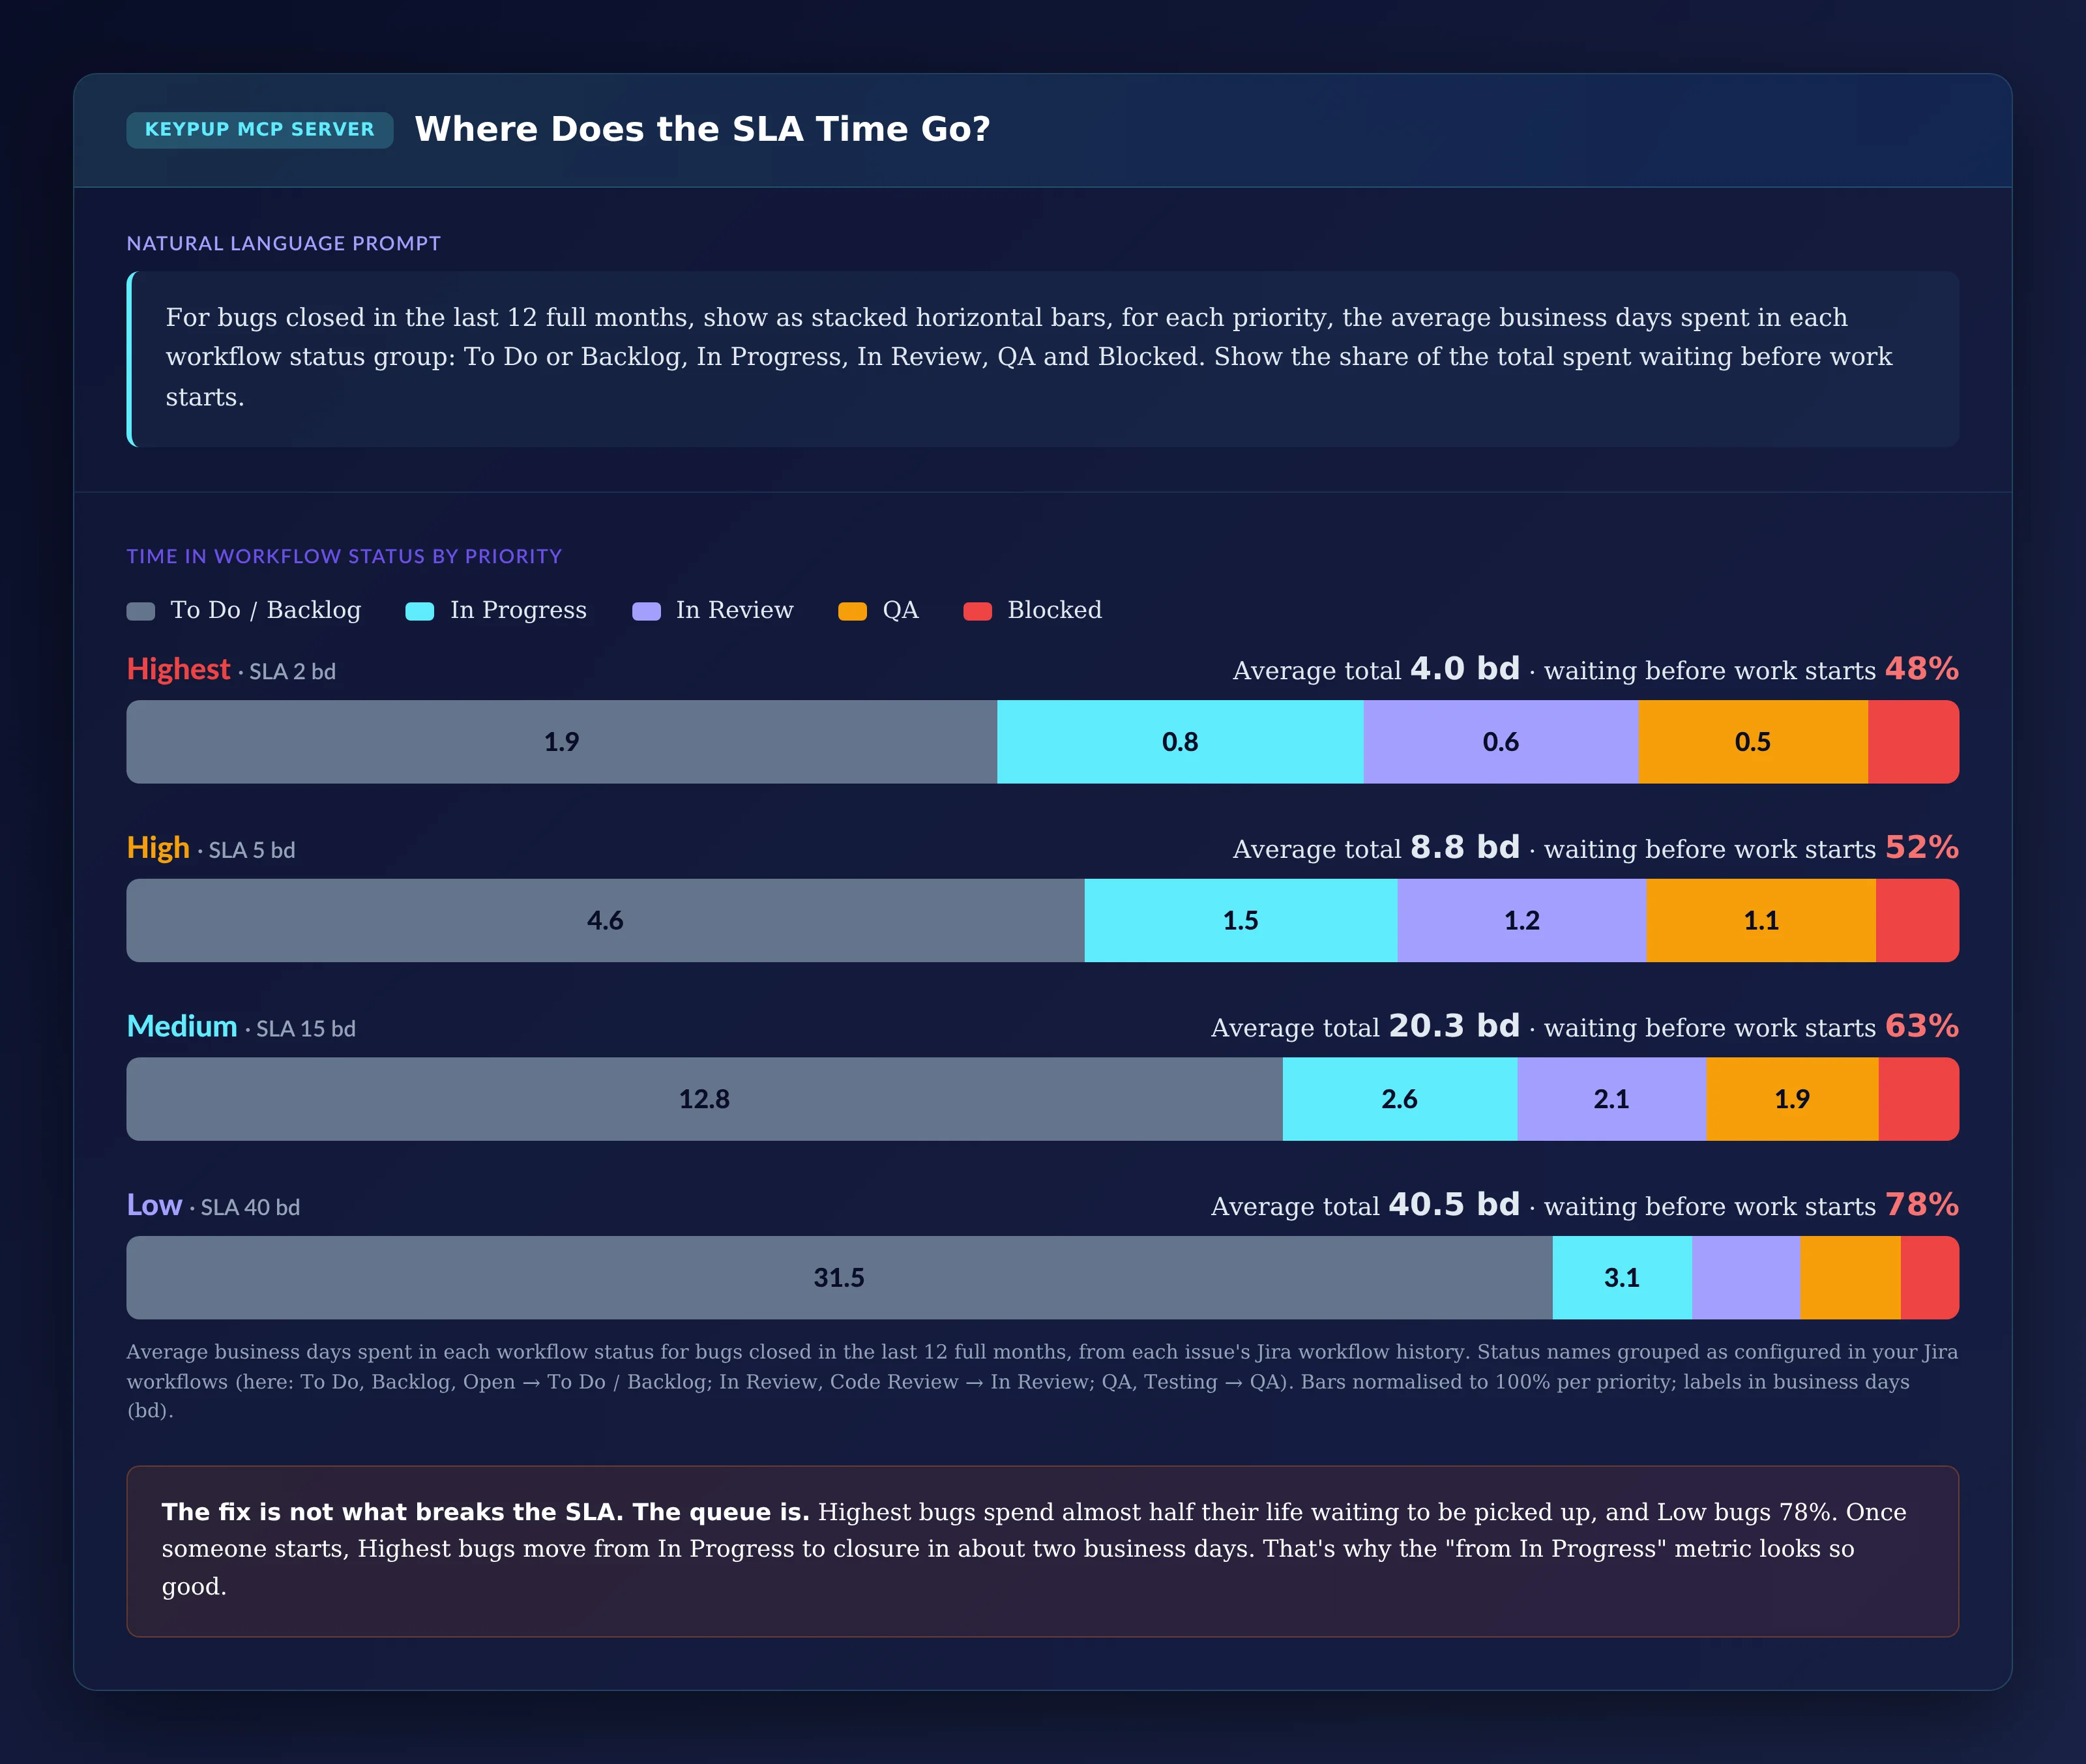
Knowing that bugs miss their target isn't enough. Keypup imports the full workflow history of each Jira issue, so the assistant can split each bug's life into the statuses it went through.
MCP Prompt:
For bugs closed in the last 12 full months, show as stacked horizontal
bars, for each priority, the average business days spent in each
workflow status group: To Do or Backlog, In Progress, In Review, QA
and Blocked. Show the share of the total spent waiting before work
starts.
Output: Where Does the SLA Time Go?
Key Insight: The fix is not what breaks the SLA. The queue is. Highest bugs spend almost half their life waiting to be picked up, and Low bugs 78%. Once someone starts, a Highest bug takes about two business days to close. That's exactly why the "from In Progress" metric looks so good, and why "fix faster" is the wrong answer.
4. Seeing Which Teams Miss Which Targets
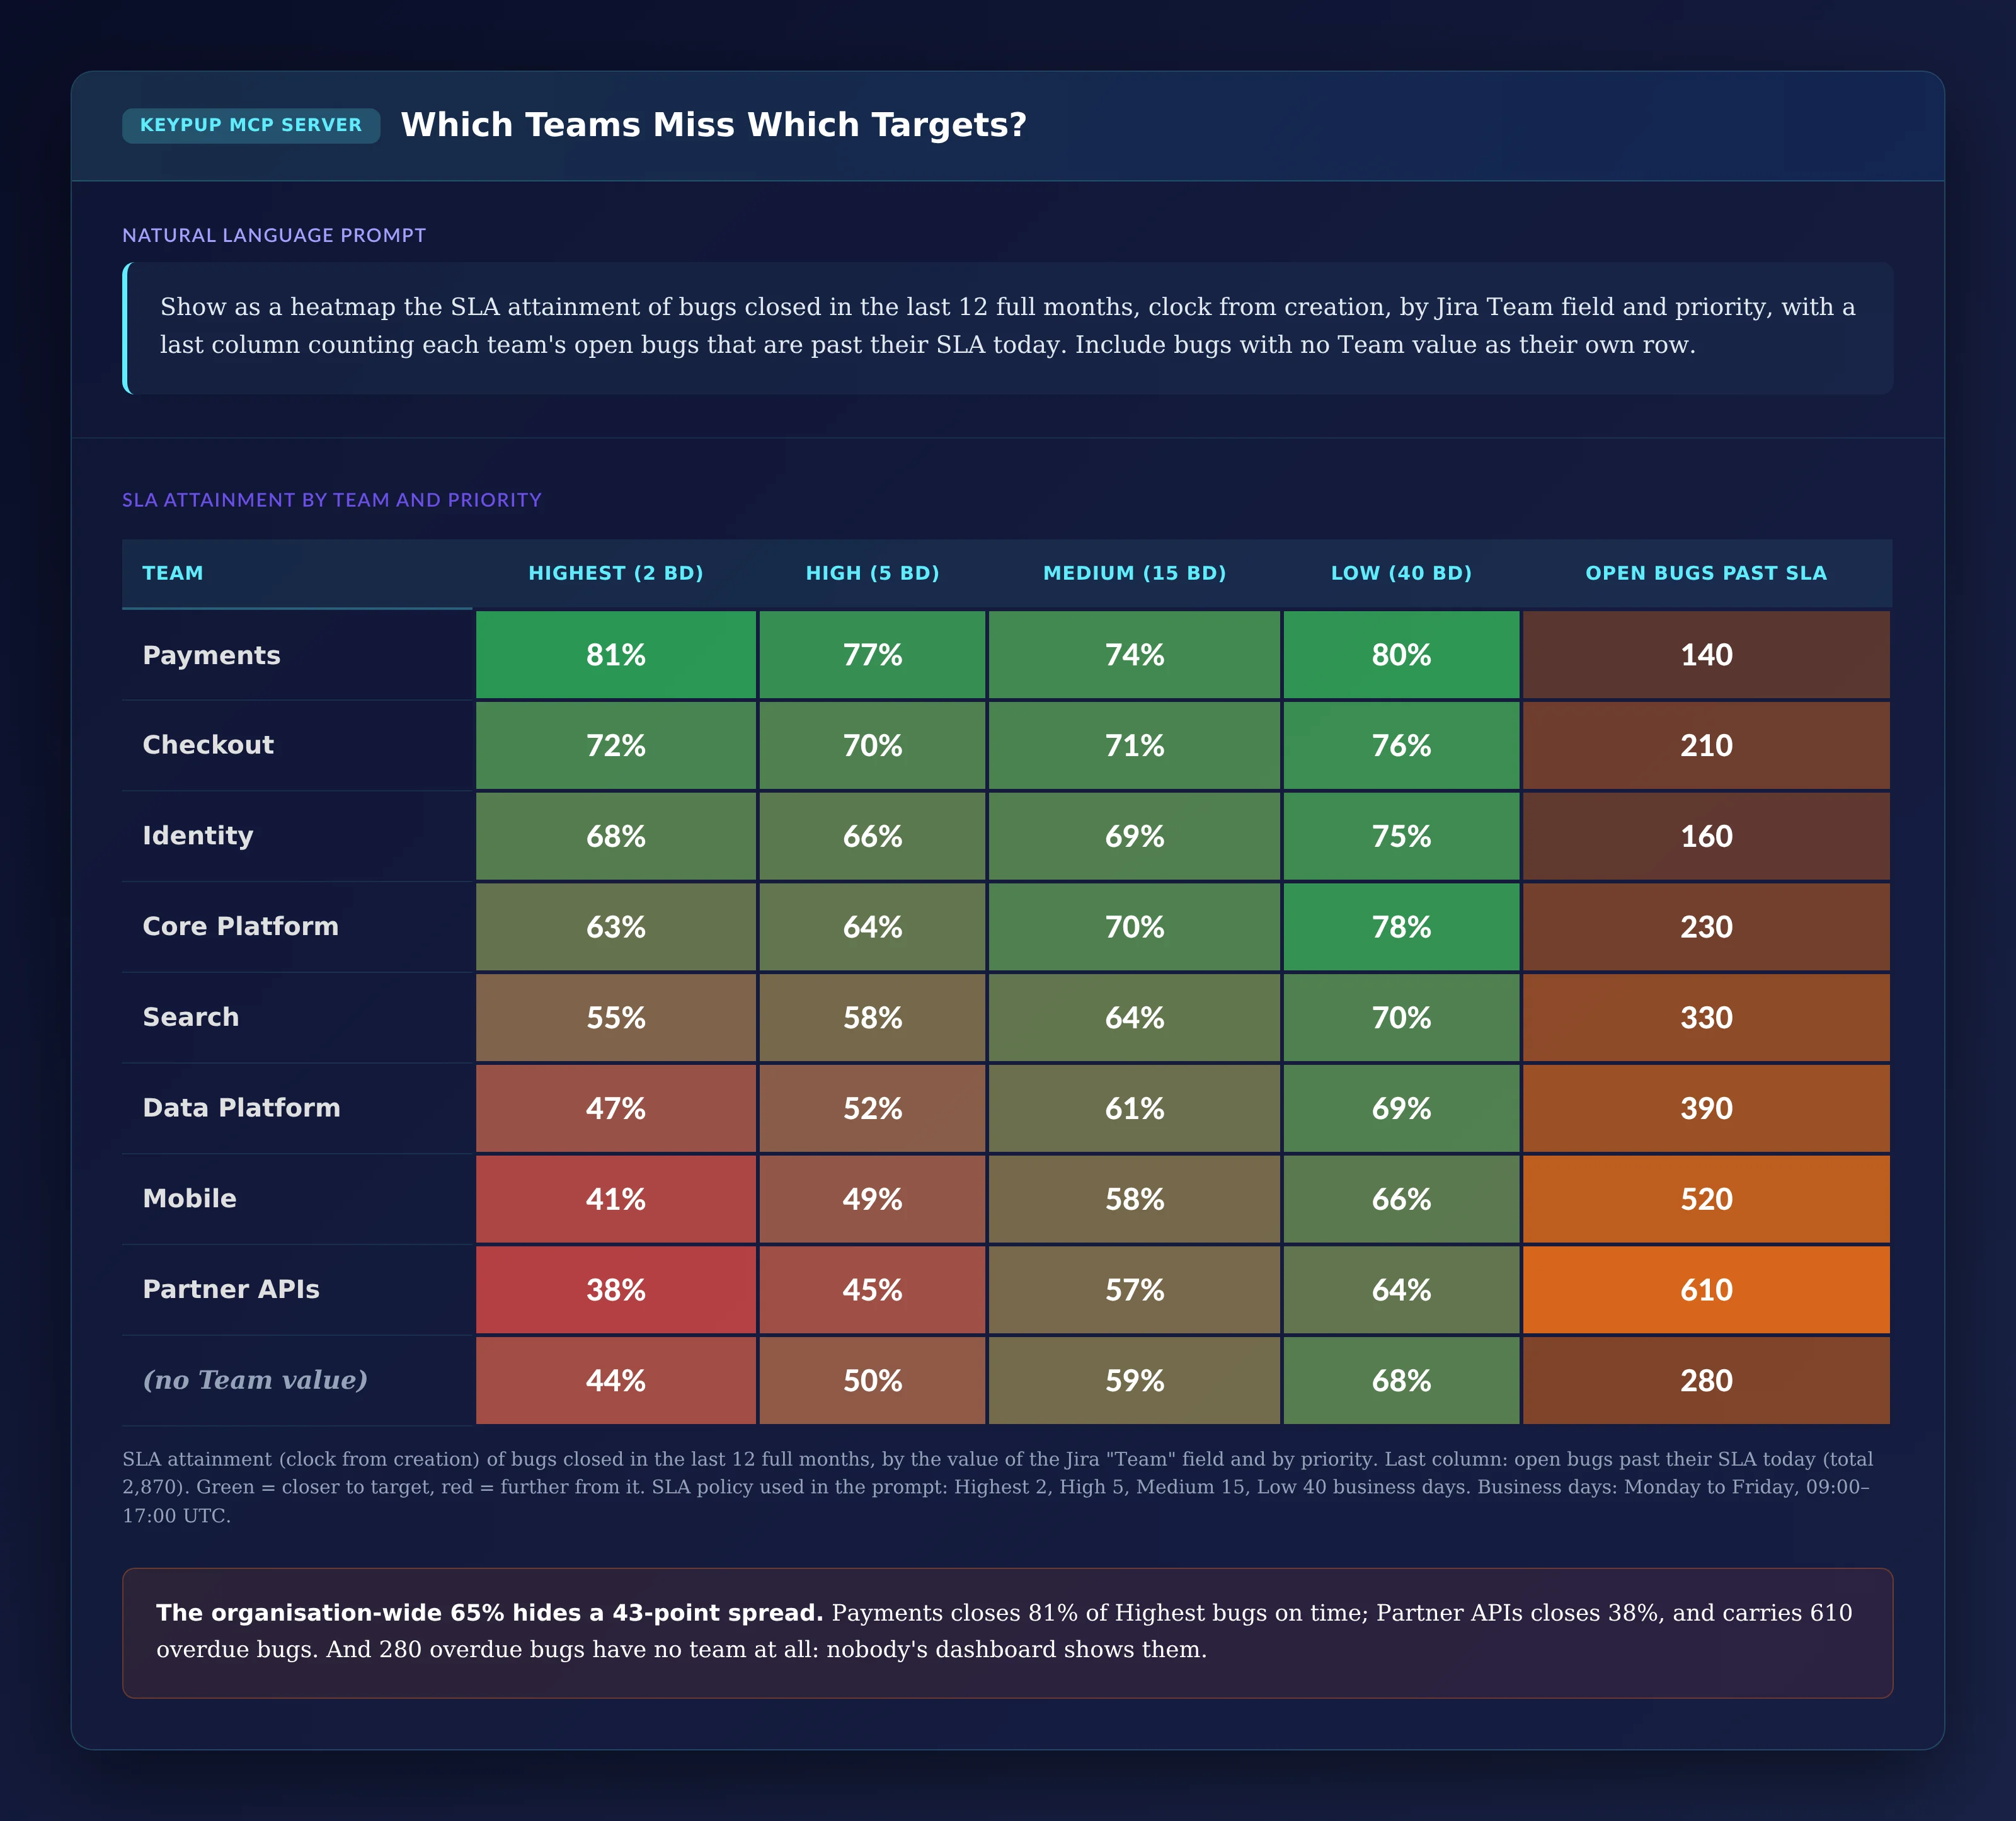
An organization-wide percentage hides very different situations. A heatmap by team and priority shows where the misses concentrate, and where open breaches pile up.
MCP Prompt:
Show as a heatmap the SLA attainment of bugs closed in the last 12
full months, clock from creation, by Jira Team field and priority,
with a last column counting each team's open bugs that are past their
SLA today. Include bugs with no Team value as their own row.
Output: Which Teams Miss Which Targets?
Key Insight: The organization-wide 65% hides a 43-point spread. Payments closes 81% of its Highest bugs on time; Partner APIs closes 38%, and carries 610 overdue bugs. And 280 overdue bugs have no team at all: they don't show up on any team's dashboard.
5. Checking What "Closed Within SLA" Really Means
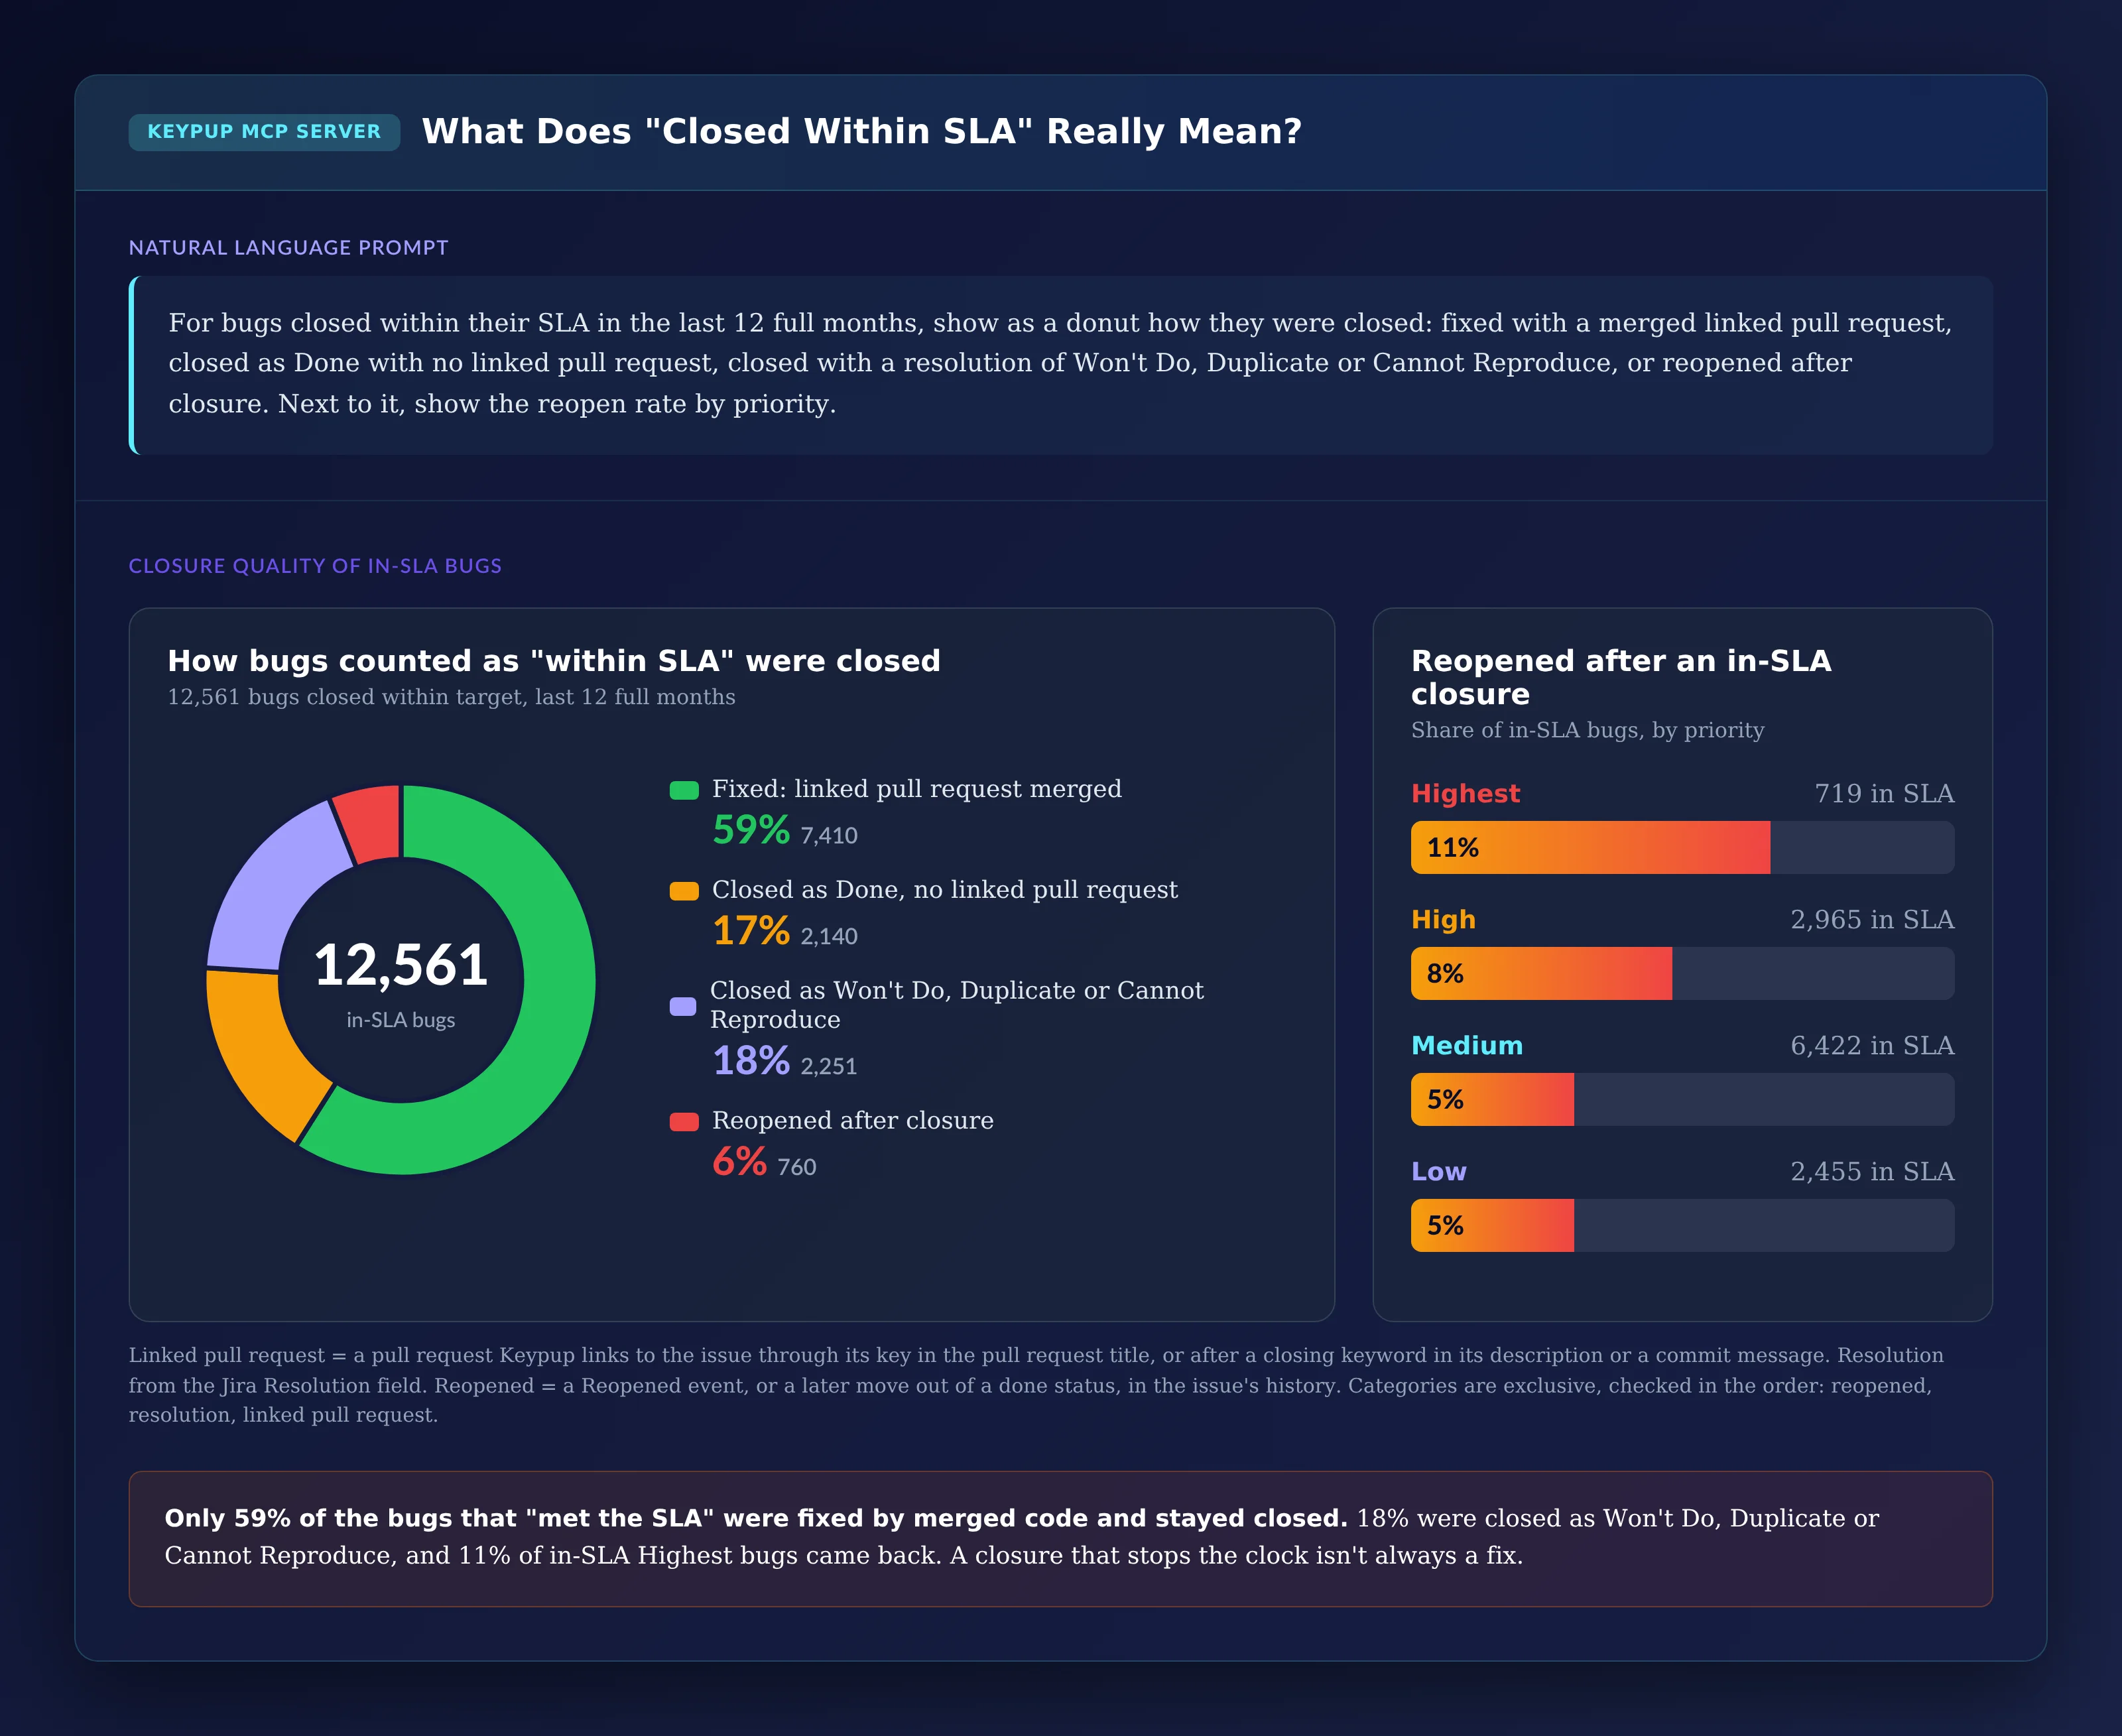
A bug can meet its SLA without being fixed. Keypup reads the Jira resolution, the pull requests linked to each bug, and the reopen events in its history, so the assistant can check how the in-SLA bugs were actually closed.
MCP Prompt:
For bugs closed within their SLA in the last 12 full months, show as a
donut how they were closed: fixed with a merged linked pull request,
closed as Done with no linked pull request, closed with a resolution
of Won't Do, Duplicate or Cannot Reproduce, or reopened after closure.
Next to it, show the reopen rate by priority.
Output: What Does "Closed Within SLA" Really Mean?
Key Insight: Only 59% of the bugs that "met the SLA" were fixed by merged code and stayed closed. 18% were closed as Won't Do, Duplicate or Cannot Reproduce, and 11% of in-SLA Highest bugs came back. Some of those closures are legitimate. But a closure that stops the clock isn't always a fix, and right now your SLA metric can't tell the difference.
6. Measuring How Far Past the SLA Open Bugs Are
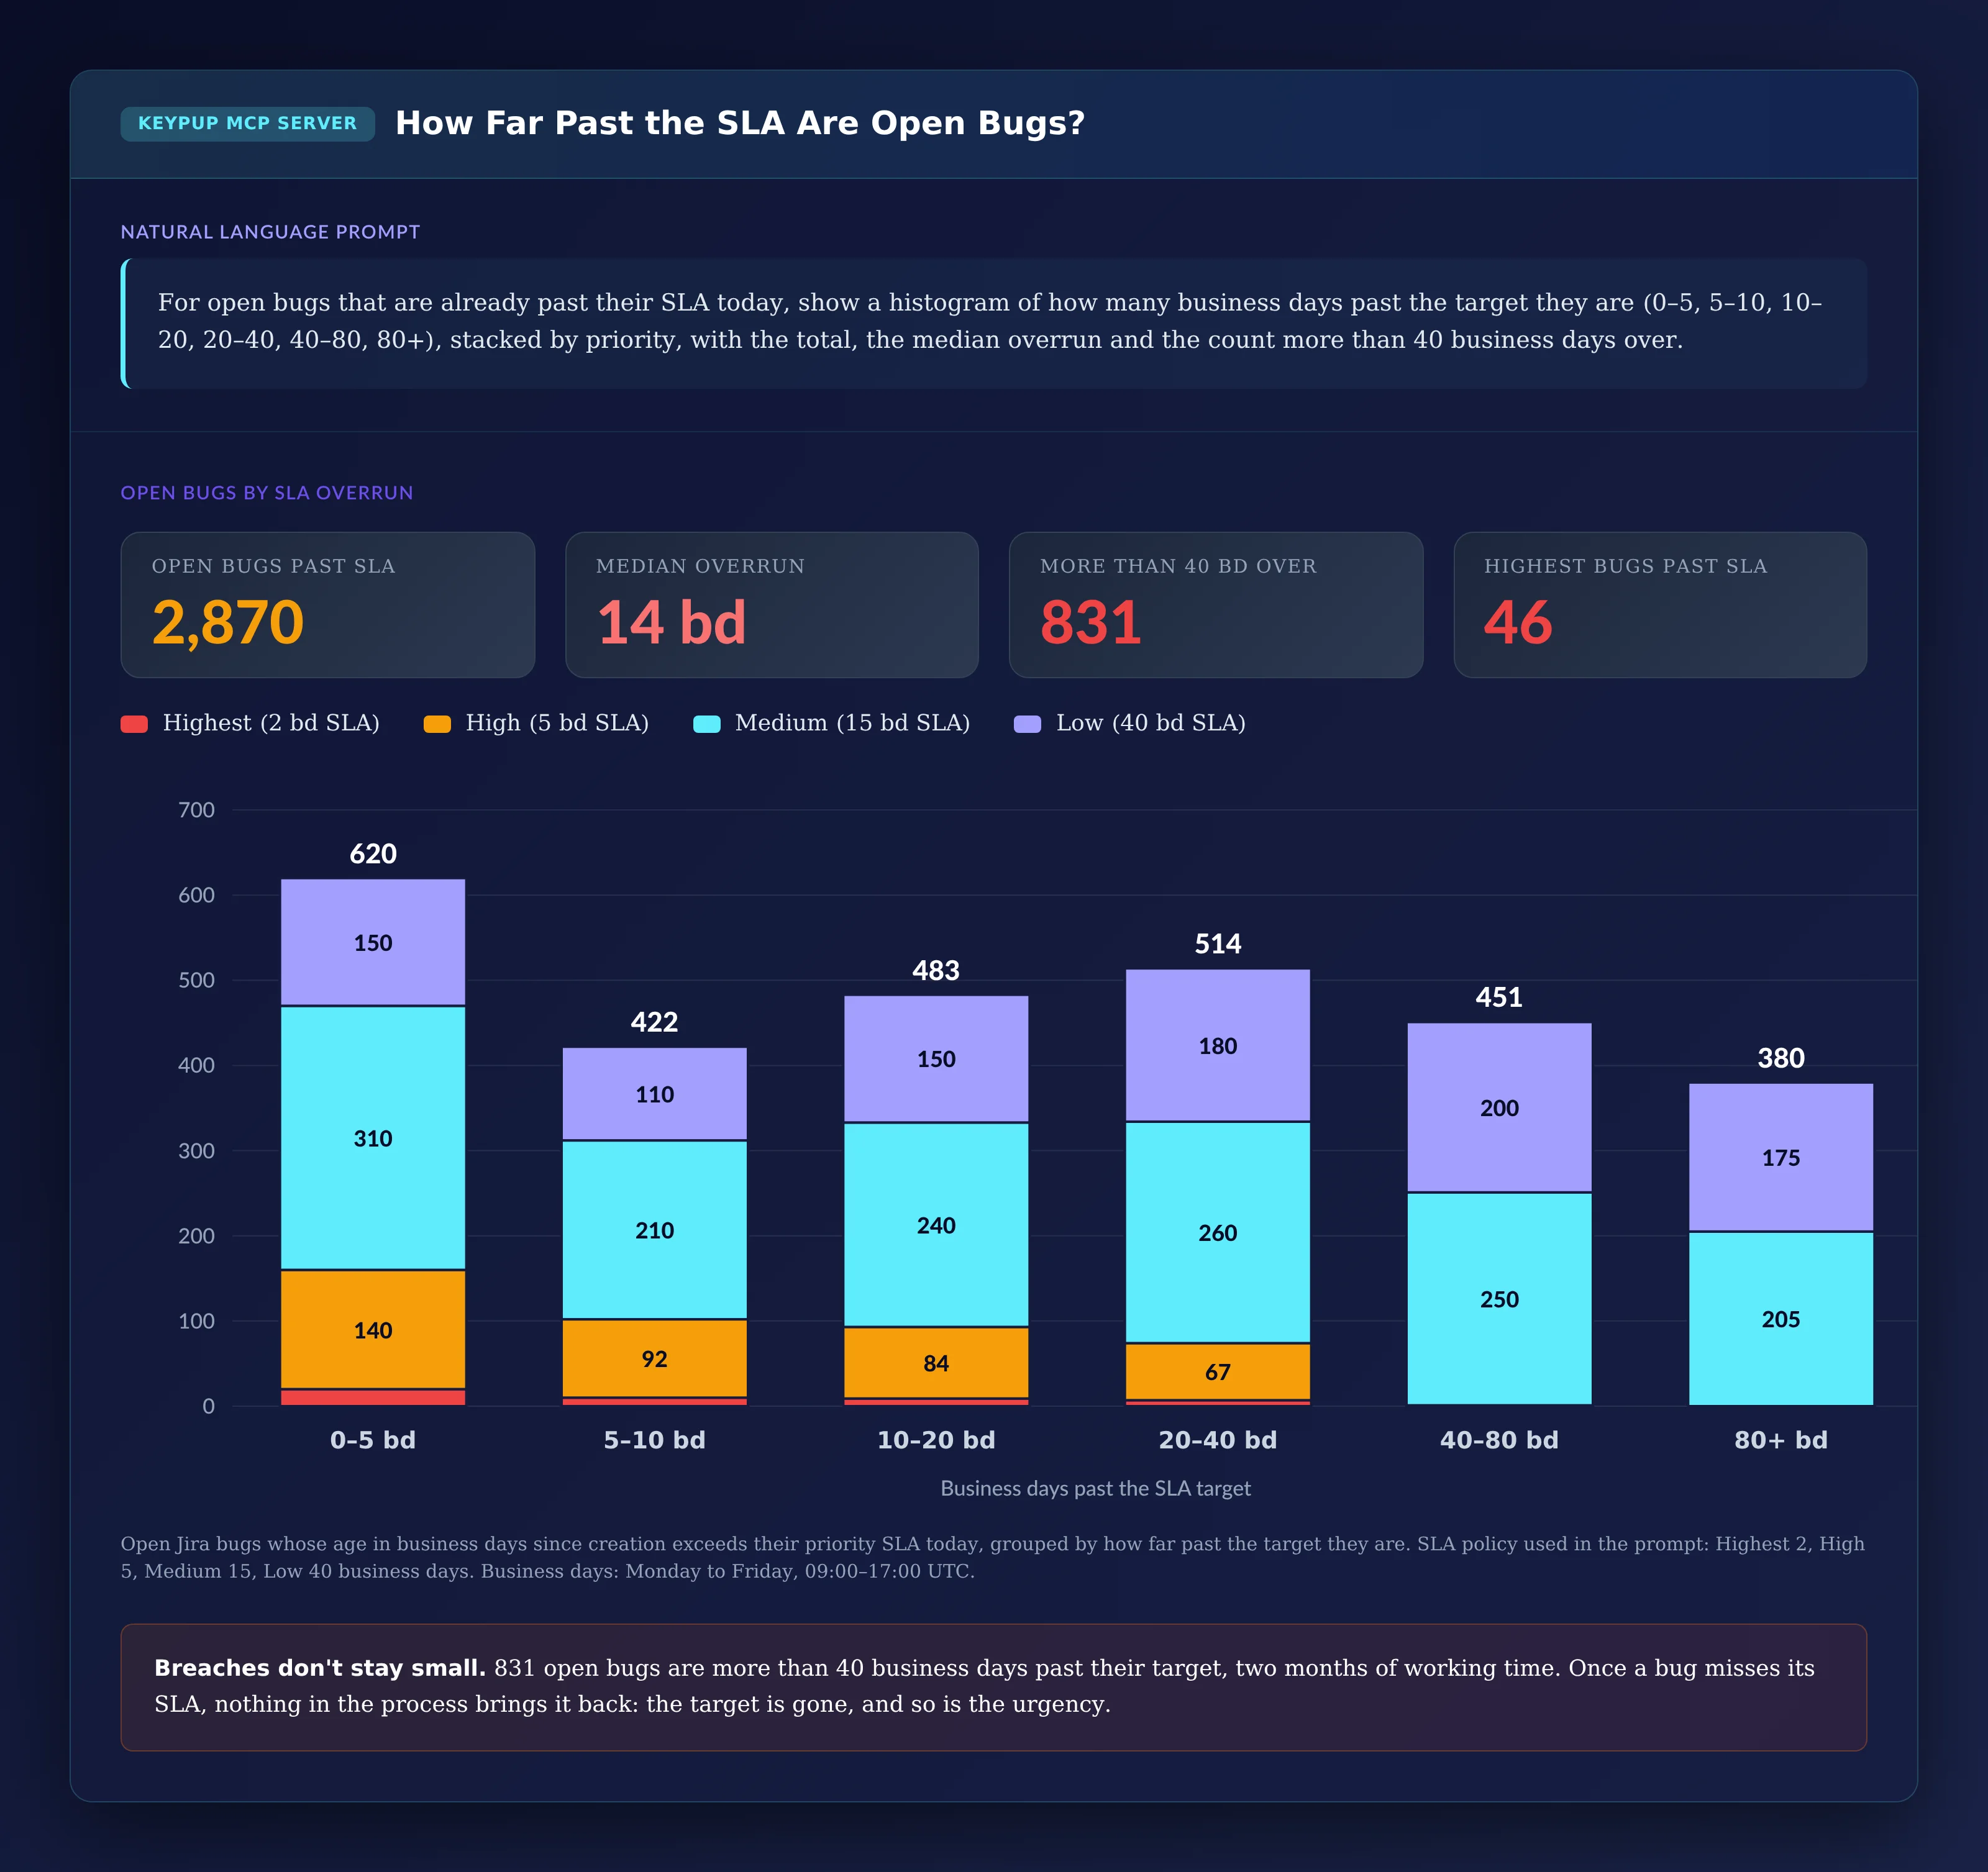
Closed bugs tell you about the past. Open bugs past their target tell you what customers are waiting for right now, and how long they've been waiting.
MCP Prompt:
For open bugs that are already past their SLA today, show a histogram
of how many business days past the target they are (0–5, 5–10, 10–20,
20–40, 40–80, 80+), stacked by priority, with the total, the median
overrun and the count more than 40 business days over.
Output: How Far Past the SLA Are Open Bugs?
Key Insight: Breaches don't stay small. 831 open bugs are more than 40 business days past their target: two months of working time. Once a bug misses its SLA, nothing in a typical process brings it back. The target is gone, and so is the urgency.
7. Listing the Overdue Bugs Nobody Is Escalating
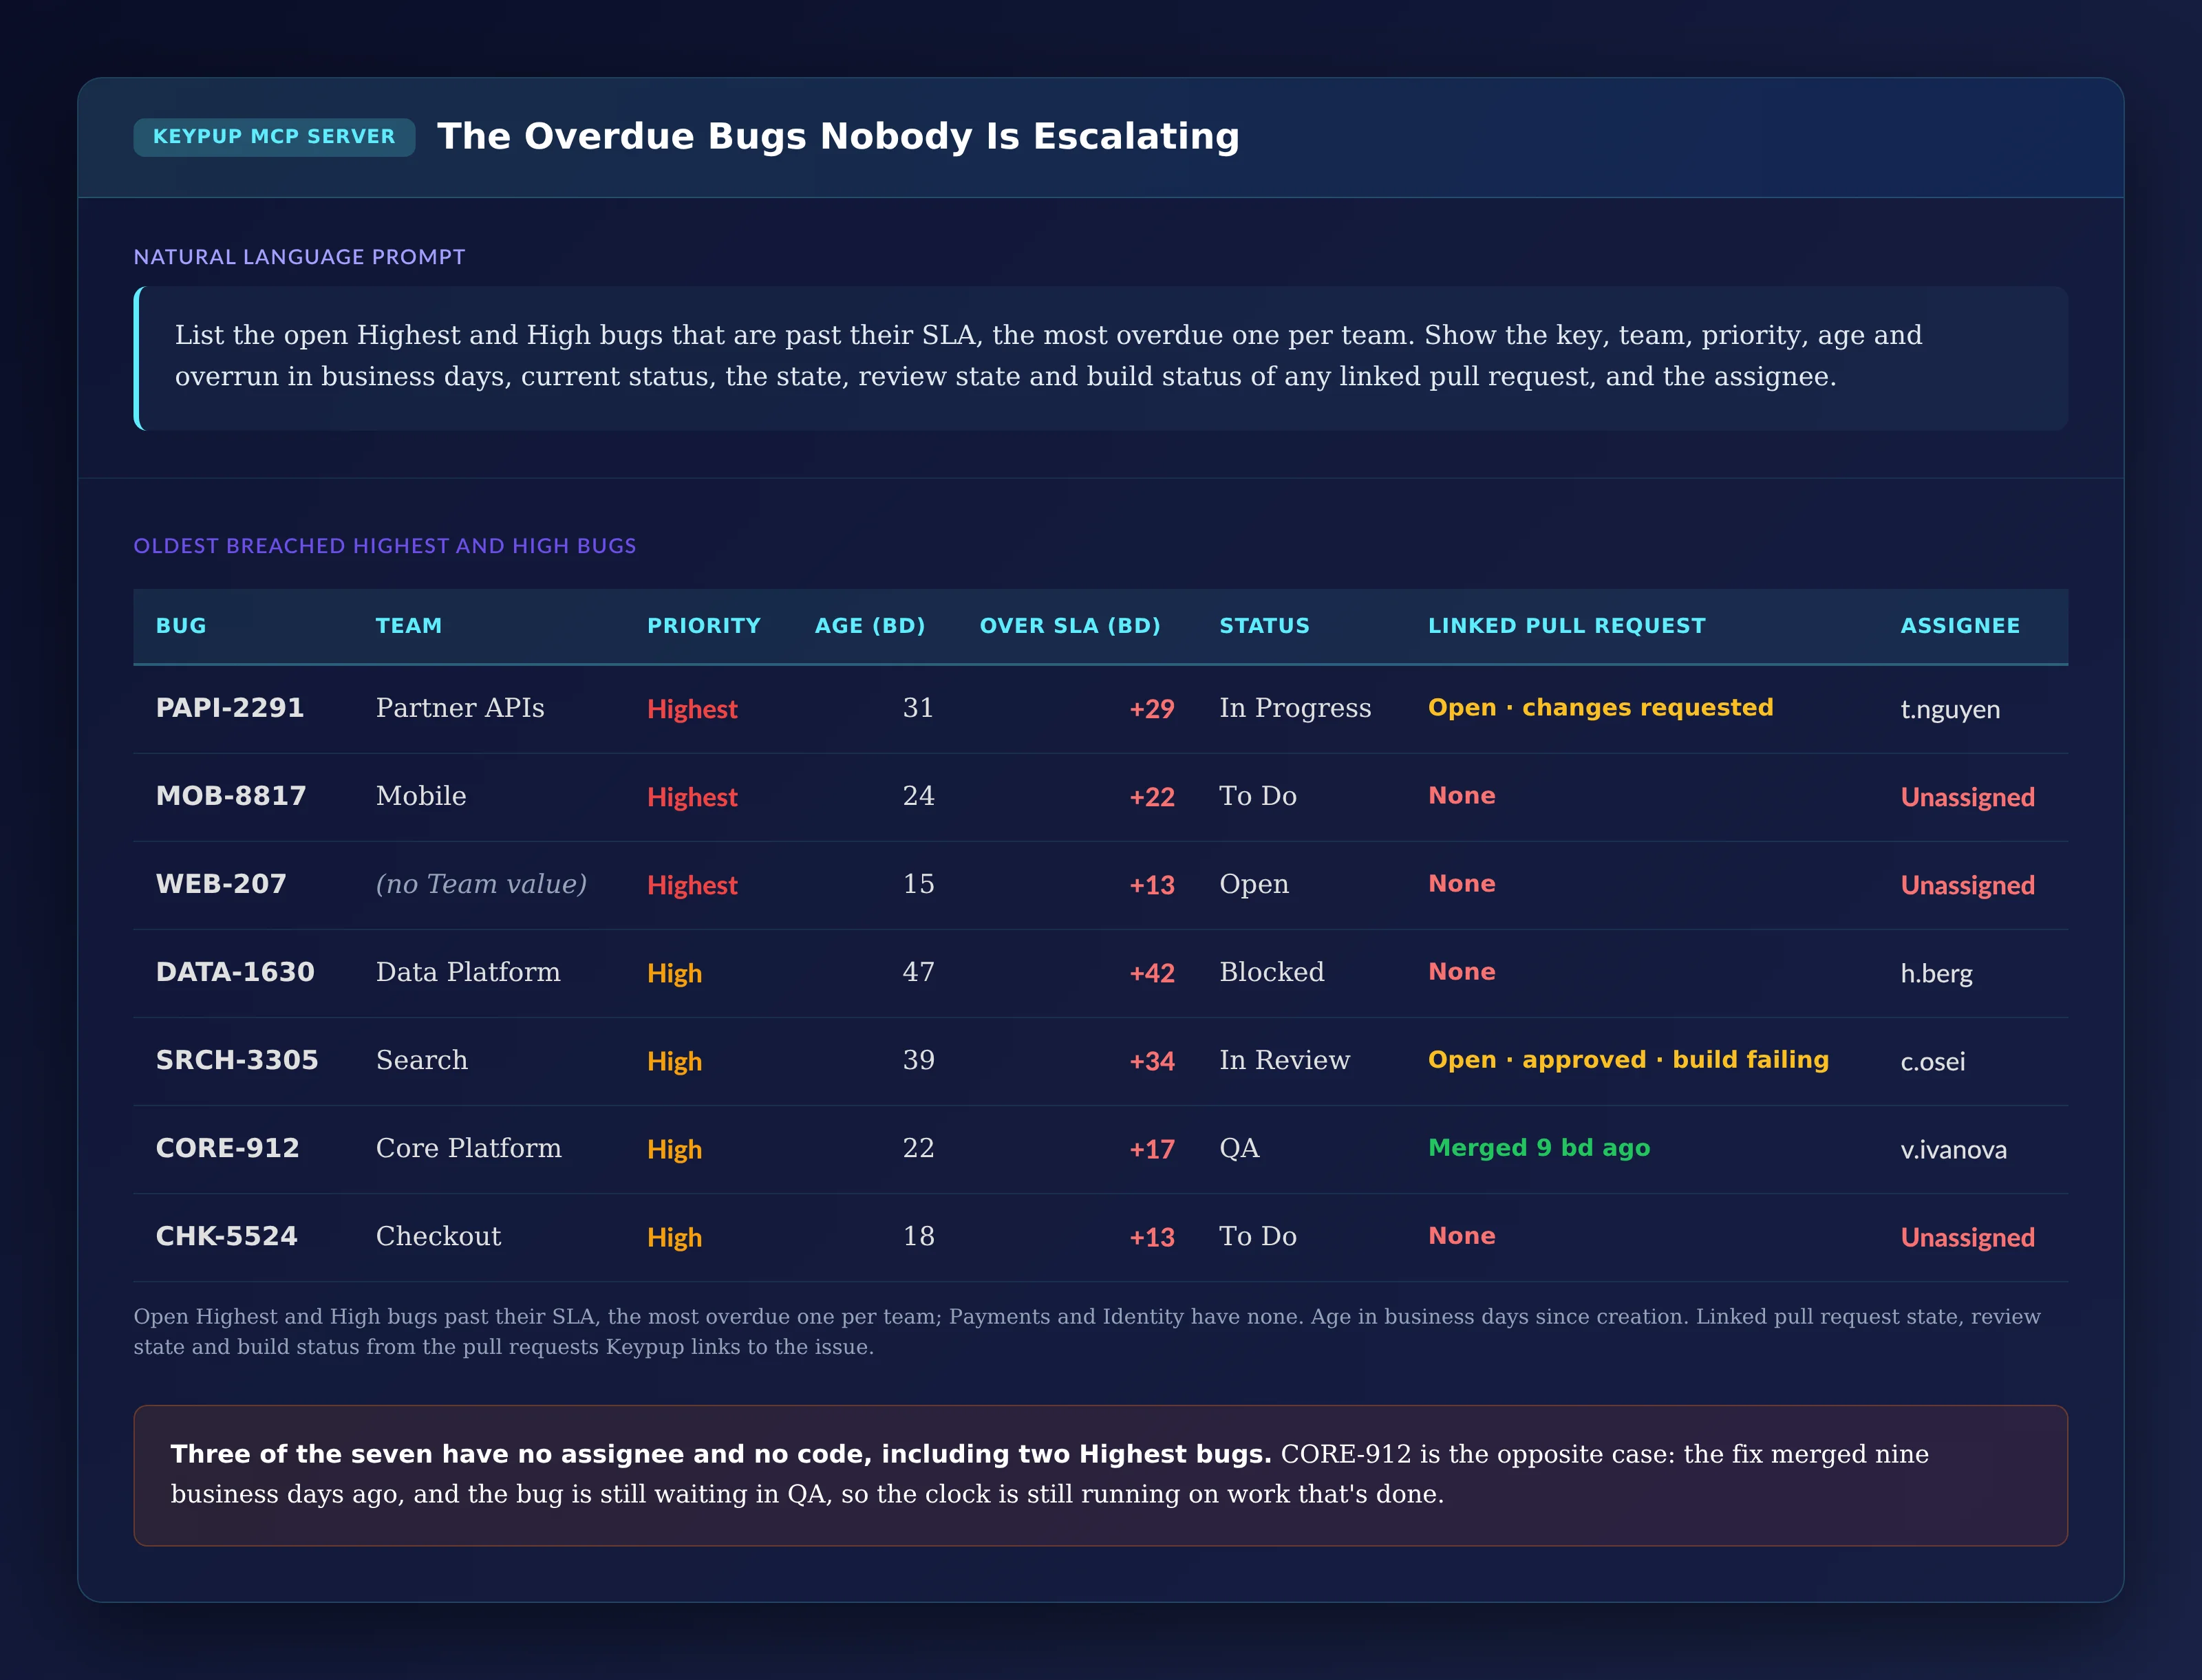
The last step turns the analysis into a work list: the most overdue Highest or High bug in each team, with where it is stuck.
MCP Prompt:
List the open Highest and High bugs that are past their SLA, the
most overdue one per team. Show the key, team, priority, age and overrun in
business days, current status, the state, review state and build
status of any linked pull request, and the assignee.
Output: The Overdue Bugs Nobody Is Escalating
Bug
Team
Priority
Age (bd)
Over SLA (bd)
Status
Linked pull request
Assignee
PAPI-2291
Partner APIs
Highest
31
+29
In Progress
Open · changes requested
t.nguyen
MOB-8817
Mobile
Highest
24
+22
To Do
None
Unassigned
WEB-207
(no Team value)
Highest
15
+13
Open
None
Unassigned
DATA-1630
Data Platform
High
47
+42
Blocked
None
h.berg
SRCH-3305
Search
High
39
+34
In Review
Open · approved · build failing
c.osei
CORE-912
Core Platform
High
22
+17
QA
Merged 9 bd ago
v.ivanova
CHK-5524
Checkout
High
18
+13
To Do
None
Unassigned
Key Insight: Three of the seven have no assignee and no code, including two Highest bugs. SRCH-3305 is approved and blocked only by a failing build. CORE-912 is the opposite case: the fix merged nine business days ago, and the bug is still waiting in QA, so the clock keeps running on work that's already done.
The Technical Implementation: What Keypup MCP Actually Reads
Every number above comes from fields Keypup already imports from Jira and your Git platforms. It helps to be precise about what they are, and what they depend on.
Bugs, Priorities and Dates Come From Jira
Keypup imports each Jira issue's type, priority, creation date and closure date. A bug is an issue of type Bug; if your teams use another type name, such as Defect or Incident, name it in the prompt. Keypup doesn't store SLA policies: you state the targets in the prompt, and the assistant compares each bug's duration in business days against the target for its priority. If you use different targets per customer tier or product, they need to be readable from a Jira field or label.
The "From In Progress" Clock Comes From Workflow History
Keypup imports the full workflow history of every Jira issue: each status it entered, when, and for how long. The assistant uses the first entry into In Progress for the "reported" clock, and the time spent in each status for the breakdown. Status names are yours: if your workflows use "Selected for Development", "Code Review" or "Testing", list them in the prompt and group them as you like. If your SLA pauses while a bug waits for the customer, the assistant can subtract the business days spent in that status.
Teams Come From Your Jira Fields
The team breakdown uses the Jira Team field, or any custom field your organization uses to assign ownership, such as Components or a custom "Squad" field. Bugs with no value in that field show up as their own row, which is often a finding in itself.
Closure Quality Comes From Resolutions, Links and Reopen Events
The Jira resolution (Done, Won't Do, Duplicate, Cannot Reproduce or your own values) is imported with each issue. Reopen events and moves back out of a done status are in the issue's history. "Fixed with merged code" relies on pull requests being linked to the bug, which Keypup does when the Jira key appears in the pull request title, or in its description or a commit message after a closing keyword such as "fixes". If your teams don't reference Jira keys consistently, some real fixes will show as "Done with no linked pull request".
Pull Request State Comes From Your Git Platform
For each linked pull request, Keypup imports its state, creation and merge dates, review state and build status from GitHub, GitLab, Bitbucket or Azure DevOps. That's what lets the assistant show, in the overdue list, which bugs are blocked by review, by CI, or by a QA step that runs after the merge.
What Keypup Doesn't See
Keypup doesn't import support desk tickets, customer accounts, contract terms or incident tooling, so it can't tell you which customer reported a bug or what your contract promises them, unless that information is in a Jira field or label. It doesn't import deployment events either: "fixed" means the linked pull request was merged and the bug closed, not that the fix reached production.
Real-World Impact: Enterprise Case Studies
Case Study 1: Global Insurance Software Vendor
Before Keypup MCP:
1,300 engineers, 70 Jira projects, contractual fix times for Highest and High bugs
SLA attainment reported at 93%, measured from In Progress to Done
Account teams escalating "critical bugs that take weeks" every month
After Keypup MCP:
Measuring from creation showed 61% attainment, with Highest bugs the worst: the reported metric was replaced by the creation-based one in the quarterly business review
The time-in-status breakdown showed most of the time lost before work started, so the organization added a daily triage rotation per team instead of pushing engineers to "fix faster"
The team heatmap and overdue list became a weekly review with support: every breached Highest bug gets an owner and a date, and bugs with no team are assigned within a day
"Our SLA metric was accurate. It just measured the part of the wait we were comfortable with. Once we started the clock where our customers do, the conversation with support changed from arguing about numbers to fixing the queue."
— SVP Engineering, Global Insurance Software Vendor
Case Study 2: European Digital Banking Platform
Before Keypup MCP:
800 engineers, regulatory reporting on incident and defect resolution times
A large share of bugs closed as "Cannot Reproduce" within SLA
No visibility on bugs reopened after closure
After Keypup MCP:
The closure donut showed which in-SLA bugs had no merged fix, and resolutions were reviewed: "Cannot Reproduce" now requires a comment from support before closing
Reopened bugs were counted against the SLA from the original creation date, which made the Highest reopen rate visible and brought it down over two quarters
The overdue list surfaced bugs with merged fixes stuck in QA, and QA capacity was moved to bugs closest to breaching
"We were proud of our SLA number until we looked at how the bugs were closed. Now we report what was fixed, not what was closed, and the regulator gets the same number our customers feel."
— Head of Engineering Quality, European Digital Banking Platform
Implementation: Getting Started with Keypup MCP
1. Connect Jira and Your Git Platforms
Connect Jira and GitHub, GitLab, Bitbucket or Azure DevOps to Keypup. Issues, workflow history, pull requests and reviews are imported automatically.
2. Write Down Your SLA Policy
List the target per priority in business days, the issue types it applies to, the time zone and working hours, and any status that pauses the clock. You'll paste it into your prompts.
3. Check Your Field Hygiene
Make sure bugs carry a priority and a team (or component) value, that resolutions are used consistently, and that pull requests reference the Jira key in their title, or in their description or a commit message after a closing keyword.
4. Connect the MCP Server to Your AI Assistant
Follow the MCP documentation to connect Keypup to Claude, ChatGPT, Cursor or any MCP-compatible assistant.
5. Make It a Weekly Ritual
Run the attainment and trend views monthly for leadership, and review the overdue list weekly with support and team leads, so that breached bugs get an owner instead of disappearing from view.
Frequently Asked Questions
What is a bug SLA?
A bug SLA (service level agreement) is a target time to fix a bug, usually set by priority: for example two business days for Highest, five for High. It can be an internal commitment to support teams or a contractual commitment to customers.
When should the bug SLA clock start?
From the customer's point of view, when the bug is reported, which in Jira is the issue's creation date. Starting the clock when work begins (In Progress) leaves out triage and queue time, which is often most of the wait. Measure both, and report the one that matches your promise.
How do you measure bug resolution time in Jira?
Compare each bug's creation and closure dates in business days, by priority, and compare the result to your targets. Jira's workflow history adds where the time went, status by status, and linked pull requests show whether the closure came with a merged fix.
Why do teams miss bug SLAs?
Usually because bugs wait too long before anyone starts on them, not because fixes are slow. Unclear ownership, missing triage, and priorities that aren't revisited all add queue time. A time-in-status breakdown by priority shows which one applies.
The Bottom Line
A bug SLA is a promise about how long someone waits. If the metric starts the clock late and counts closures instead of fixes, it can stay green while the promise is broken. Keypup MCP makes the real number visible:
✅ Measuring SLA attainment from creation, next to the "from In Progress" number ✅ Tracking whether attainment improves or erodes, priority by priority ✅ Finding where the SLA time goes, status by status ✅ Seeing which teams miss which targets, including bugs with no team ✅ Checking which in-SLA closures were real fixes ✅ Measuring how far past the SLA open bugs are ✅ Listing the overdue bugs nobody is escalating
Dependabot and Renovate open thousands of pull requests across enterprise repositories, and most of them are never merged, merged with no review, or left open for months. Learn what engineering leaders on Reddit say about dependency bot noise, unowned major upgrades and auto-merge risk, and how Keypup MCP measures the bot backlog by version bump, ecosystem, merge path, next action and owner.
Enterprises spend millions on outsourced and offshore engineering vendors, yet most can only measure them through hours billed and status reports. Learn what engineering leaders on Reddit say about vendor black boxes, hidden review load and untraceable work, and how Keypup MCP compares vendor and in-house pull requests, review wait times, review load and Jira traceability to show what each vendor actually delivers.
Microservices promised independent teams. In many enterprises, a single Jira story still needs coordinated pull requests in four or five repositories. Learn what engineering leaders on Reddit say about distributed monoliths, lockstep releases and cross-repository changes, and how Keypup MCP links Jira issues to the pull requests that resolve them to measure how many changes span several repositories, what each extra repository costs in cycle time, and which repositories always change together.