The 90% Done Epic: How Scope Creep Quietly Breaks Enterprise Roadmap Forecasts
Why does every epic sit at 90% done for weeks? Learn what engineering leaders on Reddit say about scope creep, moving goalposts and missed roadmap dates at enterprise scale, and how Keypup MCP uses Jira epics, their child issues and due dates to measure how much scope is added after planning, where it comes from, where it concentrates and which "almost done" epics are still growing.
TL;DR: Roadmap dates rarely slip because teams are slow. They slip because epics keep growing after the date was committed — and the progress bar hides it. An epic that was 24 issues at planning and is 61 issues today can report "90% done" for ten weeks in a row. This is epic scope creep, and most organizations can't measure it because Jira only shows the current scope, not how it changed. The Keypup MCP Server reads each Jira epic, its child issues with their creation and closure dates, issue types and the epic's due date. Your AI assistant can then measure how much scope is added after planning, draw a real burn-up for any epic, track the trend by quarter, show whether late scope predicts the delay, break it down by issue type, compare projects and list the "almost done" epics that are still growing.
Ask a product and engineering leadership team why the last three roadmap commitments slipped and you will hear "estimation", "dependencies" or "capacity". Ask how many issues each of those epics had on the day the date was committed, and how many they had at the end, and nobody can answer — because the tools only keep the current number.
The Friction: Progress Bars That Never Reach 100%
In a single team, a lead notices when an epic keeps growing. In an organization of 1,200 engineers running hundreds of epics across dozens of Jira projects, scope creep is invisible for structural reasons:
Progress is a ratio. "Closed issues ÷ all issues" stays flat at 85–90% when new issues arrive as fast as old ones close. The epic looks nearly finished every week.
Jira shows the current scope, not the original one. Once a child issue is added, nothing in the epic view says it wasn't part of the plan.
Late scope comes from everywhere. Product adds requirements, QA files bugs against the epic, engineers split tasks they underestimated. Each change is reasonable; the total is not.
The date doesn't move until it's missed. Status reports say "on track" because the percentage is high, right up to the week the date passes.
The result: the roadmap review learns an epic is late on the day it was due — and nobody can say whether the team was slow or the epic doubled.
Why This Matters: The Real Cost of Unmeasured Scope Creep
The Forecasting Problem
A roadmap date is a forecast based on the scope known at planning. If a third of the scope arrives after planning, every forecast based on the original scope is wrong by design, however good the estimates were.
The Accountability Problem
When an epic misses its date, the delivery team usually takes the blame. Without data on how the scope changed, there is no way to separate "we delivered the plan slowly" from "we delivered twice the plan on time".
The Trust Problem
Repeatedly missed dates erode trust between engineering, product and the business. Leadership responds with more padding and more status meetings, which cost time and fix nothing, because the cause — scope that keeps moving — is never named.
The Enterprise Discussion: What Engineering Leaders Are Actually Saying
Scope creep, moving goalposts and missed roadmap dates are among the most recurring complaints wherever engineering managers, staff engineers and directors at large organizations compare notes. The quotes below are representative of recurring threads on r/ExperiencedDevs, r/EngineeringManagers, r/agile and r/projectmanagement.
Engineering Manager, Insurance Group (r/EngineeringManagers)
"Our epic has been 90% done for two months. Every sprint we close ten tickets and someone adds eight. Leadership keeps asking why we can't 'just finish the last 10%', and I have no chart to show them that the last 10% is a moving target."
"The roadmap date was set when the epic had 20 tickets. It has 55 now. Nobody ever changed the date, and in the retro the conclusion was that engineering needs to estimate better."
Director of Engineering, SaaS Company (r/agile)
"I don't want to stop product from changing their mind — that's the point of agile. I just need to know how much they change it, so I can stop committing to dates as if they don't."
The pattern holds: leaders know scope changes after planning, but they can't measure by how much — so missed dates get blamed on estimation and delivery speed.
How Keypup MCP Measures Epic Scope Creep
The Keypup Model Context Protocol (MCP) Server gives your AI assistant structured access to the data Keypup imports from Jira, GitHub, GitLab, Bitbucket and Azure DevOps. For this analysis, what matters is the parent epic of each Jira issue, with the epic's key, project, creation date, closure date and due date, and for each child issue its creation date, closure date, state and issue type.
In the prompts below, scope added late means child issues created more than 14 days after their parent epic. Pick the planning window that matches how your teams work. This relies on child issues being linked to their epic through Jira's parent field, and on epics having a due date for the date-related prompts.
1. Running an Epic Scope Health Check
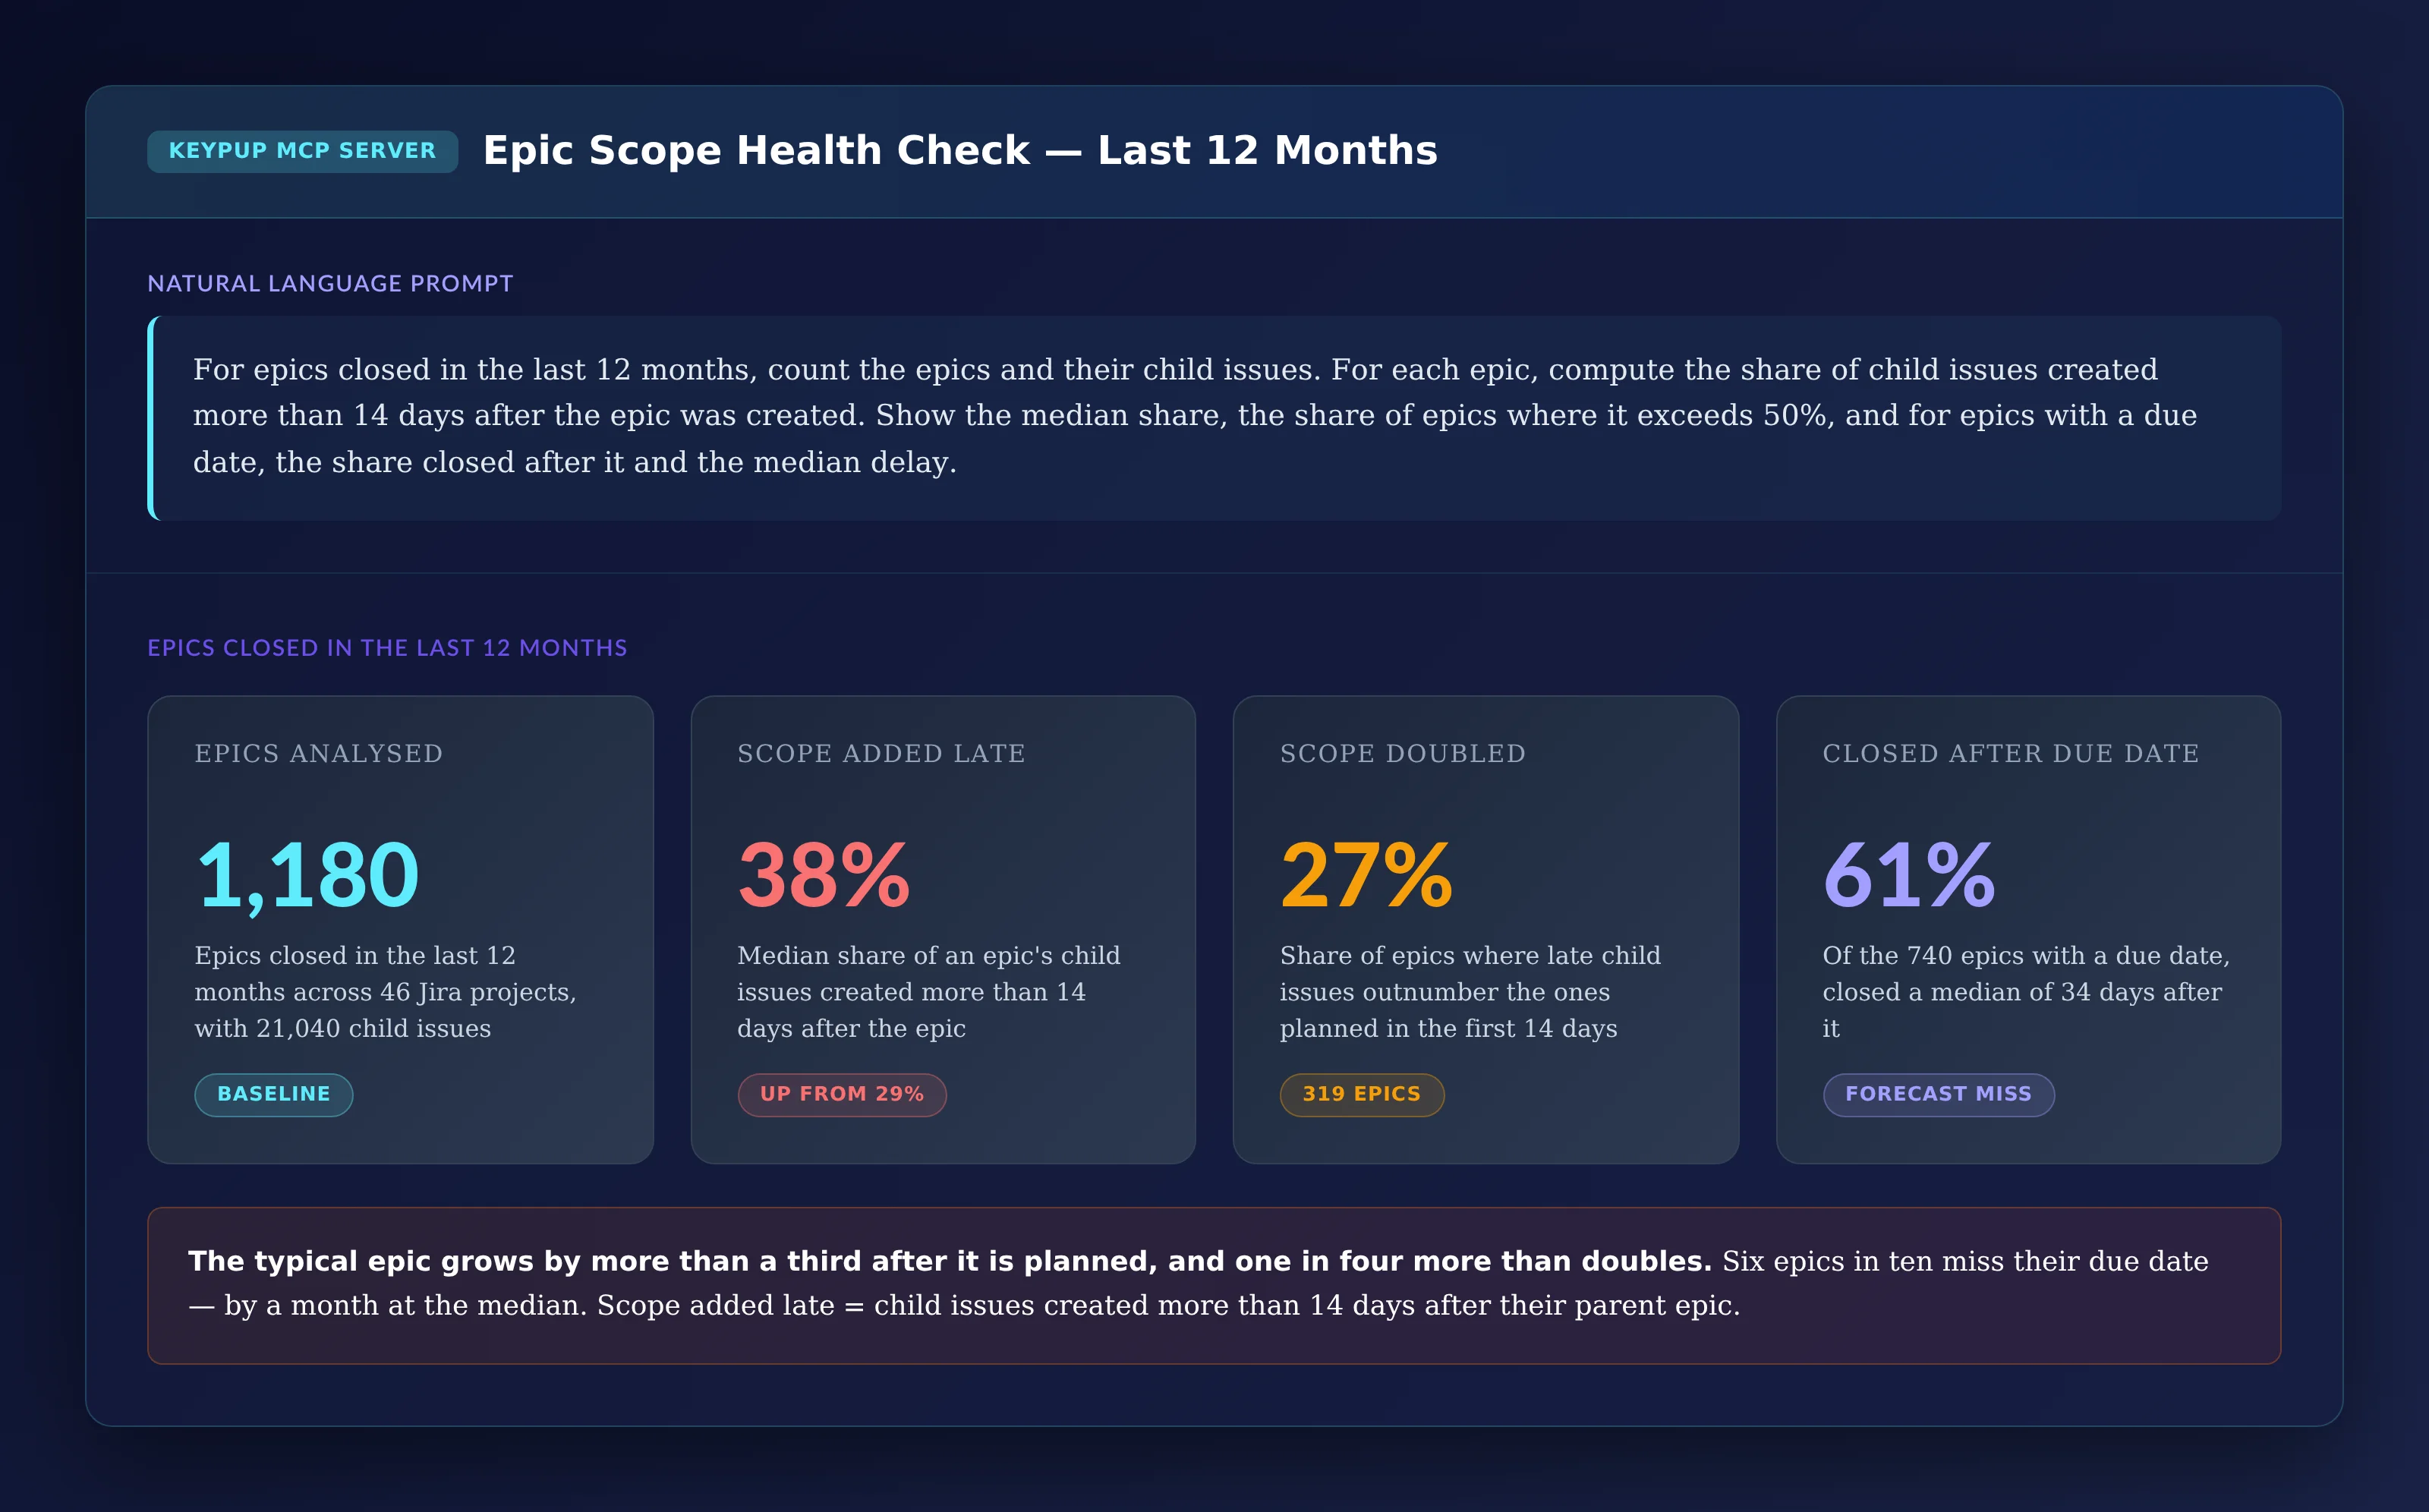
The first question: how much do epics grow after they are planned?
MCP Prompt:
For epics closed in the last 12 months, count the epics and
their child issues. For each epic, compute the share of child
issues created more than 14 days after the epic was created.
Show the median share, the share of epics where it exceeds
50%, and for epics with a due date, the share closed after it
and the median delay.
Output: Epic Scope Health Check — Last 12 Months
Key Insight: The typical epic grows by more than a third after it is planned, and one in four more than doubles. Six epics in ten miss their due date — by a month at the median.
2. Drawing the Real Burn-Up of One Epic
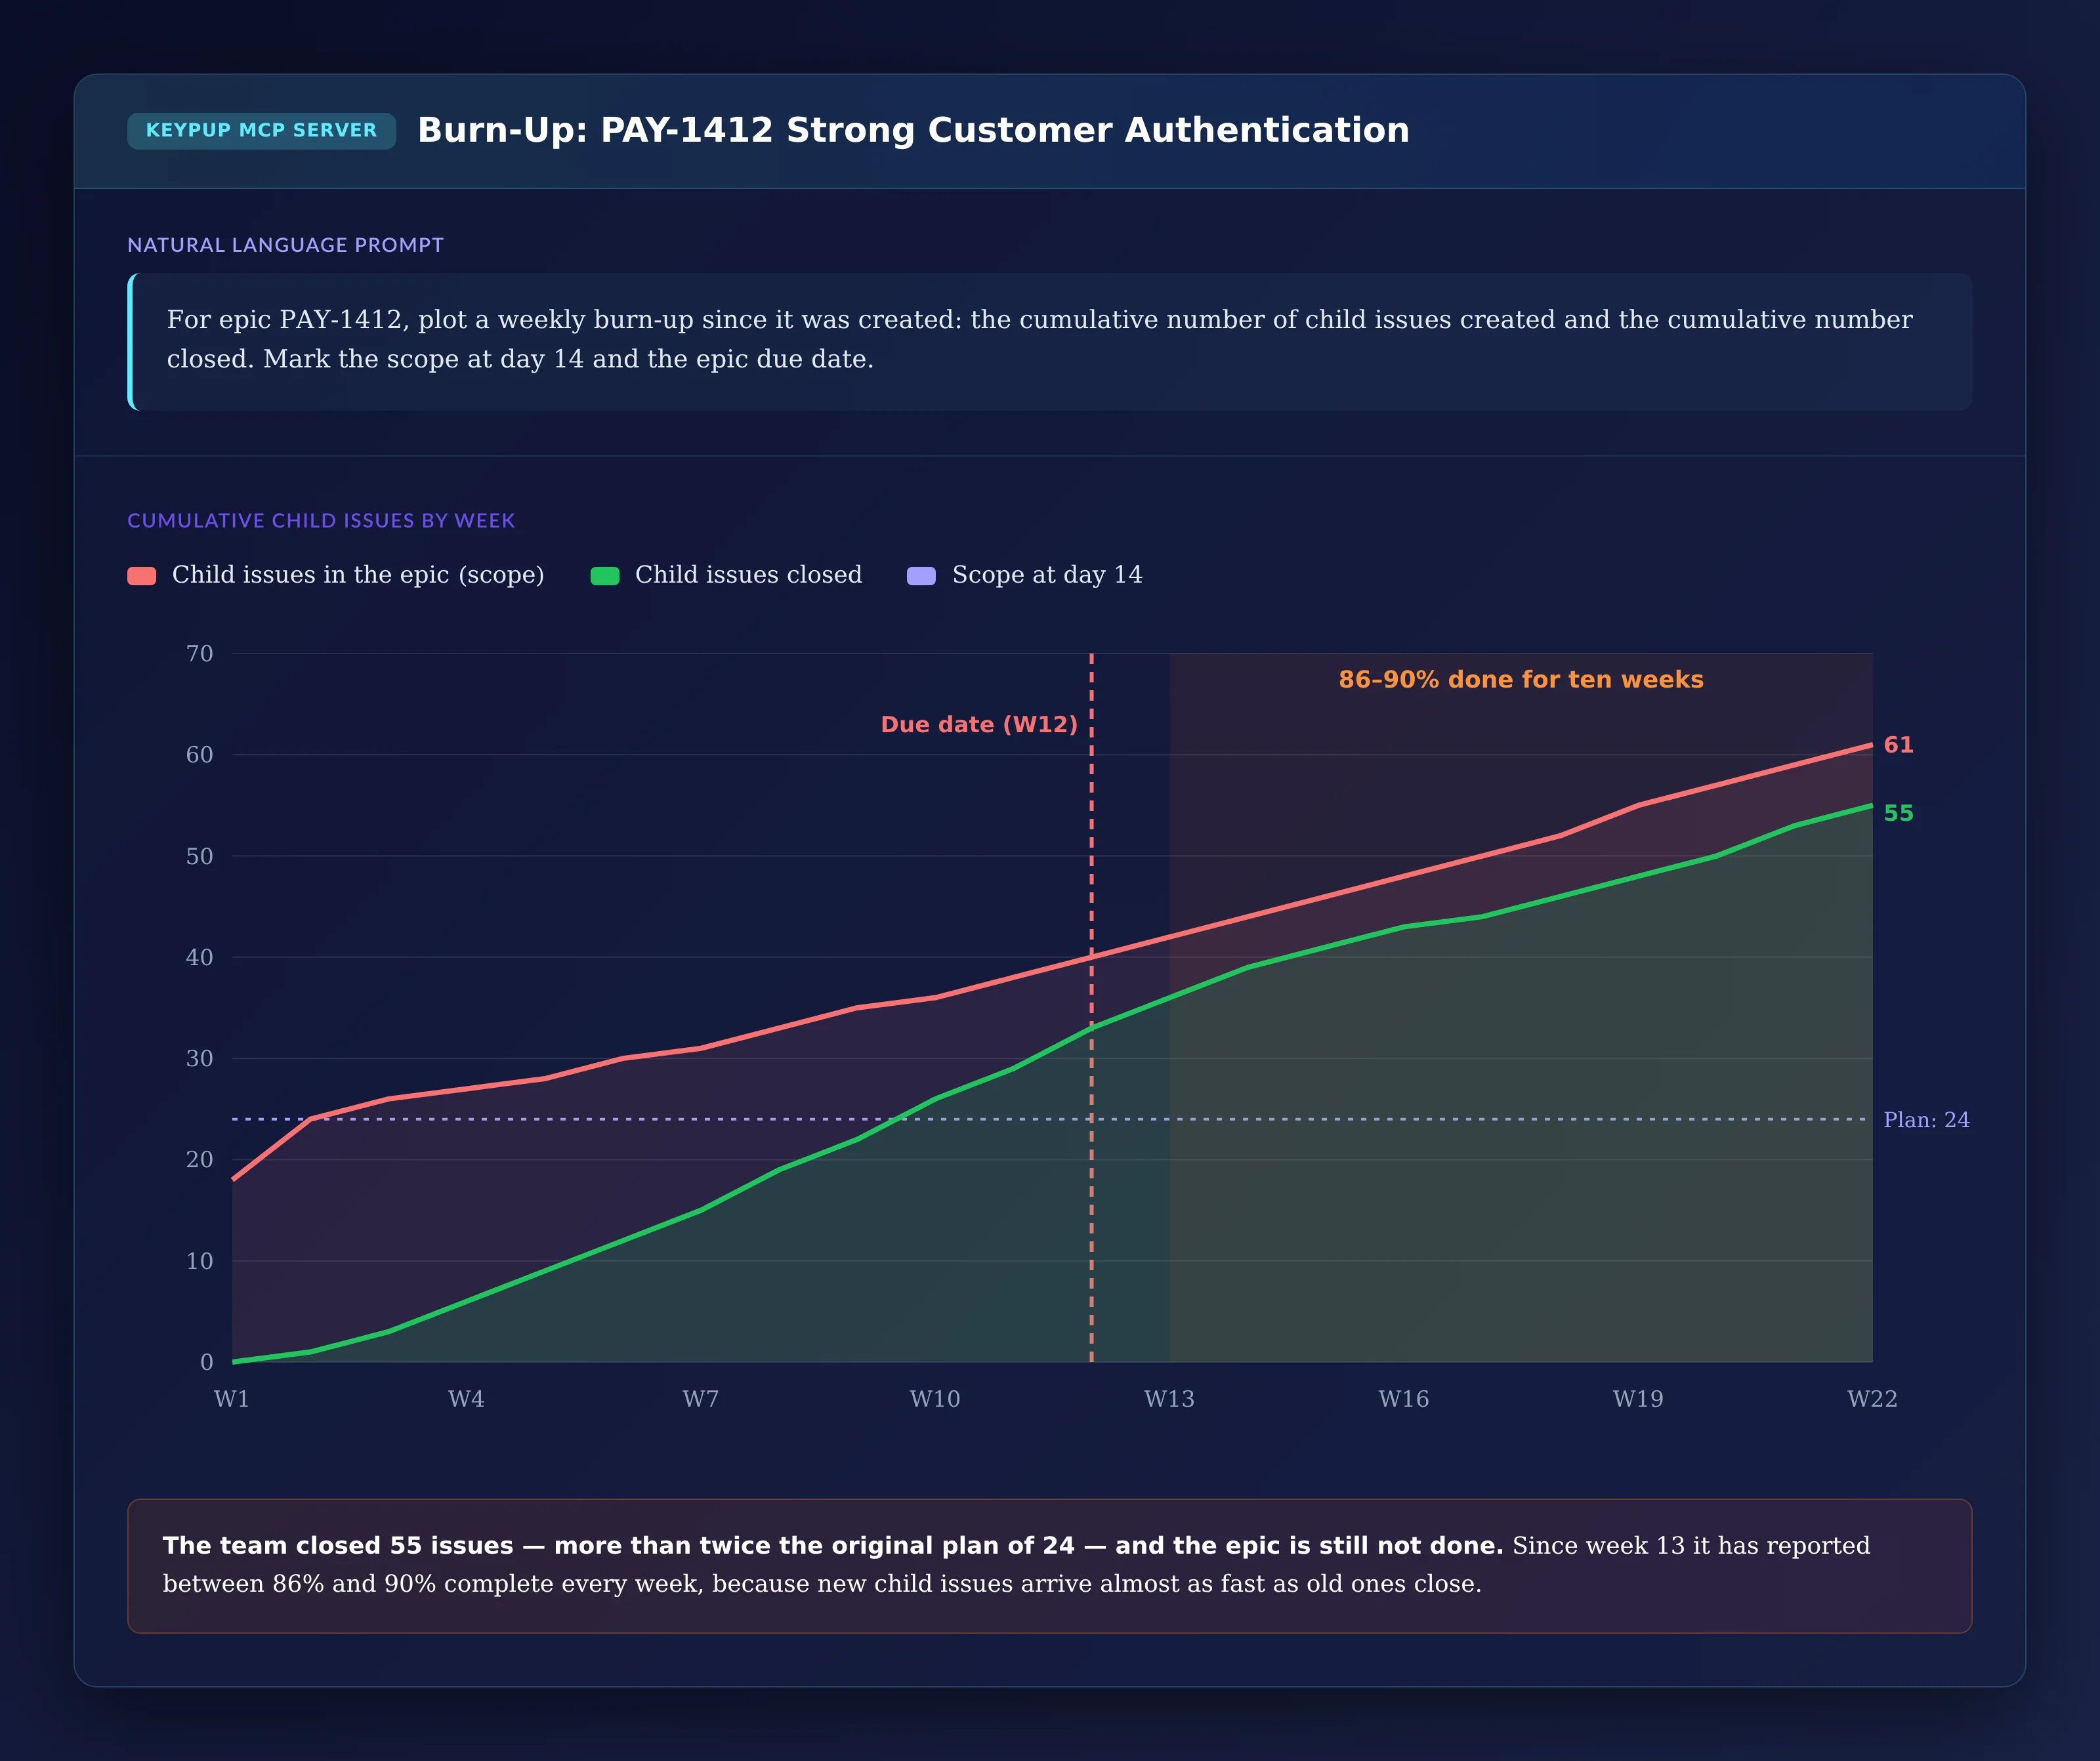
A percentage hides the shape. A burn-up shows scope and progress on the same chart.
MCP Prompt:
For epic PAY-1412, plot a weekly burn-up since it was created:
the cumulative number of child issues created and the
cumulative number closed. Mark the scope at day 14 and the
epic due date.
Output: Burn-Up of an "Almost Done" Epic
Key Insight: The team closed 55 issues — more than twice the original plan of 24 — and the epic is still not done. For ten weeks it has reported 86% to 90% complete. This is not a slow team; it is a target that keeps moving.
3. Tracking the Trend Quarter by Quarter
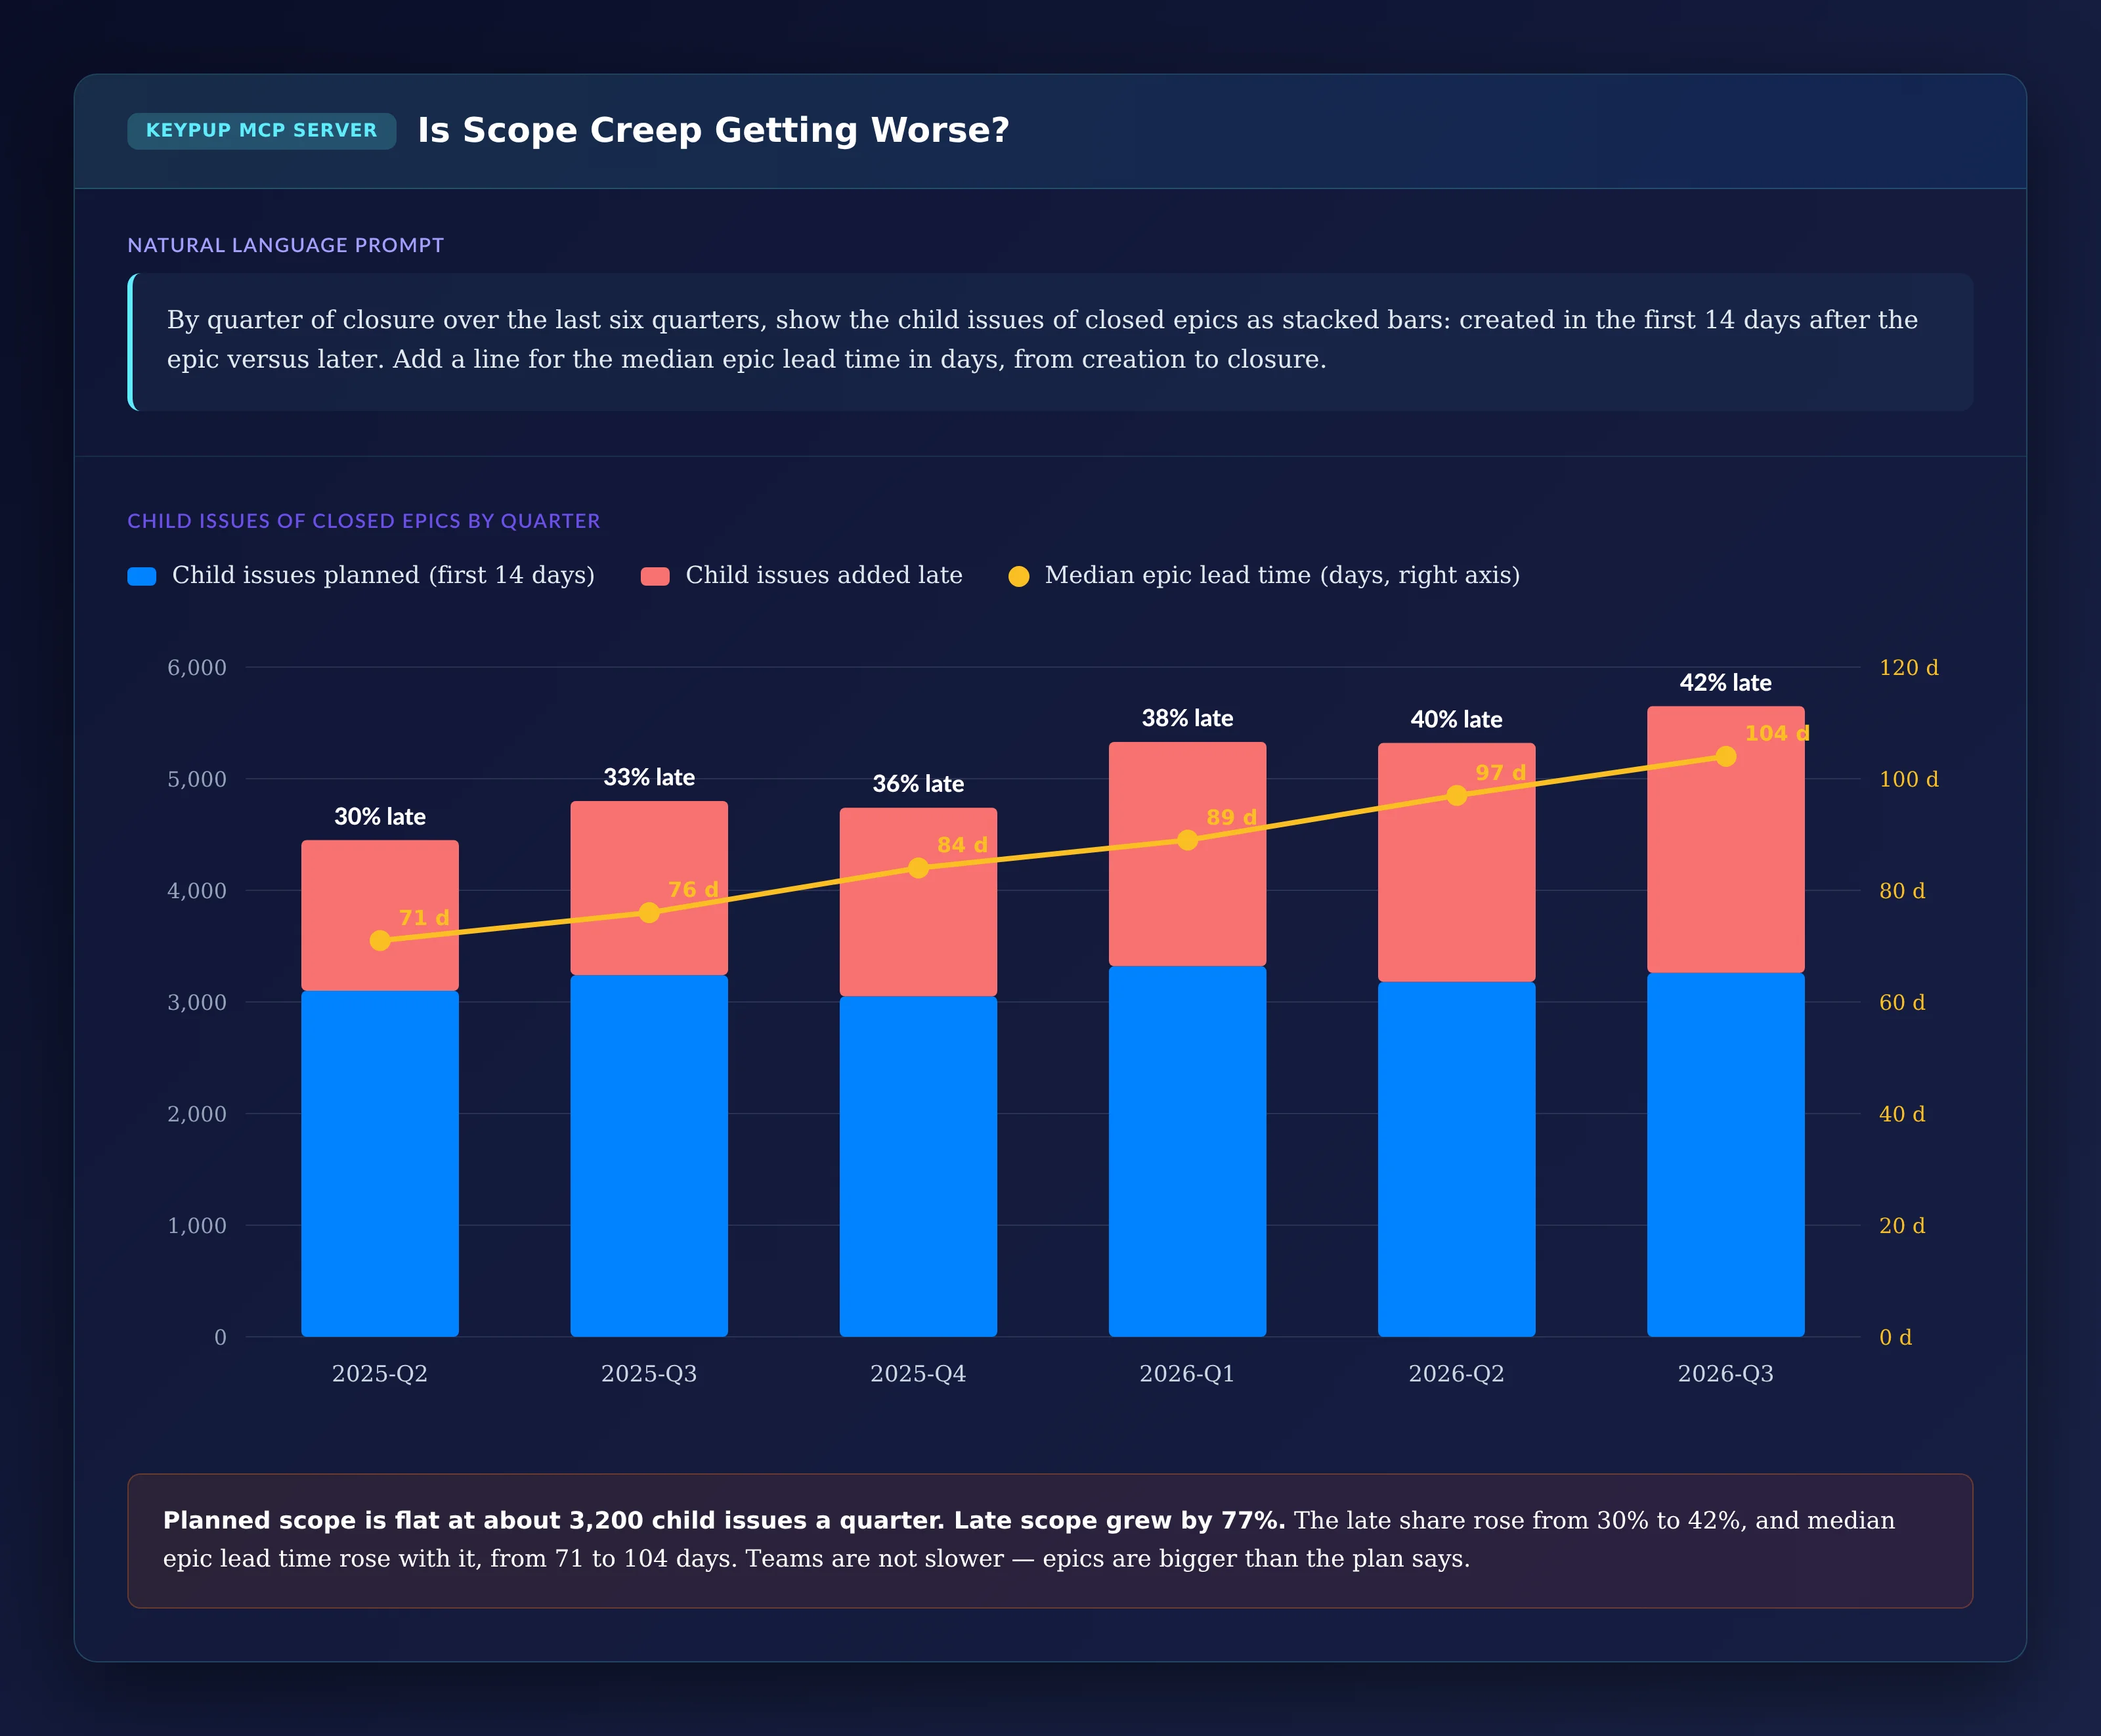
Is scope creep a few bad epics, or a growing habit?
MCP Prompt:
By quarter of closure over the last six quarters, show the
child issues of closed epics as stacked bars: created in the
first 14 days after the epic versus later. Add a line for the
median epic lead time in days, from creation to closure.
Output: Is Scope Creep Getting Worse?
Key Insight: Planned scope is flat. Late scope grew by 77% in six quarters, and median epic lead time grew with it, from 71 to 104 days. Teams aren't getting slower — epics are getting bigger than their plans.
4. Testing Whether Late Scope Predicts the Delay
If scope creep causes missed dates, epics that grow more should miss by more.
MCP Prompt:
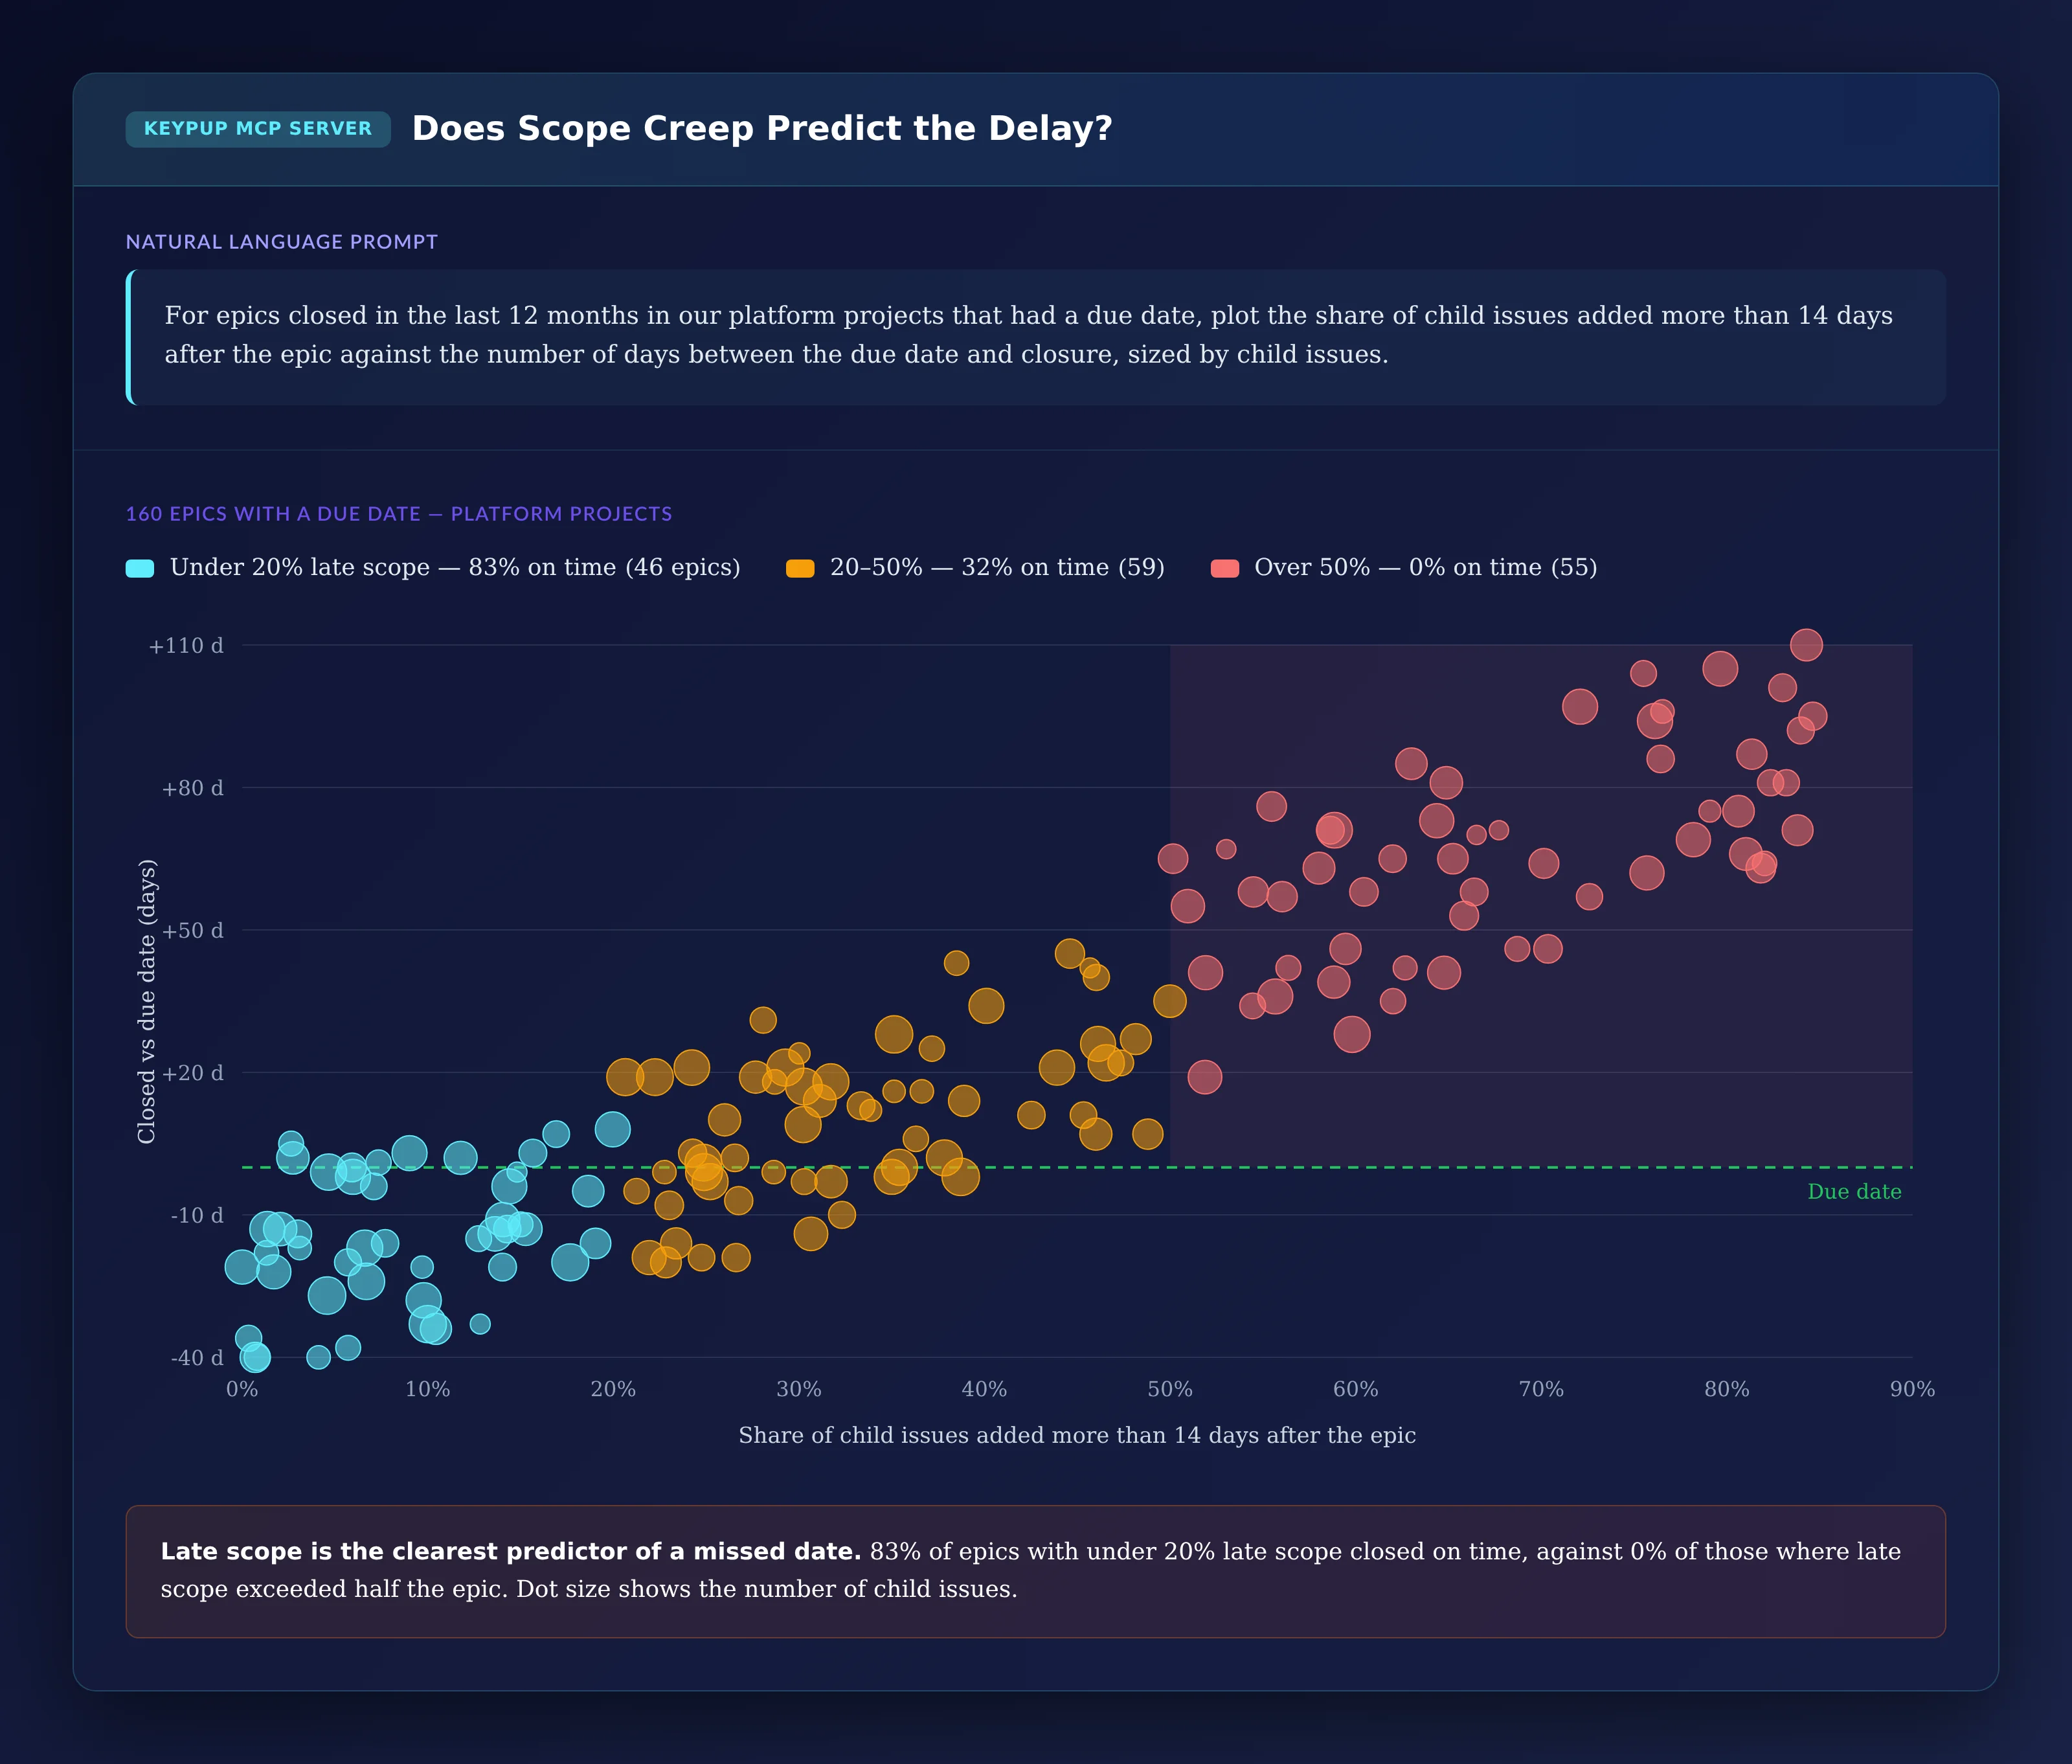
For epics closed in the last 12 months in our platform projects
that had a due date, plot the share of child issues added more
than 14 days after the epic against the number of days between
the due date and closure, sized by child issues.
Output: Does Scope Creep Predict the Delay?
Key Insight: Late scope is the clearest predictor of a missed date in this portfolio. 83% of epics with under 20% late scope closed on time; none of those where late scope exceeded half the epic did. "Our platform projects" assumes you've told your assistant which Jira projects belong to the platform group.
5. Finding What the Late Scope Is Made Of
Not all late scope is the same. New stories are a product decision; new bugs are a quality signal.
MCP Prompt:
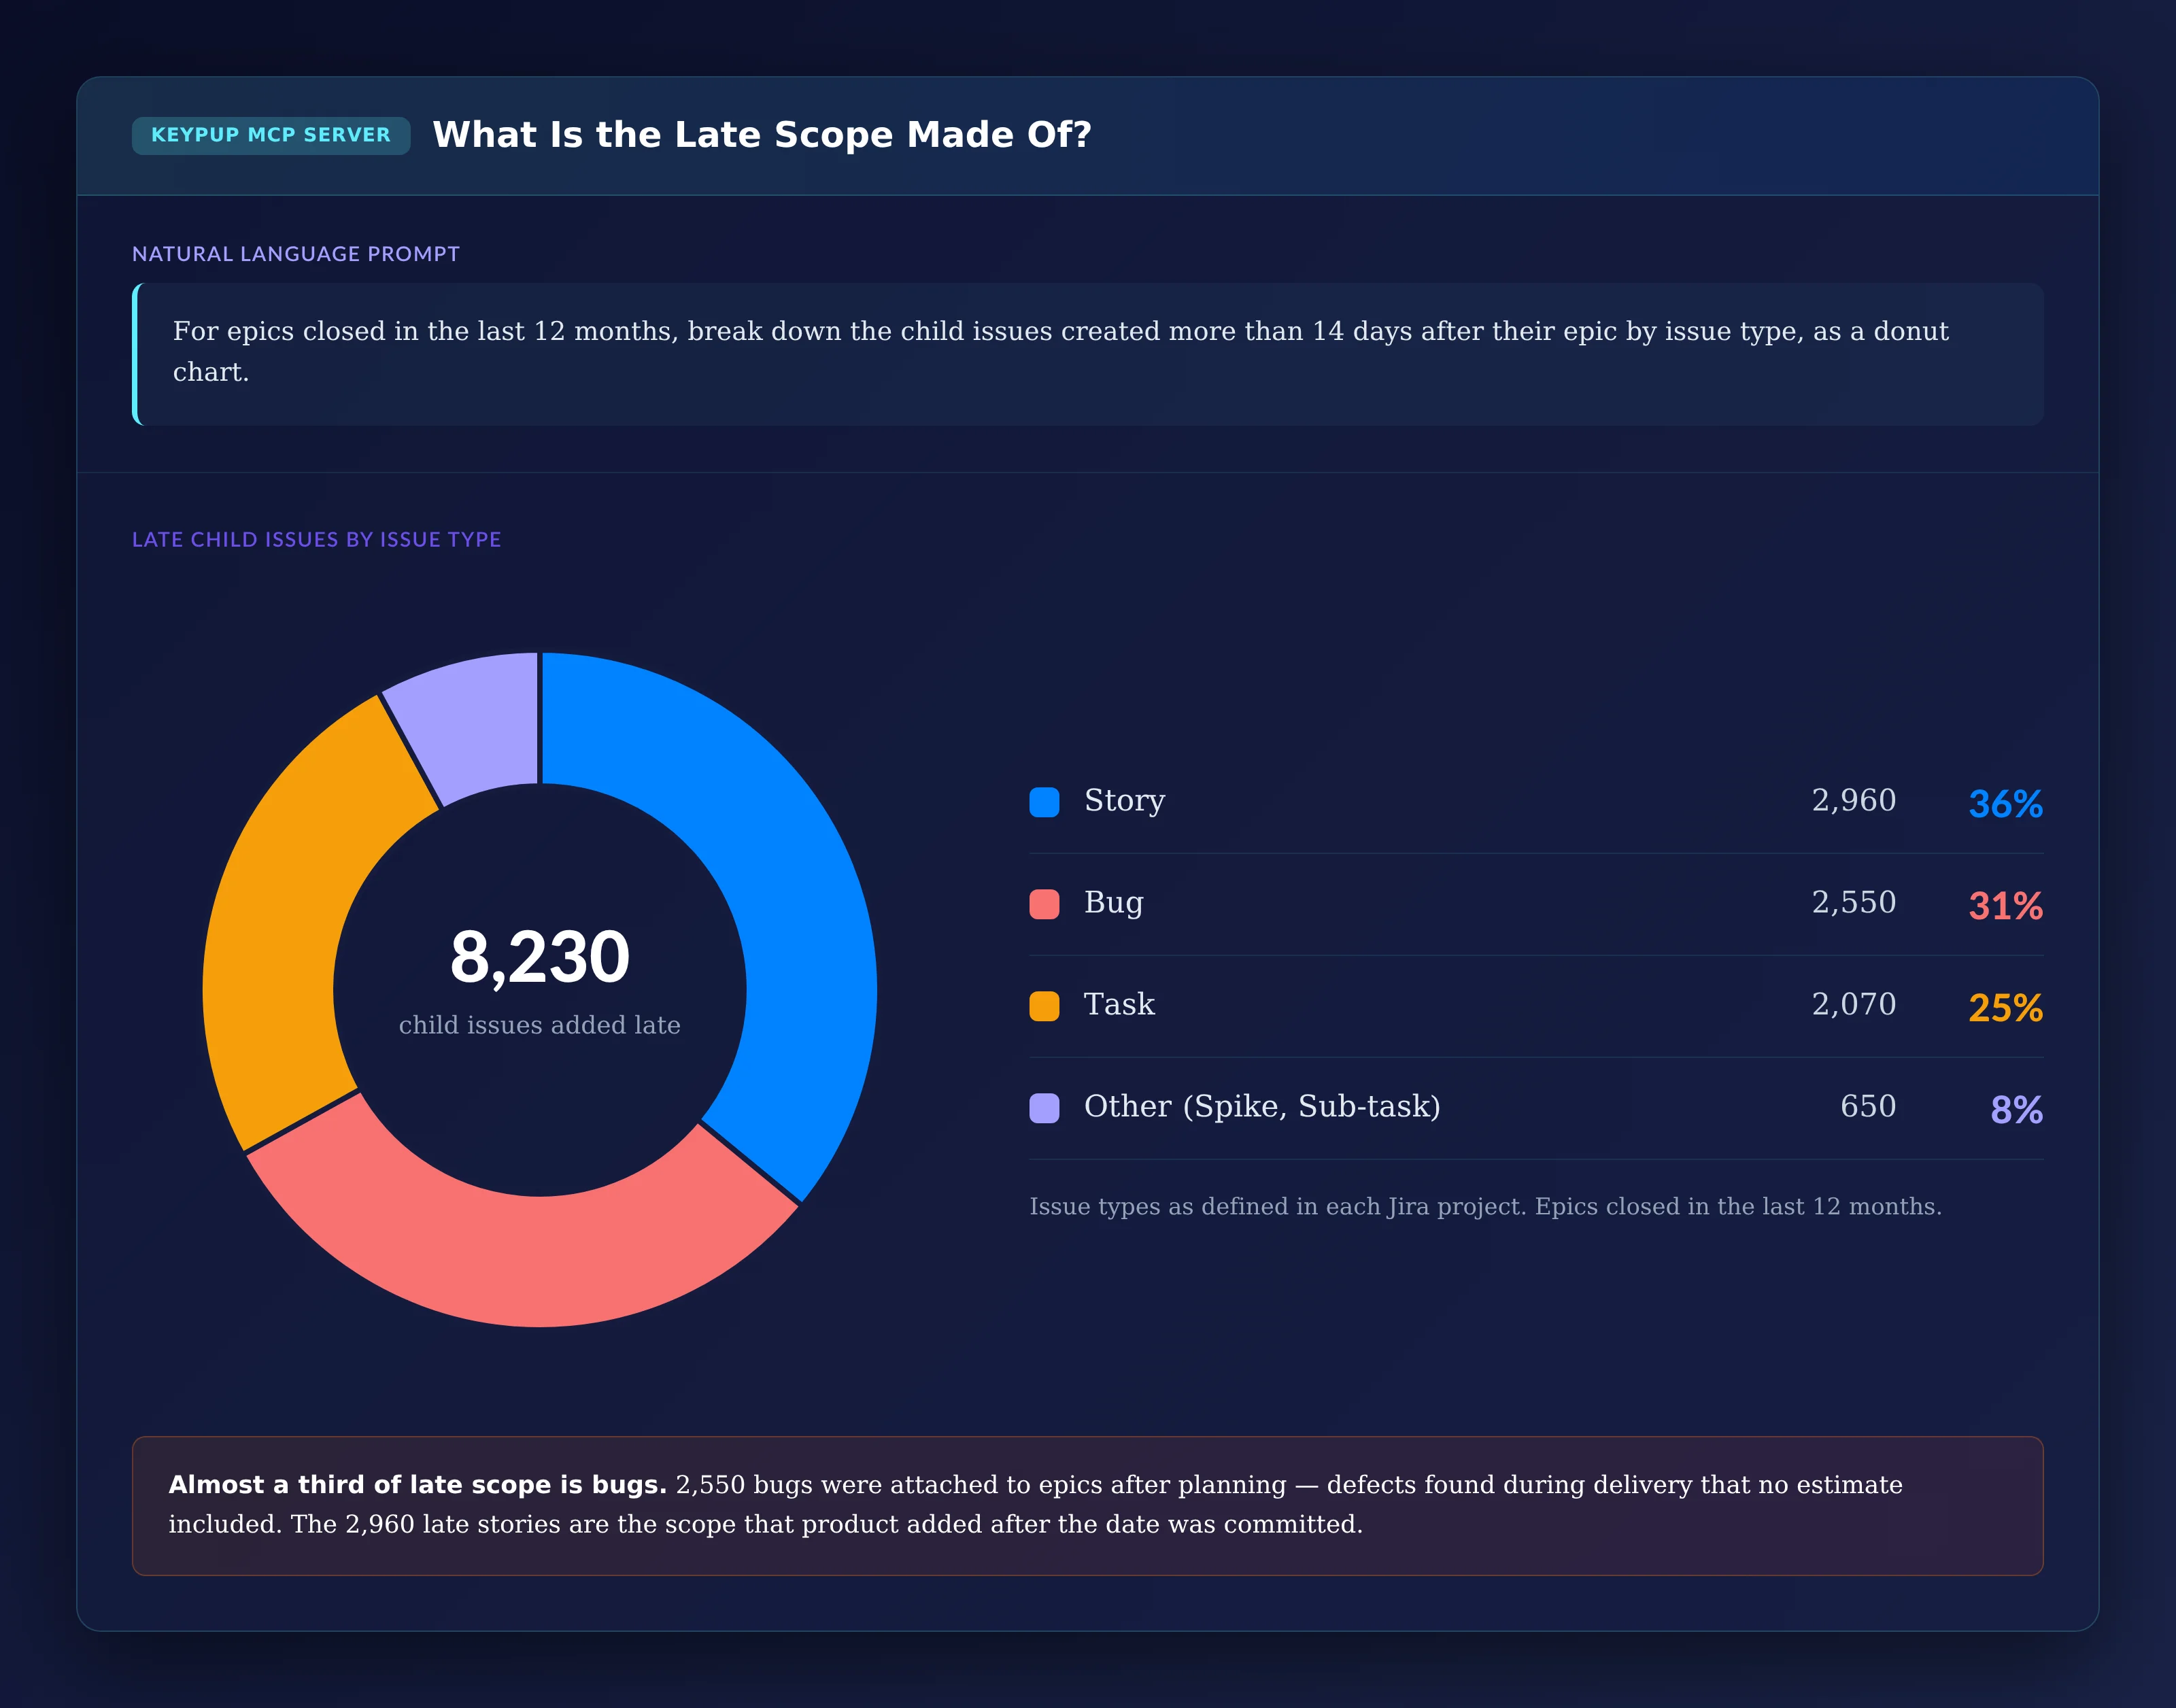
For epics closed in the last 12 months, break down the child
issues created more than 14 days after their epic by issue
type, as a donut chart.
Output: What Is the Late Scope Made Of?
Key Insight: Almost a third of late scope is bugs found during delivery — work no estimate included. The 2,960 late stories are requirements added after the date was committed: a conversation for product, not engineering.
6. Seeing Where Scope Creep Concentrates
Scope creep is rarely uniform. A heatmap by project shows where planning holds and where it doesn't.
MCP Prompt:
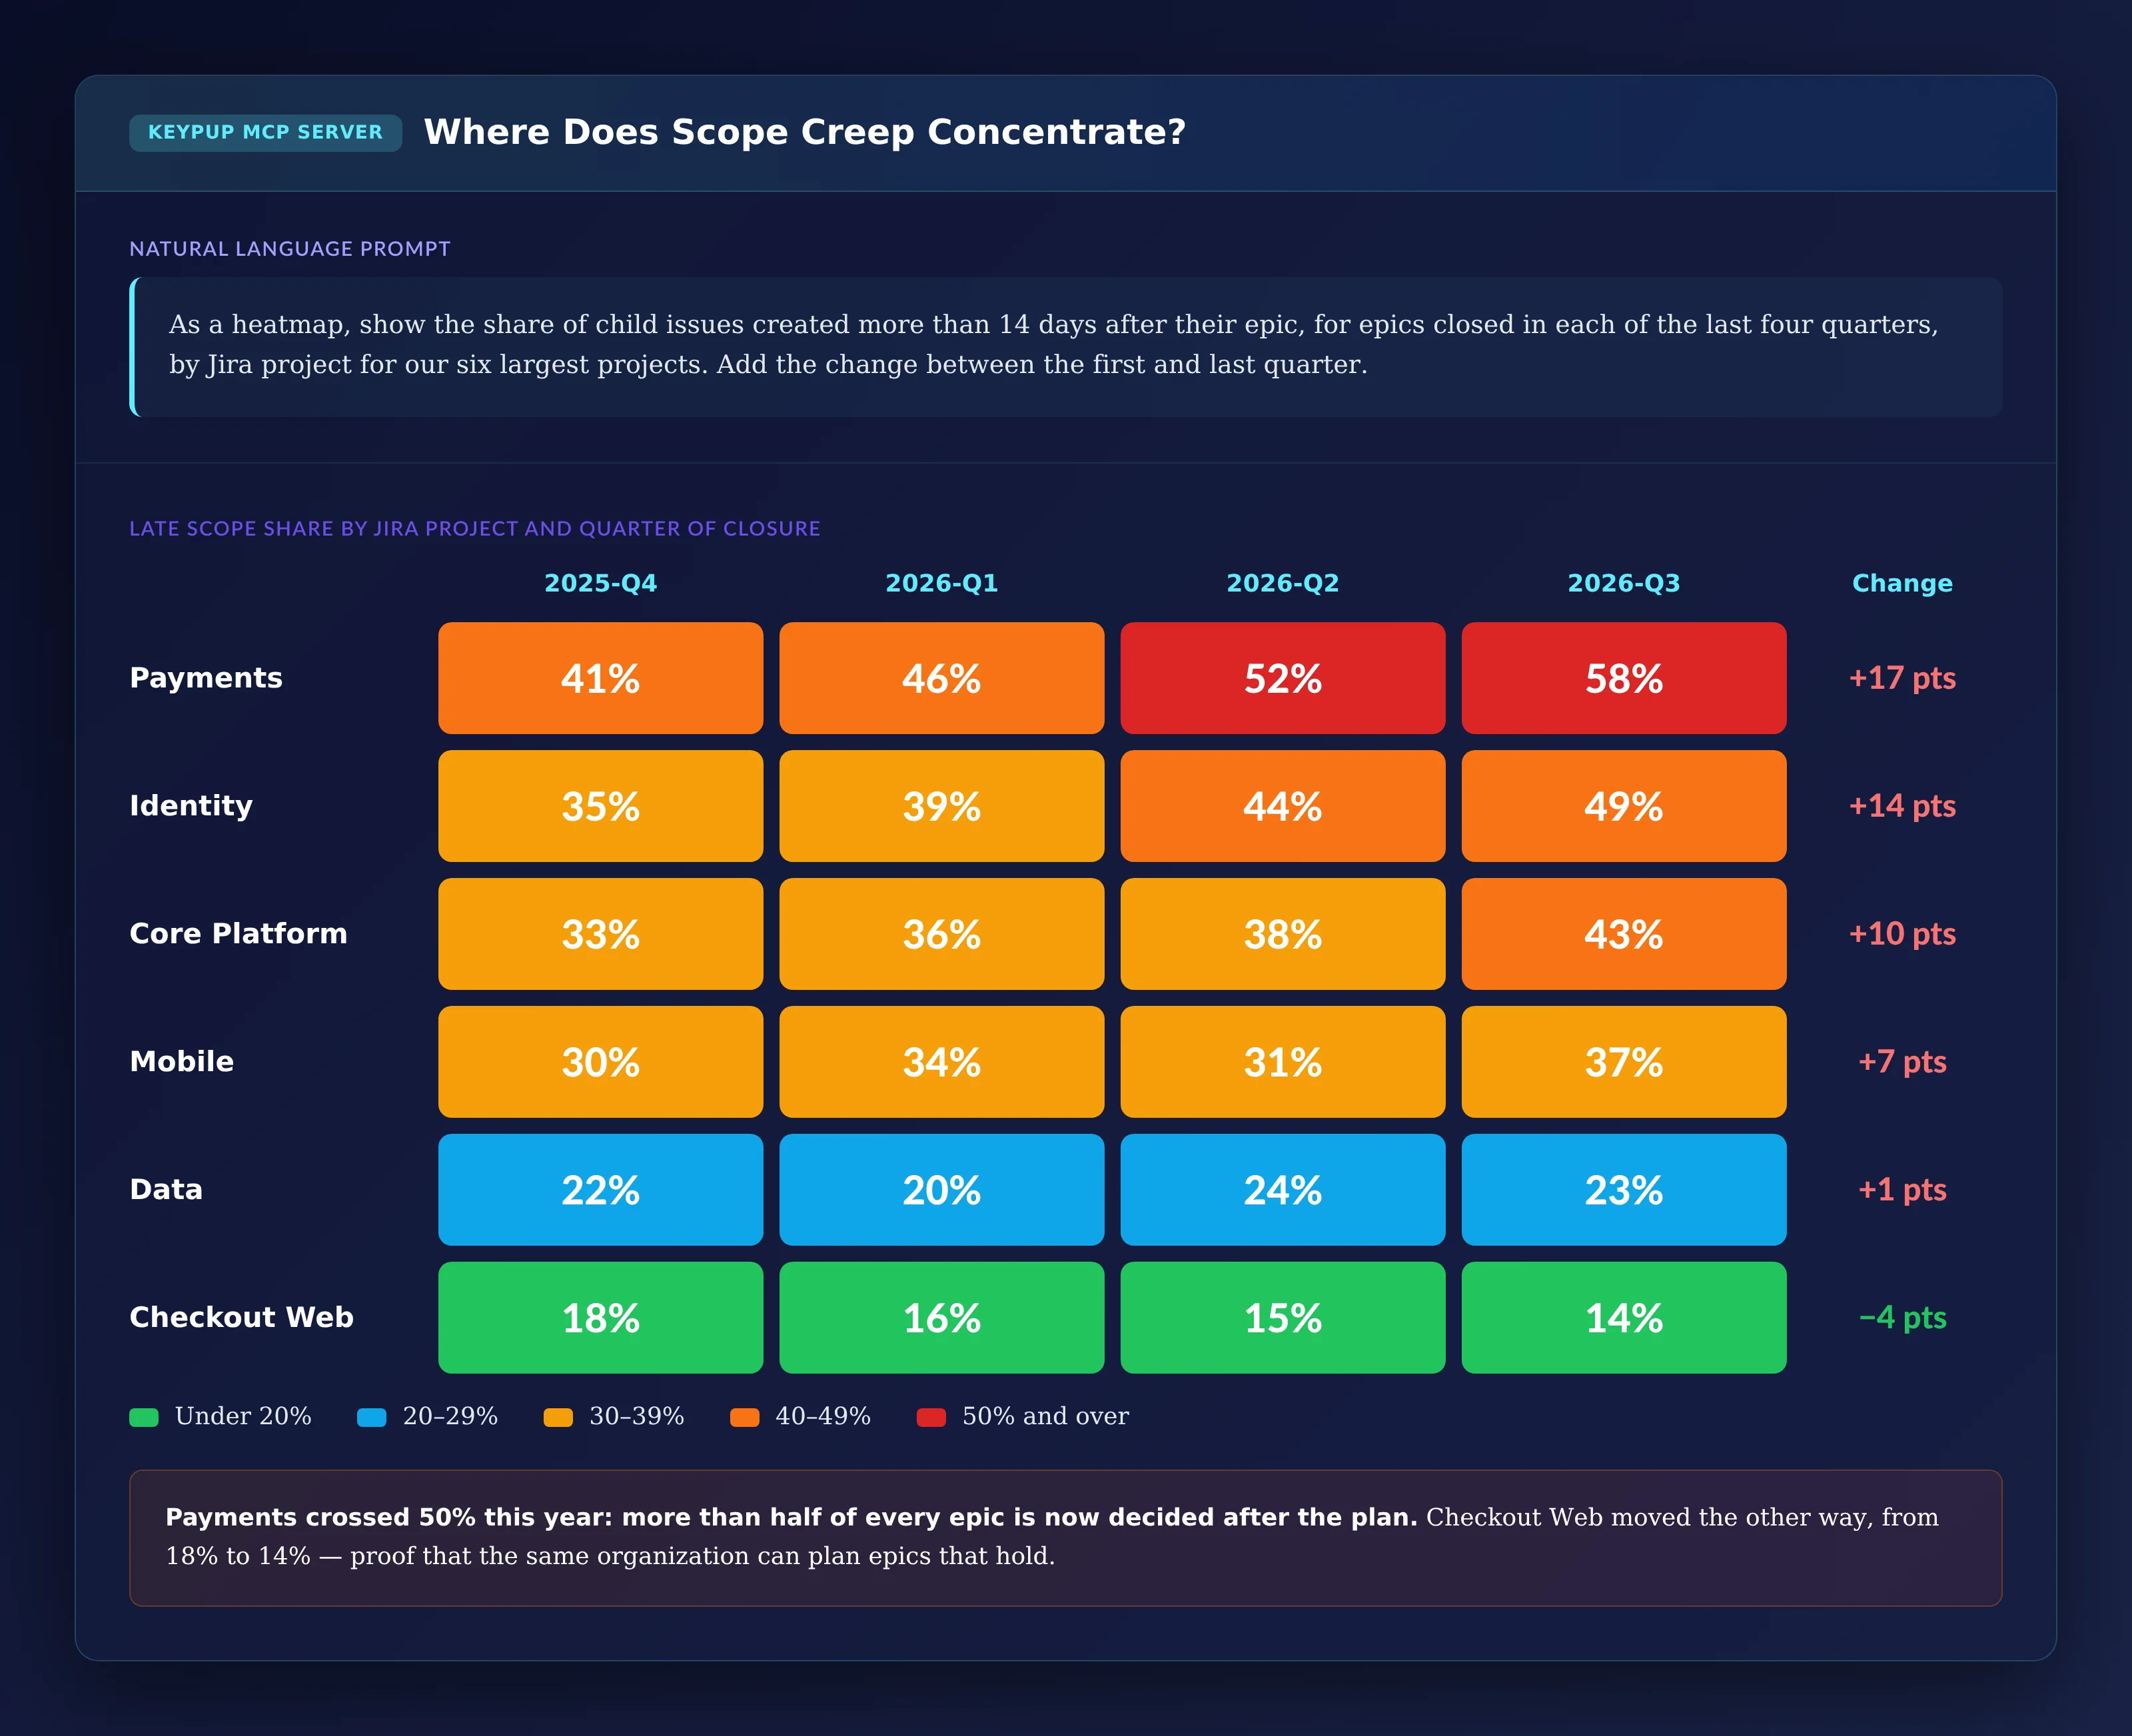
As a heatmap, show the share of child issues created more than
14 days after their epic, for epics closed in each of the last
four quarters, by Jira project for our six largest projects.
Add the change between the first and last quarter.
Output: Where Does Scope Creep Concentrate?
Key Insight: In Payments, more than half of every epic is now decided after planning. Checkout Web moved the other way — proof that the same organization can plan epics that hold.
7. Building the "Almost Done" Watchlist
The last step turns the analysis into something to act on this week: which open epics are near the finish line but still growing?
MCP Prompt:
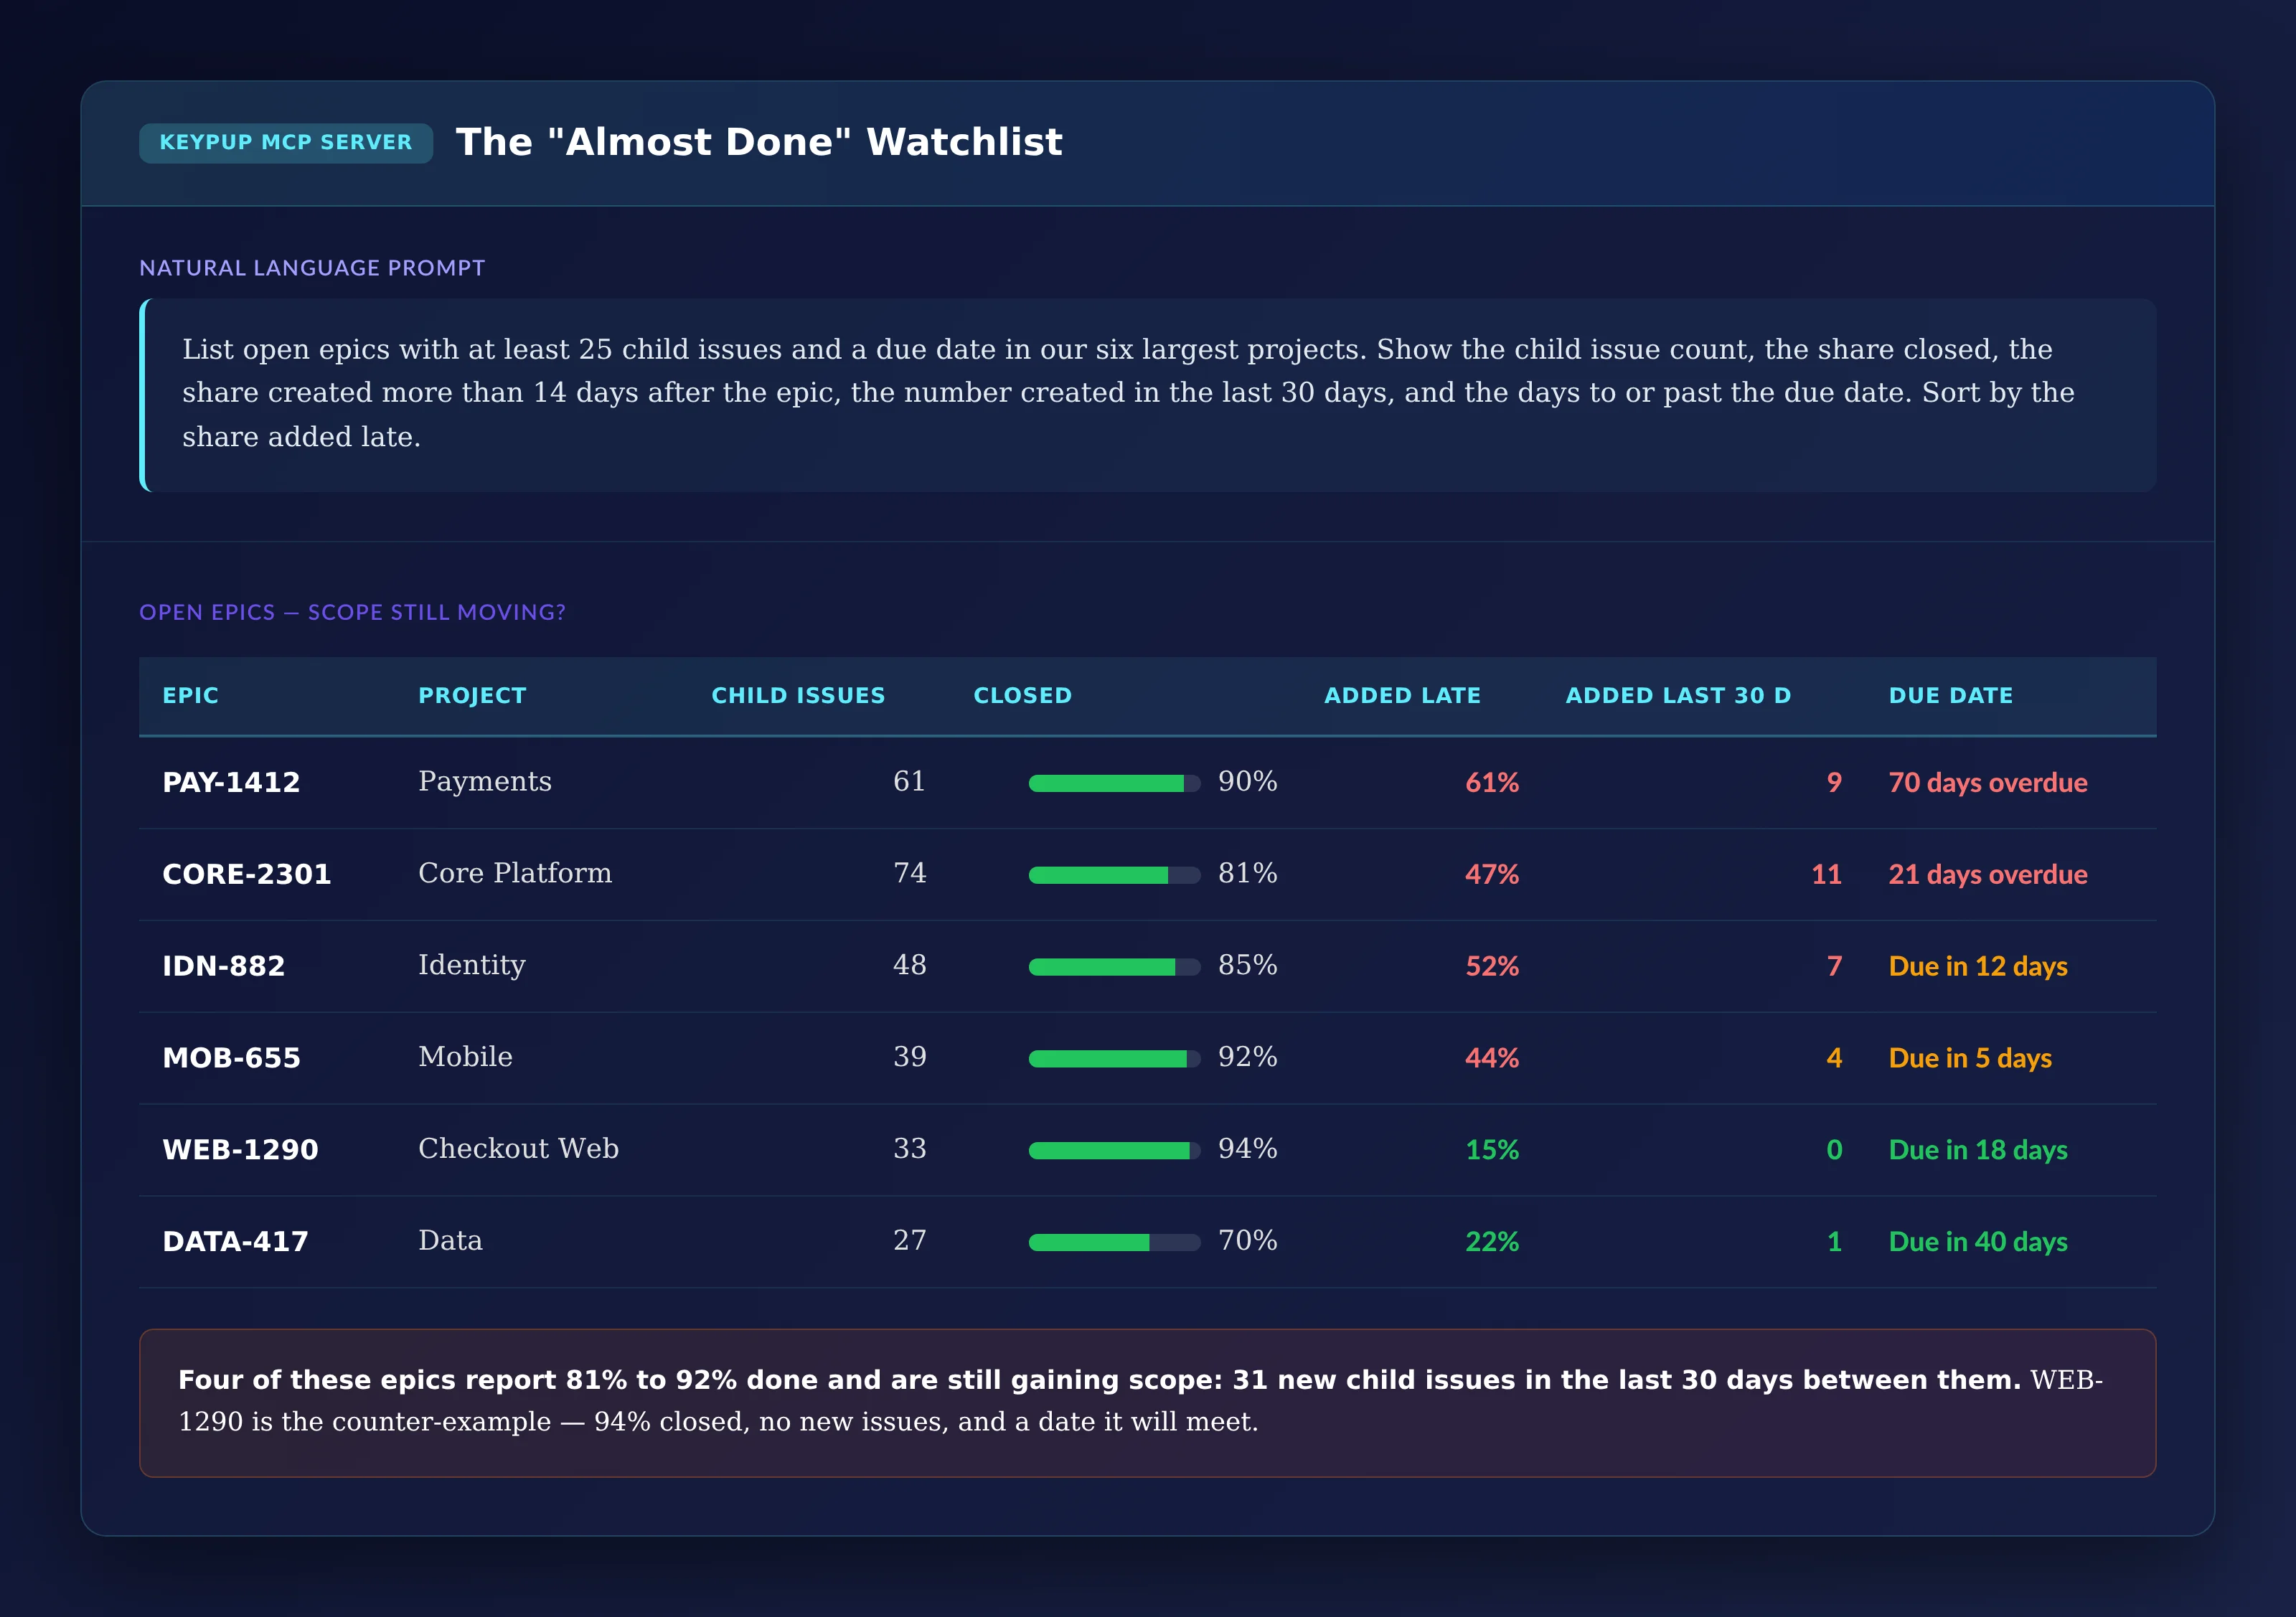
List open epics with at least 25 child issues and a due date in
our six largest projects. Show the child issue count, the share
closed, the share created more than 14 days after the epic, the
number created in the last 30 days, and the days to or past the
due date. Sort by the share added late.
Output: The "Almost Done" Watchlist
Epic
Project
Child Issues
Closed
Added Late
Added Last 30 d
Due Date
PAY-1412
Payments
61
90%
61%
9
70 days overdue
CORE-2301
Core Platform
74
81%
47%
11
21 days overdue
IDN-882
Identity
48
85%
52%
7
Due in 12 days
MOB-655
Mobile
39
92%
44%
4
Due in 5 days
WEB-1290
Checkout Web
33
94%
15%
0
Due in 18 days
DATA-417
Data
27
70%
22%
1
Due in 40 days
Key Insight: Four of these epics report 81% to 92% done and gained 31 new child issues between them in the last 30 days. They need a scope decision, not a status update. WEB-1290 is the counter-example: 94% closed, no new issues, and a date it will meet.
The Technical Implementation: What Keypup MCP Actually Reads
Every number above comes from fields Keypup already imports. It helps to be precise about what they are — and what they aren't.
Epics Come From Jira's Parent Field
Keypup imports each Jira issue with its parent issue, including the parent's key, type, project, state, creation date, closure date and due date. Filtering on parents whose type is "Epic" gives every epic with its child issues. Child issues that were never linked to an epic are not counted, so the analysis is only as complete as your teams' habit of linking issues to epics.
"Added Late" Is Based on Creation Dates
Keypup compares each child issue's creation date with its epic's creation date. That captures issues created for the epic after planning — the most common form of scope creep. It does not capture an existing backlog issue that was moved into the epic later, because Keypup records the current parent, not the date the parent was set. If your teams often re-parent old issues, treat the late share as a lower bound.
Burn-Ups Are Built From Cumulative Counts
The burn-up counts child issues by week of creation and by week of closure, cumulatively. Scope removed by deleting issues disappears from the history; scope removed by closing issues as "Won't Do" still counts as closed. Ask your assistant to exclude resolutions or workflow statuses your teams use for dropped work, if they appear in the issue's status.
Due Dates and Issue Types Come From Your Jira Configuration
Date-related prompts use the epic's due date field, so they only cover epics where a due date is set. If your teams record target dates in a custom field instead, Keypup imports Jira custom fields too, and you can point the prompt at that field. Issue types — Story, Bug, Task — are the ones defined in each Jira project.
Projects and Teams Come From Jira Projects
The heatmap groups epics by Jira project. If your teams share projects, group by a team or component custom field instead, provided your Jira projects use one.
Real-World Impact: Enterprise Case Studies
Case Study 1: European Insurance Group
Before Keypup MCP:
700 engineers across 30 Jira projects
Two consecutive quarters with more than half of roadmap epics delivered late
An estimation training program that changed nothing
After Keypup MCP:
The scope health check showed 41% of child issues were added after planning, while the planned scope was delivered close to the original estimates
The issue type breakdown showed a third of late scope was bugs, which led to a QA step before epic kick-off rather than more estimation training
Planning changed to commit dates at day 14, not day 1, once each epic's scope had settled; the share of epics closed after their due date fell from 58% to 31% in three quarters
"We spent a year trying to make engineers estimate better. The data showed the estimates were fine — we were estimating an epic and then delivering one twice the size. That changed the conversation with product overnight."
— CTO, European Insurance Group
Case Study 2: North American Retail Platform
Before Keypup MCP:
1,500 engineers, 400+ open epics at any time
A weekly portfolio review based on the progress percentage of each epic
Recurring surprises when "90% done" epics missed their launch dates
After Keypup MCP:
The "almost done" watchlist replaced the progress percentage in the weekly portfolio review
Epics adding more than five child issues in 30 days were flagged for a scope decision with the product owner before the date was at risk
Launch dates missed by more than two weeks fell by half, measured by re-running the scatter plot every quarter
"The progress bar was telling us every epic was nearly done. The burn-up showed which ones were never going to be. Now we argue about scope in week three, not in the week of the launch."
— VP Engineering, North American Retail Platform
Implementation: Getting Started with Keypup MCP
1. Connect Jira and Your Git Platforms
Connect Jira and GitHub, GitLab, Bitbucket or Azure DevOps to Keypup. Issues, their parent epics, issue types, due dates and custom fields are imported automatically.
2. Check How Issues Are Linked to Epics
Run a quick count of issues with and without a parent epic per project. If many issues have no epic, agree on linking them before relying on the scope numbers.
3. Agree on Your Planning Window
Decide when an epic's scope is considered "planned" — 14 days after creation is a common starting point — and whether due dates live in Jira's due date field or a custom field.
4. Connect the MCP Server to Your AI Assistant
Follow the MCP documentation to connect Keypup to Claude, ChatGPT, Cursor or any MCP-compatible assistant.
5. Review Scope Alongside Progress Every Week
Run the health check and the quarterly trend to set a baseline. Then replace the progress percentage in your portfolio review with the "almost done" watchlist, and treat a growing late share as a scope decision to make with product — before the due date makes it for you.
Frequently Asked Questions
How do you measure scope creep in Jira?
Compare each epic's child issues with the epic's creation date. Child issues created after a planning window — for example 14 days — are scope added after planning. Their share of all child issues is the epic's scope creep. Keypup MCP computes this from the parent epic and creation date of every Jira issue.
Why do epics stay at 90% done for weeks?
Because progress is usually shown as closed issues divided by all issues. When new child issues are added about as fast as existing ones are closed, the ratio stays flat even though the team is delivering. A burn-up chart that shows scope and closed issues separately makes this visible.
Is scope creep always bad?
No. Learning during delivery is normal, and some late scope is the right call. The problem is committing to dates as if scope were fixed. Measuring how much scope typically changes lets you plan with that in mind — for example by committing dates once scope has settled.
What is a normal level of scope creep?
There is no universal benchmark. The trend and the spread between projects matter more than the absolute value: a project whose late share rises every quarter, or is far above its peers, has a planning problem worth investigating.
The Bottom Line
Roadmap dates don't slip because teams are slow. They slip because epics grow after the date is set. Keypup MCP shows by how much, where and why:
✅ Measuring how much scope is added after each epic is planned ✅ Drawing real burn-ups that separate scope from progress ✅ Tracking the trend of late scope and epic lead time by quarter ✅ Showing whether late scope predicts a missed due date ✅ Breaking late scope down into stories, bugs and tasks ✅ Comparing projects to find where planning holds and where it doesn't ✅ Listing the "almost done" epics that are still growing
Ready to find out how much of your roadmap is decided after the plan? Connect the Keypup MCP Server and ask your AI assistant.
Ready to Transform Your Analytics?
Join teams already using AI to make data-driven decisions faster than
ever.
Why do some Jira tickets bounce between engineers and teams for weeks before anyone fixes them? Learn what engineering leaders on Reddit say about ticket reassignment churn at enterprise scale, and how Keypup MCP uses previous assignees, assignment dates, issue types, projects and linked pull request authors to measure how often tickets change hands, what each hand-off costs in cycle time, who actually wrote the code and which open tickets are being passed around right now.
Compare the 6 best engineering analytics tools for Jira and Git in 2026 — Keypup, LinearB, Jellyfish, Swarmia, Faros AI and Pluralsight Flow — across Git and Jira unification, DORA Metrics and cycle time, dashboard customization, AI and natural language, integration breadth, setup speed and security. Find out which platform turns your code and ticketing data into one reporting layer with prescriptive recommendations.
Why do pull requests sit for days before anyone reviews them? Learn what engineering leaders on Reddit say about code review bottlenecks at enterprise scale, and how Keypup MCP uses review request dates, first review dates, approvals, reviewers and lines changed to measure your wait for first review, break cycle time into phases, find when requests get stuck, show who carries the review load and list the pull requests waiting right now.