6 Best Engineering Metrics Software for Fast Setup (2026)
Compare the 6 best engineering metrics software for fast setup in 2026 — Keypup, LinearB, Swarmia, Jellyfish, Faros and Harness SEI — across setup speed, integration overhead, dashboard flexibility, delivery metrics coverage, AI capabilities and data security. Find out which platform gets a mid-market engineering team from connecting Git and Jira to actionable delivery metrics in minutes, not months.
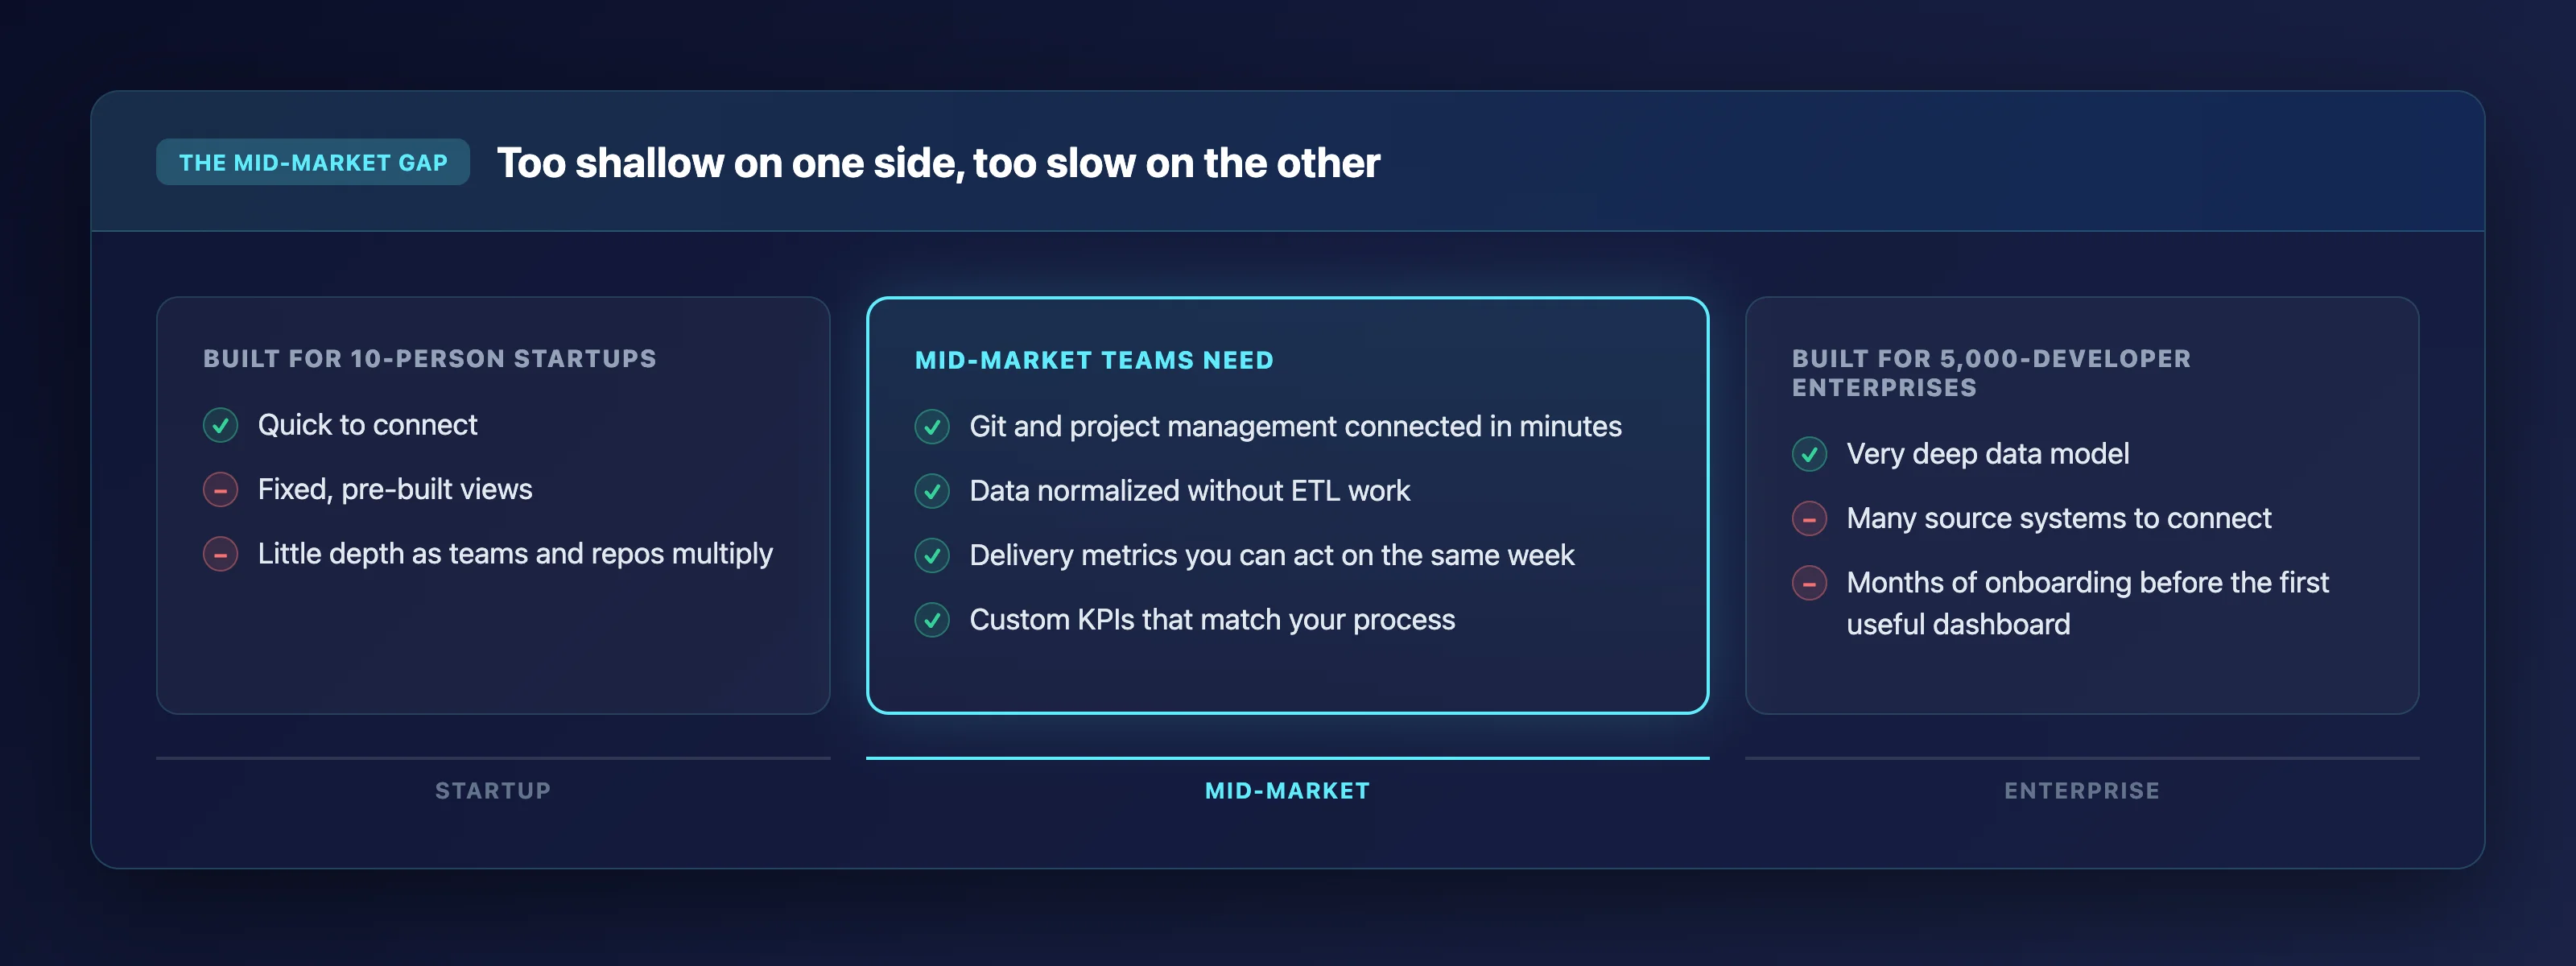
Mid-market engineering teams face a specific problem when evaluating engineering metrics software. The tools built for 10-person startups lack the depth you need, and the platforms designed for 5,000-developer enterprises demand months of onboarding before you see your first useful dashboard.
You need something in between: a platform that connects to your Git and project management tools in minutes, normalizes the data without lengthy ETL work, and surfaces delivery metrics you can act on the same week. Keypup delivers exactly that for mid-market teams.
This comparison evaluates six engineering metrics platforms across setup speed, integration overhead, dashboard flexibility, and delivery metrics coverage. Each review is written with engineering leaders at mid-market software firms in mind.
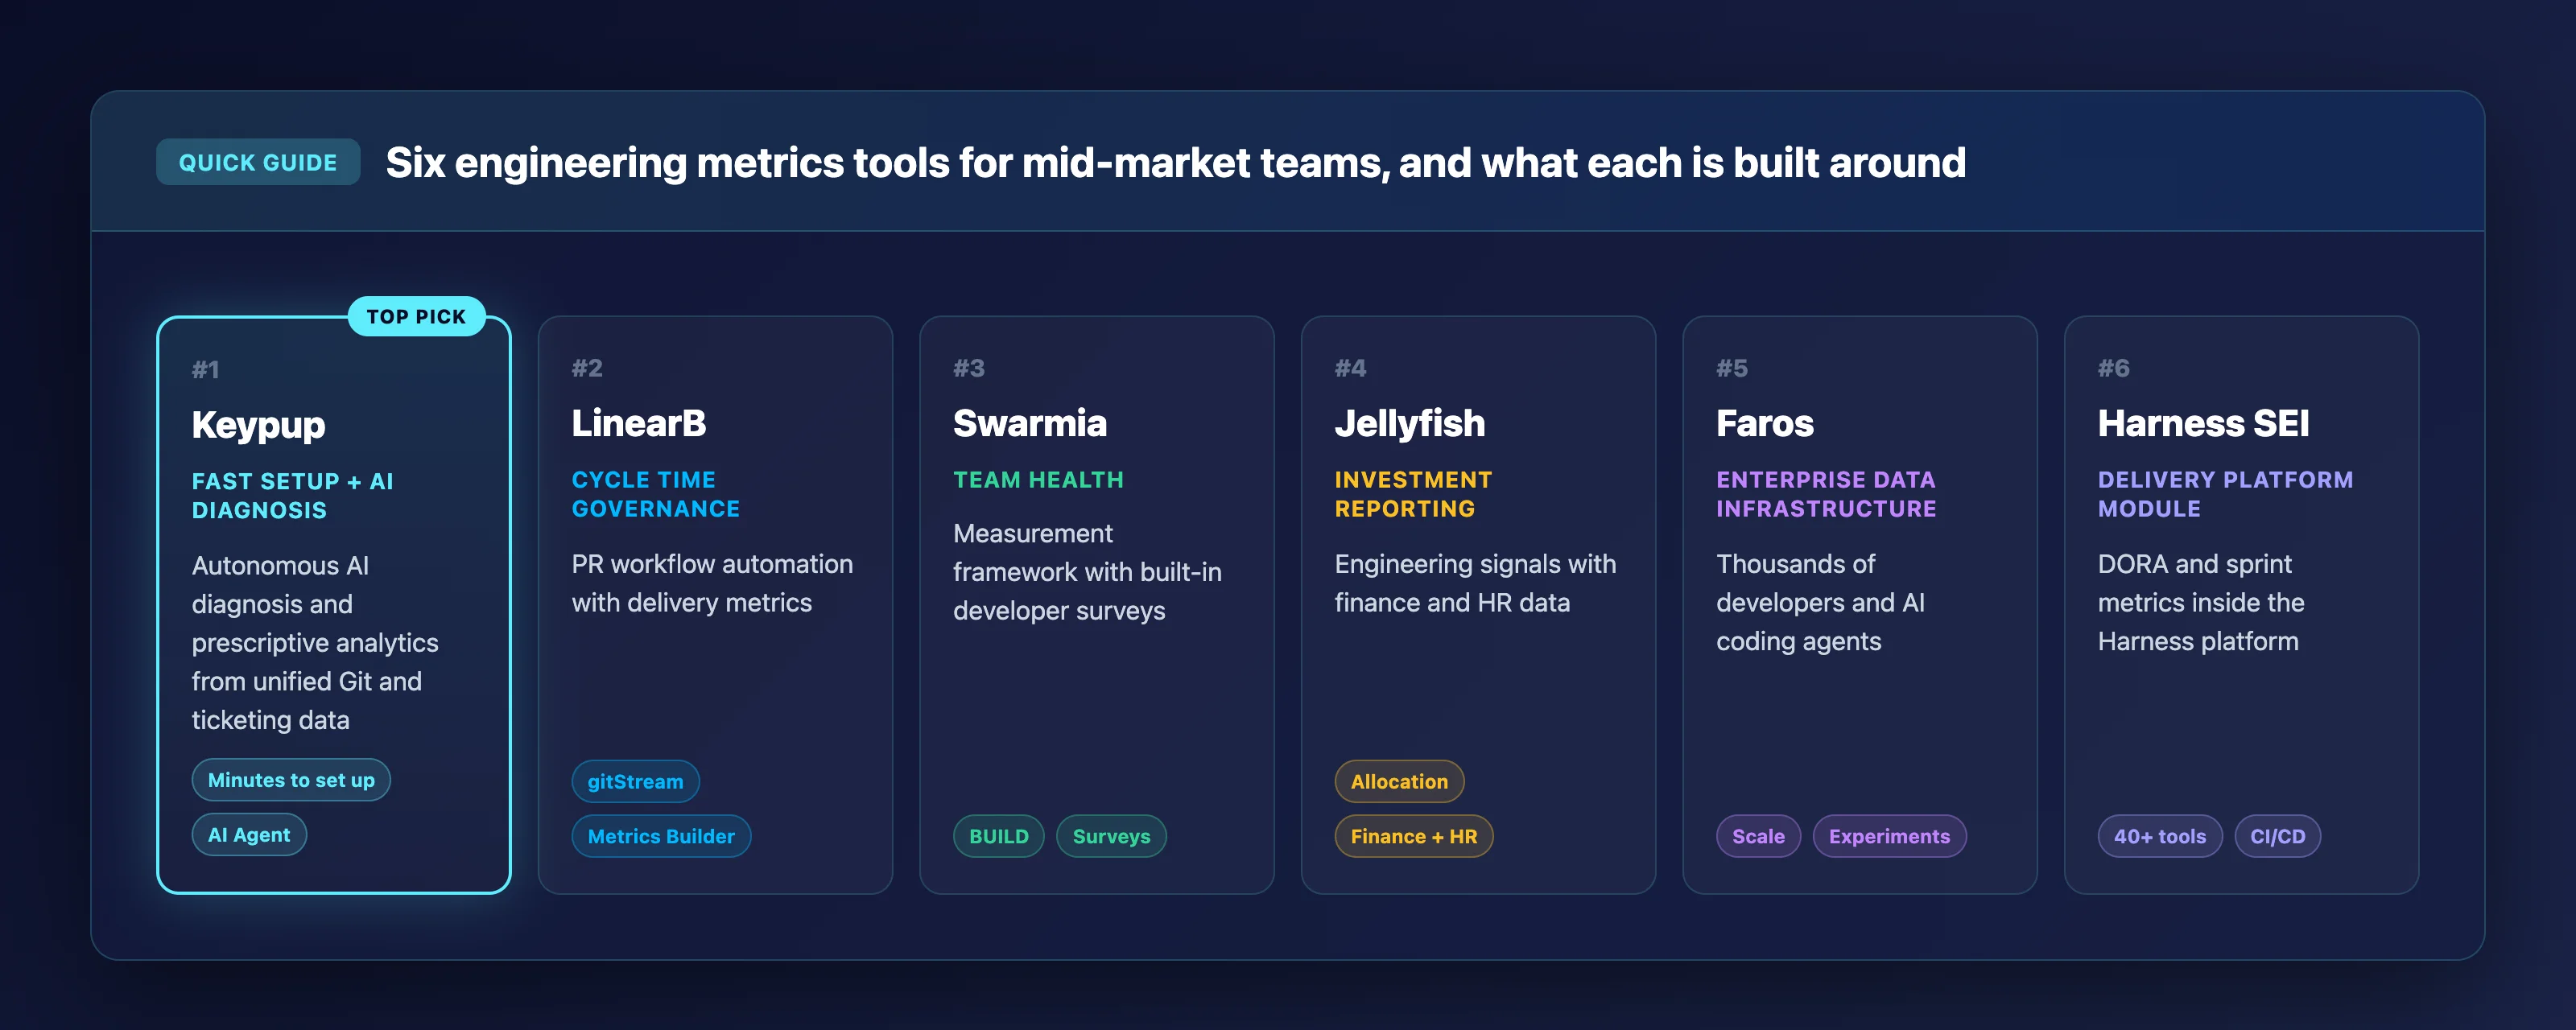
Quick guide: 6 best engineering metrics software for mid-market teams
Keypup: The best engineering metrics software for mid-market teams that need autonomous AI diagnosis, prescriptive analytics, and fast setup from unified Git and ticketing data.
LinearB: Combines PR workflow automation with delivery metrics for teams focused on cycle time governance.
Swarmia: Provides a measurement framework with built-in developer surveys for organizations tracking team health alongside DORA.
Jellyfish: Contextualizes engineering signals with finance and HR data for executive-level investment reporting.
Faros: An enterprise-grade data infrastructure for organizations managing thousands of developers and AI coding agents.
Harness SEI: Offers DORA and sprint metrics as part of a broader software delivery platform with workflow automation.
How we chose the best engineering metrics software for mid-market teams
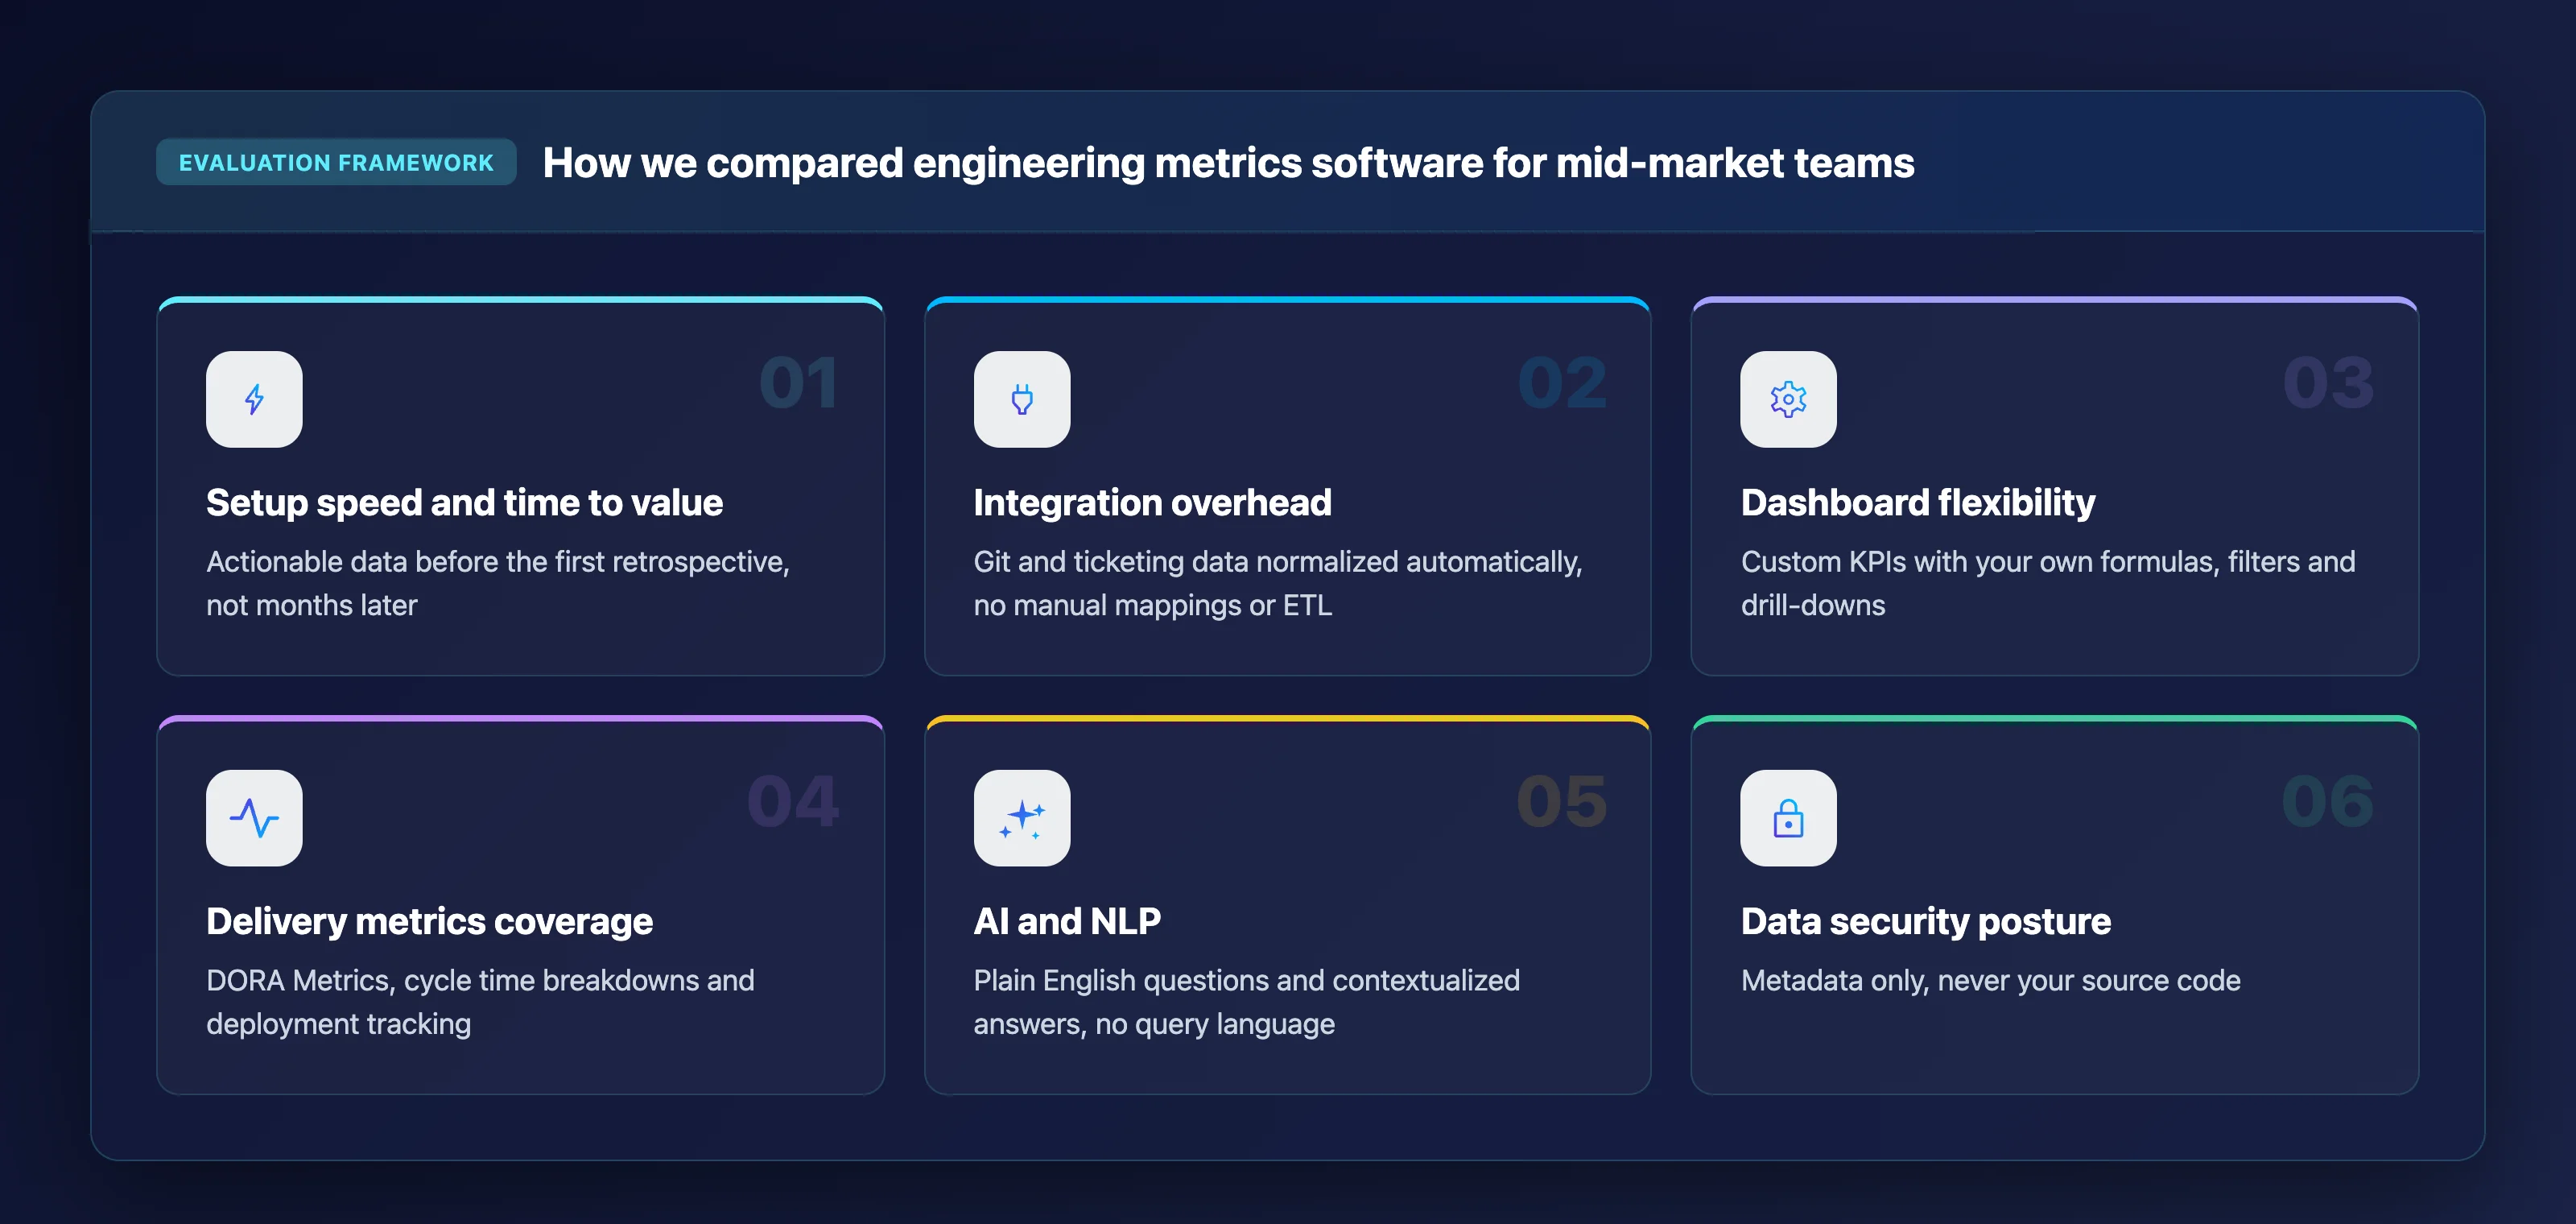
We evaluated each platform from the perspective of an engineering manager or VP at a mid-market software company. Here is what we prioritized:
Setup speed and time to value: How quickly can you connect your tools and start seeing actionable data? If it takes months, your team will lose momentum before the first retrospective.
Integration overhead: Does the platform normalize your Git and ticketing data automatically, or does your team need to maintain manual mappings and ETL pipelines?
Dashboard flexibility: Can you build custom KPIs with your own formulas, filters, and drill-downs, or are you locked into a rigid set of pre-built views?
Delivery metrics coverage: Does the platform provide DORA Metrics, cycle time breakdowns, and deployment tracking out of the box?
AI and NLP capabilities: Can you ask plain English questions about your data and get contextualized answers, or do you need to learn a query language first?
Data security posture: Does the platform access your source code, or does it operate strictly on metadata? This matters especially for teams in regulated industries.
The 6 best engineering metrics software for mid-market teams
1. Keypup: Best overall engineering metrics software for mid-market teams
Keypup is an autonomous NLP engineering intelligence platform that unifies Git and ticketing metadata into a single normalized data model. Instead of spending weeks configuring dashboards, you describe a question in plain English and the AI Agent generates a complete multi-insight dashboard with filters, drill-downs, and documentation.
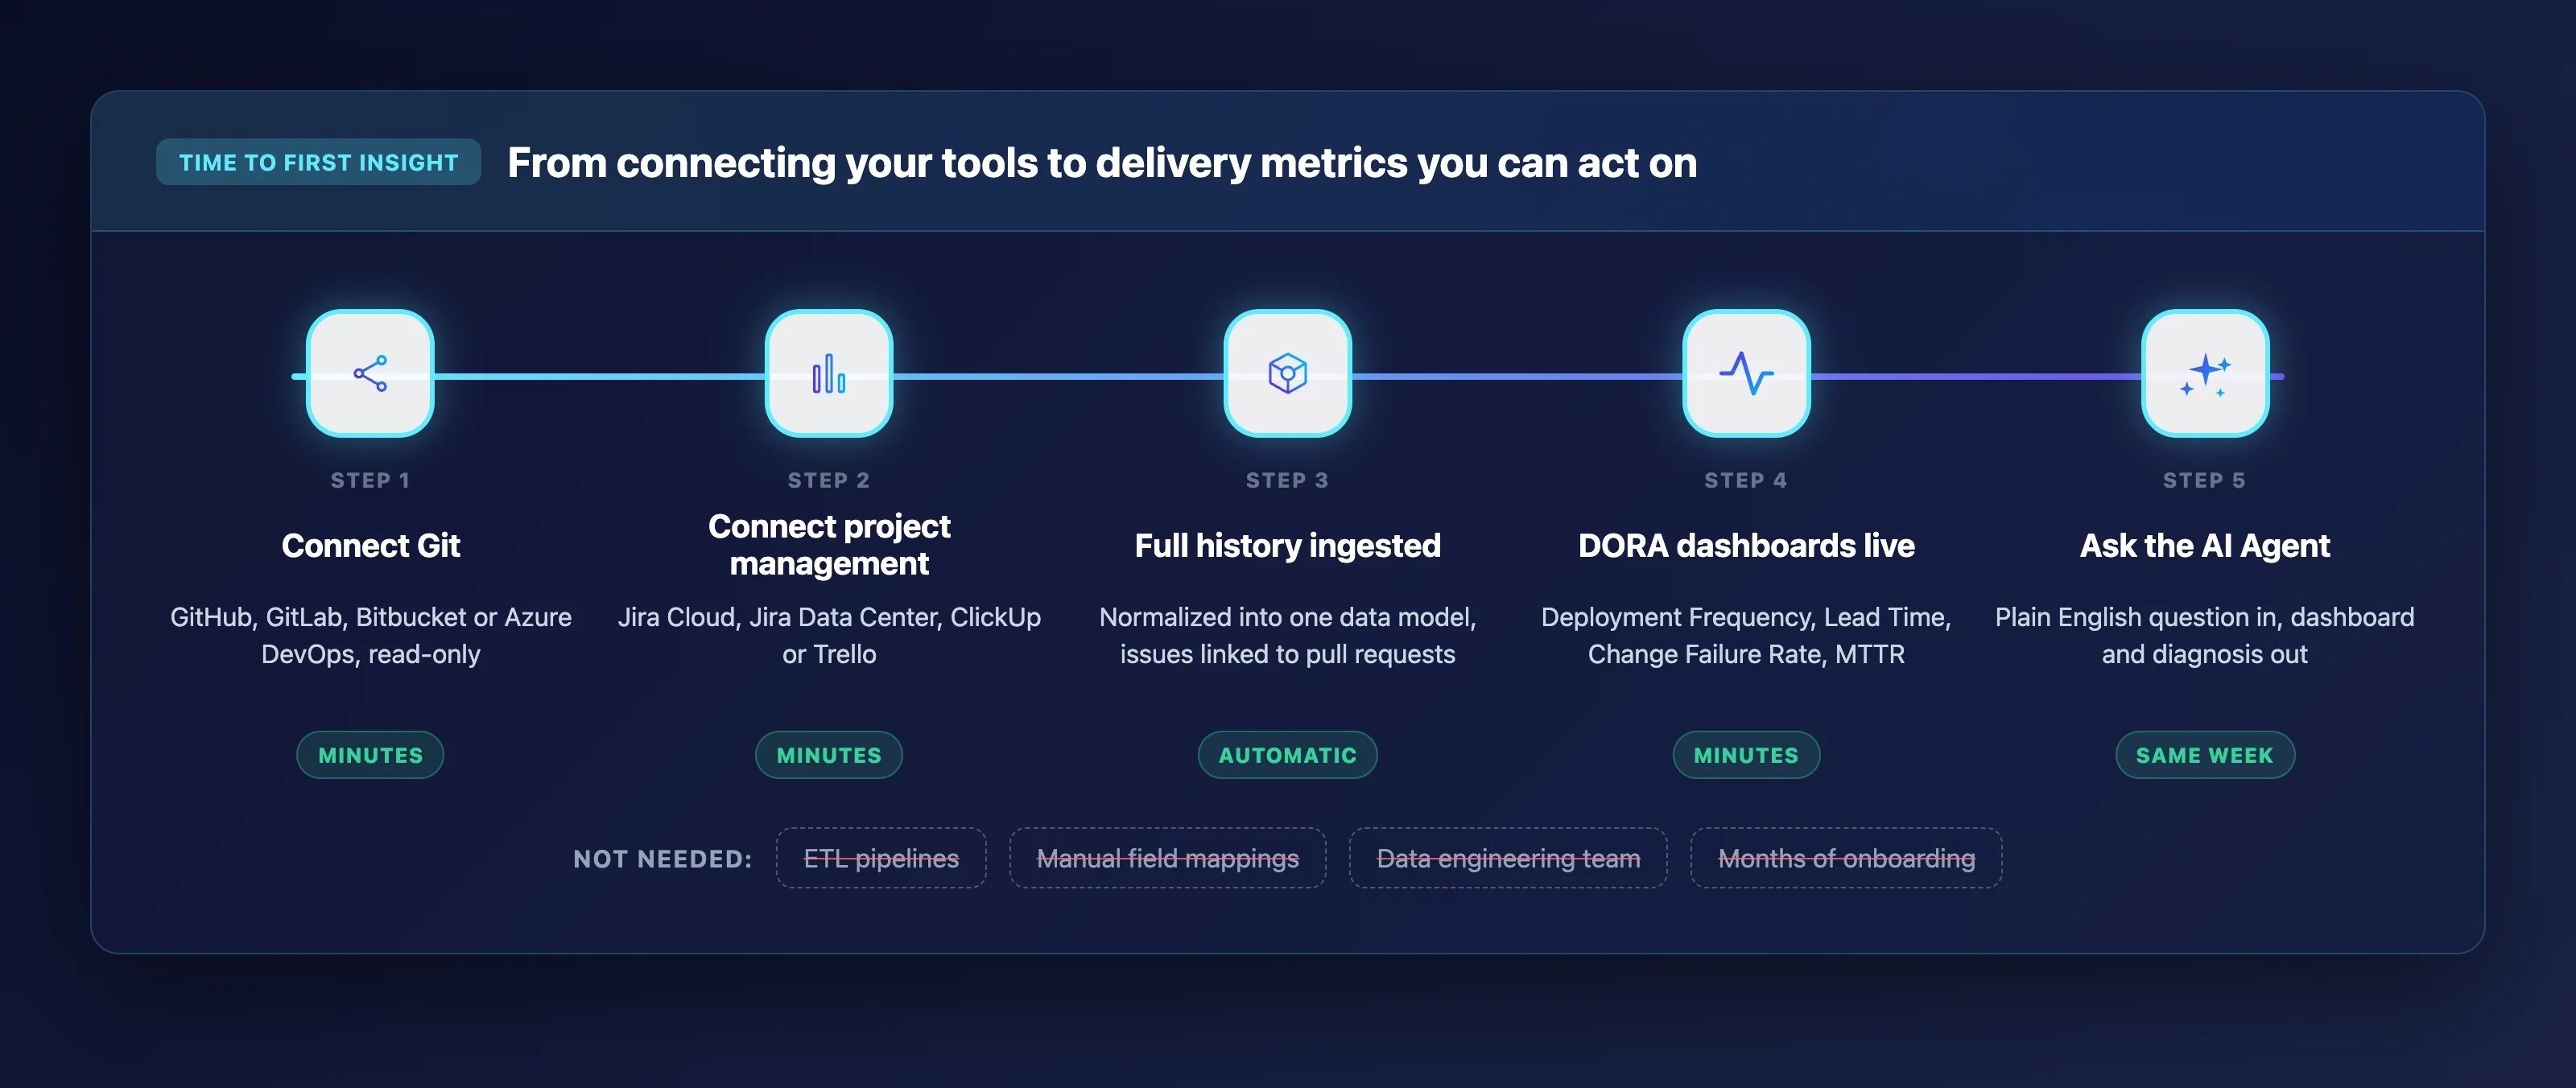
What makes Keypup especially valuable for mid-market teams is the speed from connection to insight. You connect your GitHub, GitLab, Bitbucket, or Azure DevOps repositories alongside Jira, ClickUp, or Trello, and DORA Metrics dashboards appear within minutes. No ETL pipelines, no data engineering overhead.
The prescriptive analytics layer goes beyond visualization. Keypup performs AI SDLC Diagnosis, identifying systemic bottlenecks in your development lifecycle and recommending concrete improvements organized into Key Insights, Bottlenecks, Recommendations, and Priority Actions.
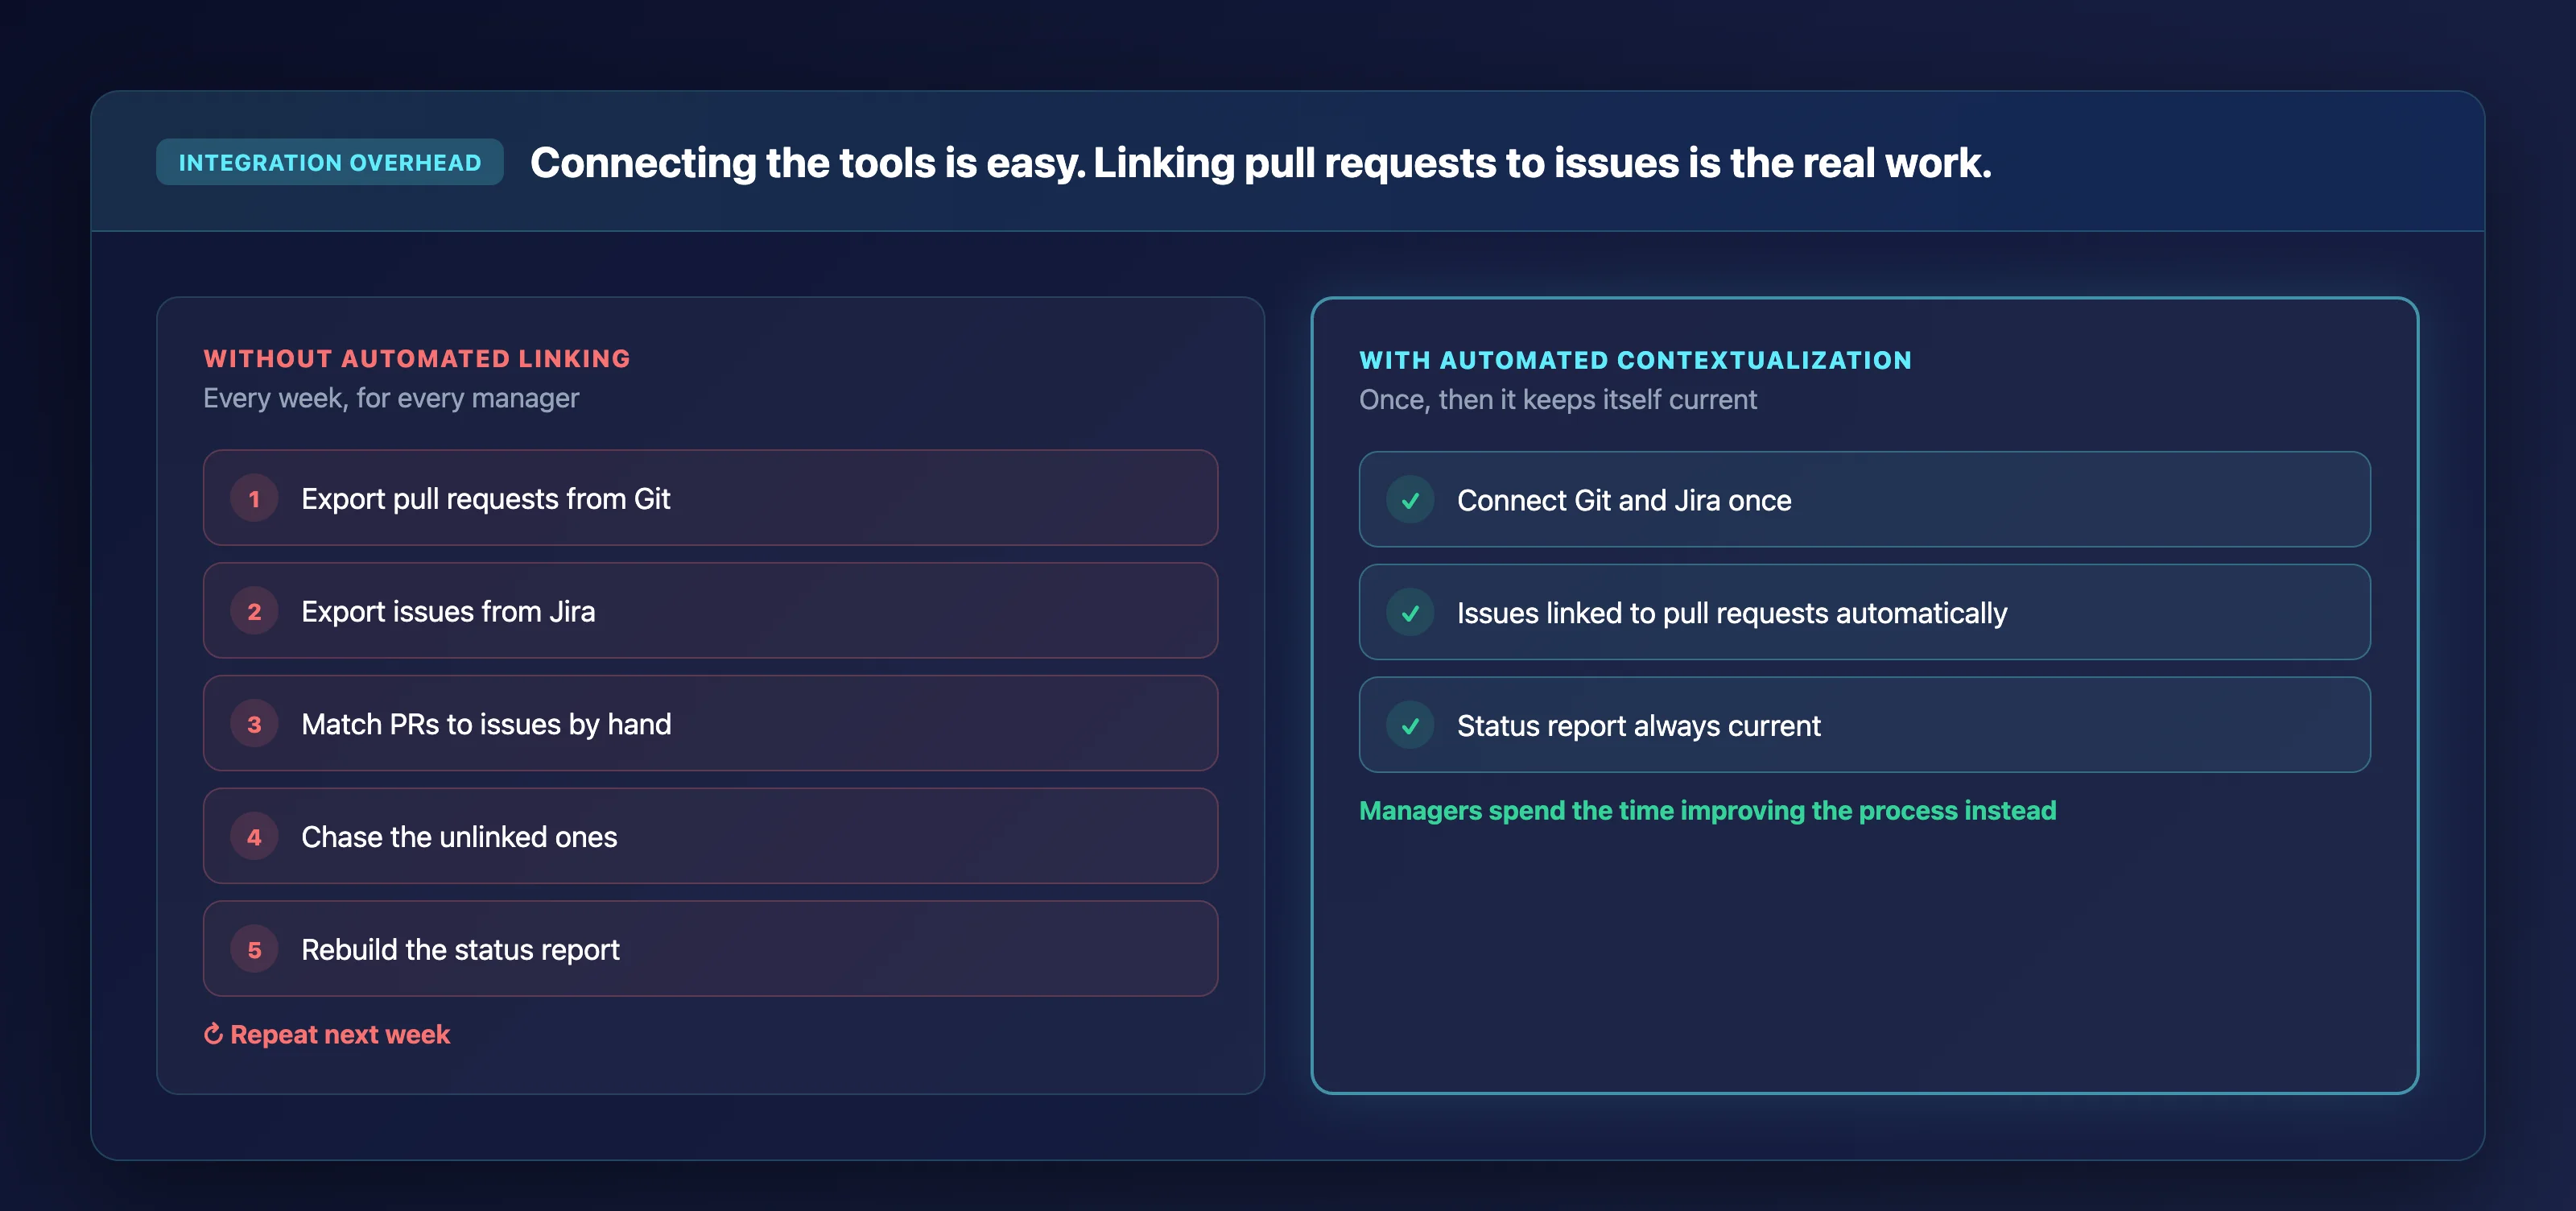
Keypup also uses Automated Contextualization to link issues to pull requests using semantic inference. This eliminates the hours your managers spend reconciling Git activity with Jira issues to produce status reports.
Keypup features
Prompt-to-Dashboard Infrastructure: Describe a delivery question in natural language and receive a fully built dashboard with contextual filters aligned to your sprint cycles, replacing hours of manual widget setup.
AI SDLC Diagnosis: The AI Agent diagnoses where your process breaks down, narrates the findings in plain English, and proposes targeted improvement steps your team can act on immediately.
Automated Contextualization: Keypup infers relationships between commits, pull requests, and ticketing items automatically, giving you a unified delivery picture without manual tagging.
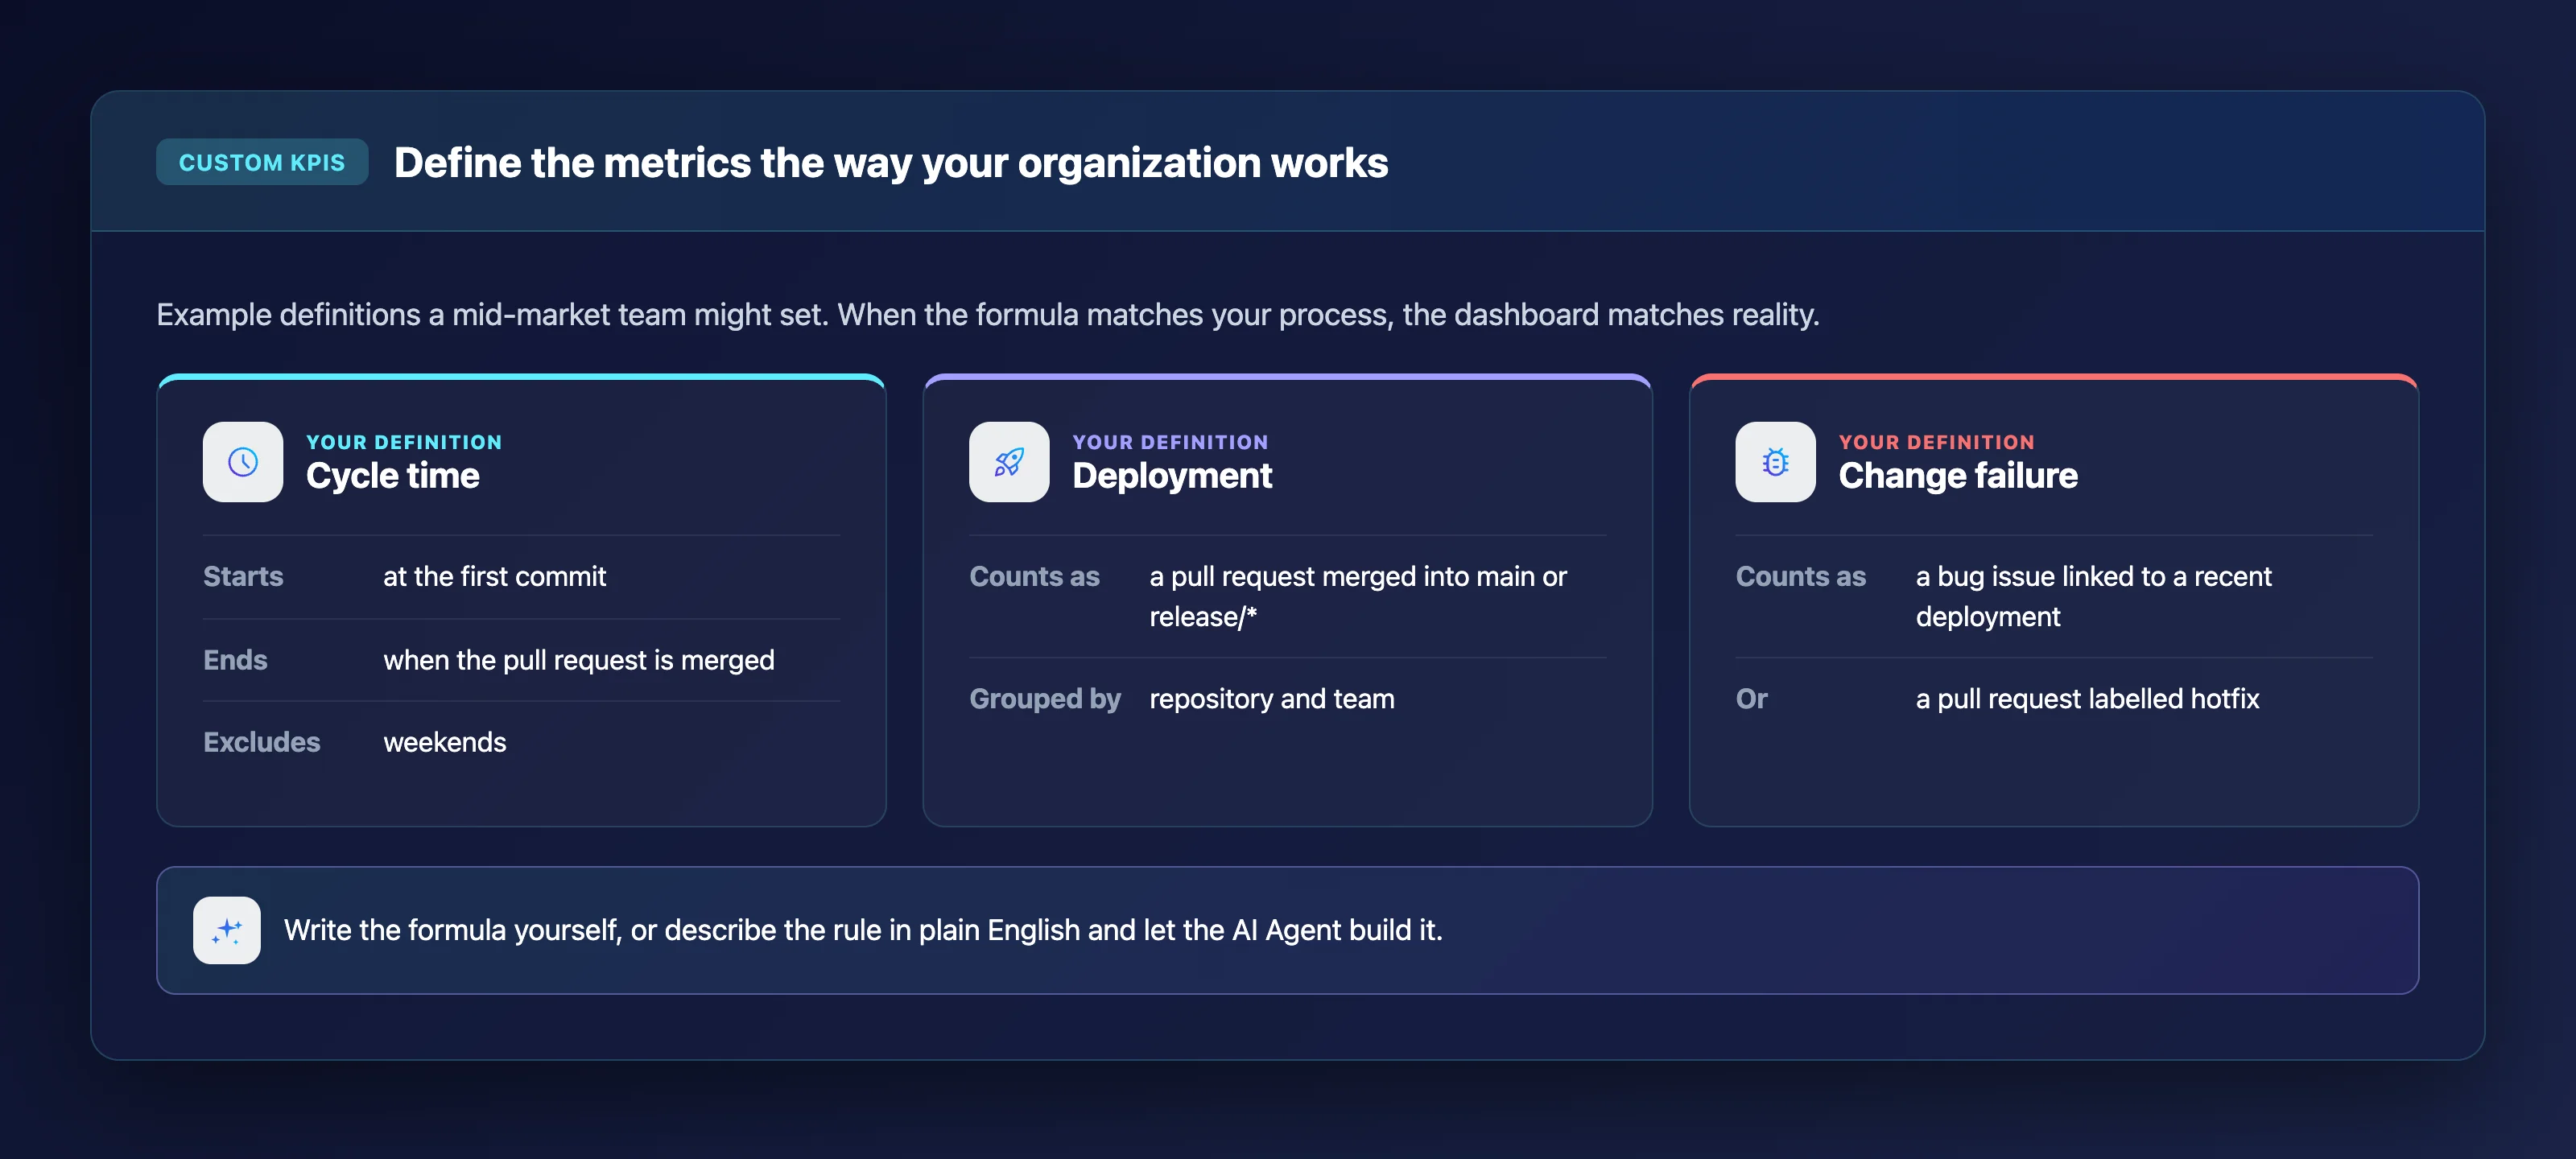
Turnkey DORA Metrics and Custom KPIs: Track Deployment Frequency, Lead Time for Changes, Change Failure Rate, and MTTR from day one. Build custom engineering KPIs using an advanced query builder and your own formulas.
Universal Integration with Zero Friction: Connect GitHub, GitLab, Bitbucket, Azure DevOps, Jira Cloud, Jira Data Center, ClickUp, and Trello through read-only integrations that ingest your full project history.
MCP Server and API Access: Chat with your engineering data through the Keypup MCP Server in Claude, ChatGPT, or Cursor, or build custom workflows using the Keypup API.
Keypup pros and cons
Pros:
The AI Agent generates complete dashboards and prescriptive analysis from a single plain English prompt, reducing the gap between question and insight to seconds.
Automated Contextualization links Git and ticketing data without manual mapping, so your reports reflect the full delivery picture from day one.
Every plan includes unlimited users, contributors, and historical data, which means you can invite your entire organization without managing per-seat costs.
Cons:
The platform focuses on SDLC metadata analytics and does not include built-in developer sentiment surveys. You can integrate survey data from other tools through the API.
Teams accustomed to rigid, pre-configured dashboards may need a short adjustment period to take full advantage of the configurable query engine.
Cross-platform diagnosis is most effective when both Git and ticketing tools are connected. Teams using only one data source will still see value, though the unified view is where Keypup delivers its deepest insights.
2. LinearB: PR workflow automation with delivery metrics for governance-focused teams
LinearB connects Git and project management data to provide visibility into engineering delivery. The platform includes a Metrics Builder, project delivery trackers, and resource allocation reports that break down where engineering time goes across roadmap, customer, and maintenance work.
LinearB also offers gitStream, an engine that automates PR routing, labeling, and review assignment. For mid-market teams focused on enforcing code review policies across growing teams, this workflow layer adds a governance dimension that most analytics-only platforms do not include.
LinearB features
Metrics Builder: Create custom metrics views using Git and project management data, filtered by team, repository, or time period.
gitStream Workflow Automation: Automate PR routing, labeling, and review assignment based on configurable rules.
Resource Allocation Reports: Visualize where engineering effort goes across roadmap, customer, maintenance, and unplanned work categories.
LinearB pros and cons
Pros:
Includes workflow automation and governance features alongside analytics.
Offers DevEx surveys to capture qualitative developer sentiment data.
Provides forecasting tools that predict delivery timelines based on historical team behavior.
Cons:
Custom KPI configurability requires using the Metrics Builder rather than writing native formulas against a unified data schema.
The platform does not offer autonomous dashboard generation from natural language prompts.
AI code review features and advanced analytics are available on higher-tier plans only.
3. Swarmia: Measurement framework with developer surveys for team health tracking
Swarmia provides a structured measurement framework called BUILD that covers AI adoption, effectiveness, and return on engineering. The platform tracks DORA metrics, PR cycle time, and issue metrics alongside built-in developer surveys. This combination gives you a view of both delivery performance and team satisfaction.
For mid-market teams that want developer buy-in alongside analytics, Swarmia takes a team-first approach. Individual data is private to the individual by default, and collaborative working agreements let teams set their own improvement targets.
Swarmia features
BUILD Framework: A structured approach covering AI adoption, developer productivity, quality, and business value of engineering investment.
Built-in Developer Surveys: Capture developer sentiment alongside system metrics for a combined view of team health.
Automatic Change Failure Detection: Identify DORA change failures from application rollbacks and PR reverts.
Swarmia pros and cons
Pros:
Includes a structured measurement framework that helps teams choose which metrics to track first.
Built-in surveys complement system metrics with qualitative developer feedback.
Supports both DORA and SPACE framework tracking natively.
Cons:
Custom KPI creation requires working within the platform's predefined metric categories rather than writing open-ended queries.
The platform does not offer autonomous dashboard generation from natural language prompts.
Git-to-ticketing data integration uses standard linking methods and does not include AI-driven semantic contextualization.
4. Jellyfish: Engineering signal analysis with business context for leadership reporting
Jellyfish integrates engineering tool data with information from calendars, finance, and HR systems. This combination allows engineering leaders to report on how development effort aligns with business priorities. The platform includes a Data Hub with customizable dashboards, AI-assisted custom queries, and a patented allocations model.
For mid-market teams where the CTO needs to present engineering investment data to a board, Jellyfish focuses on connecting delivery signals to business outcomes. The trade-off is a broader data footprint that requires connecting more source systems during onboarding.
Jellyfish features
Data Hub: Combine DORA metrics, AI impact data, and custom metrics in extensible dashboards with flexible calculation logic.
Business Alignment Reporting: Contextualize engineering signals with finance and HR data to demonstrate development effort allocation to stakeholders.
AI-Assisted Custom Queries: Use natural language to ask questions about engineering data and receive contextual answers.
Jellyfish pros and cons
Pros:
Integrates business data (finance, HR, calendars) with engineering signals for cross-functional reporting.
Includes a patented allocations model for investment and resource alignment analysis.
Has accumulated a large customer dataset for industry benchmark comparisons.
Cons:
The platform's focus on business alignment means it requires additional data source connections beyond Git and ticketing tools.
Git-to-ticketing data linking relies on standard field matching rather than AI-driven semantic inference.
The platform does not generate prescriptive improvement recommendations based on SDLC diagnosis.
5. Faros: Enterprise-grade data infrastructure for large-scale engineering organizations
Faros is designed for organizations that need to ingest and analyze large volumes of engineering metadata across thousands of developers and AI coding agents. The platform includes analytics, AI-powered productivity tools, customizable dashboards, and engineering catalogs that unify HR and service data.
Faros recently introduced Experiments, a structured framework for measuring the impact of AI program changes with before-and-after analysis. The platform also offers role-based experiences with custom roles so different stakeholders see the most relevant dashboards when they log in.
Faros features
Enterprise-Scale Data Infrastructure: Handles thousands of engineers and millions of data points with dedicated monitoring for data freshness.
Experiments Framework: Measure the impact of AI program changes with structured before-and-after analysis across engineering metrics.
Engineering Catalogs: Unify scattered HR and service data into a navigable source of truth for engineering operations.
Faros pros and cons
Pros:
Handles enterprise-scale data volumes with dedicated infrastructure for performance and compliance.
Includes AI-powered PR comment classification that categorizes code review feedback automatically.
Offers on-premises deployment options for organizations with strict data residency requirements.
Cons:
The platform is designed for large engineering organizations, and smaller mid-market teams may find the setup requirements more involved.
Natural language querying and autonomous dashboard generation are not core features of the platform.
Connecting all required data sources across code, HR, and service catalogs takes more initial configuration time.
6. Harness SEI: DORA and sprint metrics within a broader software delivery platform
Harness Software Engineering Insights (SEI) provides DORA metrics and sprint metrics as part of the broader Harness software delivery platform. The module connects to over 40 DevOps tools and computes over 100 metrics that cover alignment, planning, and execution across the software development lifecycle.
For teams already using the Harness platform for CI/CD, SEI adds an analytics layer without requiring a separate vendor relationship. The module includes AI-generated summaries and recommendations for efficiency and sprint metrics, providing context alongside the data.
Harness SEI features
DORA and Sprint Metrics: Track deployment frequency, lead time, change failure rate, and sprint predictability in one view.
40+ Integrations: Connect to GitHub, GitLab, Bitbucket, Jira, PagerDuty, Azure, and other DevOps tools.
AI Summaries: Receive AI-generated contextual summaries for efficiency and sprint data.
Harness SEI pros and cons
Pros:
Integrates natively with the broader Harness platform for CI/CD, feature flags, and cloud cost management.
Supports both DORA and SPACE framework metrics out of the box.
Includes an automated workflow engine for enforcing process standards.
Cons:
SEI is a module within the Harness platform, which means teams not already using Harness take on a broader platform commitment.
The analytics focus is embedded within a delivery platform rather than being a standalone engineering intelligence tool.
Custom dashboard building and open-ended formula creation are more limited compared to dedicated analytics platforms.
Comparison table: The best engineering metrics software for mid-market teams
Engineering metrics software for mid-market teams at a glance
Platform
Autonomous AI Dashboard Generation
Git-to-Ticketing Semantic Linking
Uncapped Historical Data
KeypupTop pick
Autonomous AI Dashboard Generation
Git-to-Ticketing Semantic Linking
Uncapped Historical Data
LinearB
Autonomous AI Dashboard Generation
Git-to-Ticketing Semantic Linking
Uncapped Historical Data
Swarmia
Autonomous AI Dashboard Generation
Git-to-Ticketing Semantic Linking
Uncapped Historical Data
Jellyfish
Autonomous AI Dashboard Generation
Git-to-Ticketing Semantic Linking
Uncapped Historical Data
Faros
Autonomous AI Dashboard Generation
Git-to-Ticketing Semantic Linking
Uncapped Historical Data
Harness SEI
Autonomous AI Dashboard Generation
Git-to-Ticketing Semantic Linking
Uncapped Historical Data
What should mid-market teams look for when choosing engineering metrics software?
The right engineering metrics software for a mid-market team solves a different problem than what startups or large enterprises face. Your engineering organization is large enough that individual conversations cannot keep everyone aligned, but not so large that you can dedicate a full-time data engineering team to maintain your analytics pipeline.
Focus on three things during your evaluation. First, time to first insight matters more than feature count. A platform that takes three months to configure will lose executive sponsorship before it produces its first useful report.
Second, look for custom KPI configurability that matches how your organization actually measures performance. Every engineering team has its own definitions of cycle time stages, deployment events, and failure conditions. If you cannot adapt the formulas, you end up explaining why the dashboard numbers do not match reality.
How does automated data contextualization reduce integration overhead?
Integration overhead is one of the most underestimated costs when adopting engineering metrics software. Connecting your Git provider and ticketing tool is usually straightforward. The real work begins when you need to link pull requests to the Jira issues they resolve.
Without automated linking, your engineering managers spend hours each week cross-referencing Git activity with project management items to build status reports. According to the 2025 DORA report, teams with mature measurement practices see compounding gains from process improvements, while teams without reliable baselines struggle to demonstrate progress.
Keypup solves this with Automated Contextualization, which uses semantic inference to link issues to pull requests without manual tagging or ETL pipelines. This gives you a unified delivery picture from day one, so your team can focus on improving processes instead of reconciling data.
Why Keypup is the best engineering metrics software for mid-market teams
Keypup gives mid-market teams the complete picture of their software delivery lifecycle by unifying Git and ticketing data through Automated Contextualization. While other platforms require you to maintain manual links between commits and issues, Keypup infers those relationships automatically and builds a normalized data model you can query immediately.
Mid-market engineering leaders at companies like Juntos Somos Mais reported a 45% year-on-year increase in engineering productivity after adopting data-driven management with Keypup. That kind of outcome starts with reliable metrics that your teams trust enough to act on.
The AI Agent is what sets Keypup apart. You describe a delivery question in plain English, and the platform generates a full dashboard with contextual filters, prescriptive analysis, and auto-generated documentation. This is not a chatbot answering simple questions. It is an autonomous system that diagnoses where your process slows down and recommends what to fix. Keypup translates your fragmented Git and Jira data into actionable intelligence your entire leadership team can use.
Keypup connects to your existing stack in minutes with zero configuration overhead. GitHub, GitLab, Bitbucket, Azure DevOps, Jira Cloud, Jira Data Center, ClickUp, and Trello are all supported through read-only integrations. Your source code is never accessed. Every plan includes unlimited users, contributors, and full historical data. Start your free trial and see your first dashboards today.
FAQs about engineering metrics software
What is engineering metrics software?
Engineering metrics software unifies data from Git repositories, project management tools, and deployment pipelines to give engineering teams visibility into delivery performance. Keypup takes this further with an AI Agent that translates your raw Git and Jira metadata into prescriptive insights and custom dashboards, all from plain English prompts.
Which DORA Metrics should mid-market teams track first?
Start with Deployment Frequency and Lead Time for Changes. These two metrics give you an immediate read on delivery throughput. Keypup provides turnkey DORA Metrics dashboards that track all four core metrics from the moment you connect your tools, with no manual configuration required.
How long does it take to set up engineering metrics software?
Setup time varies significantly across platforms. Keypup connects to your existing Git and project management tools in minutes through read-only integrations. The AI Agent begins generating dashboards and analysis immediately after data ingestion, with no ETL pipelines or lengthy onboarding required.
Can engineering metrics software replace manual status reporting?
Yes, platforms that automatically link Git activity to ticketing data eliminate the need to reconcile pull requests with issues by hand. Keypup automates this through Automated Contextualization, which uses semantic inference to generate the complete delivery picture your stakeholders need.
Is source code safe with engineering metrics tools?
Not all platforms handle code data the same way. Keypup is strictly a metadata processor. The AI analyzes timestamps, pull request statuses, issue labels, and reviewer assignments. Your proprietary source code is never read, processed, or stored.
Ready to Transform Your Analytics?
Join teams already using AI to make data-driven decisions faster than
ever.
Your release notes list 9,860 changes. Only 71% had merged code by the release date, and a quarter of the merged code is listed nowhere. Learn what engineering leaders on Reddit say about Jira Fix Versions, release scope and untracked changes at enterprise scale, and how Keypup MCP reconciles each version's scope with linked, merged pull requests.
Your bug SLA report says 91%. Your customers experienced 65%. Learn what engineering leaders on Reddit say about P1 fix-time targets, SLA clocks that start late and bugs closed to stop the timer at enterprise scale, and how Keypup MCP measures real SLA attainment by priority and team from Jira workflow history and linked pull requests.
Dependabot and Renovate open thousands of pull requests across enterprise repositories, and most of them are never merged, merged with no review, or left open for months. Learn what engineering leaders on Reddit say about dependency bot noise, unowned major upgrades and auto-merge risk, and how Keypup MCP measures the bot backlog by version bump, ecosystem, merge path, next action and owner.