The Hotfix Treadmill: How Emergency Fixes Quietly Eat Enterprise Delivery Capacity
Why do some engineering organizations spend every Friday shipping hotfixes? Learn what engineering leaders on Reddit say about hotfixes, reverts and firefighting at enterprise scale, and how Keypup MCP uses pull request branches, labels, titles, approvals, merge times and linked Jira issues to measure your emergency fix rate, when and where it runs, how it relates to skipped reviews and which unreviewed fixes need a second look.
TL;DR: In many large engineering organizations, a growing share of merged work isn't new work at all — it's hotfixes and reverts for what shipped last week. This is the hotfix treadmill: emergency fixes take capacity from the roadmap, skip the reviews that would have prevented them, and cluster on Friday evenings. Most leaders can't size it, because hotfixes look like any other merged pull request. The Keypup MCP Server reads each pull request's head branch, labels, title, approvals, lines changed, creation and merge dates, and the Jira issues it resolves. Your AI assistant can then measure your emergency fix rate, track it month by month, show when and where emergency fixes land, test whether skipped reviews predict them, show what they fix and list the large unreviewed fixes that deserve a retro-review.
Ask an engineering leadership team how much of last quarter's output was planned work and you will get an answer. Ask how much of it was fixing what the previous quarter shipped, and the room goes quiet — because a hotfix merges, counts and looks exactly like progress.
The Friction: Firefighting That Looks Like Throughput
In a single team, everyone knows when a release went badly. In an organization of 1,500 engineers merging 4,000 pull requests a month across hundreds of repositories, the hotfix treadmill is invisible for structural reasons:
A hotfix is just another merged pull request. Throughput dashboards count it as delivery. A team that ships a bug and fixes it twice looks three times as productive as one that shipped it right.
Emergency changes skip the gates. Under pressure, approvals are waived "just this once", and the next fix is made with even less context than the first.
The incident record and the code record don't meet. Incidents live in one tool, fixes in another, and a hotfix pushed at 9 pm rarely gets a Jira ticket.
The cost lands on the roadmap. Every emergency fix interrupts someone who was working on something planned — and the slip shows up weeks later, attributed to "estimation".
The result: leadership sees healthy throughput, while a growing share of it is the organization paying for its own defects.
Why This Matters: The Real Cost of the Hotfix Treadmill
The Capacity Problem
Every emergency fix is unplanned work, done by someone pulled off planned work, usually with a context switch and often outside working hours. When emergency fixes double, the roadmap loses capacity that never appears in any plan.
The Quality Spiral
Emergency fixes are written fast and reviewed little. A share of them need their own fix or revert, which is also written fast and reviewed little. Without measurement, the spiral is only visible as a feeling that "things keep breaking".
The Accountability Problem
Change failure rate is one of the four DORA metrics, yet many enterprises report it from incident tickets that miss most fixes. Without a measure taken from the code itself, the conversation about release quality stays anecdotal — and the teams with the most fires are often the ones praised for their throughput.
The Enterprise Discussion: What Engineering Leaders Are Actually Saying
Constant firefighting, Friday deploys, reverts and "hotfix culture" are among the most recurring complaints wherever engineering managers, staff engineers and directors at large organizations compare notes. The quotes below are representative of recurring threads on r/ExperiencedDevs, r/EngineeringManagers, r/devops and r/SoftwareEngineering.
Engineering Manager, Payments Company (r/EngineeringManagers)
"Half my team's sprint is hotfixes for last sprint. Leadership looks at our merged PR count and says we're one of the most productive teams in the org. We're not productive, we're on a treadmill."
Staff Engineer, Global Retailer (r/ExperiencedDevs)
"Every hotfix gets merged by whoever is on call with zero review because 'it's urgent'. Then a third of them need a follow-up fix. We have a two-approval rule that only applies when nothing is on fire, which is never."
Director of Platform Engineering, Telecom Operator (r/devops)
"Our change failure rate in the board deck is 3%, because it's counted from P1 incidents. If you count hotfix branches and reverts in Git, it's closer to 10%. Nobody wants to be the person who reports the real number."
The pattern holds: leaders sense that firefighting is eating capacity, but they measure it from incident tickets, not from the code — so the real size of the treadmill stays hidden.
How Keypup MCP Measures the Hotfix Treadmill
The Keypup Model Context Protocol (MCP) Server gives your AI assistant structured access to the data Keypup imports from GitHub, GitLab, Bitbucket, Azure DevOps and Jira. For this analysis, what matters is each pull request's head branch name, labels, title, number of approvals, lines changed, creation and merge dates, target repository, and the Jira issues it resolves, with their issue type and priority.
In the prompts below, an emergency fix is a merged pull request whose head branch starts with hotfix/, that carries a hotfix label, or whose title starts with "Revert" — the default title Git platforms give a revert pull request. Adjust the definition to your own branch and label conventions: the analysis is only as good as the naming your teams use.
1. Running an Emergency Fix Health Check
The first question: how much of what you merge is fixing what you already merged?
MCP Prompt:
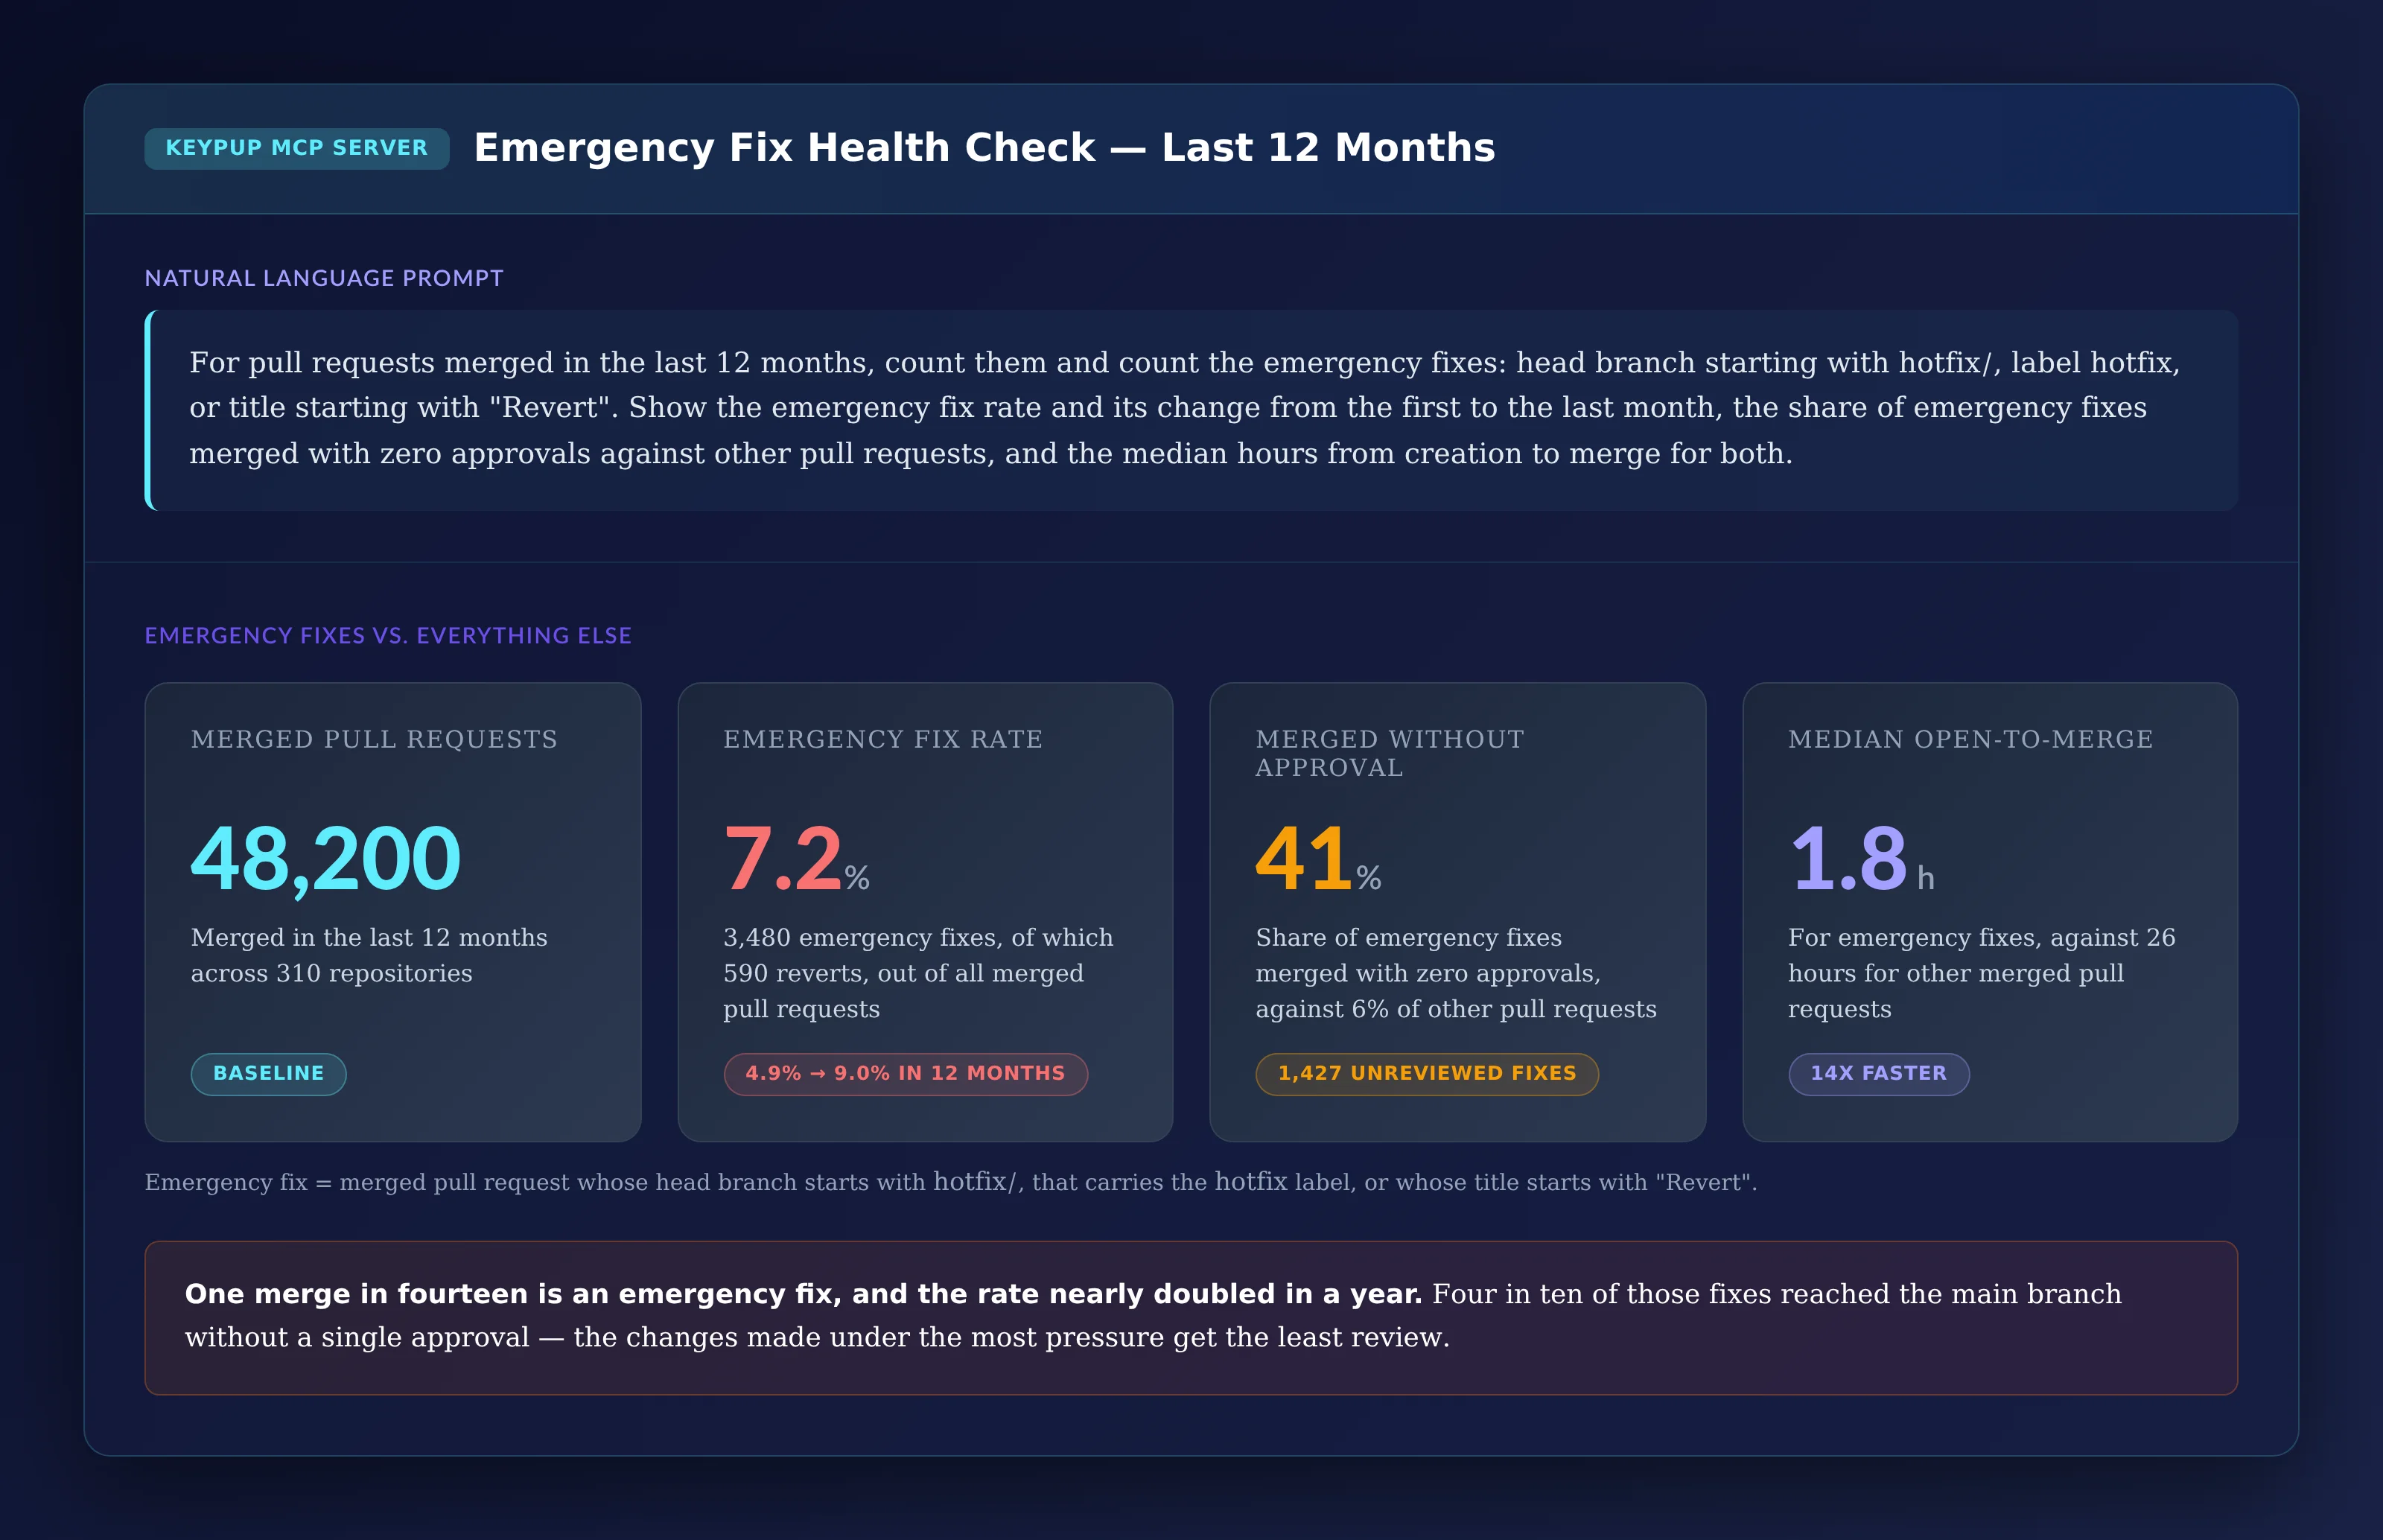
For pull requests merged in the last 12 months, count them and
count the emergency fixes: head branch starting with hotfix/,
label hotfix, or title starting with "Revert". Show the
emergency fix rate and its change from the first to the last
month, the share of emergency fixes merged with zero approvals
against other pull requests, and the median hours from creation
to merge for both.
Output: Emergency Fix Health Check — Last 12 Months
Key Insight: One merge in fourteen is an emergency fix, and the rate nearly doubled in a year. Four in ten of those fixes reached the main branch without a single approval — the changes made under the most pressure get the least review.
2. Tracking the Treadmill Month by Month
Is this a bad quarter, or a trend?
MCP Prompt:
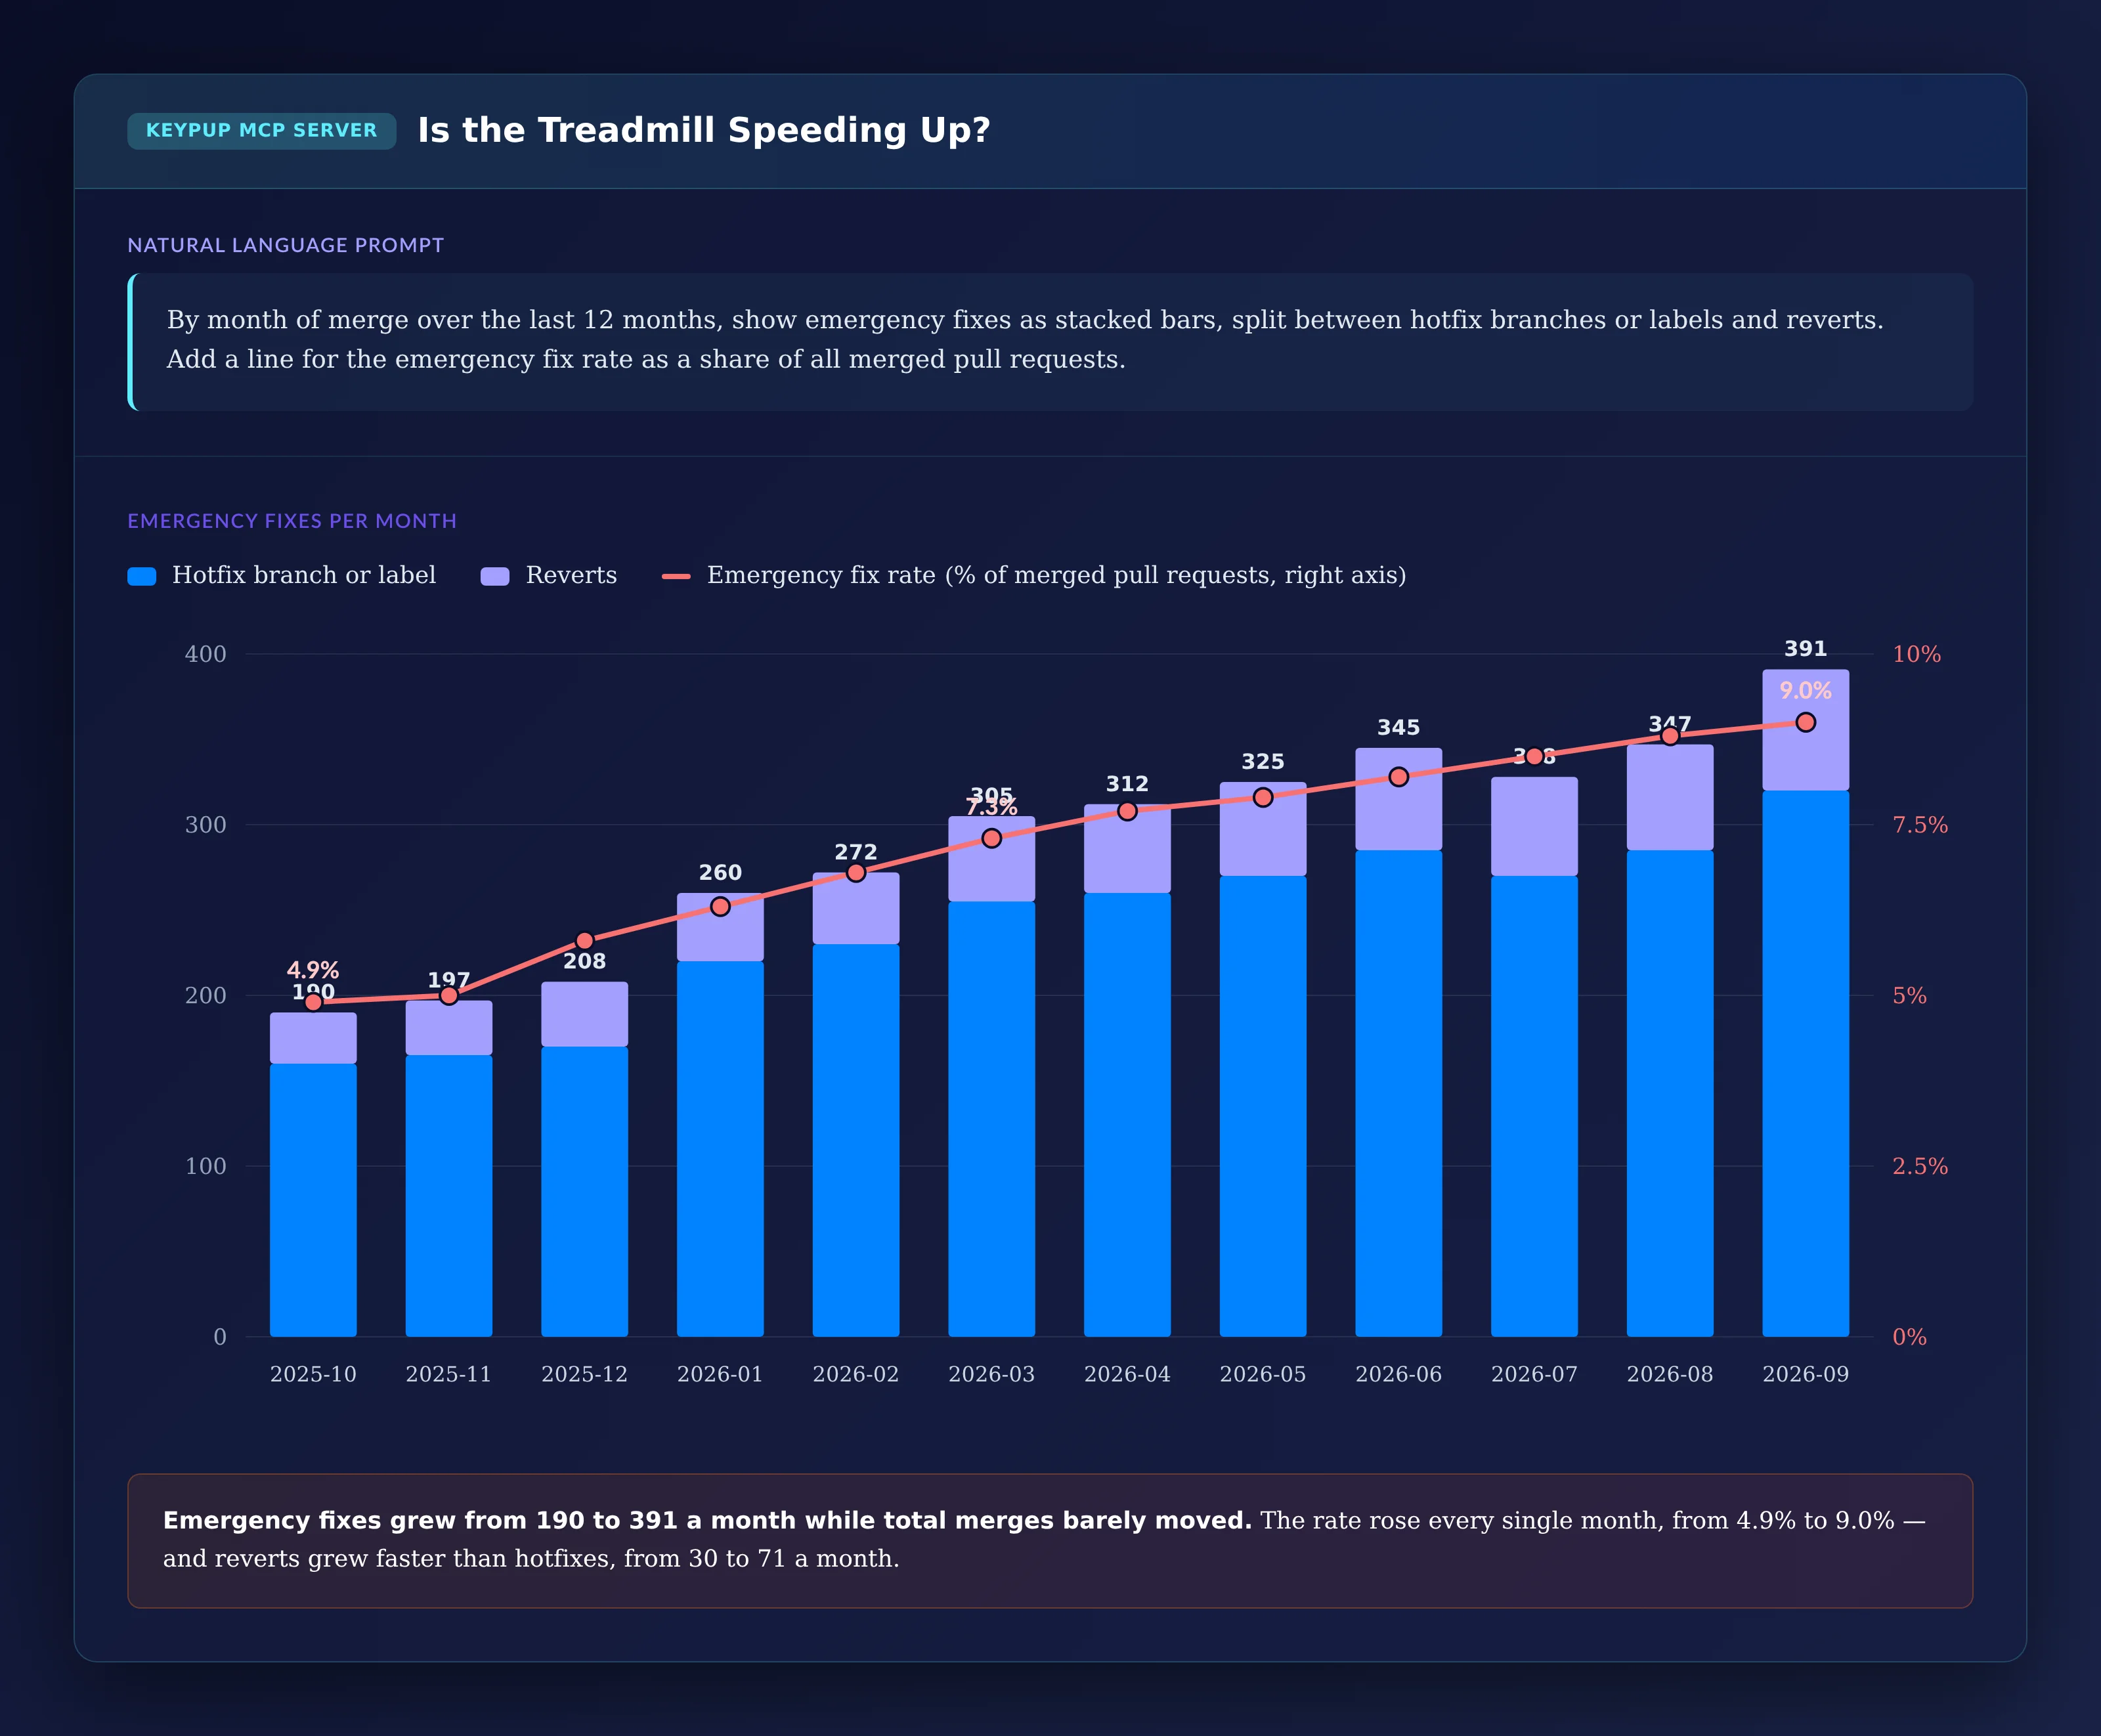
By month of merge over the last 12 months, show emergency fixes
as stacked bars, split between hotfix branches or labels and
reverts. Add a line for the emergency fix rate as a share of all
merged pull requests.
Output: Is the Treadmill Speeding Up?
Key Insight: Emergency fixes grew from 190 to 391 a month while total merges barely moved. The rate rose every single month, from 4.9% to 9.0% — and reverts grew faster than hotfixes, from 30 to 71 a month.
3. Seeing When Emergency Fixes Land
When fixes are merged says a lot about how releases are planned — and who pays for them.
MCP Prompt:
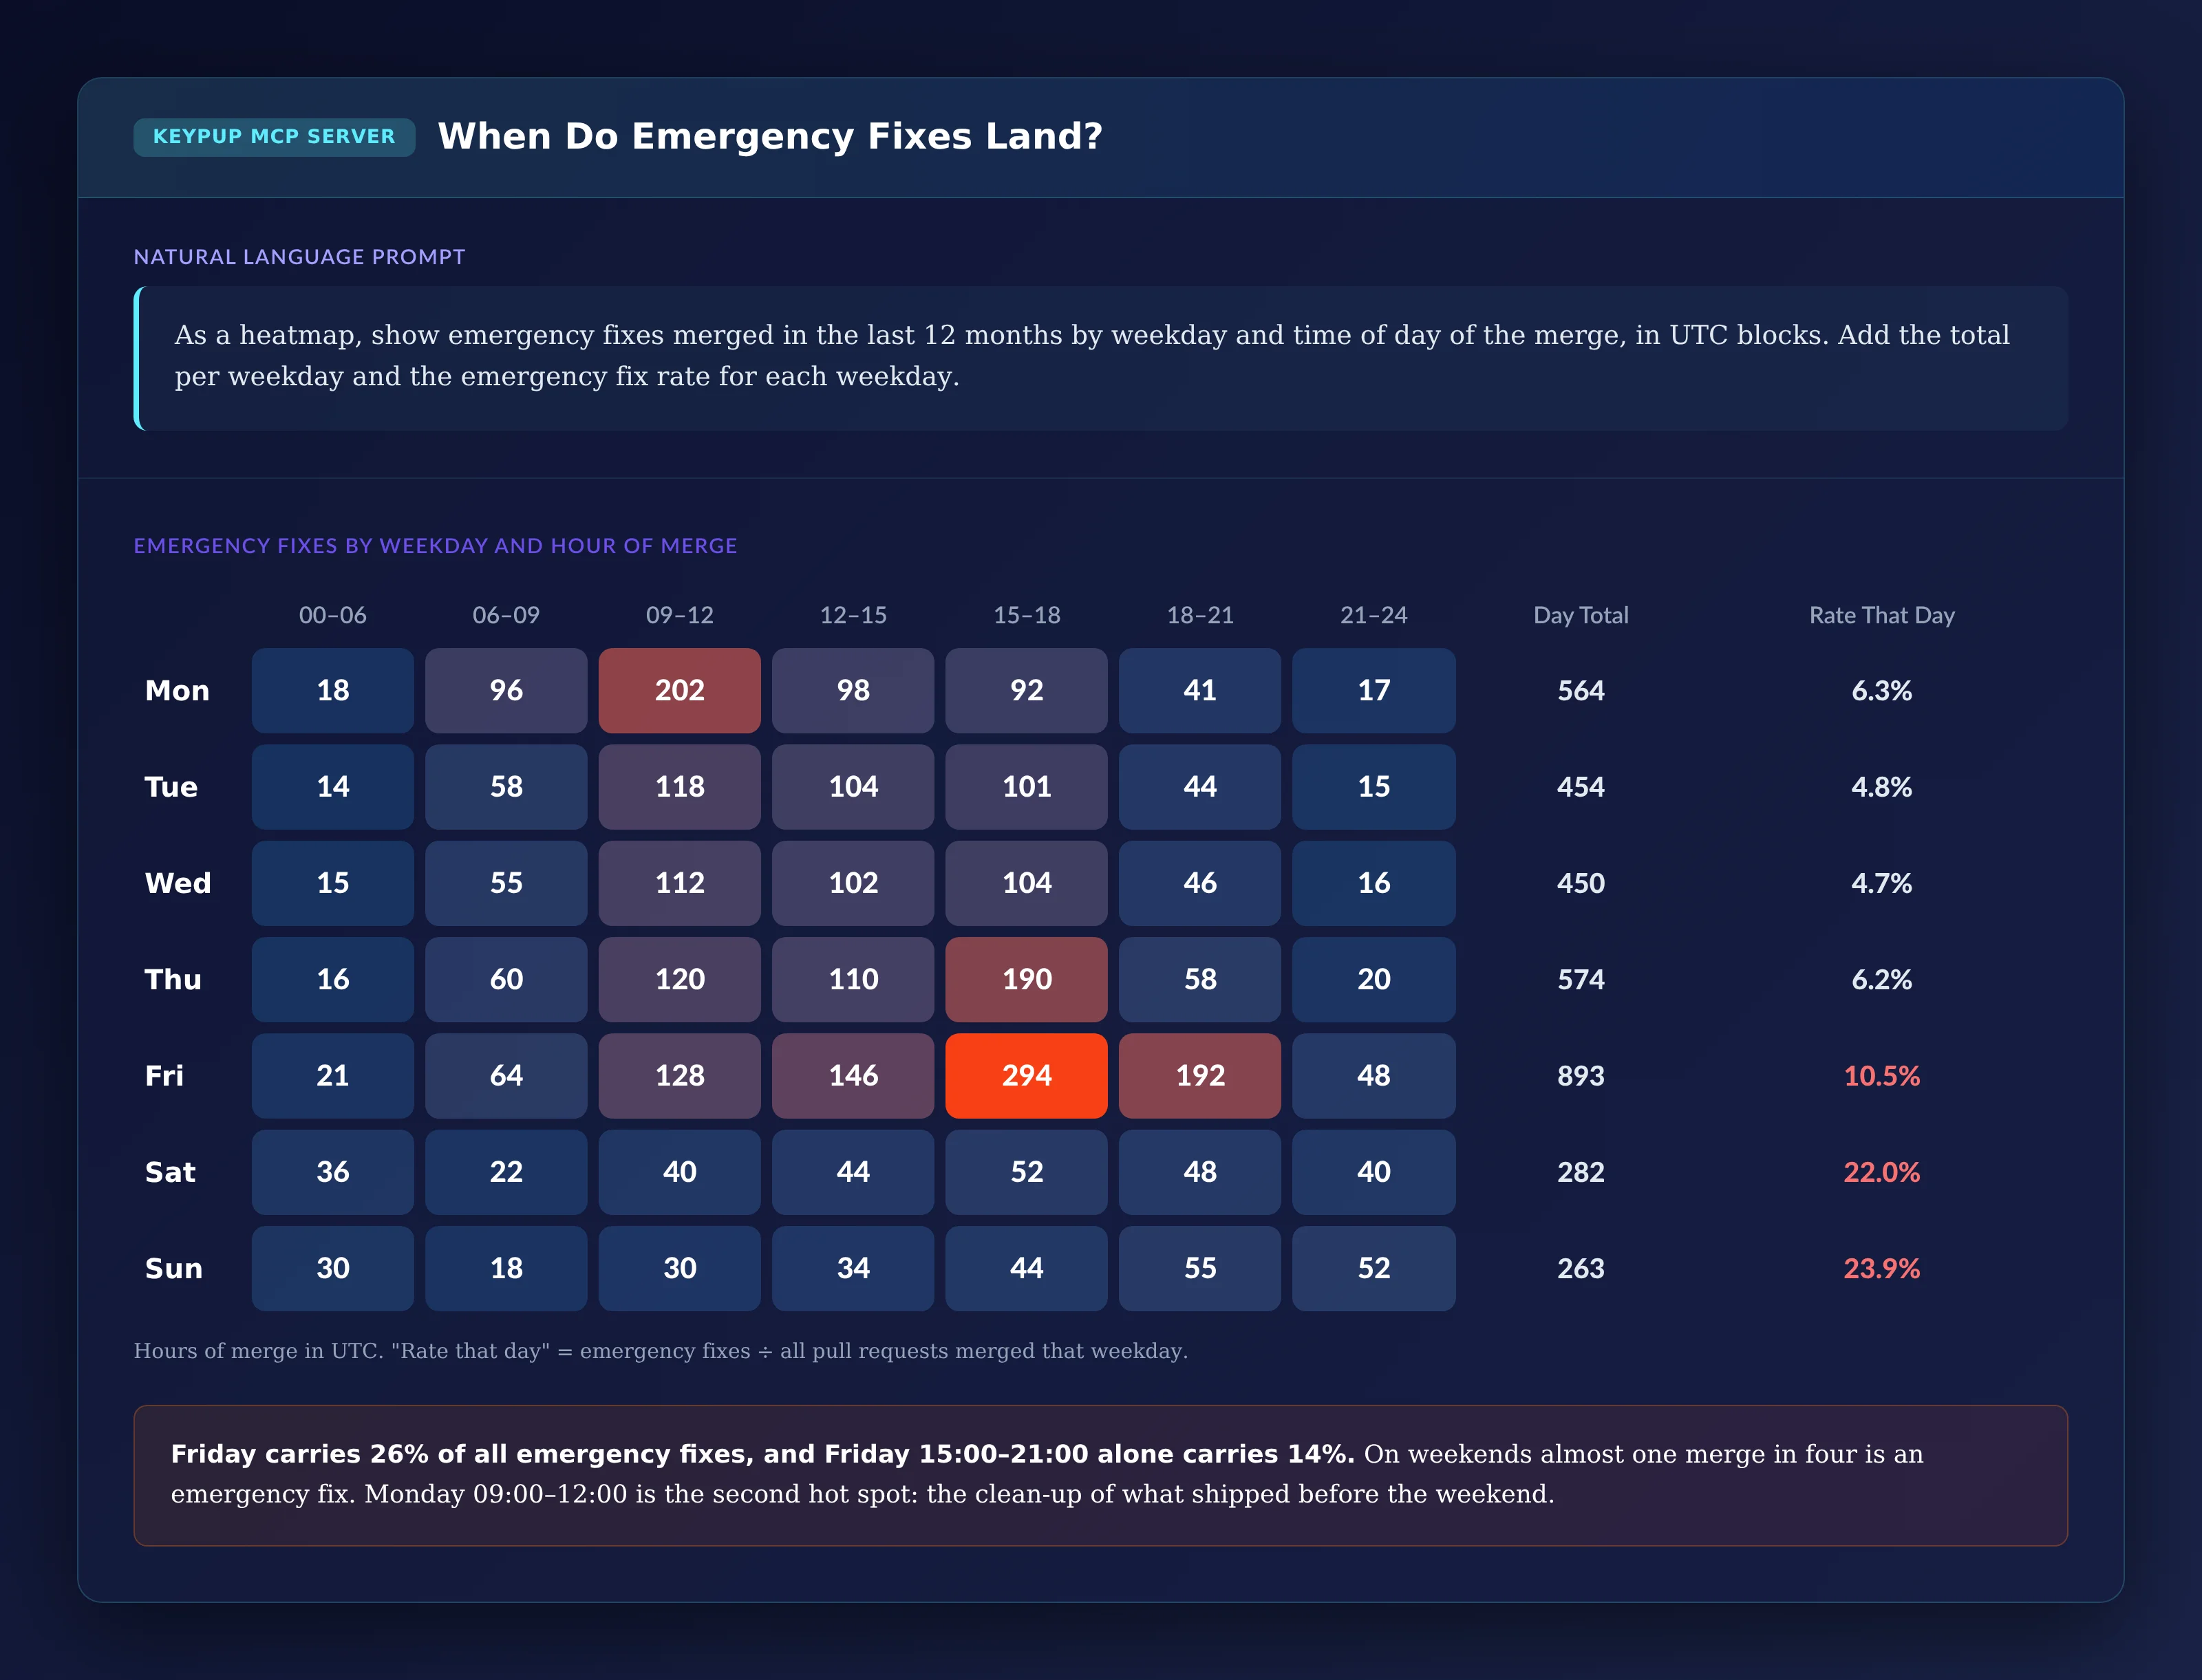
As a heatmap, show emergency fixes merged in the last 12 months
by weekday and time of day of the merge, in UTC blocks. Add the
total per weekday and the emergency fix rate for each weekday.
Output: When Do Emergency Fixes Land?
Key Insight: Friday carries 26% of all emergency fixes, and Friday 15:00–21:00 alone carries 14%. On weekends, almost one merge in four is an emergency fix. Monday morning is the second hot spot: the clean-up of what shipped before the weekend. Times are in UTC; for teams spread over several time zones, ask your assistant to split the heatmap by repository or region.
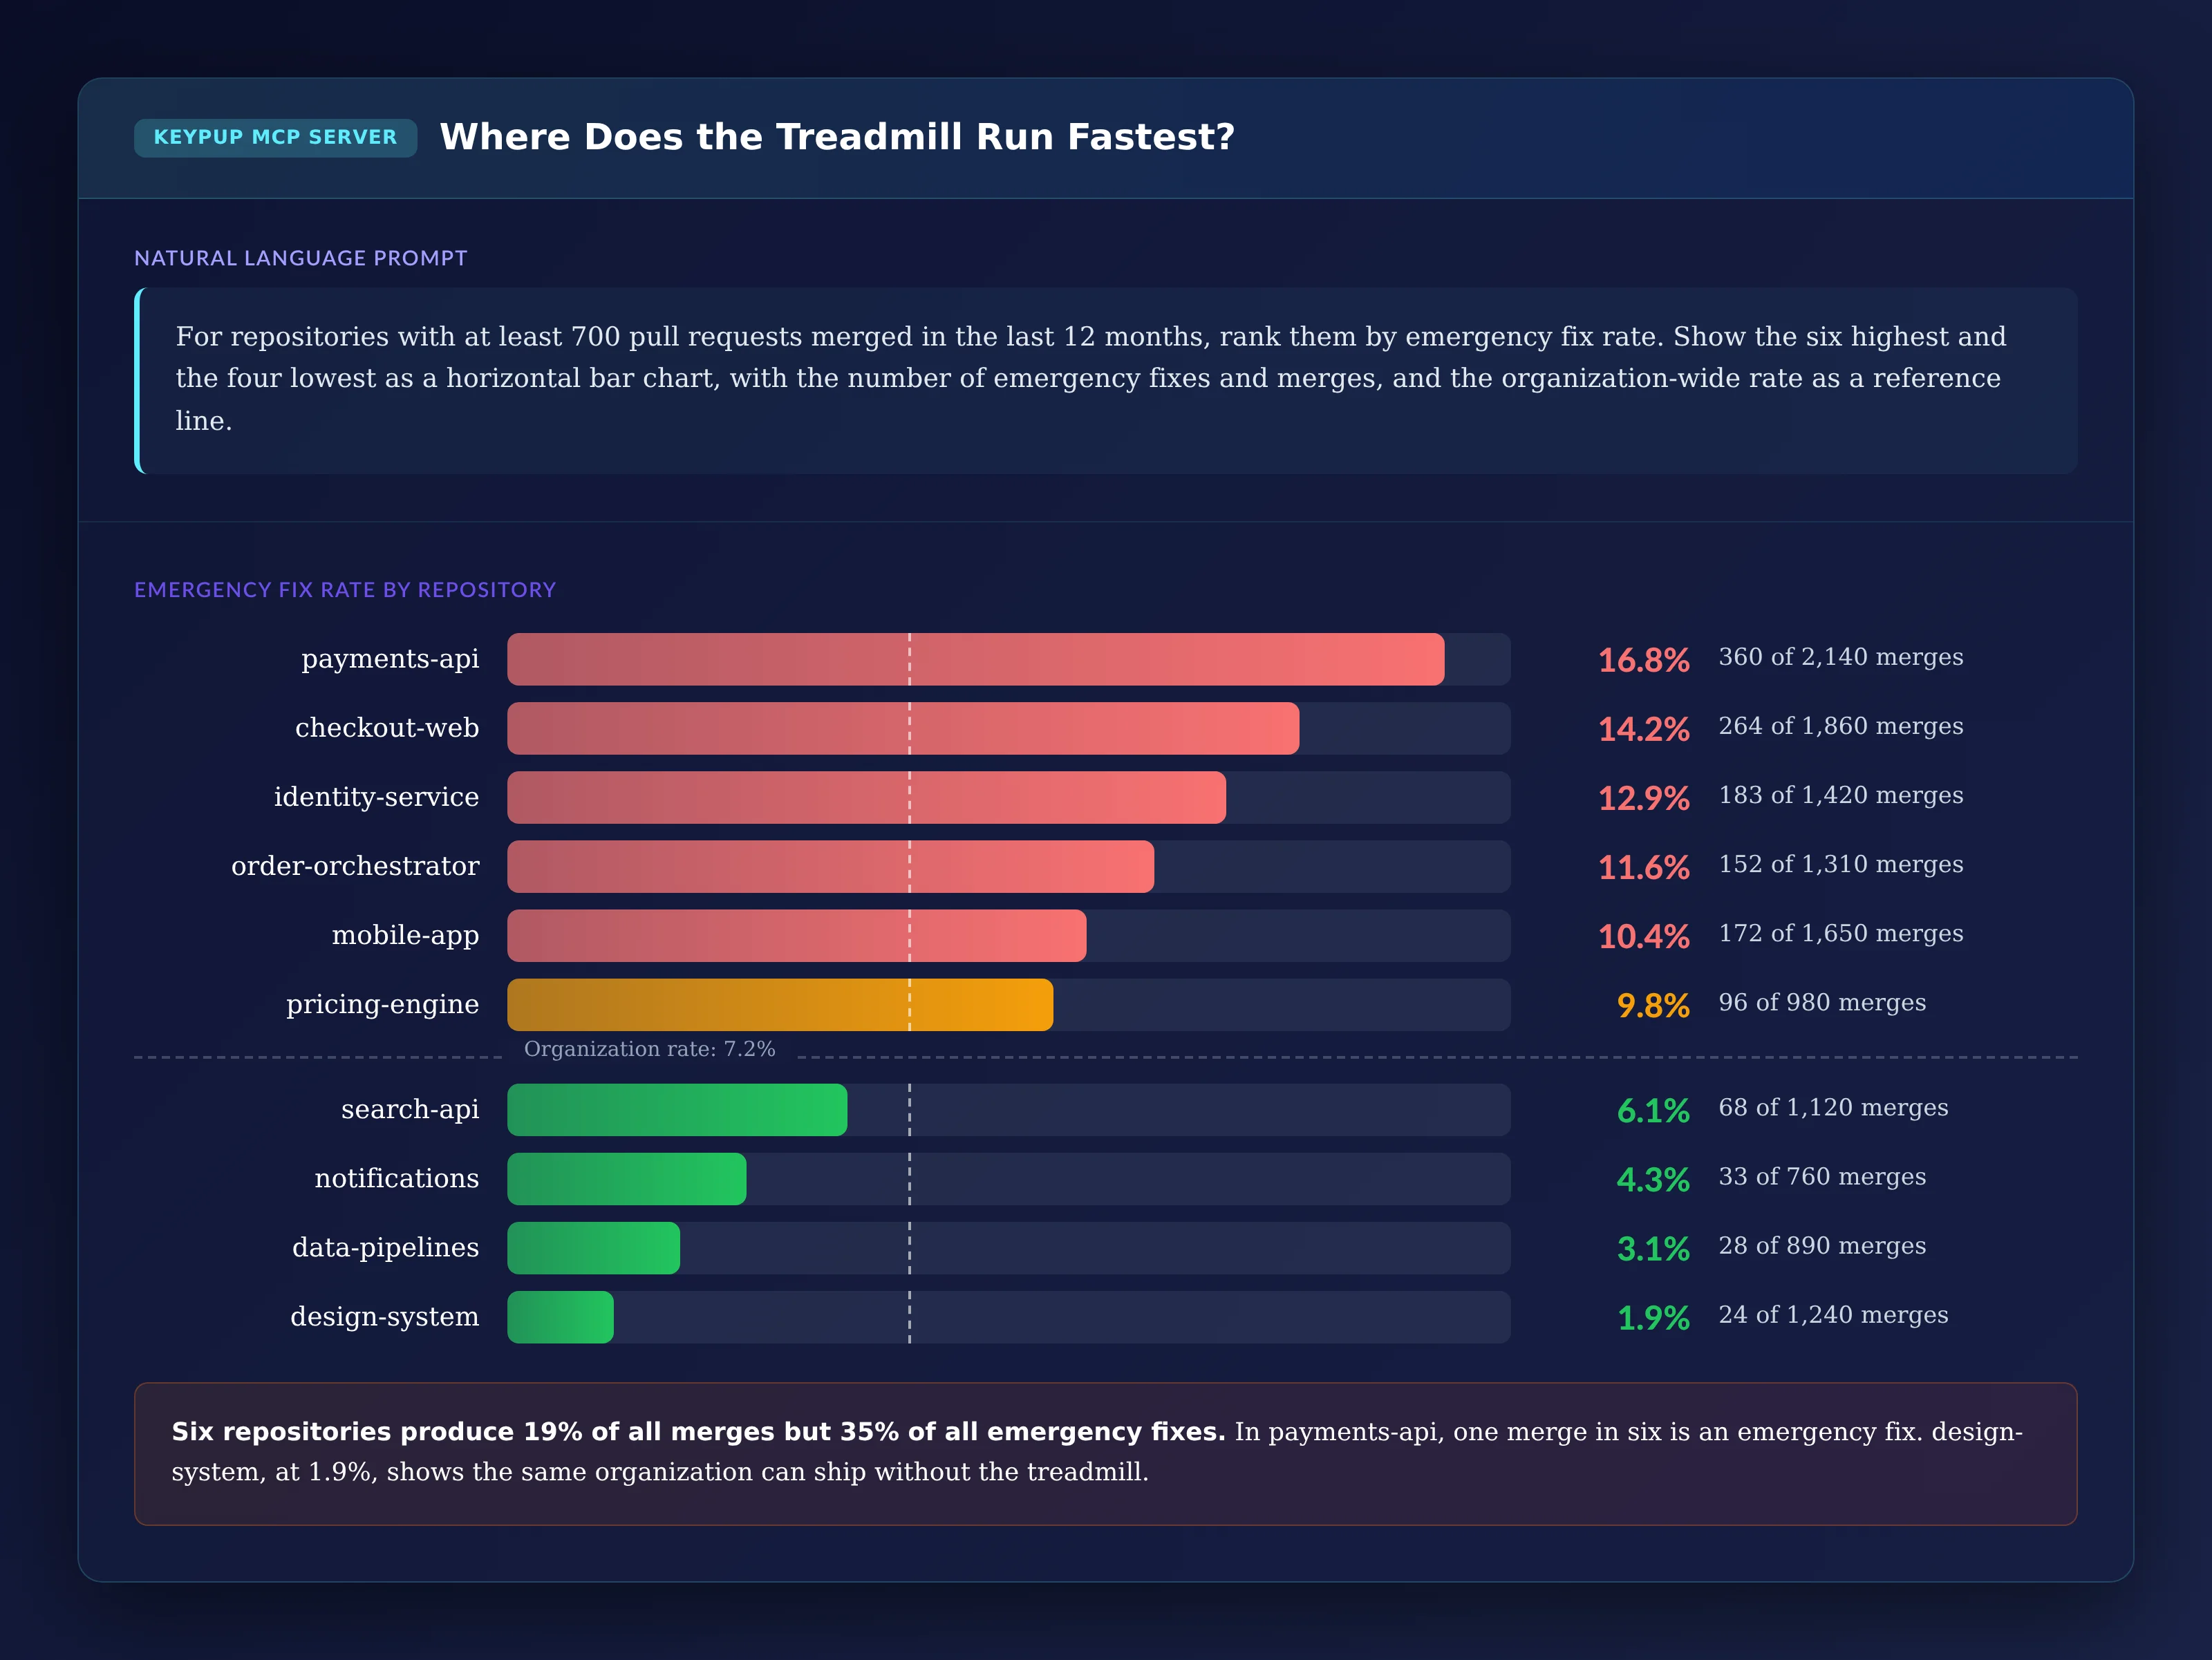
4. Finding Where the Treadmill Runs Fastest
An organization-wide rate hides where the fires actually start.
MCP Prompt:
For repositories with at least 700 pull requests merged in the
last 12 months, rank them by emergency fix rate. Show the six
highest and the four lowest as a horizontal bar chart, with the
number of emergency fixes and merges, and the organization-wide
rate as a reference line.
Output: Where Does the Treadmill Run Fastest?
Key Insight: Six repositories produce 19% of all merges but 35% of all emergency fixes. In payments-api, one merge in six is an emergency fix. design-system, at 1.9%, shows the same organization can ship without the treadmill.
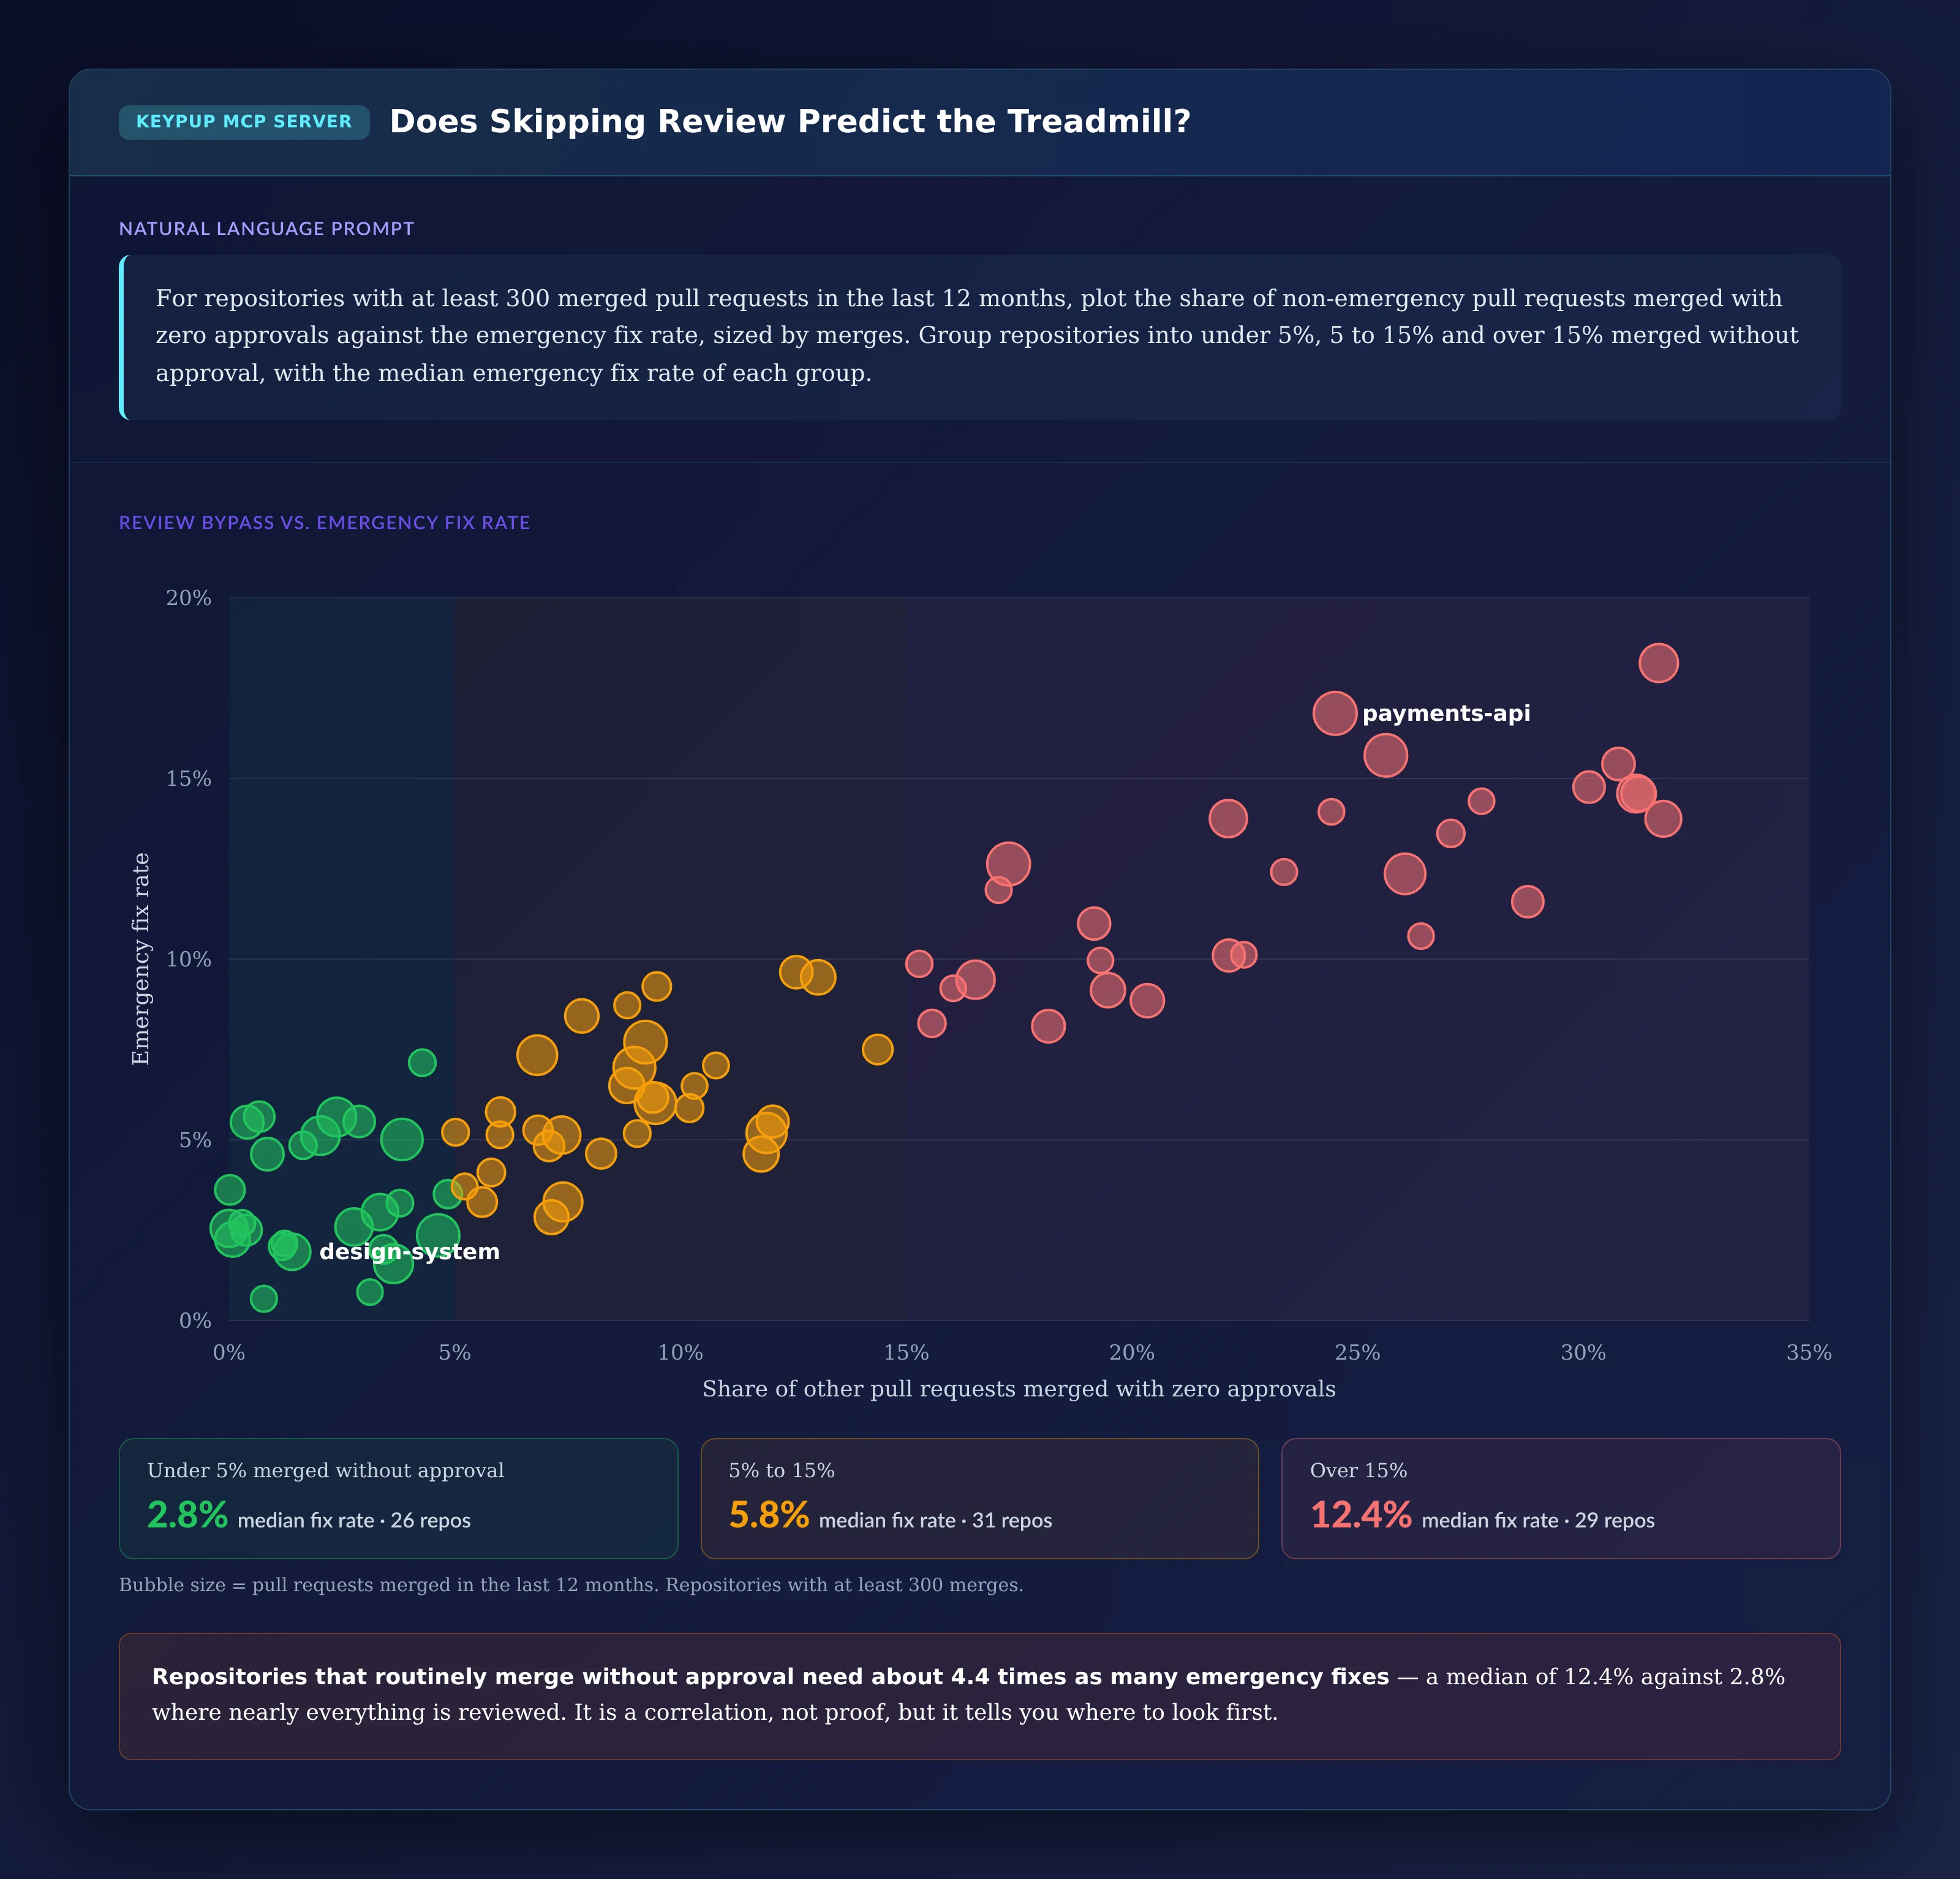
5. Testing Whether Skipped Reviews Predict the Treadmill
If emergency fixes are the cost of changes that weren't reviewed, repositories that skip reviews should need more of them.
MCP Prompt:
For repositories with at least 300 merged pull requests in the
last 12 months, plot the share of non-emergency pull requests
merged with zero approvals against the emergency fix rate, sized
by merges. Group repositories into under 5%, 5 to 15% and over
15% merged without approval, with the median emergency fix rate
of each group.
Output: Does Skipping Review Predict the Treadmill?
Key Insight: Repositories that routinely merge without approval need about 4.4 times as many emergency fixes — a median of 12.4% against 2.8% where nearly everything is reviewed. It is a correlation, not proof, but it tells you where to look first.
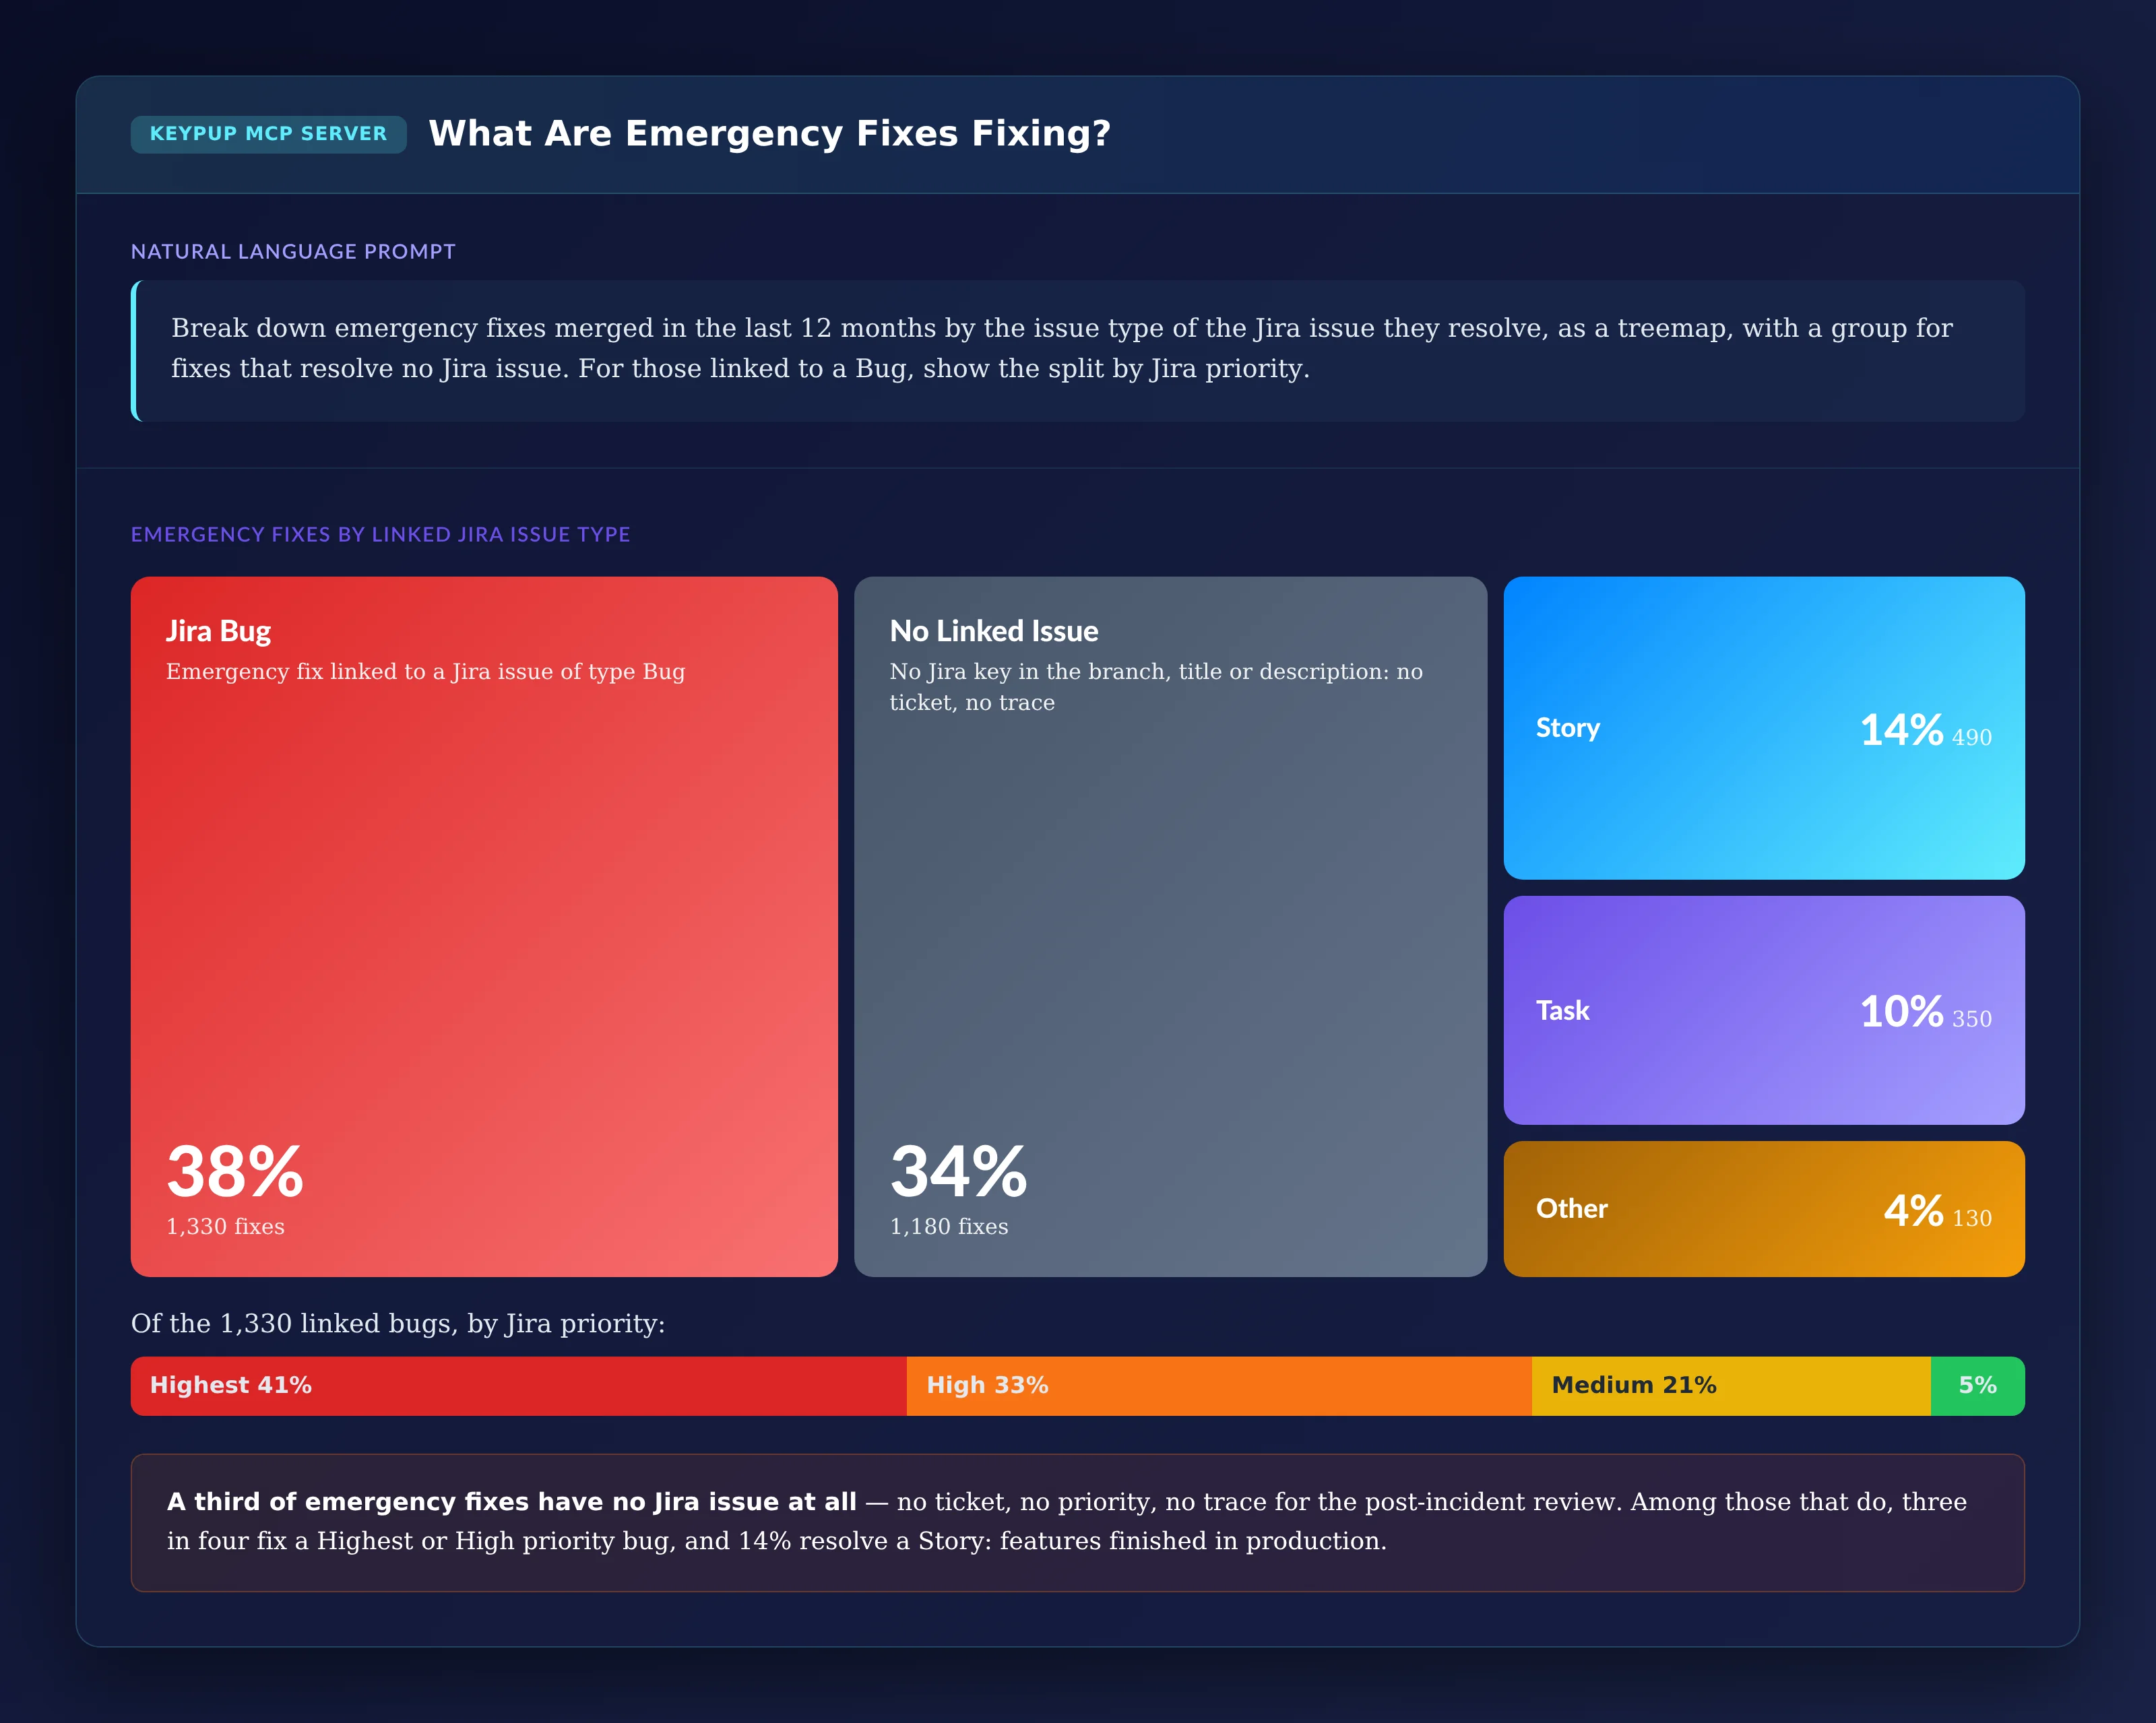
6. Finding What Emergency Fixes Are Fixing
A hotfix linked to a Jira bug can be traced, prioritized and reviewed after the fact. A hotfix linked to nothing disappears.
MCP Prompt:
Break down emergency fixes merged in the last 12 months by the
issue type of the Jira issue they resolve, as a treemap, with a
group for fixes that resolve no Jira issue. For those linked to
a Bug, show the split by Jira priority.
Output: What Are Emergency Fixes Fixing?
Key Insight: A third of emergency fixes have no Jira issue at all — no ticket, no priority, no trace for the post-incident review. Among those that do, three in four fix a Highest or High priority bug, and 14% resolve a Story: features finished in production.
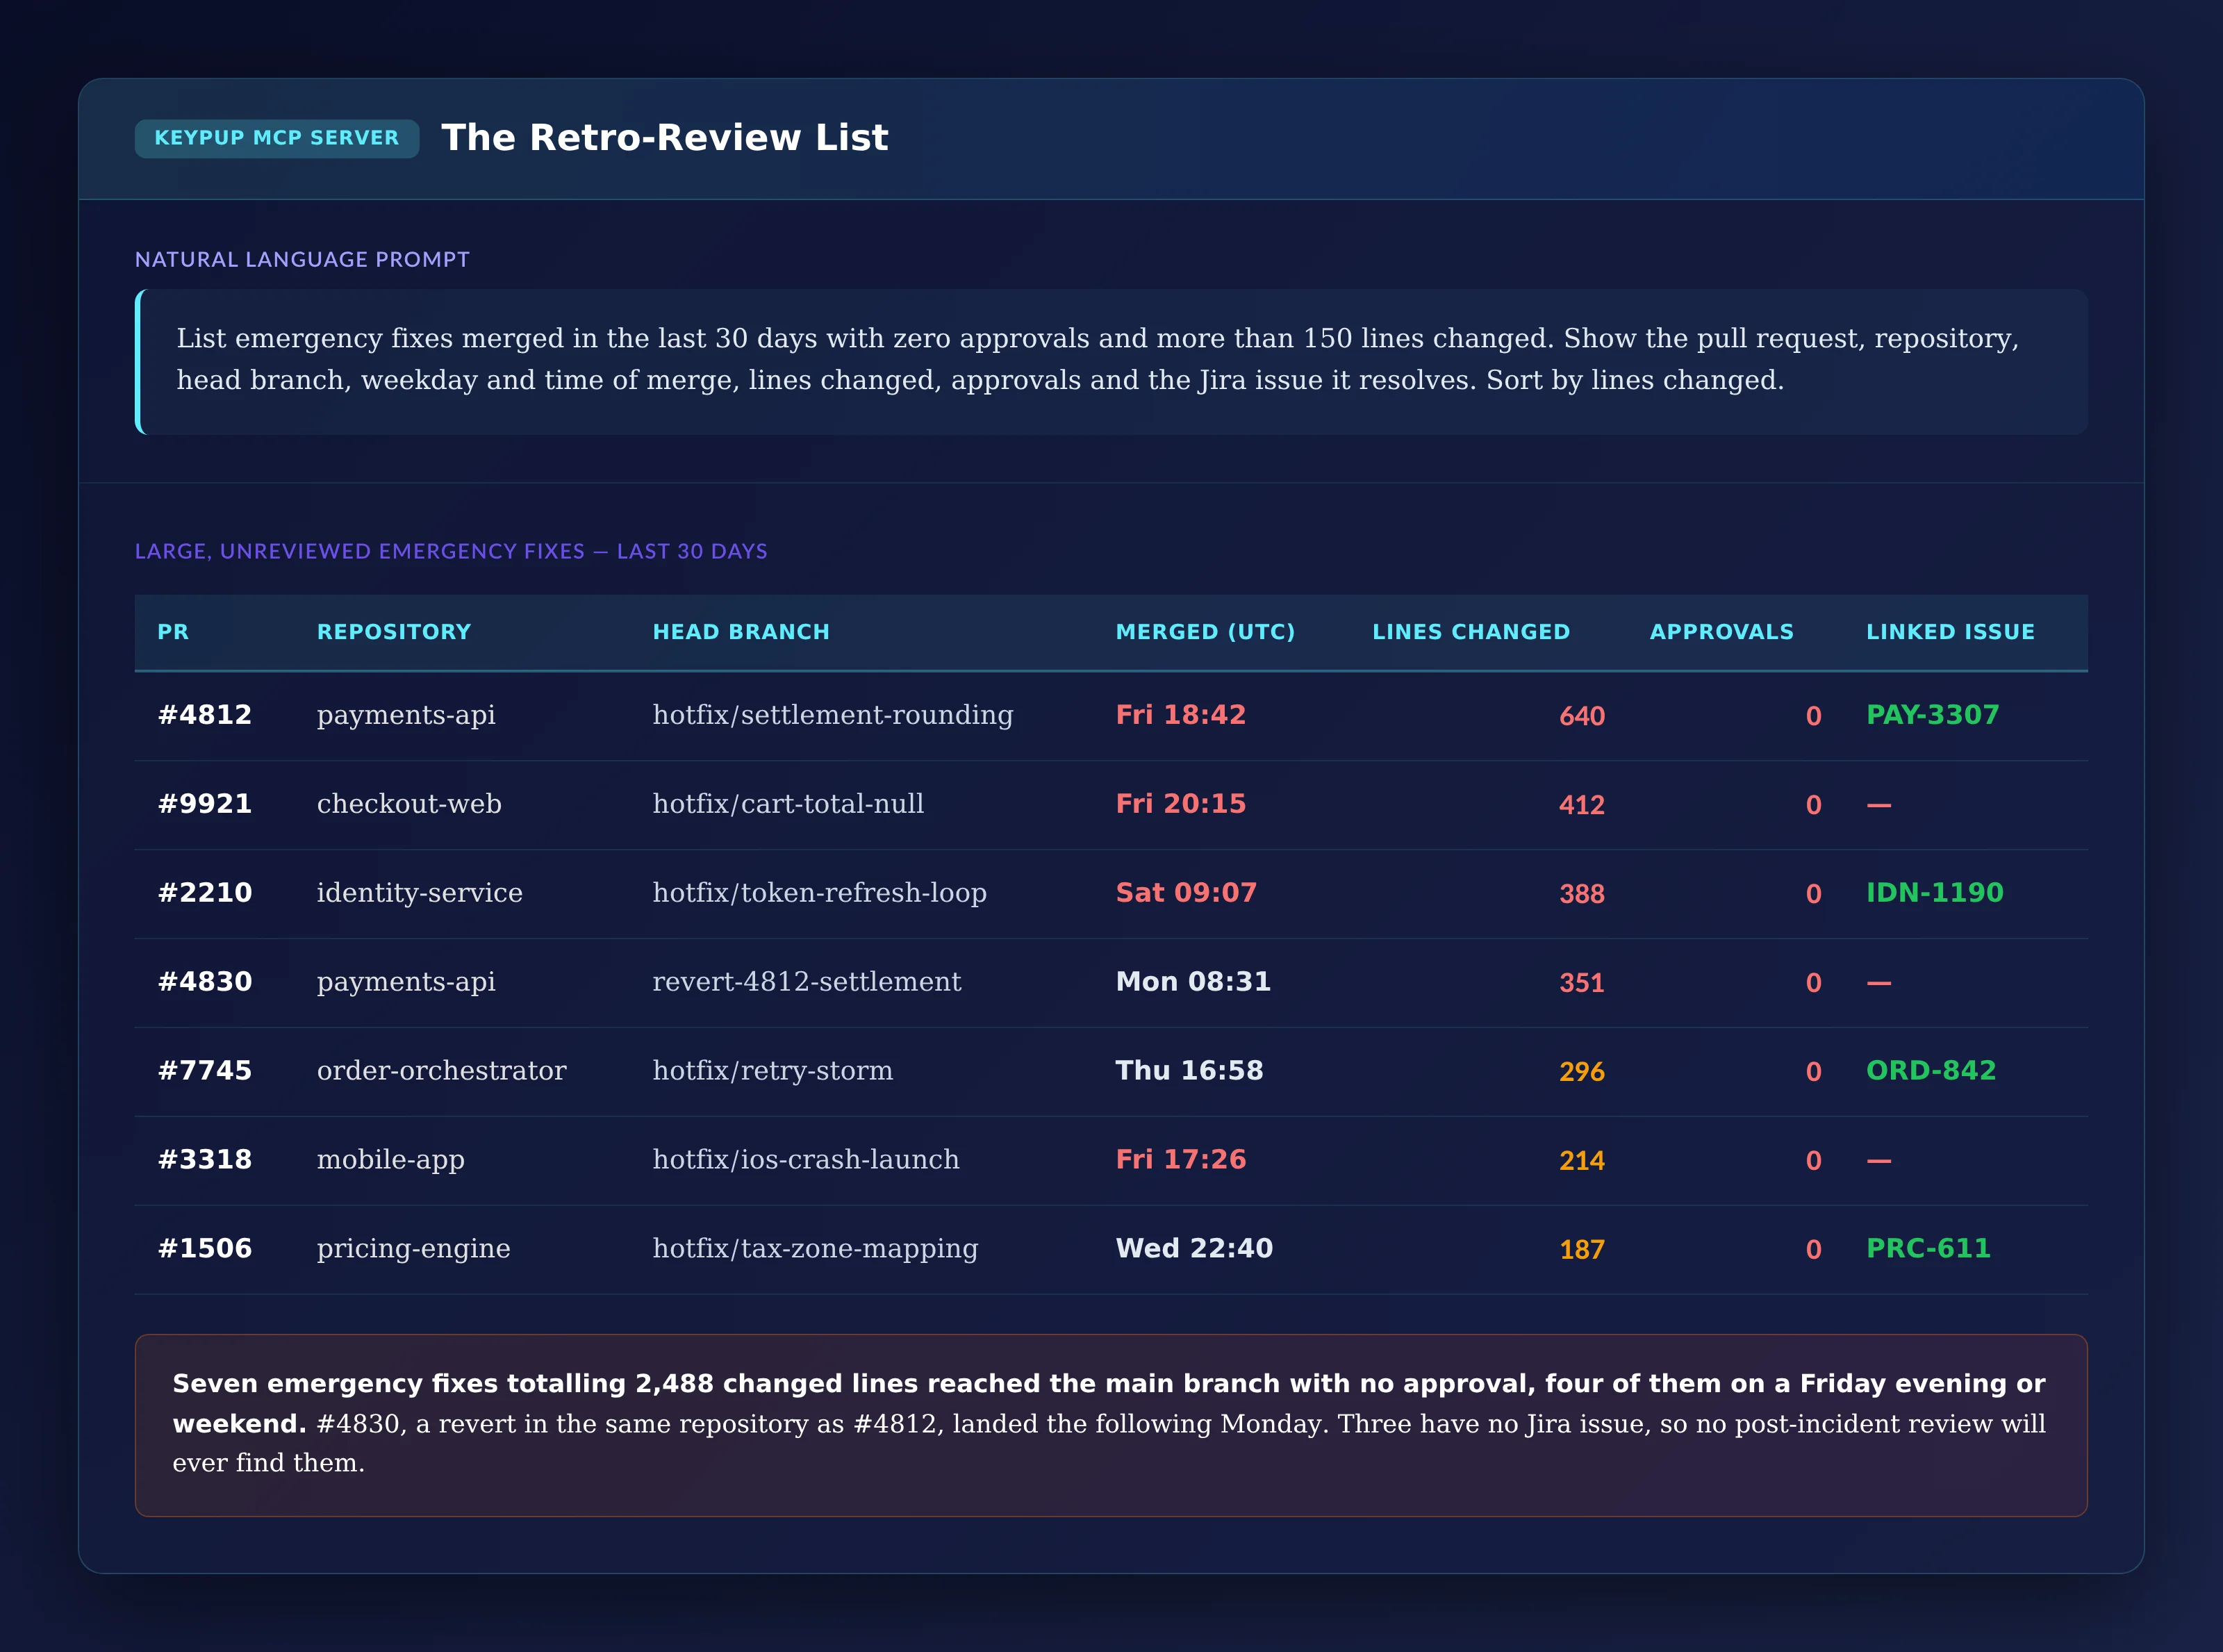
7. Building the Retro-Review List
The last step turns the analysis into something to act on this week: which large emergency fixes went in without anyone looking at them?
MCP Prompt:
List emergency fixes merged in the last 30 days with zero
approvals and more than 150 lines changed. Show the pull
request, repository, head branch, weekday and time of merge,
lines changed, approvals and the Jira issue it resolves. Sort
by lines changed.
Output: The Retro-Review List
PR
Repository
Head Branch
Merged (UTC)
Lines Changed
Approvals
Linked Issue
#4812
payments-api
hotfix/settlement-rounding
Fri 18:42
640
0
PAY-3307
#9921
checkout-web
hotfix/cart-total-null
Fri 20:15
412
0
—
#2210
identity-service
hotfix/token-refresh-loop
Sat 09:07
388
0
IDN-1190
#4830
payments-api
revert-4812-settlement
Mon 08:31
351
0
—
#7745
order-orchestrator
hotfix/retry-storm
Thu 16:58
296
0
ORD-842
#3318
mobile-app
hotfix/ios-crash-launch
Fri 17:26
214
0
—
#1506
pricing-engine
hotfix/tax-zone-mapping
Wed 22:40
187
0
PRC-611
Key Insight: Seven emergency fixes totalling 2,488 changed lines reached the main branch with no approval, four of them on a Friday evening or weekend. #4830, a revert in the same repository as #4812, landed the following Monday. Three have no Jira issue, so no post-incident review will ever find them.
The Technical Implementation: What Keypup MCP Actually Reads
Every number above comes from fields Keypup already imports from your Git platforms and Jira. It helps to be precise about what they are — and what they aren't.
Emergency Fixes Come From Your Naming Conventions
Keypup imports each pull request's head branch name, labels and title. An emergency fix is whatever your conventions say it is: a hotfix/ branch prefix, a hotfix or incident label, or the "Revert" title Git platforms generate for a revert. Keypup does not read your incident tool or your deployment pipeline, so a hotfix that follows none of your conventions — or a rollback done outside Git — isn't counted. Treat the rate as a lower bound until naming is consistent.
Review Bypass Comes From Approval Counts
For each pull request, Keypup records the number of approvals received, along with the review request and approval dates. "Merged with zero approvals" means no reviewer approved the pull request on the Git platform. Approvals given in a chat thread or a call are not visible.
Timing Comes From Merge Dates
Weekday and hour come from the merge date of the pull request, stored in UTC. That is when the fix reached the target branch, not when it was deployed: Keypup does not import deployment events. Speed is measured from the pull request's creation date to its merge date.
Linked Issues Depend on How Pull Requests Reference Jira
Keypup links a pull request to the Jira issues it resolves when the issue key appears in the branch name, title, description or commit messages. The linked issue's type and priority come from your Jira configuration. A fix with no key in any of those places shows up as "no linked issue" — which is itself the finding.
Repositories and Size Come From the Pull Request
The ranking groups pull requests by target repository. Size is the pull request's lines changed, additions plus deletions. If your teams map to repositories, the ranking is a team view; if several teams share a monorepo, group by the Jira project of the issues each pull request resolves instead, provided your pull requests reference Jira issue keys.
Real-World Impact: Enterprise Case Studies
Case Study 1: European Payments Provider
Before Keypup MCP:
900 engineers across 220 repositories
A change failure rate of 2.5% reported to the board, counted from P1 incidents
A two-approval policy with an "emergency" exception used without limits
After Keypup MCP:
The health check showed an emergency fix rate of 8.4%, more than three times the reported figure, which became the number in the board deck
The weekday heatmap showed 31% of emergency fixes merged on Fridays, which led to a "no non-urgent production merges after 15:00 on Friday" rule
The retro-review list became a standing Monday ritual: every unreviewed emergency fix above 150 lines gets a review within two working days; the emergency fix rate fell to 5.1% in three quarters
"We were reporting the change failure rate we wanted, not the one we had. Measuring it from Git was uncomfortable for one board meeting — and it's the reason we now have the budget to fix the release process."
— CTO, European Payments Provider
Case Study 2: North American Retail Group
Before Keypup MCP:
1,400 engineers, 4,000+ merged pull requests a month
Throughput dashboards that ranked the most firefighting-heavy teams as the most productive
Post-incident reviews that could only find half of the fixes involved
After Keypup MCP:
Throughput reports now exclude emergency fixes, and show the emergency fix rate next to them for every repository
Every hotfix branch must reference a Jira issue; the share of emergency fixes with no linked issue fell from 36% to 9% in two quarters, making every fix traceable
The six repositories at the top of the ranking got a dedicated quality investment — test coverage and staged rollouts — and their combined emergency fix rate halved within a year
"Our most 'productive' team was the one fixing its own releases three times over. Once the emergency fix rate sat next to the merge count, the conversation changed from 'ship more' to 'ship once'."
— VP Engineering, North American Retail Group
Implementation: Getting Started with Keypup MCP
1. Connect Your Git Platforms and Jira
Connect GitHub, GitLab, Bitbucket or Azure DevOps, and Jira, to Keypup. Pull requests, their branches, labels, approvals and linked issues are imported automatically.
2. Agree on What an Emergency Fix Is
Write the definition down: a hotfix/ branch prefix, a hotfix label, revert titles — or all three. If teams use different conventions, list them all in your prompts until you standardize.
3. Require a Jira Key on Every Fix
Ask teams to put the Jira issue key in every hotfix branch name or title. It takes seconds during an incident and makes every emergency fix traceable afterwards.
4. Connect the MCP Server to Your AI Assistant
Follow the MCP documentation to connect Keypup to Claude, ChatGPT, Cursor or any MCP-compatible assistant.
5. Set a Baseline, Then Retro-Review Every Week
Run the health check and the monthly trend to set a baseline. Then review the retro-review list every week, and track the emergency fix rate next to throughput in every engineering report — so a team running on the treadmill is never mistaken for a fast one.
Frequently Asked Questions
What is the hotfix treadmill?
It is the pattern where a growing share of an engineering organization's merged work fixes or reverts what it recently shipped. Each emergency fix takes capacity from planned work and is often merged with little review, which makes further fixes more likely.
How do you measure change failure rate from Git?
Count merged pull requests that are emergency fixes — identified by a hotfix branch prefix, a hotfix label or a revert title — and divide by all merged pull requests over the same period. Keypup MCP computes this from the branch, labels and title of every pull request. It approximates change failure rate from the code side; it doesn't replace incident data.
Why are hotfixes merged without review?
Because emergency changes are made under time pressure, often outside working hours, when reviewers aren't available and approval rules have an emergency exception. Measuring the share of emergency fixes merged with zero approvals shows how often the exception has become the rule.
What is a good emergency fix rate?
There is no universal benchmark: it depends on your naming conventions and release model. The trend and the spread between repositories matter more than the absolute value — a rate that rises every month, or a repository far above its peers, needs attention.
The Bottom Line
Throughput that includes fixing your own releases isn't throughput. Keypup MCP shows how much of your delivery is running on the hotfix treadmill — and where to step off:
✅ Measuring the emergency fix rate from branches, labels and revert titles ✅ Tracking the trend of hotfixes and reverts month by month ✅ Showing when emergency fixes land, by weekday and time of day ✅ Ranking repositories to find where the treadmill runs fastest ✅ Testing whether skipped reviews go with more emergency fixes ✅ Breaking emergency fixes down by linked Jira issue type and priority ✅ Listing the large unreviewed fixes that need a retro-review
Ready to find out how much of your throughput is firefighting? Connect the Keypup MCP Server and ask your AI assistant.
Ready to Transform Your Analytics?
Join teams already using AI to make data-driven decisions faster than
ever.
Why do some Jira tickets bounce between engineers and teams for weeks before anyone fixes them? Learn what engineering leaders on Reddit say about ticket reassignment churn at enterprise scale, and how Keypup MCP uses previous assignees, assignment dates, issue types, projects and linked pull request authors to measure how often tickets change hands, what each hand-off costs in cycle time, who actually wrote the code and which open tickets are being passed around right now.
Compare the 6 best engineering analytics tools for Jira and Git in 2026 — Keypup, LinearB, Jellyfish, Swarmia, Faros AI and Pluralsight Flow — across Git and Jira unification, DORA Metrics and cycle time, dashboard customization, AI and natural language, integration breadth, setup speed and security. Find out which platform turns your code and ticketing data into one reporting layer with prescriptive recommendations.
Why do pull requests sit for days before anyone reviews them? Learn what engineering leaders on Reddit say about code review bottlenecks at enterprise scale, and how Keypup MCP uses review request dates, first review dates, approvals, reviewers and lines changed to measure your wait for first review, break cycle time into phases, find when requests get stuck, show who carries the review load and list the pull requests waiting right now.