6 Best Engineering Metrics Tools for Benchmarking (2026)
Compare the 6 best engineering metrics tools for multi-team benchmarking in 2026 — Keypup, LinearB, Swarmia, Jellyfish, Faros and Appfire Flow — on cross-team benchmarking, org-level rollups, DORA Metrics, Git-to-ticketing linking, custom KPIs, AI capabilities and data security. See how to compare teams on equal terms and find where your delivery process is broken.
Liam Davis
•14 min read
Table of Contents
Every engineering leader managing multiple teams faces the same structural problem: each squad tracks its own metrics in its own way, and no single view connects those numbers into a coherent picture of org-wide delivery health. You end up reconciling spreadsheets the night before a board meeting, and the data still does not answer the question that matters: where is the process broken?
The right engineering metrics software closes that gap. It unifies Git and project management data into one normalized model, so you can benchmark teams against each other, roll results up to the org level, and diagnose bottlenecks before they become missed releases.
This comparison evaluates six platforms on the criteria that matter most for multi-team benchmarking: data unification, DORA Metrics, custom rollups, and AI-driven diagnosis. Keypup leads the list for its ability to turn fragmented engineering data into prescriptive, org-level insights.
Quick guide: 6 best engineering metrics tools for team benchmarking
Keypup: The best engineering intelligence platform for multi-team benchmarking, org-level rollups, and AI-driven prescriptive analytics from unified Git and ticketing data.
LinearB: Combines workflow automation with delivery metrics for teams that prioritize PR orchestration and governance.
Swarmia: Pairs system metrics with built-in developer surveys for organizations focused on team health alongside DORA tracking.
Jellyfish: Contextualizes engineering signals with business and HR data for leadership reporting on resource allocation.
Faros: An enterprise-grade data platform built to ingest engineering metadata for organizations with thousands of developers.
Appfire Flow (formerly Pluralsight Flow): Provides commit-level analytics and workflow diagnostics (note: scheduled for retirement on December 31, 2027).
How we chose the best engineering metrics tools for team benchmarking
We evaluated each platform with engineering leaders in mind, focusing on the capabilities that directly affect how quickly you move from raw data to org-level decisions. Here is what we looked for:
Cross-team benchmarking depth: Can you compare throughput, cycle time, and quality across multiple squads in a single view without building custom queries?
Org-level rollups: Does the platform aggregate team-level data into executive-ready summaries that keep the same definitions from the board to the team?
DORA Metrics out of the box: Can you track Deployment Frequency, Lead Time for Changes, Change Failure Rate, and Time to Restore without a long configuration project?
Git-to-ticketing integration depth: Does the platform automatically link pull requests, commits, and branches to Jira issues, or do you maintain that mapping yourself?
Custom KPI configurability: Can you define your own formulas, filters, and drill-downs to match how your organization actually measures performance?
AI and natural language capabilities: Can you ask questions in plain English, and does the AI only answer, or does it also build dashboards, diagnose bottlenecks, and recommend actions?
Data security posture: Does the platform access your source code, or does it operate strictly on metadata?
The 6 best engineering metrics tools for team benchmarking
1. Keypup: Best overall engineering metrics tool for team benchmarking
Keypup is an AI-powered engineering intelligence platform that unifies Git and ticketing metadata into a single normalized data model. Instead of forcing you to build dashboards from scratch, Keypup lets you describe a benchmarking question in plain English. The AI Agent then generates a multi-insight dashboard complete with filters, drill-downs, and documentation for each insight.
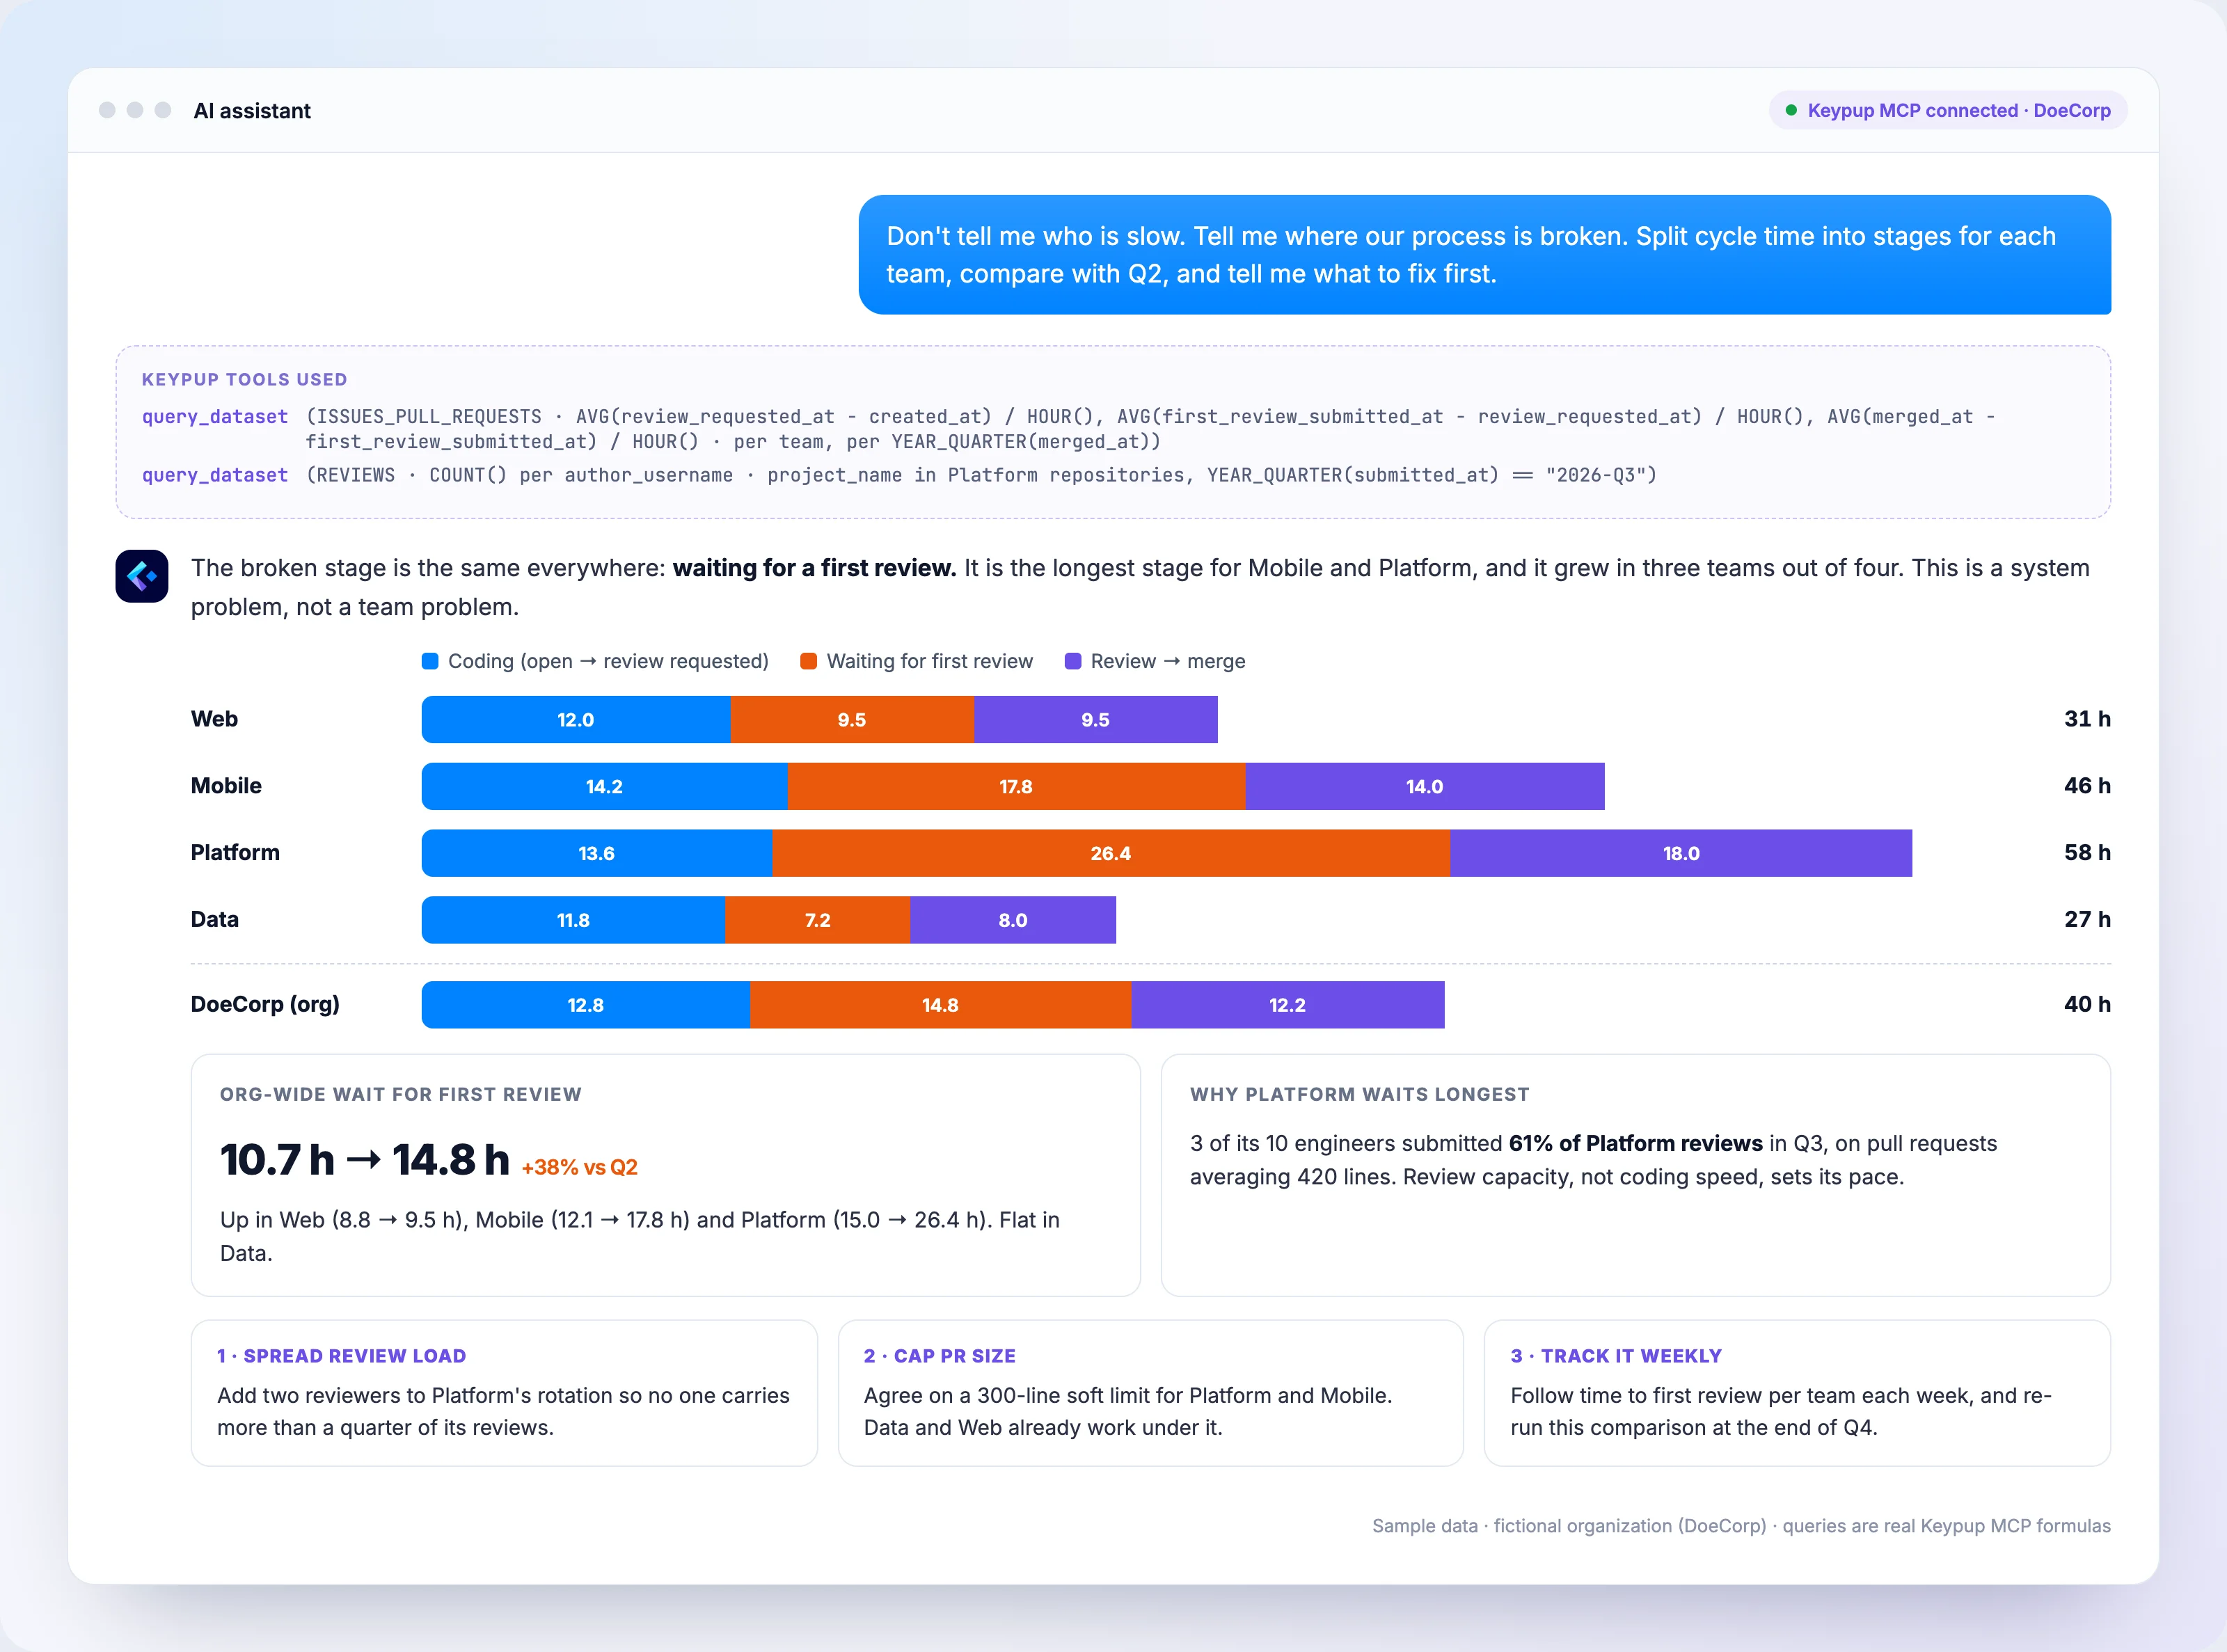
What sets Keypup apart for multi-team benchmarking is its prescriptive layer. With AI SDLC Diagnosis, the AI Agent analyzes your dashboards, identifies systemic bottlenecks across your teams, and recommends concrete improvements. Instead of asking "who is slow?", you can ask "where is our process broken?" and get an answer scoped to specific squads, repositories, or time windows.
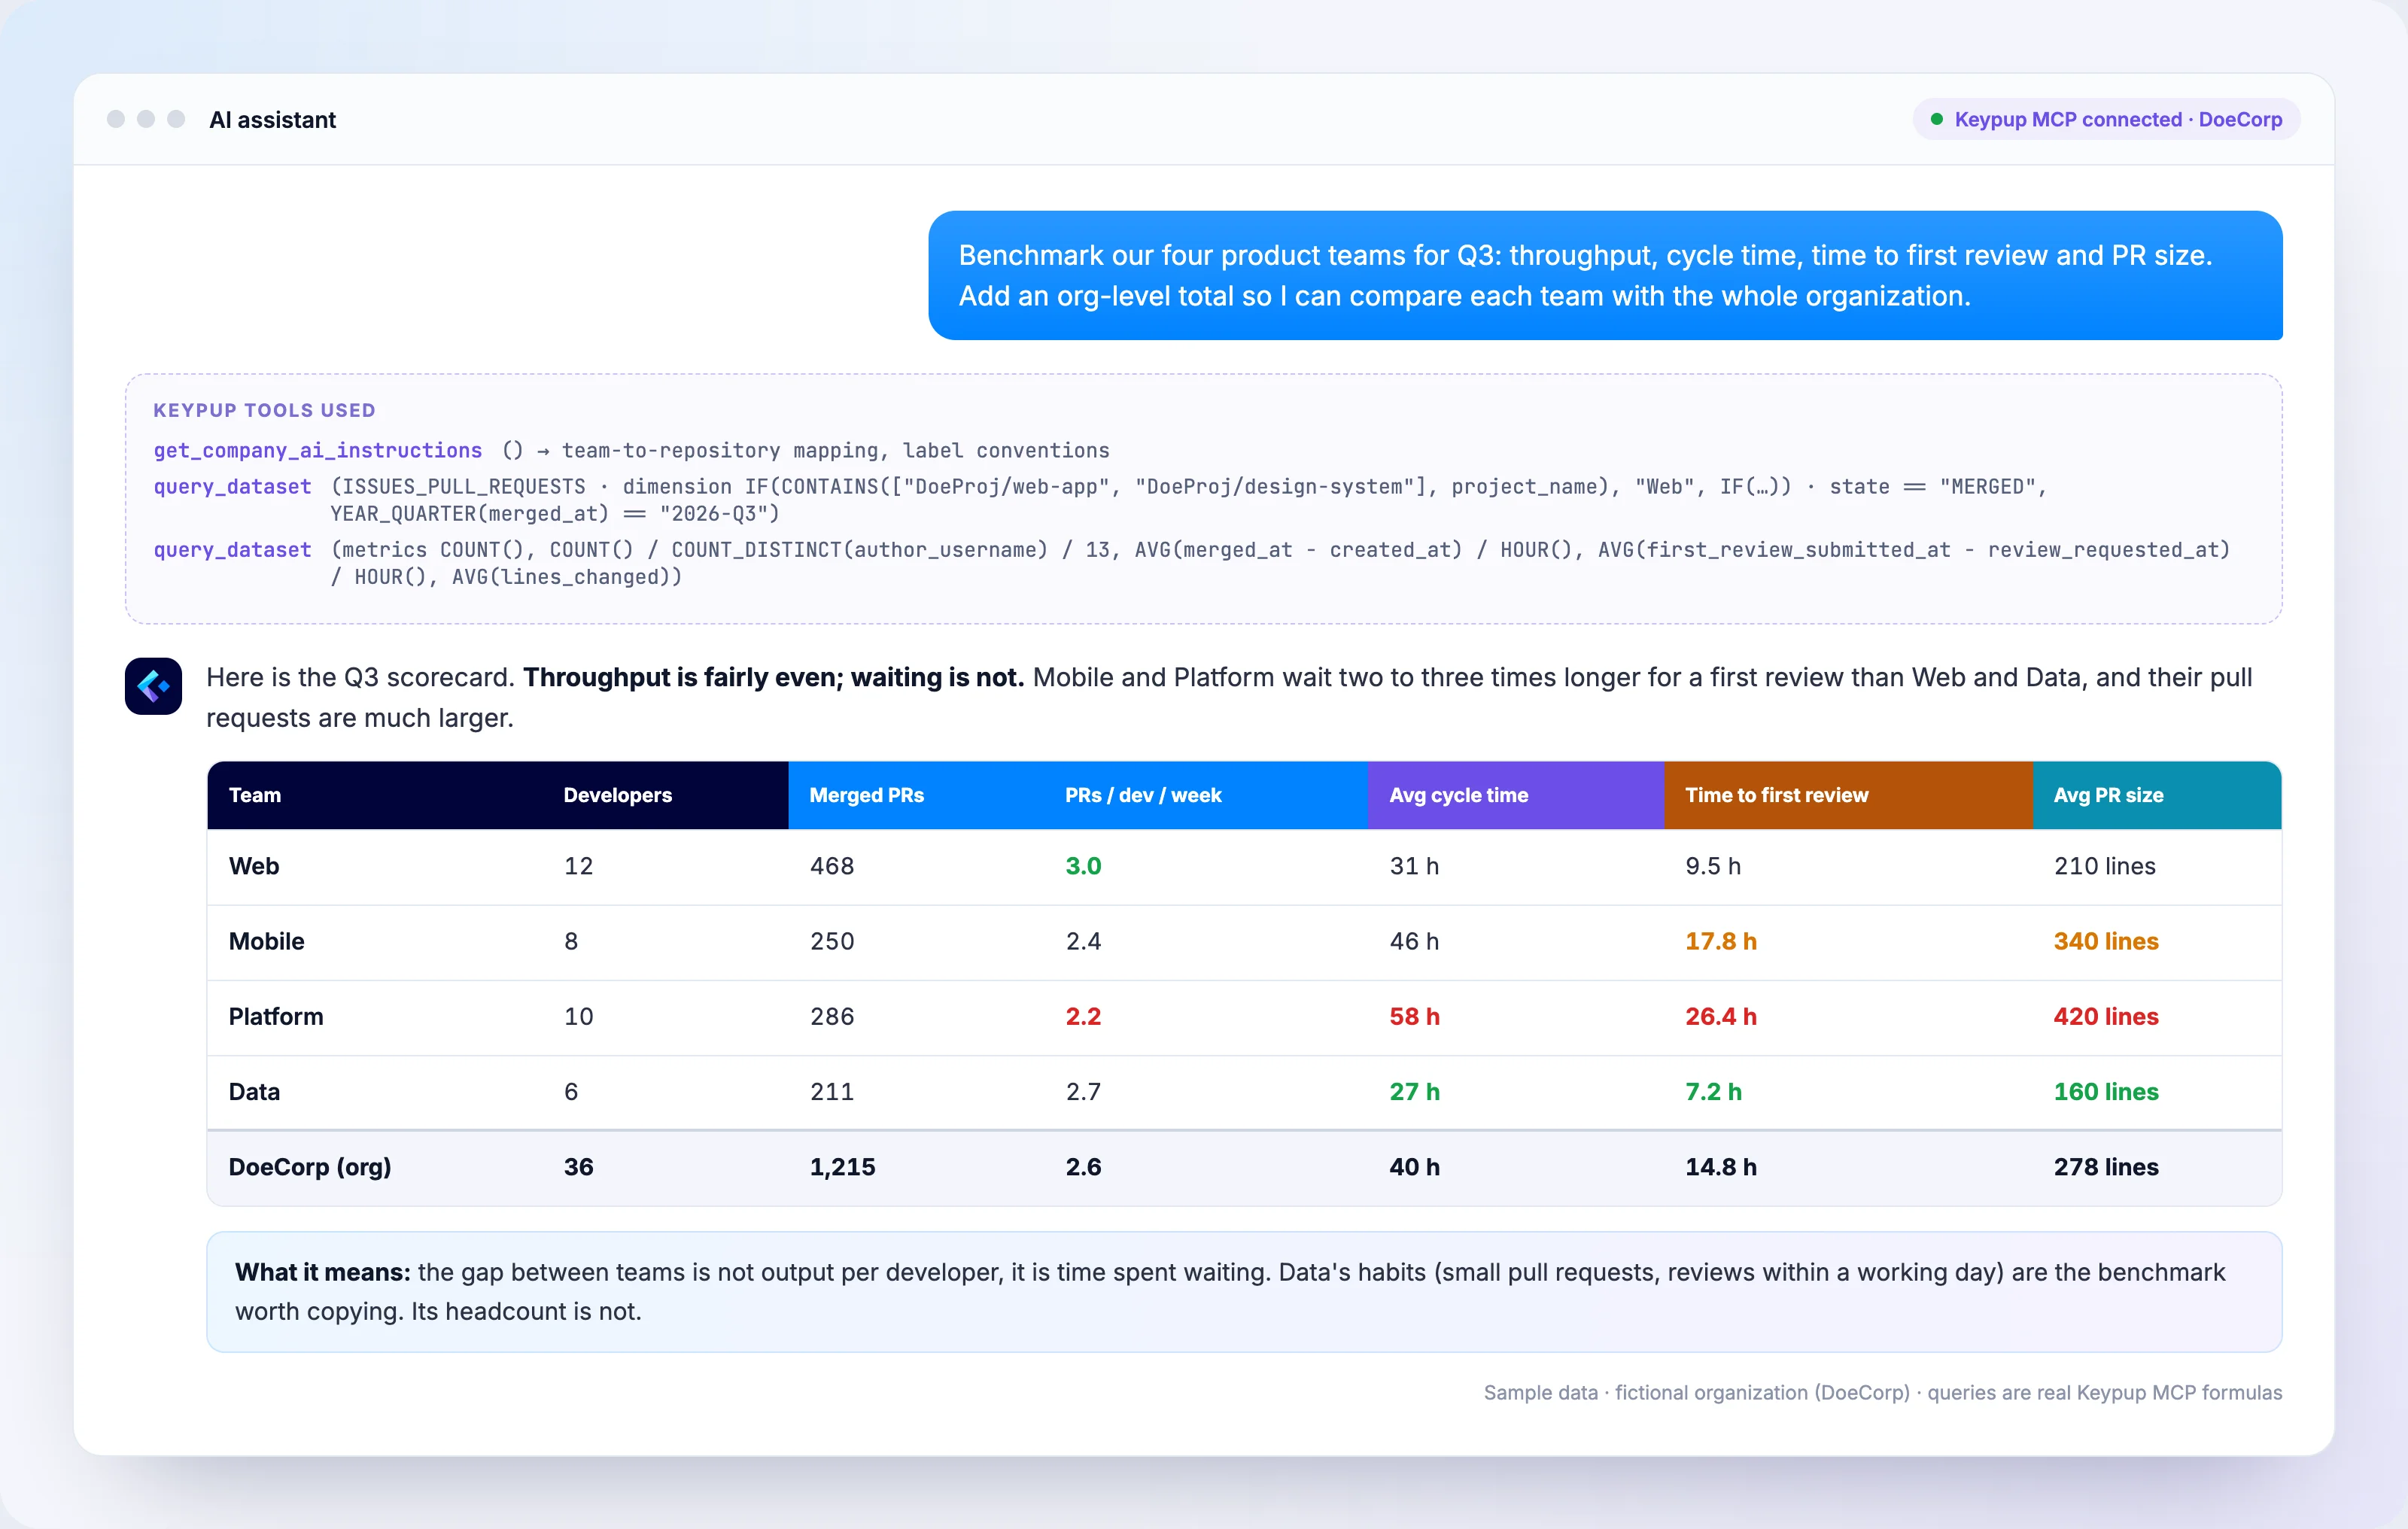
Here is what that looks like when a leader asks the question from their own AI assistant through the Keypup MCP Server. The same data and the same analysis are available inside the Keypup platform.
The scorecard shows that teams differ. The next question shows why, by splitting cycle time into stages and comparing them with the previous quarter:
Keypup links issues to pull requests automatically through Automated Contextualization. It reads the issue keys and references your developers already put in branch names, pull request titles, descriptions and commits, then enriches each record with fields from the other side, such as the labels of the issues a pull request resolves. There is no mapping table to maintain and no ETL pipeline to build. The DORA Metrics dashboard, the Team Benchmark dashboard and issue cycle time tracking are available as templates as soon as your tools are connected.
On Full Platform Access, every plan includes unlimited users and your full project history, and pricing depends on the number of connected projects, not seats. You can invite your entire organization and benchmark trends going back as far as your repositories allow.
Keypup features
Team Benchmarking dashboards: Compare throughput, cycle time, PR size, review load, and quality across every squad in your organization from a single view with the Team Benchmark dashboard template. Each leader sees the altitude relevant to their role.
Prompt-to-Dashboard: Describe a benchmarking problem in natural language and receive a fully built dashboard with filters aligned to your sprint cycles. This replaces hours of manual widget configuration.
AI SDLC Diagnosis with prescriptive actions: The AI Agent's Analyze mode explains what changed in plain English, pinpoints where work is waiting, and recommends specific improvement steps you can track over the following sprints.
Automated Contextualization: Pull requests, commits, and Jira issues are linked from the references your teams already use, so cross-entity questions (for example, "lead time of PRs resolving customer bugs") work without manual tagging.
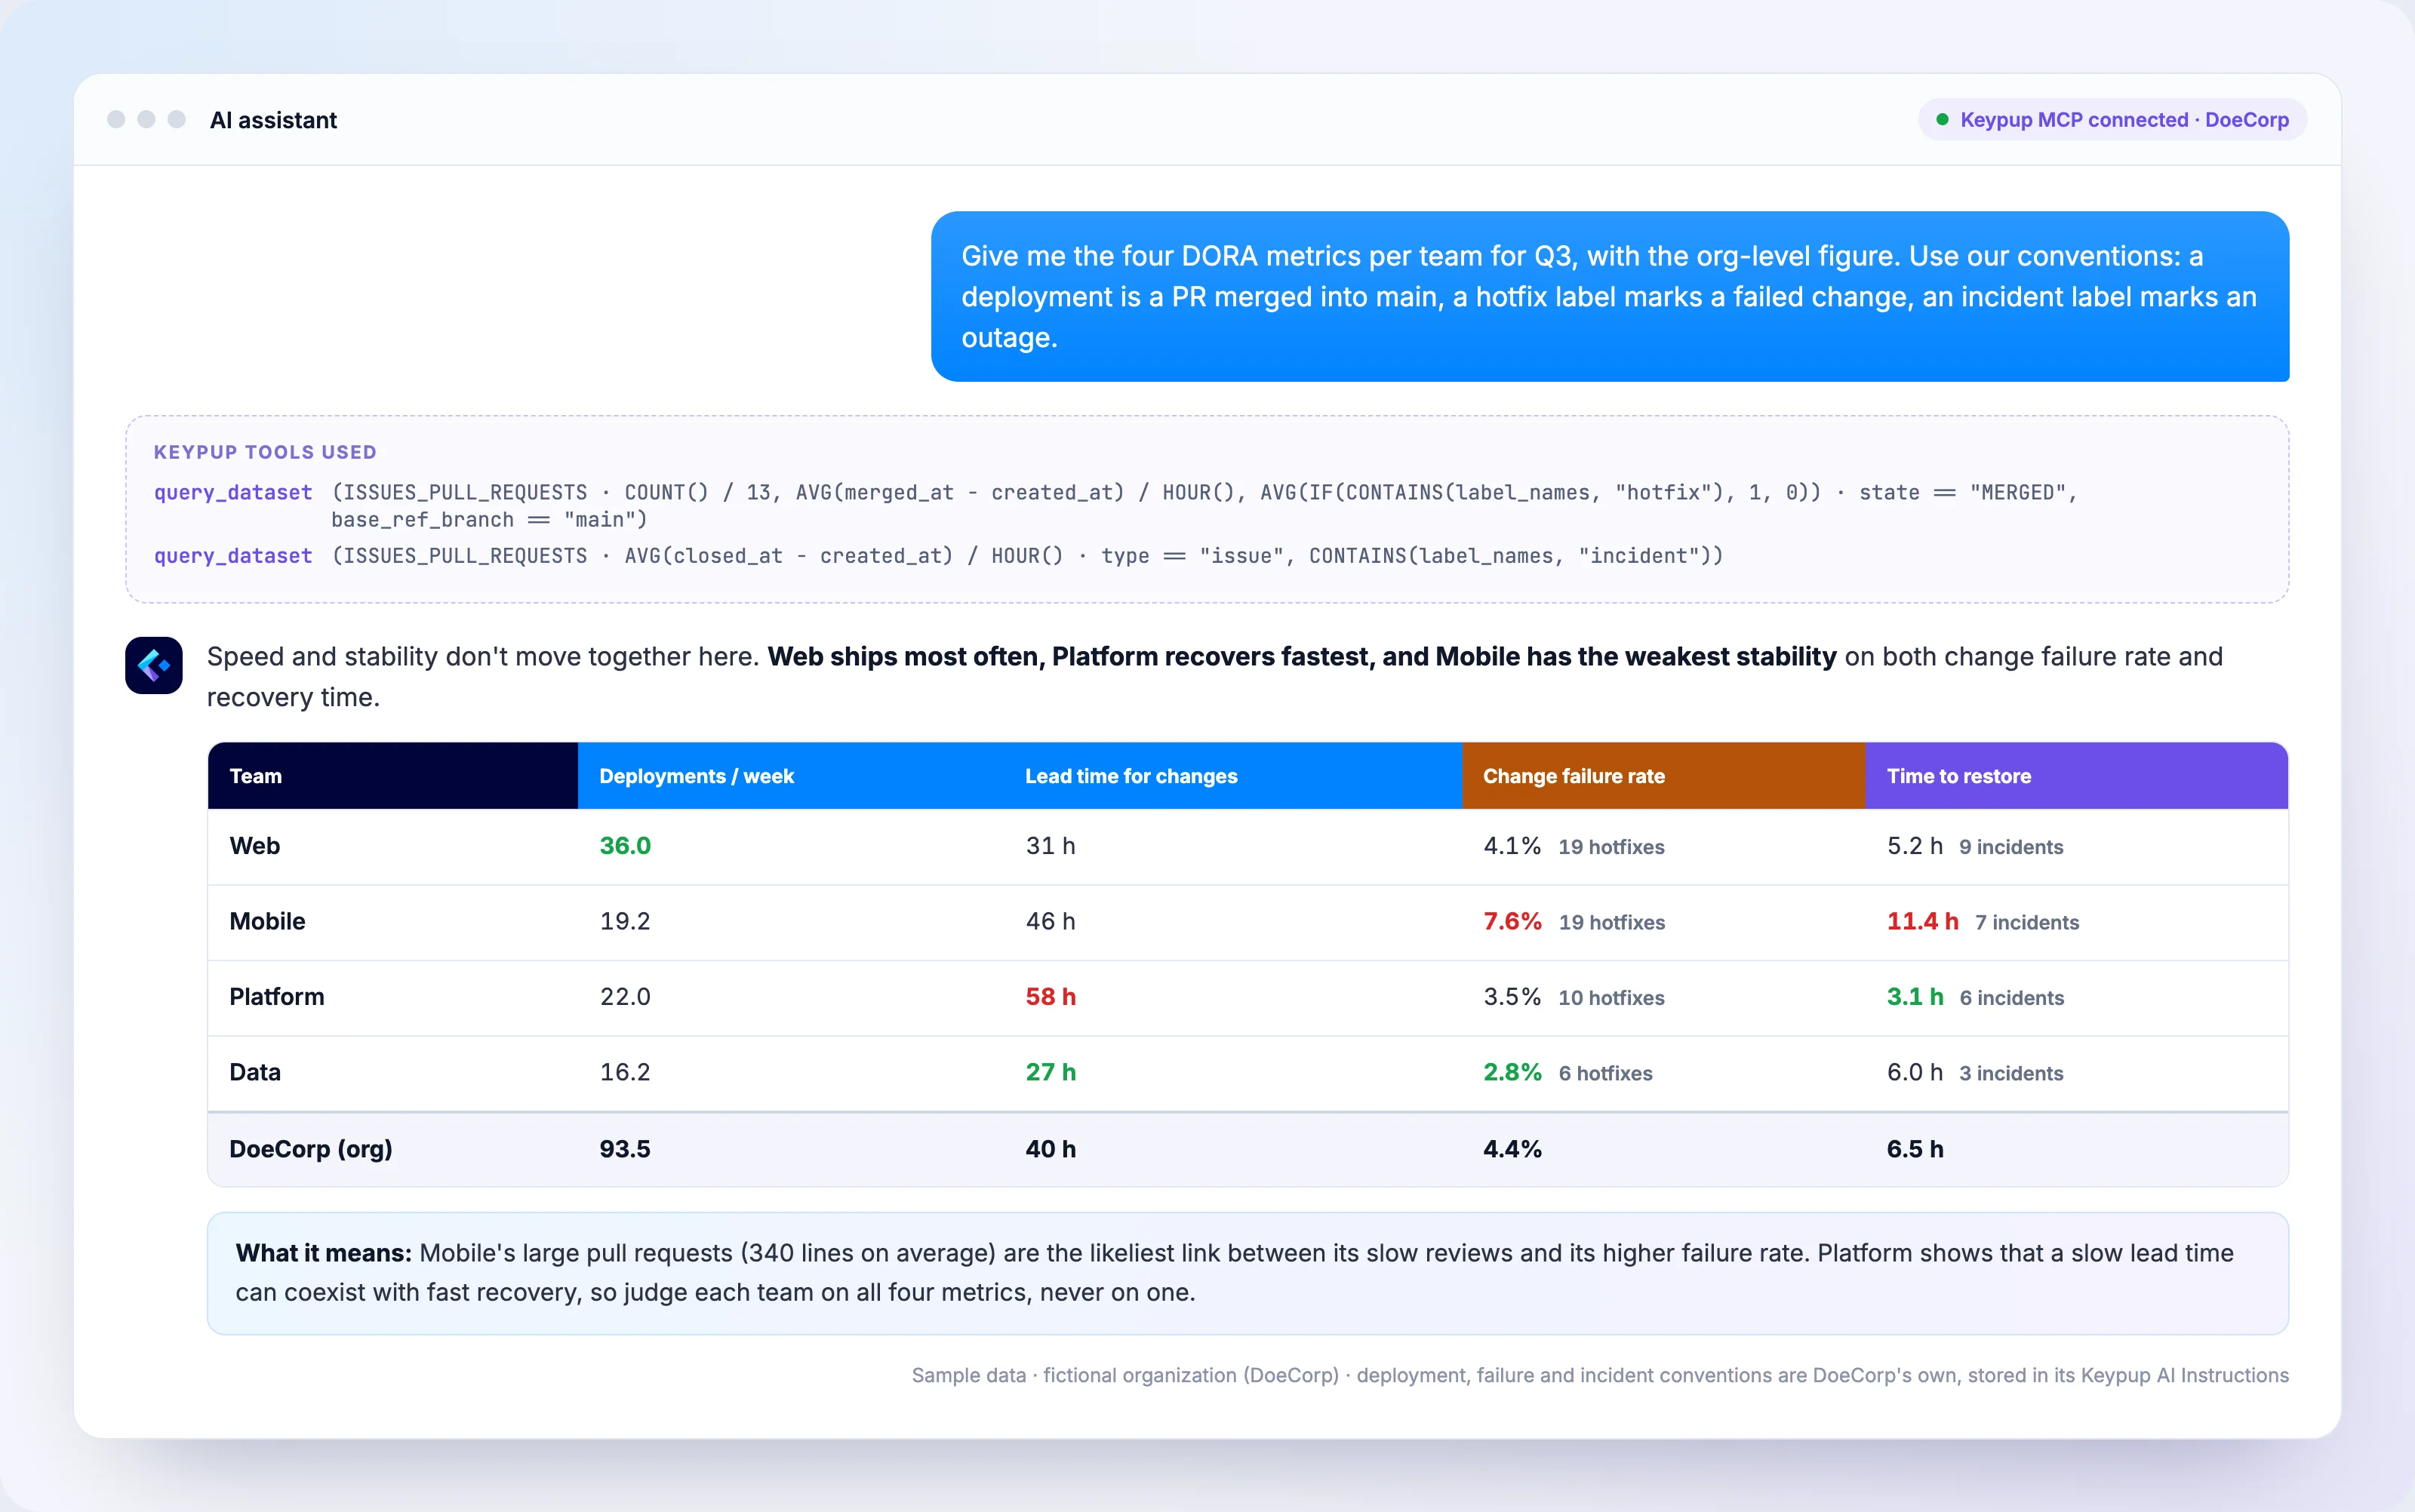
DORA Metrics and custom KPIs: With the DORA Metrics dashboard template, Deployment Frequency and Lead Time for Changes work from your merged pull requests out of the box. Change Failure Rate and Time to Restore follow your own conventions, such as a hotfix or incident label. Build any other engineering KPI with the query builder and custom formulas, or let the AI write the formula.
Keypup MCP Server: Ask the same questions from Claude, ChatGPT, Cursor, or any MCP-compatible assistant. Seven read-only tools let the assistant discover your datasets, build queries, and explain the results.
Universal, read-only integrations: Connect GitHub, GitLab, Bitbucket, and Azure DevOps on the Git side, and Jira Cloud, Jira Data Center, Azure DevOps Boards, GitHub Projects, ClickUp, and Trello on the project side. Keypup ingests your full project history.
Keypup pros and cons
Pros:
The AI Agent generates complete dashboards and prescriptive analysis from a single plain English prompt, reducing the time from question to insight to seconds.
Automated Contextualization links Git and ticketing data without a mapping table, so your reports reflect the full delivery picture from the start.
Unlimited users and full historical data are included on Full Platform Access, so you never choose between inviting stakeholders and managing costs.
Cons:
The platform focuses on SDLC metadata analytics and does not include built-in developer surveys. Teams that run surveys keep their survey tool and can pull Keypup data out through the API or the MCP Server to combine both.
Teams accustomed to rigid, pre-configured dashboards may need a short adjustment period to take full advantage of the configurable query engine.
The deepest cross-platform diagnosis needs both Git and ticketing tools connected, and pull requests that reference their issues. Teams using only one data source still see value, but less context.
2. LinearB: Workflow automation with delivery metrics for governance-focused teams
LinearB connects Git and project management data to provide visibility into engineering delivery. The platform includes a Metrics Builder, project delivery trackers, and resource allocation reports that break down where engineering time goes across roadmap, customer, and maintenance work.
LinearB also offers DevEx surveys, cost capitalization features, and an MCP Server, currently in open beta, for querying metrics and building custom reports from an AI assistant. The platform has added integrations for AI coding tools and includes forecasting capabilities that predict delivery timelines based on historical patterns.
LinearB features
Metrics Builder: Create custom metrics views using Git and project management data, filtered by team, repository, or time period.
Project delivery trackers: Monitor progress across multi-repo, multi-team initiatives with combined Git and PM-based tracking.
Resource allocation reports: Visualize where engineering effort goes across roadmap, customer, maintenance, and unplanned work categories.
LinearB pros and cons
Pros:
Includes workflow automation and governance features alongside analytics.
Offers DevEx surveys to capture qualitative developer sentiment data.
Provides forecasting tools that predict delivery timelines based on historical team behavior.
Cons:
Custom KPI configurability goes through the Metrics Builder rather than open formulas against a unified data schema.
Natural-language reporting runs through its MCP Server, still in open beta, rather than an in-product agent that builds and documents dashboards.
Pricing is per contributor, with AI automations such as AI code review metered on top.
3. Swarmia: Measurement framework with developer surveys for team health tracking
Swarmia's BUILD framework is its structured answer to how an engineering organization gets the most from its AI investment: which capabilities to develop, which cultural aspects to watch, and how to measure whether it is working. The platform tracks DORA metrics, PR cycle time, and issue metrics alongside built-in developer surveys for a combined view of team health and satisfaction.
Swarmia also offers initiative tracking, software capitalization, AI coding tool adoption tracking, and an MCP server that lets AI assistants query Swarmia data in natural language. The platform supports automatic change failure detection and tracks both the DORA and SPACE frameworks.
Swarmia features
BUILD framework: A structured approach to AI adoption covering capabilities, culture, and measurement.
Built-in developer surveys: Capture developer sentiment data alongside system metrics for a combined view of team health.
Automatic change failure detection: Identify DORA change failures from application rollbacks, PR reverts, and configurable hotfix filters.
Swarmia pros and cons
Pros:
Includes a structured measurement framework that helps teams choose which metrics to track first.
Built-in surveys complement system metrics with qualitative developer feedback.
Supports both DORA and SPACE framework tracking natively.
Cons:
Natural-language access goes through its MCP server in your AI assistant; the product does not generate dashboards from a prompt.
Custom KPI creation works within predefined metric categories rather than open-ended queries.
Pricing is per developer, so cost grows with every engineer you measure.
4. Jellyfish: Engineering signal analysis with business context for leadership reporting
Jellyfish integrates engineering tool data with information from calendars, finance, and HR systems. This combination allows engineering leaders to report on how development effort aligns with business priorities, which is useful when communicating with non-technical stakeholders.
The platform includes a Data Hub with customizable dashboards, the Jellyfish AI Assistant for natural language questions about engineering data, an MCP server, and a patented allocations model. Jellyfish tracks DORA metrics and uses its customer dataset for industry benchmark comparisons.
Jellyfish features
Data Hub: Combine DORA metrics, AI impact data, and custom metrics in extensible dashboards with flexible calculation logic.
Business alignment reporting: Contextualize engineering signals with finance and HR data to demonstrate development effort allocation to stakeholders.
AI Assistant: Ask questions about engineering data in natural language and receive contextual answers.
Jellyfish pros and cons
Pros:
Integrates business data (finance, HR, calendars) with engineering signals for cross-functional reporting.
Includes a patented allocations model used for investment and resource alignment analysis.
Has a customer dataset that provides industry benchmark comparisons.
Cons:
The platform's focus on business alignment means its full value requires data source connections beyond standard Git and ticketing tools.
Its benchmarks compare you with other companies, which helps external positioning more than diagnosing why one of your own teams waits longer than another.
Pricing is quote-based and per engineer, with modules sold separately.
5. Faros: Enterprise-grade data infrastructure for large-scale engineering organizations
Faros is built for large engineering organizations that need to ingest and analyze engineering metadata across thousands of developers and coding agents. The platform includes analytics, AI-powered productivity tools, customizable dashboards, and engineering catalogs that unify HR and service data.
Faros also offers an experiments framework for measuring the impact of AI program changes, role-based experiences so different stakeholders see the most relevant dashboards, and Lighthouse AI, a natural language layer that summarizes dashboards and helps build queries.
Faros features
Enterprise-scale data infrastructure: Handles thousands of engineers and millions of data points with dedicated monitoring for data freshness and feed health.
Experiments framework: Measure the impact of AI program changes with structured before-and-after analysis across engineering metrics.
Engineering catalogs: Unify scattered HR and service data into a navigable source of truth for engineering operations.
Faros pros and cons
Pros:
Handles enterprise-scale data volumes with dedicated infrastructure for performance and compliance.
Includes AI-powered PR comment classification that categorizes code review feedback automatically.
Offers SaaS, hybrid, and on-premises deployment for organizations with strict data residency requirements.
Cons:
The platform is designed for enterprises with large engineering organizations, and smaller teams may find the setup requirements more involved.
Its AI features help you write queries and summarize charts, while building the dashboards remains your team's job.
Connecting all required data sources across code, HR, and service catalogs takes more initial configuration.
6. Appfire Flow: Workflow diagnostics, retiring on December 31, 2027
Appfire Flow, formerly known as Pluralsight Flow, provides commit-level analytics, workflow diagnostics, and team health insights. The platform integrates with GitHub, Jira, and Azure DevOps to deliver visibility across code, tickets, and code reviews in a single view.
Appfire has announced that Flow will be retired on December 31, 2027, and it stopped accepting renewals on June 30, 2026. Teams currently on Flow should plan their migration and export their history before the retirement date, and teams evaluating platforms should treat it as a short-term option only.
Appfire Flow features
Workflow diagnostics: Identifies bottlenecks across code review, PR activity, and sprint movement with filterable, sortable views.
Work log and check-in reports: Visualizes daily activity patterns by engineer, team, or repository to track process alignment.
DORA Metrics tracking: Includes deployment frequency, lead time, and change failure rate reporting.
Appfire Flow pros and cons
Pros:
Offers granular commit-level reporting with work log and check-in views.
Includes sprint movement reports useful for sprint planning and predictability analysis.
Fits teams already invested in the Atlassian and Appfire ecosystem.
Cons:
The product will be retired on December 31, 2027, and renewals closed on June 30, 2026.
The platform does not offer a natural language interface or an AI agent.
Custom KPI creation is limited compared to platforms with open query builders or formula engines.
Comparison table: The best engineering metrics tools for benchmarking
Engineering metrics tools for team benchmarking at a glance
Platform
AI builds dashboards in the product
Natural language access
Pricing model
KeypupTop pick
AI builds dashboards in the product
Natural language accessAI Agent and MCP Server
Pricing modelPer project, unlimited users
LinearB
AI builds dashboards in the product
Natural language accessMCP Server (open beta)
Pricing modelPer contributor
Swarmia
AI builds dashboards in the product
Natural language accessMCP server
Pricing modelPer developer
Jellyfish
AI builds dashboards in the product
Natural language accessAI Assistant and MCP server
Pricing modelPer engineer, by quote
Faros
AI builds dashboards in the productSuggests charts and queries
Natural language accessLighthouse AI
Pricing modelCustom quote
Appfire Flow
AI builds dashboards in the product
Natural language access
Pricing modelRetiring December 31, 2027
Based on each vendor's public documentation and pricing information, October 2026.
What should you look for in engineering metrics software for multi-team visibility?
Multi-team visibility requires more than a dashboard that aggregates pull request counts. The core challenge is connecting fragmented data from Git and ticketing tools into a unified model where teams can be compared on equal terms.
Look for a platform that normalizes data across different tools automatically. If your front-end team uses GitHub and your platform team uses GitLab, the tool should unify those into comparable metrics without manual mapping or ETL.
Org-level rollups matter because engineering leaders need to answer board-level questions about delivery health, investment allocation, and risk. A platform that only shows team-level dashboards forces you to export and reconcile data in spreadsheets. The 2025 DORA Report from Google Cloud found that AI amplifies an organization's existing strengths and weaknesses, which means the quality of your measurement system directly shapes the return you get from AI investments.
How do org-level rollups improve engineering decision-making?
Org-level rollups transform individual team metrics into a connected view of how the entire engineering organization is performing. Without rollups, each team reports in isolation, and leadership cannot compare delivery speed, quality, or capacity allocation across squads.
Rollups help you identify patterns that team-level data obscures. One team's cycle time spike might look like a local problem. But when you roll up across five teams and see that review wait times increased organization-wide, you have identified a systemic bottleneck that no single squad can fix alone.
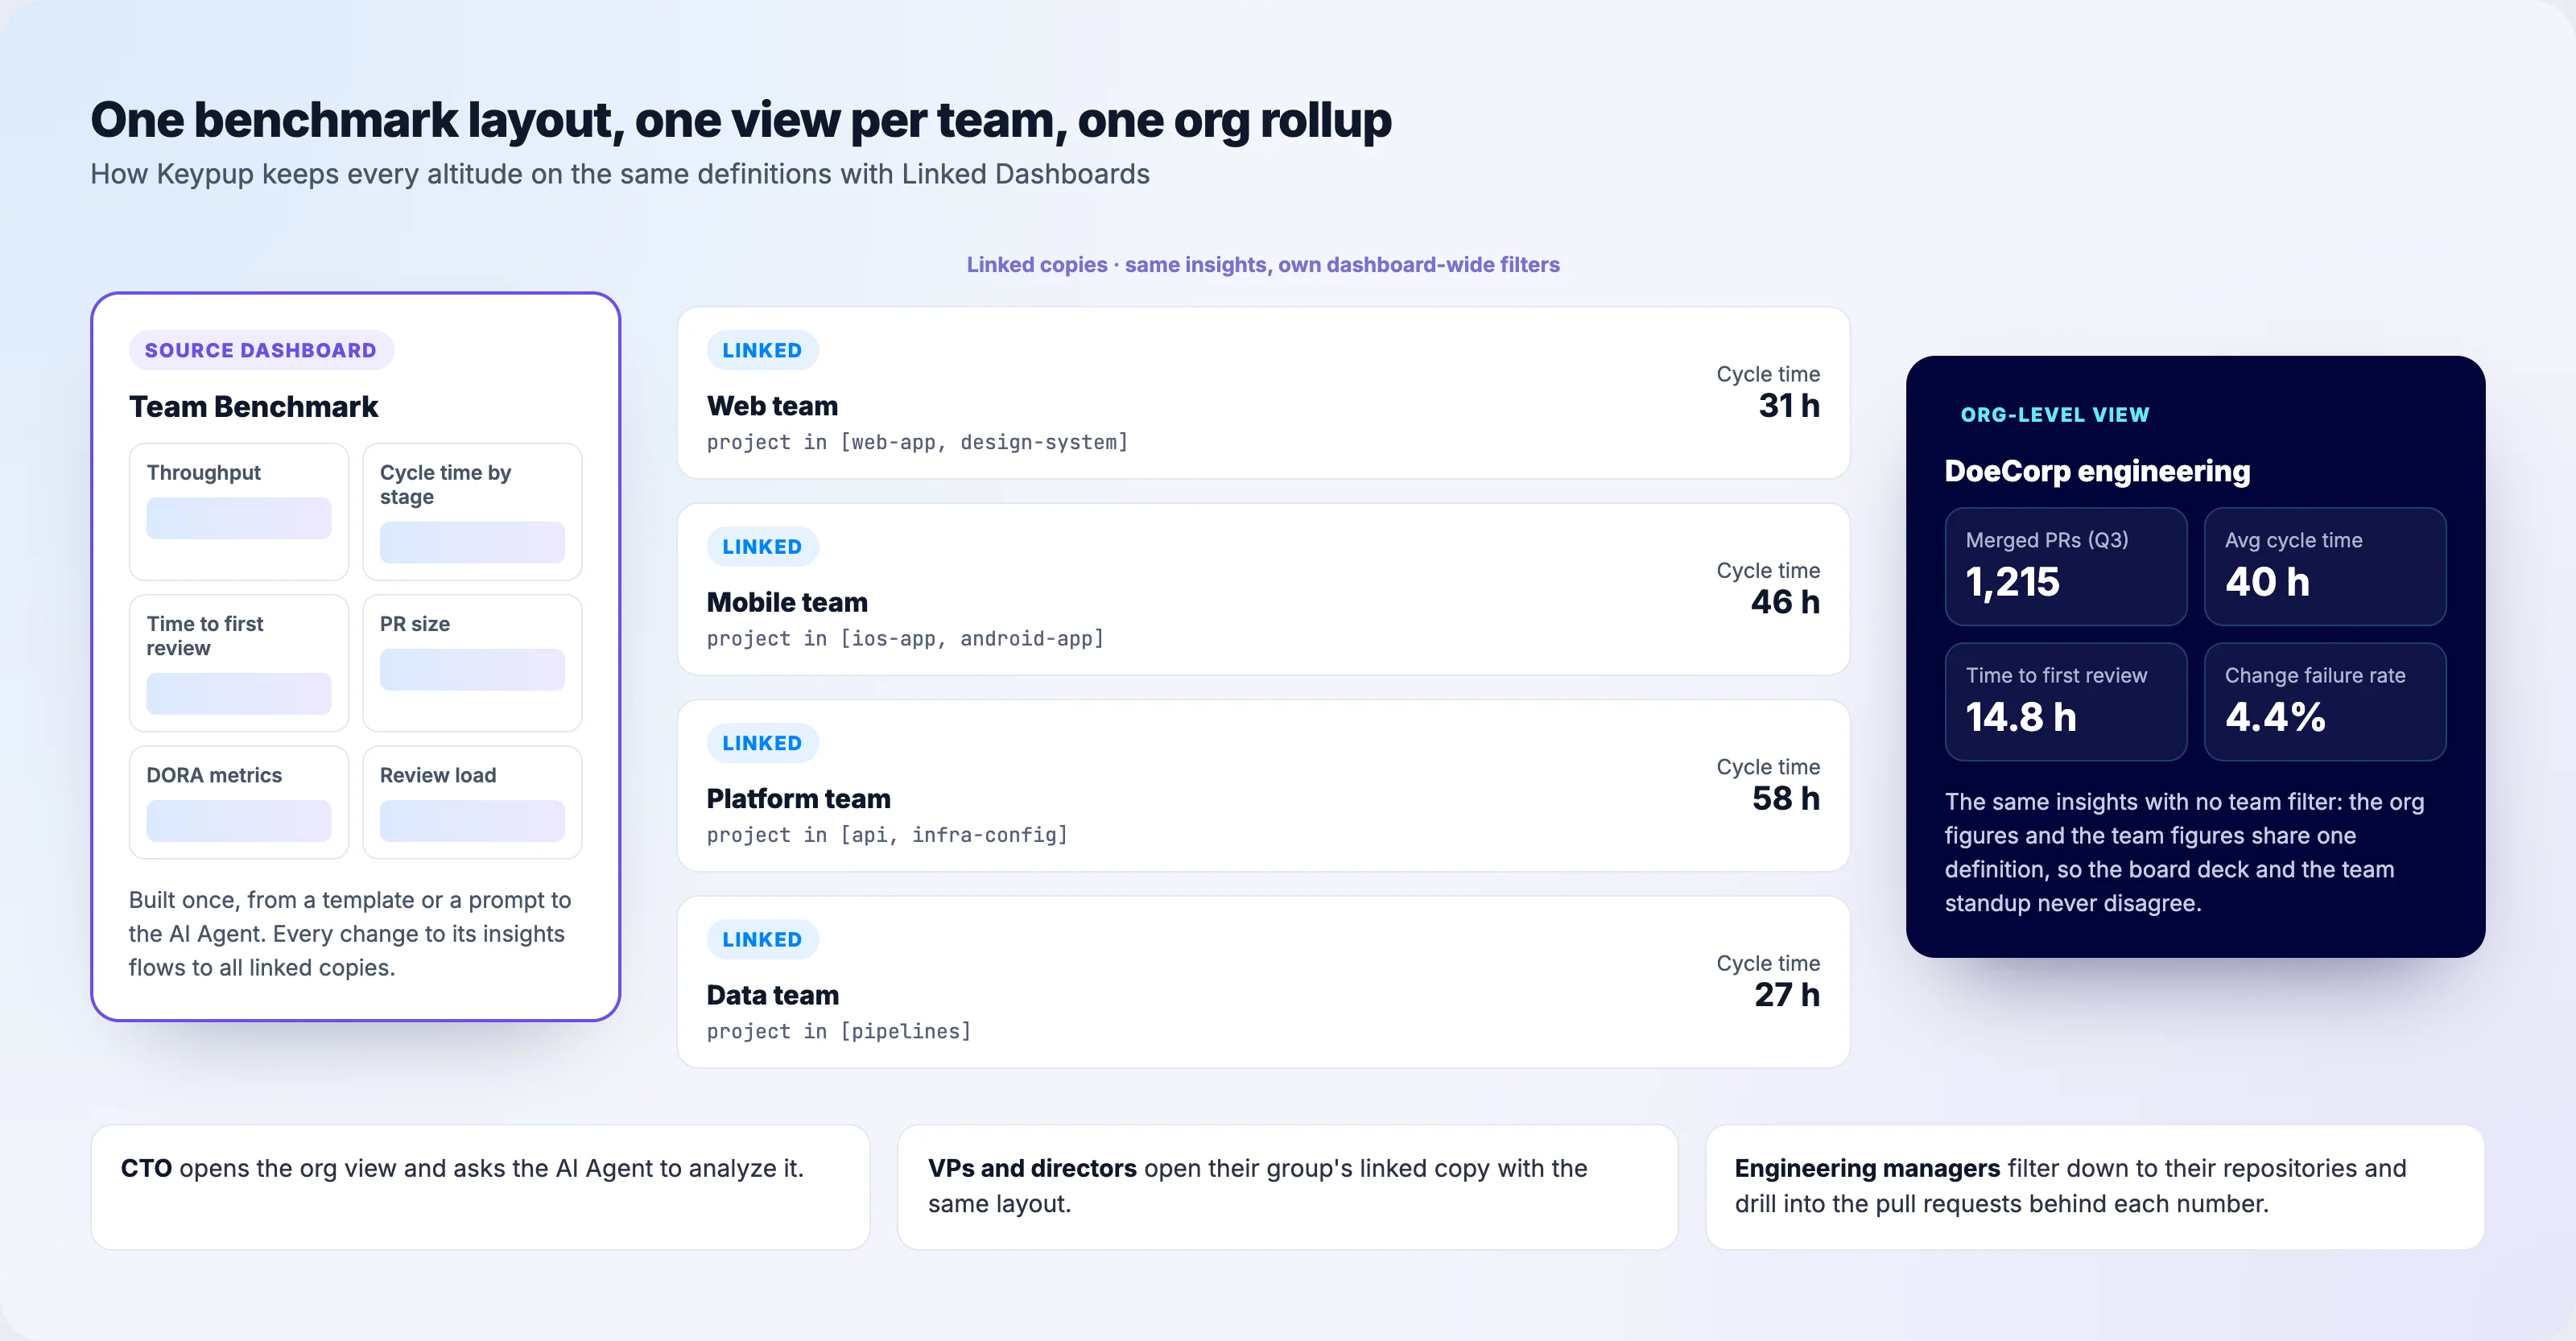
Keypup delivers org-level rollups through its unified data model and Linked Dashboards. You build one benchmark dashboard, then create a linked copy for each team or group with its own dashboard-wide filters. Every change to the source flows to every copy. CTOs see the org-wide picture. VPs see their product teams. Engineering managers see their repositories. Each altitude draws from the same normalized data and the same definitions, so the numbers stay consistent from boardroom to standup.
Why Keypup is the best engineering metrics tool for team benchmarking
Keypup gives you the complete picture of your software delivery lifecycle by unifying Git and ticketing data through Automated Contextualization. Instead of maintaining your own links between commits and issues, Keypup builds them from the references your teams already write and gives you a normalized data model you can query immediately.
The AI Agent is what truly differentiates Keypup for multi-team benchmarking. You describe a benchmarking question in plain English, and the platform builds a full dashboard with filters and documentation, then analyzes it: where work is waiting, which teams are affected, and what to fix first. It does not stop at answering questions. It builds, explains, and recommends, scoped to specific teams, repositories, or time windows.
Keypup connects to your existing stack in minutes with read-only integrations: GitHub, GitLab, Bitbucket, Azure DevOps, Jira Cloud, Jira Data Center, Azure DevOps Boards, GitHub Projects, ClickUp, and Trello. Your source code is never accessed. Full Platform Access includes unlimited users and full historical data.
FAQs about engineering metrics tools for team benchmarking
What is engineering metrics software?
Engineering metrics software unifies data from Git repositories and project management tools to give engineering teams visibility into delivery performance. Keypup takes this further with an AI Agent that turns Git and Jira metadata into dashboards, analysis, and recommendations from a plain English request.
Which DORA Metrics should engineering teams track first?
Start with Deployment Frequency and Lead Time for Changes, as these two metrics give you an immediate read on delivery throughput. Keypup's DORA Metrics dashboard tracks them from your merged pull requests as soon as you connect your tools. Add Change Failure Rate and Time to Restore once you have agreed which labels or issue types mark a failed change and an incident.
Can engineering metrics software replace manual status reporting?
Largely, yes. Platforms that automatically link Git activity to ticketing data remove the need to reconcile pull requests with Jira issues by hand. Keypup does this through Automated Contextualization, which links them from the issue keys and references in branch names, pull request titles and commits.
How long does it take to set up an engineering metrics platform?
Setup time varies across platforms. Keypup connects to your existing Git and project management tools in minutes through read-only integrations and imports your project history in the background. The AI Agent can build dashboards and analysis as soon as data arrives, with no ETL pipelines or lengthy onboarding required.
Is source code safe with engineering metrics tools?
Not all platforms handle code data the same way. Keypup is strictly a metadata processor. It analyzes timestamps, pull request states, issue labels, and reviewer assignments. Your proprietary source code is never read, processed, or stored.
What makes team benchmarking different from individual developer tracking?
Team benchmarking focuses on process-level metrics like cycle time stages, throughput, review wait times, and deployment frequency across squads. Keypup shifts the focus from individual performance to systemic bottlenecks in your SDLC, helping you ask "where is our process broken?" rather than "who is slow?"
Is Appfire Flow being discontinued?
Yes. Appfire has announced that Flow, formerly Pluralsight Flow, will be retired on December 31, 2027, and it stopped accepting renewals on June 30, 2026. If you use it today, plan your migration and export your history well before the retirement date.
Ready to Transform Your Analytics?
Join teams already using AI to make data-driven decisions faster than
ever.
Your median cycle time looks healthy, yet every release still ends in merge conflicts, rebases and big-bang reviews. Learn what engineering leaders on Reddit say about long-lived branches and the trunk-based vs GitFlow debate at enterprise scale, and how Keypup MCP uses pull request dates, target branches, commits, reviews and mergeability to measure branch lifetime, find where branches live longest and land aging work before it drifts into conflict.
In large engineering organizations, thousands of pull requests are closed without merging or left to go stale every year, and nobody measures the cost. Learn what engineering leaders on Reddit say about abandoned pull requests, and how Keypup MCP uses pull request state, review, size, mergeability and Jira link data to size the PR graveyard, find where work dies, and triage stale pull requests before they are lost.
Enterprises hire hundreds of engineers a year, but almost none can say how long it takes them to ship at full speed, where they get stuck, or whether onboarding is improving. Learn what engineering leaders on Reddit say about the onboarding ramp-up tax, and how Keypup MCP uses pull request, review and Jira data to measure time to first merge, ramp-up curves, review friction and onboarding load.