TL;DR: Technical debt isn't limited to code quality—it permeates every aspect of your software development lifecycle. Process debt from manual steps, review debt from rushed approvals, testing debt from flaky tests, and documentation debt from outdated wikis all compound into massive hidden costs. Keypup MCP Server reveals these invisible drags on velocity by analyzing your SDLC data and quantifying the true financial impact of accumulated debt across your development pipeline.
- Key Point 1: Process debt—manual deployment steps, slow CI/CD pipelines, and inefficient workflows—costs engineering teams 15-25% of their velocity, equivalent to losing 1-2 engineers per team of 10 to repetitive toil instead of strategic work.
- Key Point 2: Review debt manifests as rubber-stamp approvals, missed bugs, and architectural issues that slip through superficial code reviews, creating a compounding tax where each quick approval today creates 3-5× more work downstream when issues reach production.
- Key Point 3: Keypup MCP Server transforms technical debt from a vague "we should fix this someday" sentiment into quantified, prioritized work by calculating cycle time impact, bug correlation, and dollar costs, enabling data-driven decisions about when debt paydown delivers better ROI than new features.
Introduction: The Technical Debt You Can't See Is Costing You the Most
When engineering leaders discuss technical debt, the conversation typically centers on code: legacy systems, spaghetti architecture, missing tests, and that 10,000-line class everyone's afraid to touch. Code quality issues are real and measurable—but they're only the tip of the iceberg.
The most expensive technical debt often lives outside your codebase entirely, embedded in your software development lifecycle itself. Manual deployment steps that could be automated. Code reviews that rubber-stamp PRs without catching real issues. Flaky tests that erode confidence and waste CI/CD time. Documentation that's six months out of date, forcing every new developer to reverse-engineer the system.
This is process debt, review debt, testing debt, and documentation debt—and collectively, they cost engineering organizations far more than messy code ever will.
Consider a typical scenario: Your team ships features steadily, but deployment requires 12 manual steps documented in a wiki. Each deployment takes 45 minutes of an engineer's time and fails 15% of the time due to human error. That's process debt. Your code reviews average 8 minutes, and 40% of PRs are approved with only superficial comments. That's review debt. Your CI/CD pipeline has 23 flaky tests that randomly fail, forcing engineers to re-run builds "just to be sure." That's testing debt. Your architecture documentation was last updated 9 months ago, and new engineers spend 3 weeks getting oriented. That's documentation debt.
Each of these debts compounds. Manual processes slow feature delivery. Superficial reviews let bugs through that create emergency work downstream. Flaky tests erode trust, leading teams to merge without waiting for CI. Outdated documentation leads to architectural inconsistencies as developers make incorrect assumptions.
The challenge is that unlike code debt, SDLC debt is invisible to traditional engineering metrics. Your test coverage dashboard won't flag that 40% of code reviews are rubber stamps. Your static analysis tools won't detect that deployments require 12 manual steps. Your velocity charts won't reveal that developers spend 30% of their time working around flaky tests.
This is where Keypup MCP Server changes the game. By analyzing comprehensive SDLC data—pull requests, code reviews, CI/CD pipelines, deployment history, and team interactions—MCP can identify, quantify, and prioritize the hidden technical debt dragging down your velocity and quality.
This article explores the four major categories of non-code technical debt, shows you how to measure their true cost, and demonstrates how to use Keypup MCP to transform vague concerns about "process problems" into data-driven decisions about where debt paydown delivers the highest ROI.
Understanding the Four Types of SDLC Technical Debt
Before we can measure and address technical debt, we need a framework for categorizing it. While code debt gets the headlines, SDLC debt often creates more drag on velocity and quality. Let's break down the four major categories.
1. Process Debt: The Automation That Never Happened
Process debt accumulates whenever teams rely on manual steps, slow tooling, or inefficient workflows that could be automated or optimized. It manifests as:
- Manual deployment steps: "SSH into production and run these 8 commands in order"
- Slow CI/CD pipelines: 45-minute builds that could be 10 minutes with better caching
- Environment setup complexity: New developers need 3 days to get a working dev environment
- Manual testing steps: QA team manually tests the same 50 scenarios every release
- Release coordination overhead: Release requires coordinating 6 teams across 4 time zones
The insidious nature of process debt is that each individual instance seems "not worth fixing right now"—until you calculate the aggregate cost. A manual step that takes 5 minutes but runs 20 times per day costs 1,667 hours per year (almost 1 FTE). A slow CI/CD pipeline that adds 30 minutes per build, across 100 daily builds, costs 750 hours per year.
Our deployment 'process' is a 47-step wiki page that's somehow both outdated and overly detailed. Last Friday, a junior dev skipped step 23 (clear the cache on server 4) and took down production for 2 hours. We all know we should automate this, but 'there's never time' because we're too busy doing manual deployments.
2. Review Debt: The Quality Gates That Don't Gate
Review debt occurs when code review processes exist but fail to provide meaningful quality assurance. Common manifestations include:
- Rubber-stamp approvals: PRs approved in under 5 minutes without substantive feedback
- Review bottlenecks: PRs wait days for review while reviewers context-switch constantly
- Superficial review comments: "LGTM" approvals without checking tests, edge cases, or architecture implications
- Inconsistent review standards: Some PRs get rigorous scrutiny, others breeze through
- Review fatigue: Large PRs (1000+ line changes) that no reviewer actually reads thoroughly
Review debt creates a compounding tax. Quick approvals let architectural problems through that take weeks to unwind later. Missed edge cases become production bugs. Inconsistent standards create codebase chaos where different modules follow completely different patterns.
The paradox: teams implement code review to catch issues early, but poor review practices make reviews a bureaucratic speed bump that catches nothing while slowing delivery.
I've been on teams where PRs get 'LGTM'd' in under 3 minutes for 800-line changes. Nobody's actually reading the code. Then two weeks later we're debugging a production issue that any careful reviewer would have caught. Code review theater is worse than no code review because it gives false confidence.
3. Testing Debt: When Your Safety Net Has Holes
Testing debt extends beyond "we should write more tests" to encompass the entire testing infrastructure and culture:
- Flaky tests: Tests that randomly fail, forcing engineers to retry builds "just to be sure"
- Slow test suites: 45-minute test runs that discourage running tests locally
- Low-value tests: Tests that pass even when functionality breaks, providing false confidence
- Missing test categories: Great unit tests but zero integration tests, or vice versa
- Test maintenance burden: Tests break with every refactoring, creating test-induced fear of change
Flaky tests are the silent killer. Research shows that once flakiness rate exceeds 2%, engineers stop trusting CI entirely. Teams merge without waiting for results, deployment confidence plummets, and the entire CI/CD investment becomes worthless.
Testing debt also includes manual testing burden. If QA manually executes the same regression tests every release, that's testing debt—automation that could happen but doesn't.
We have 12 tests that fail randomly. Not because of bugs—they just fail. So now everyone's learned to hit 'retry' on the CI pipeline until it passes. Last week I saw someone retry 6 times. At this point, the tests are just a 5-minute delay before we can merge, not an actual safety check.
4. Documentation Debt: Knowledge That Lives in Slack Threads
Documentation debt accumulates when knowledge exists only in people's heads or scattered across Slack threads, tribal knowledge, and outdated wikis:
- Outdated architecture docs: "How our system works" documentation last updated 18 months ago
- Missing runbooks: When the system breaks at 2am, responders reverse-engineer fixes each time
- Undocumented decisions: "Why did we choose this database?" lives only in a Slack thread from 2023
- Setup instruction rot: Onboarding docs reference tools and processes that no longer exist
- API documentation drift: Public API docs don't match actual API behavior
Documentation debt creates exponential costs as teams scale. Every new engineer spends weeks discovering information that should have taken hours to read. Every incident response includes unnecessary detective work. Every architectural decision gets re-litigated because no one remembers the original reasoning.
The challenge: unlike code or tests, documentation has no forcing function. Outdated docs don't break builds or fail deployments—they just slowly drain productivity as confusion compounds.
It took me 3 weeks to understand why our auth service works the way it does. The official docs say we use JWT, but we actually migrated to OAuth2 last year. I only figured it out by searching Slack for 'auth migration' and finding a thread from 8 months ago. Our lead engineer left 6 months ago and took all that knowledge with him.
Now that we understand the four categories of SDLC technical debt, let's explore how to identify and measure each type in your own engineering organization using Keypup MCP Server.
Identifying Process Debt: Finding Automation Opportunities
Process debt hides in plain sight—it's the daily friction that teams accept as "just how we work." The first step in addressing it is making the invisible visible through systematic analysis.
Detecting Manual Process Overhead
Start by identifying manual steps that consume significant engineering time:
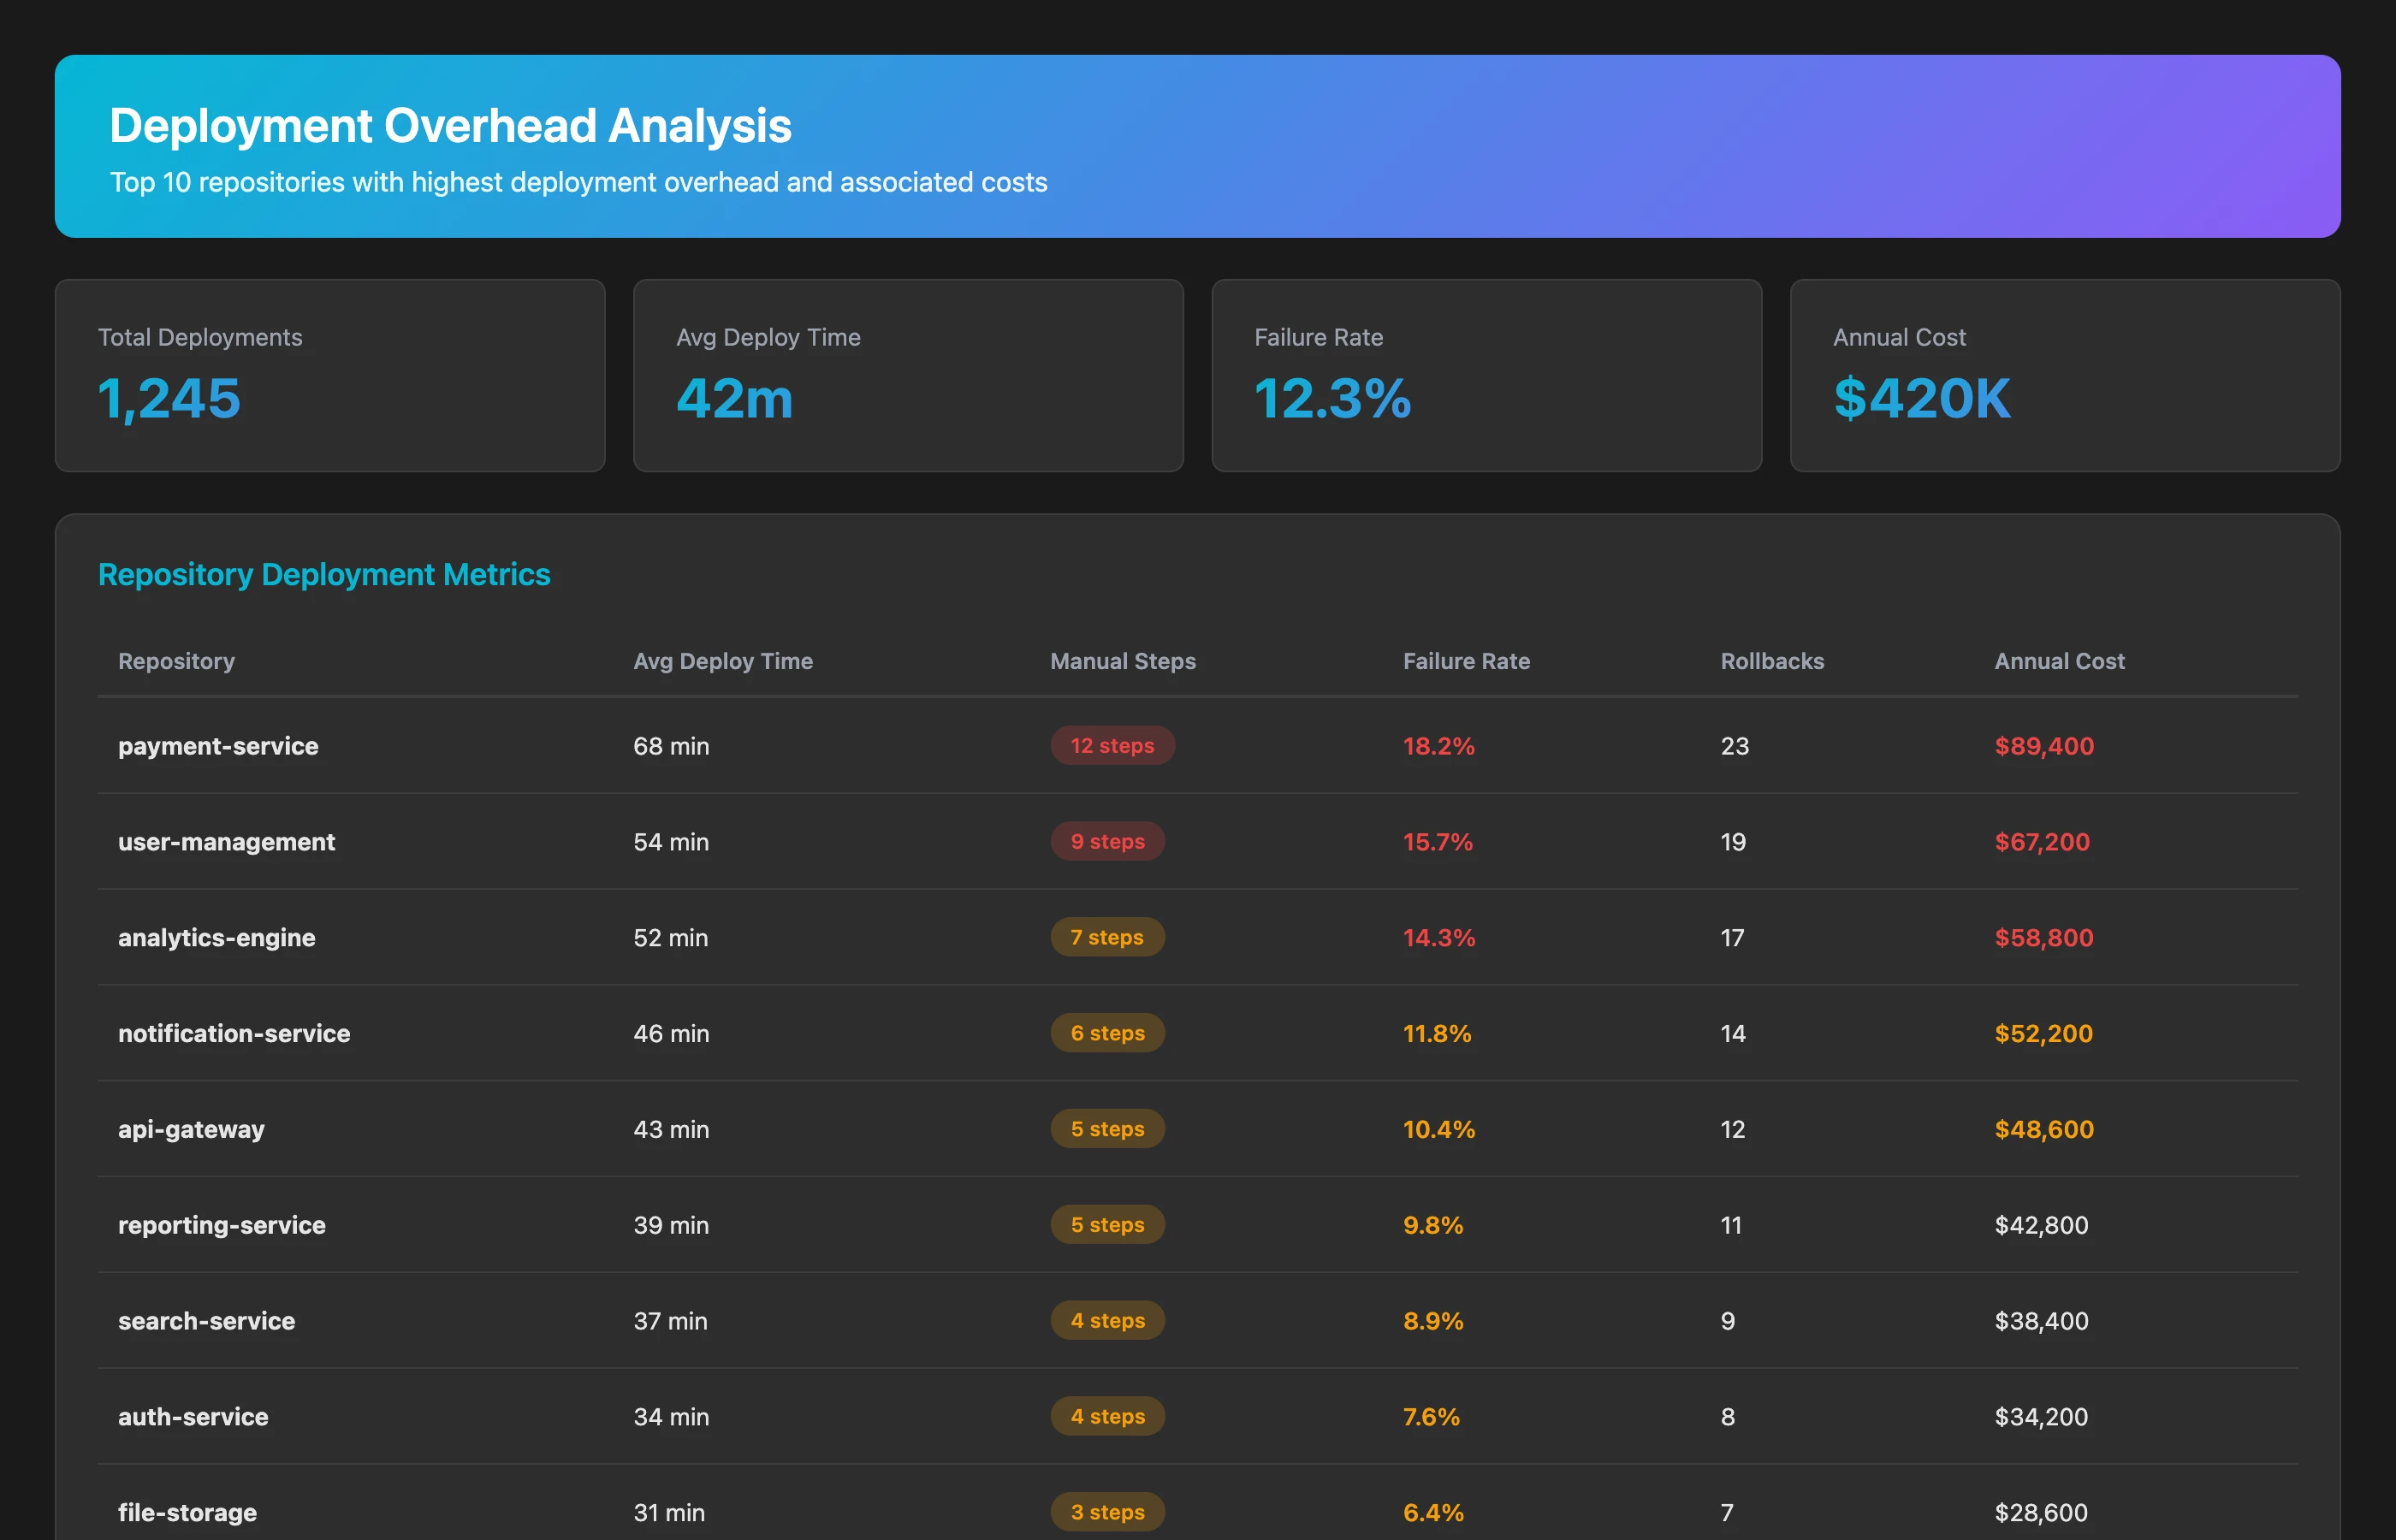
Analyze our deployment process over the last 3 months. For each deployment, calculate: total time from merge to production, manual steps required (indicated by commits with "manual" or "deploy" keywords followed by long gaps), failure rate, and rollback frequency. Identify deployments that took over 2 hours or required multiple attempts. Show me the top 10 repositories with the highest deployment overhead.
This analysis reveals which repositories have painful deployment processes and quantifies the time cost. Look for patterns like:
- Deployments consistently taking over 1 hour (should be minutes)
- High failure rates (>10%) indicating manual error-prone steps
- Gaps between "deploy" commits suggesting manual waiting
Measuring CI/CD Pipeline Efficiency
Slow CI/CD pipelines act as a hidden tax on every change:
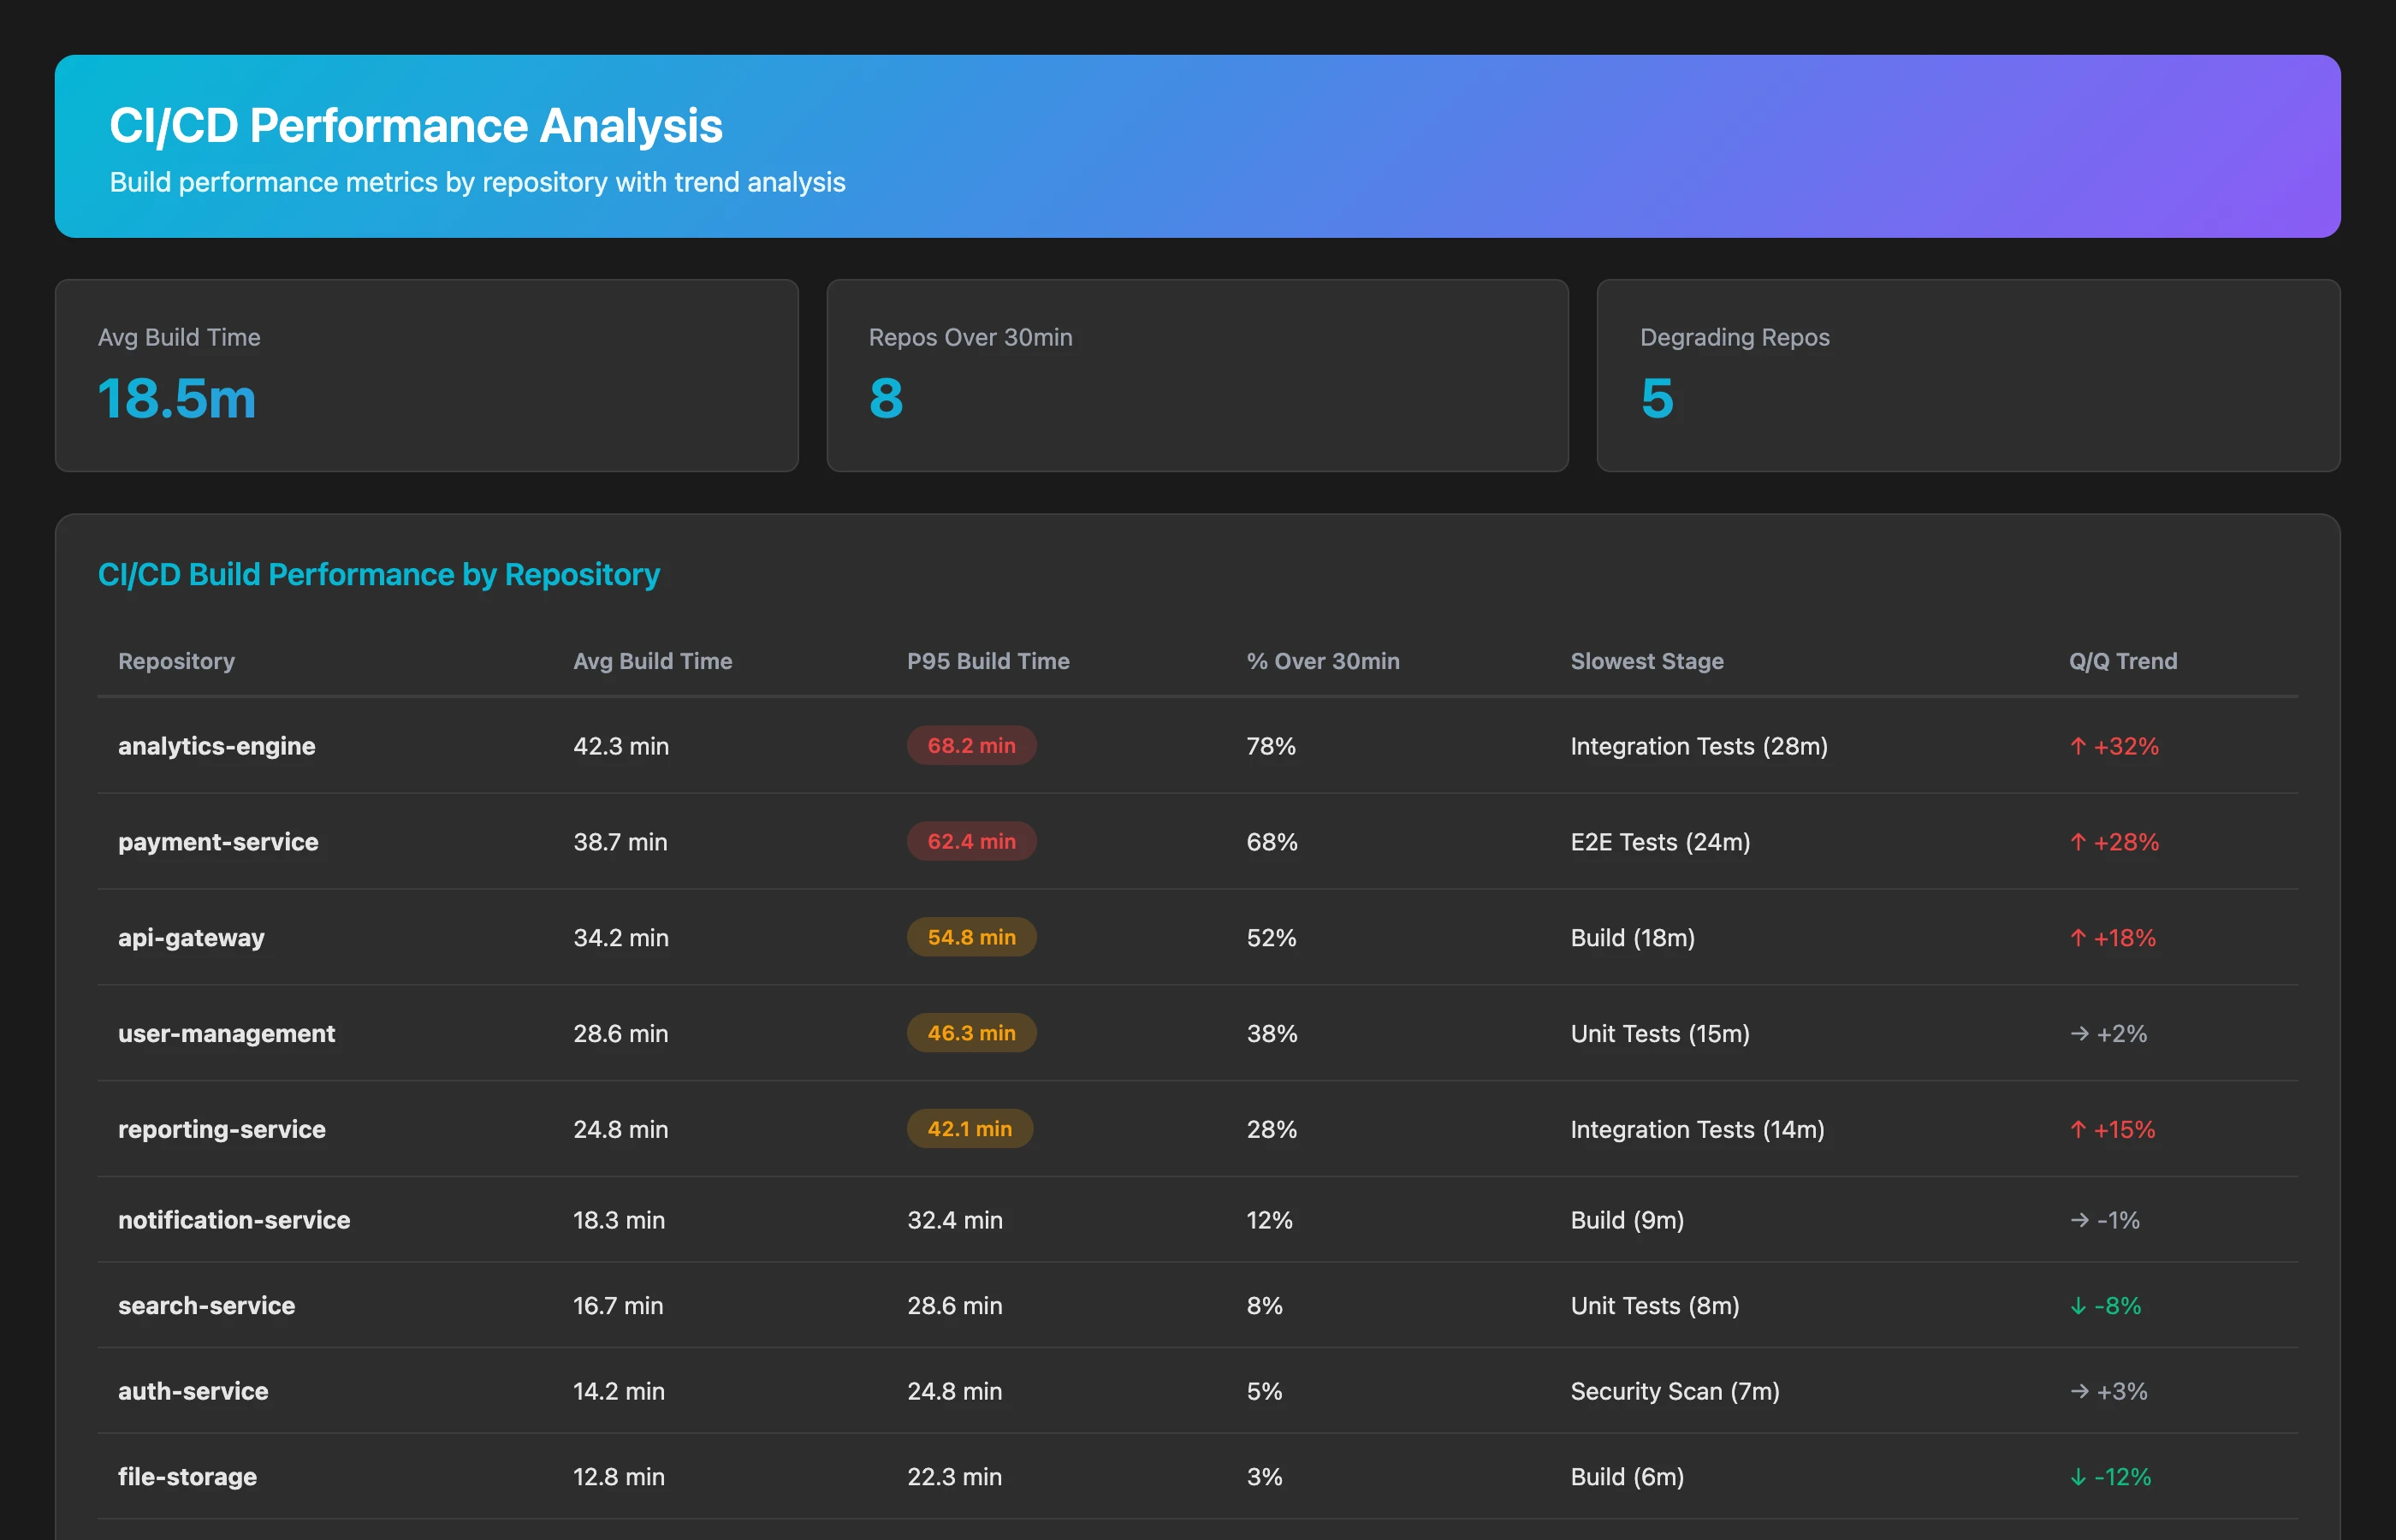
Analyze CI/CD pipeline performance across all repositories for Q2 2026. For each repository, show: average build time, 95th percentile build time, percentage of builds over 30 minutes, most time-consuming build stages, and trend over the quarter (improving vs. degrading). Identify repositories where build times increased by more than 25% quarter-over-quarter.
Key indicators of CI/CD process debt:
- Build times over 20 minutes: Teams stop running tests locally, relying only on CI
- Degrading performance: Build times increasing without corresponding test additions suggests accumulating inefficiency
- High variance: Wide gap between average and 95th percentile indicates inconsistent, unreliable builds
Calculating Process Debt Cost
Once you've identified process inefficiencies, quantify the financial impact:
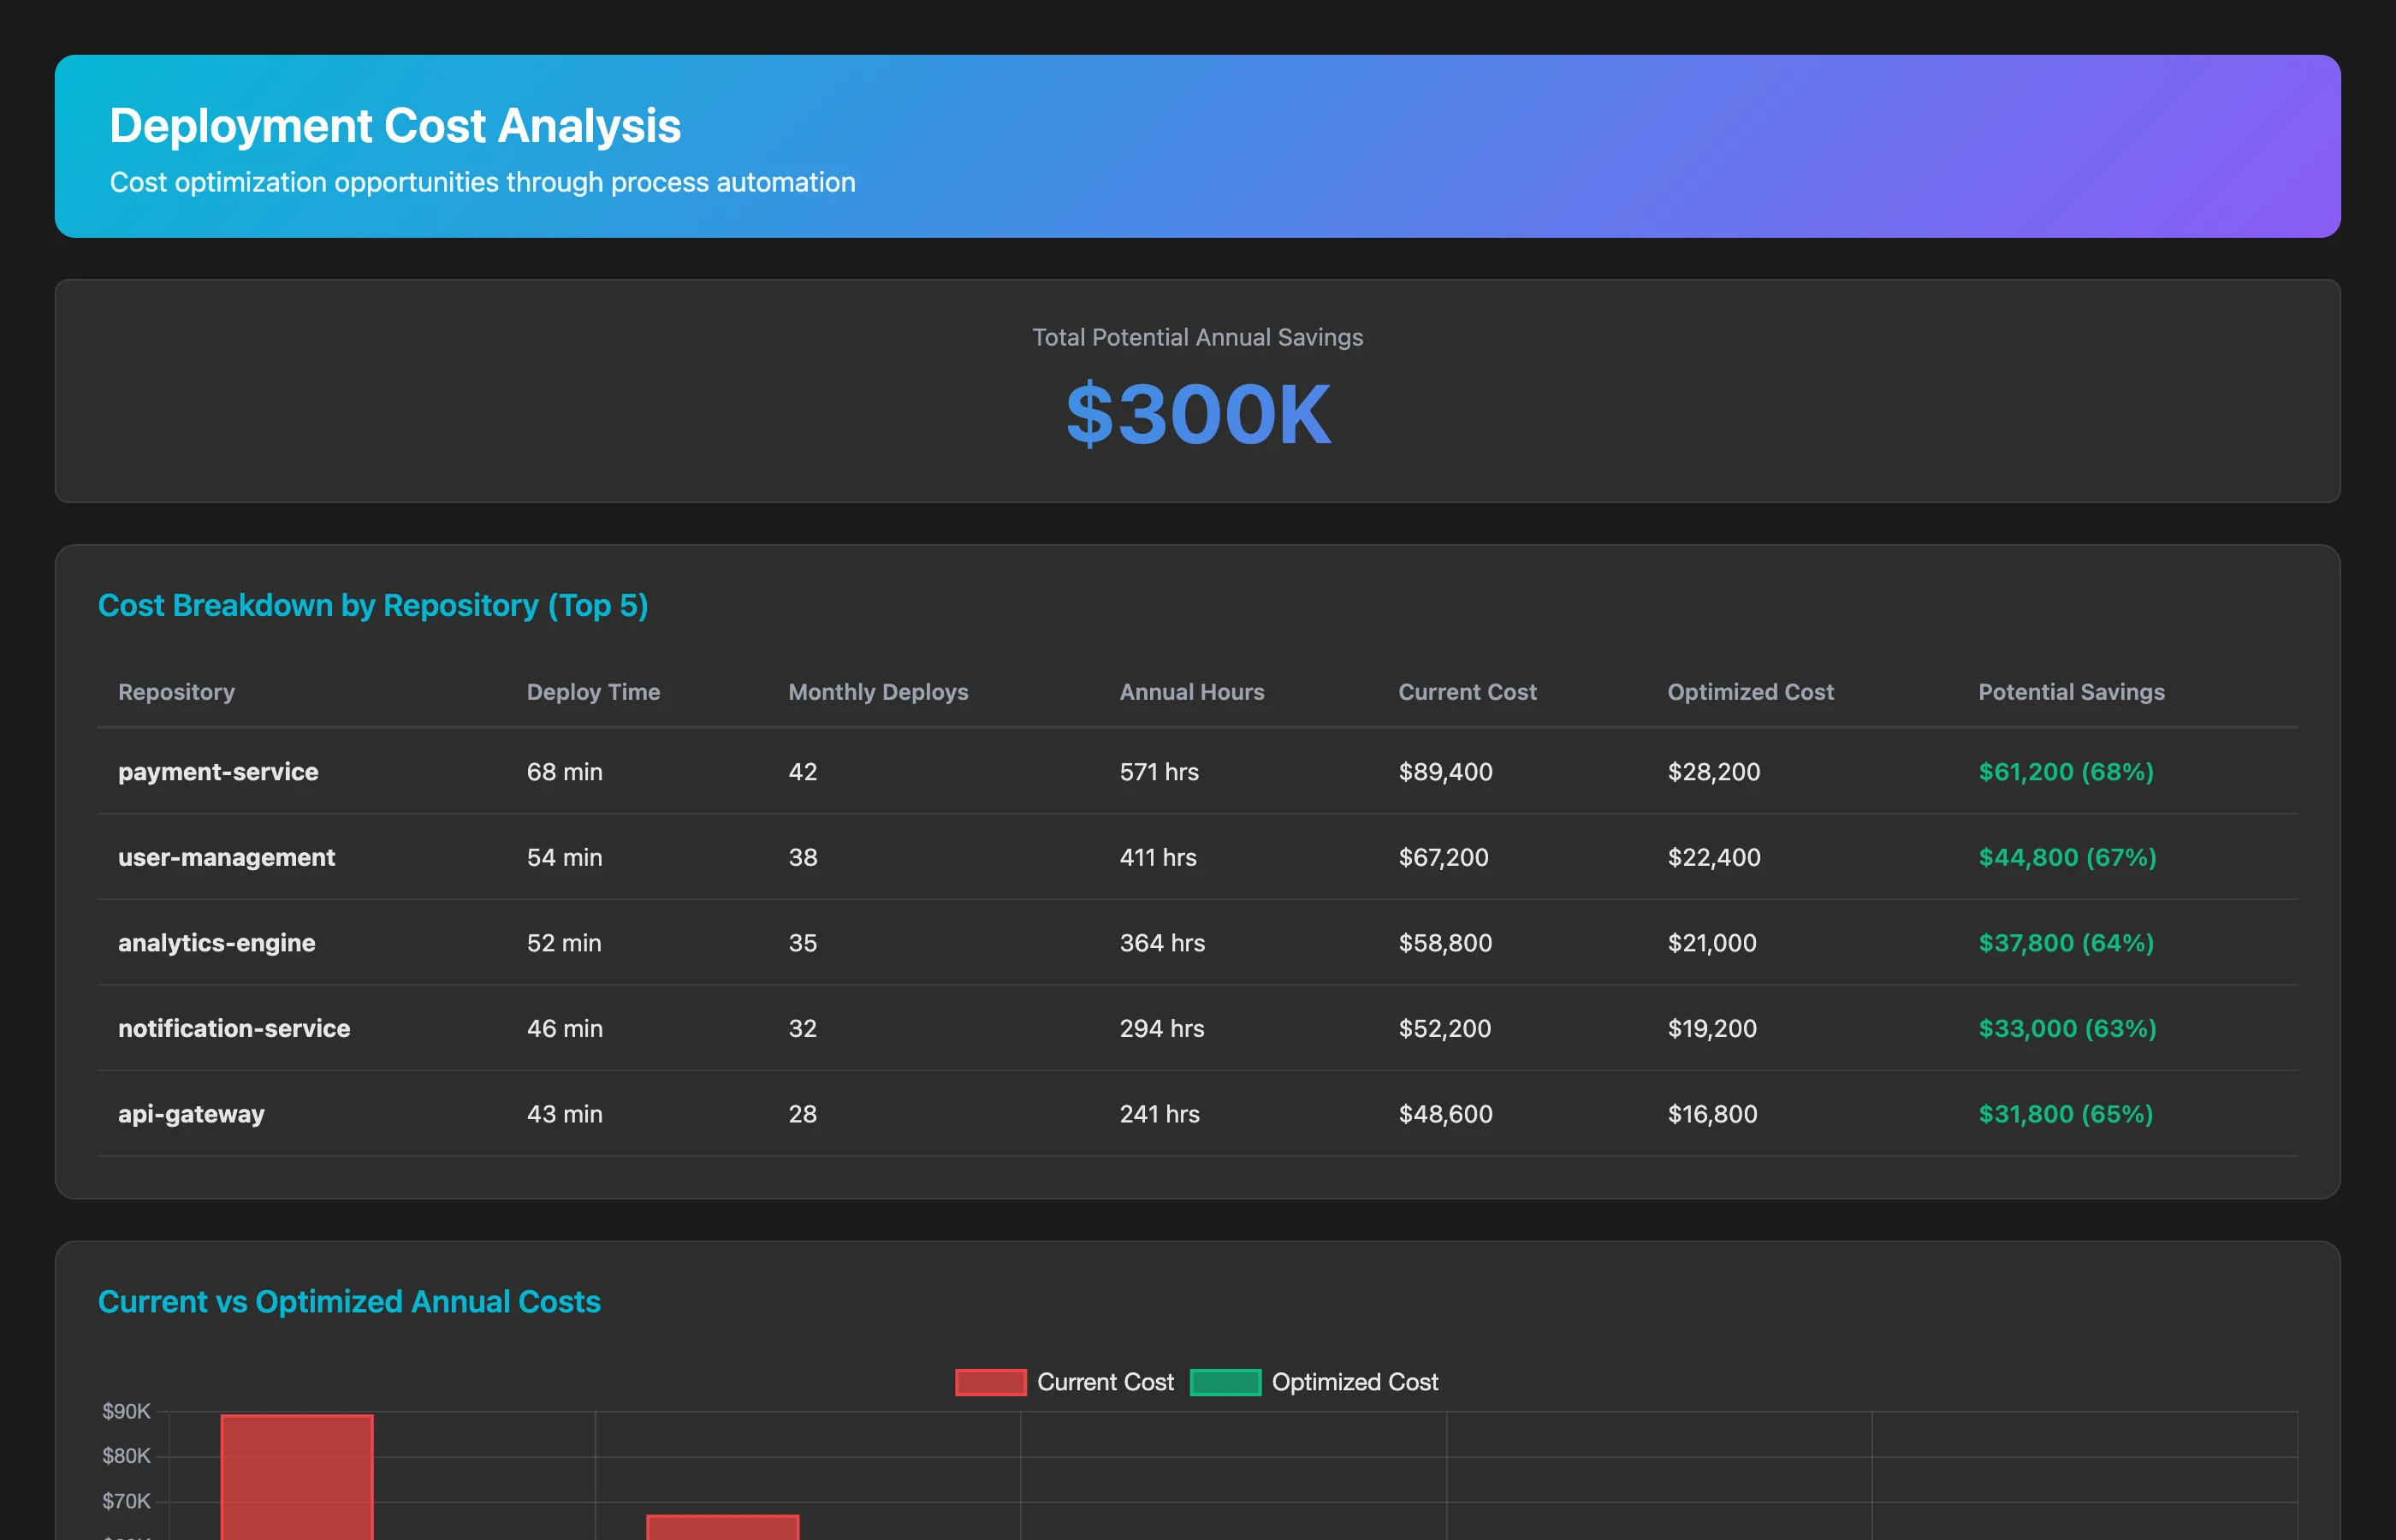
Calculate the cost of process debt for our top 5 repositories with the longest deployment times. For each repository, estimate: engineer time spent per deployment (based on deployment duration), number of deployments per month, annual engineer hours consumed by deployment overhead, cost at $125/hour loaded rate, and potential savings if deployment time reduced to industry benchmark (15 minutes). Show the total annual cost of deployment process debt.
This cost analysis transforms "deployment is slow" into "our deployment process costs $380K annually and could be reduced to $80K with automation—an ROI of 300K/year." That's a different conversation with leadership than "we should automate deployment someday."
Identifying Toil vs. Strategic Work
Not all manual work is equal. Some is valuable (complex problem-solving), some is toil (repetitive, automatable):
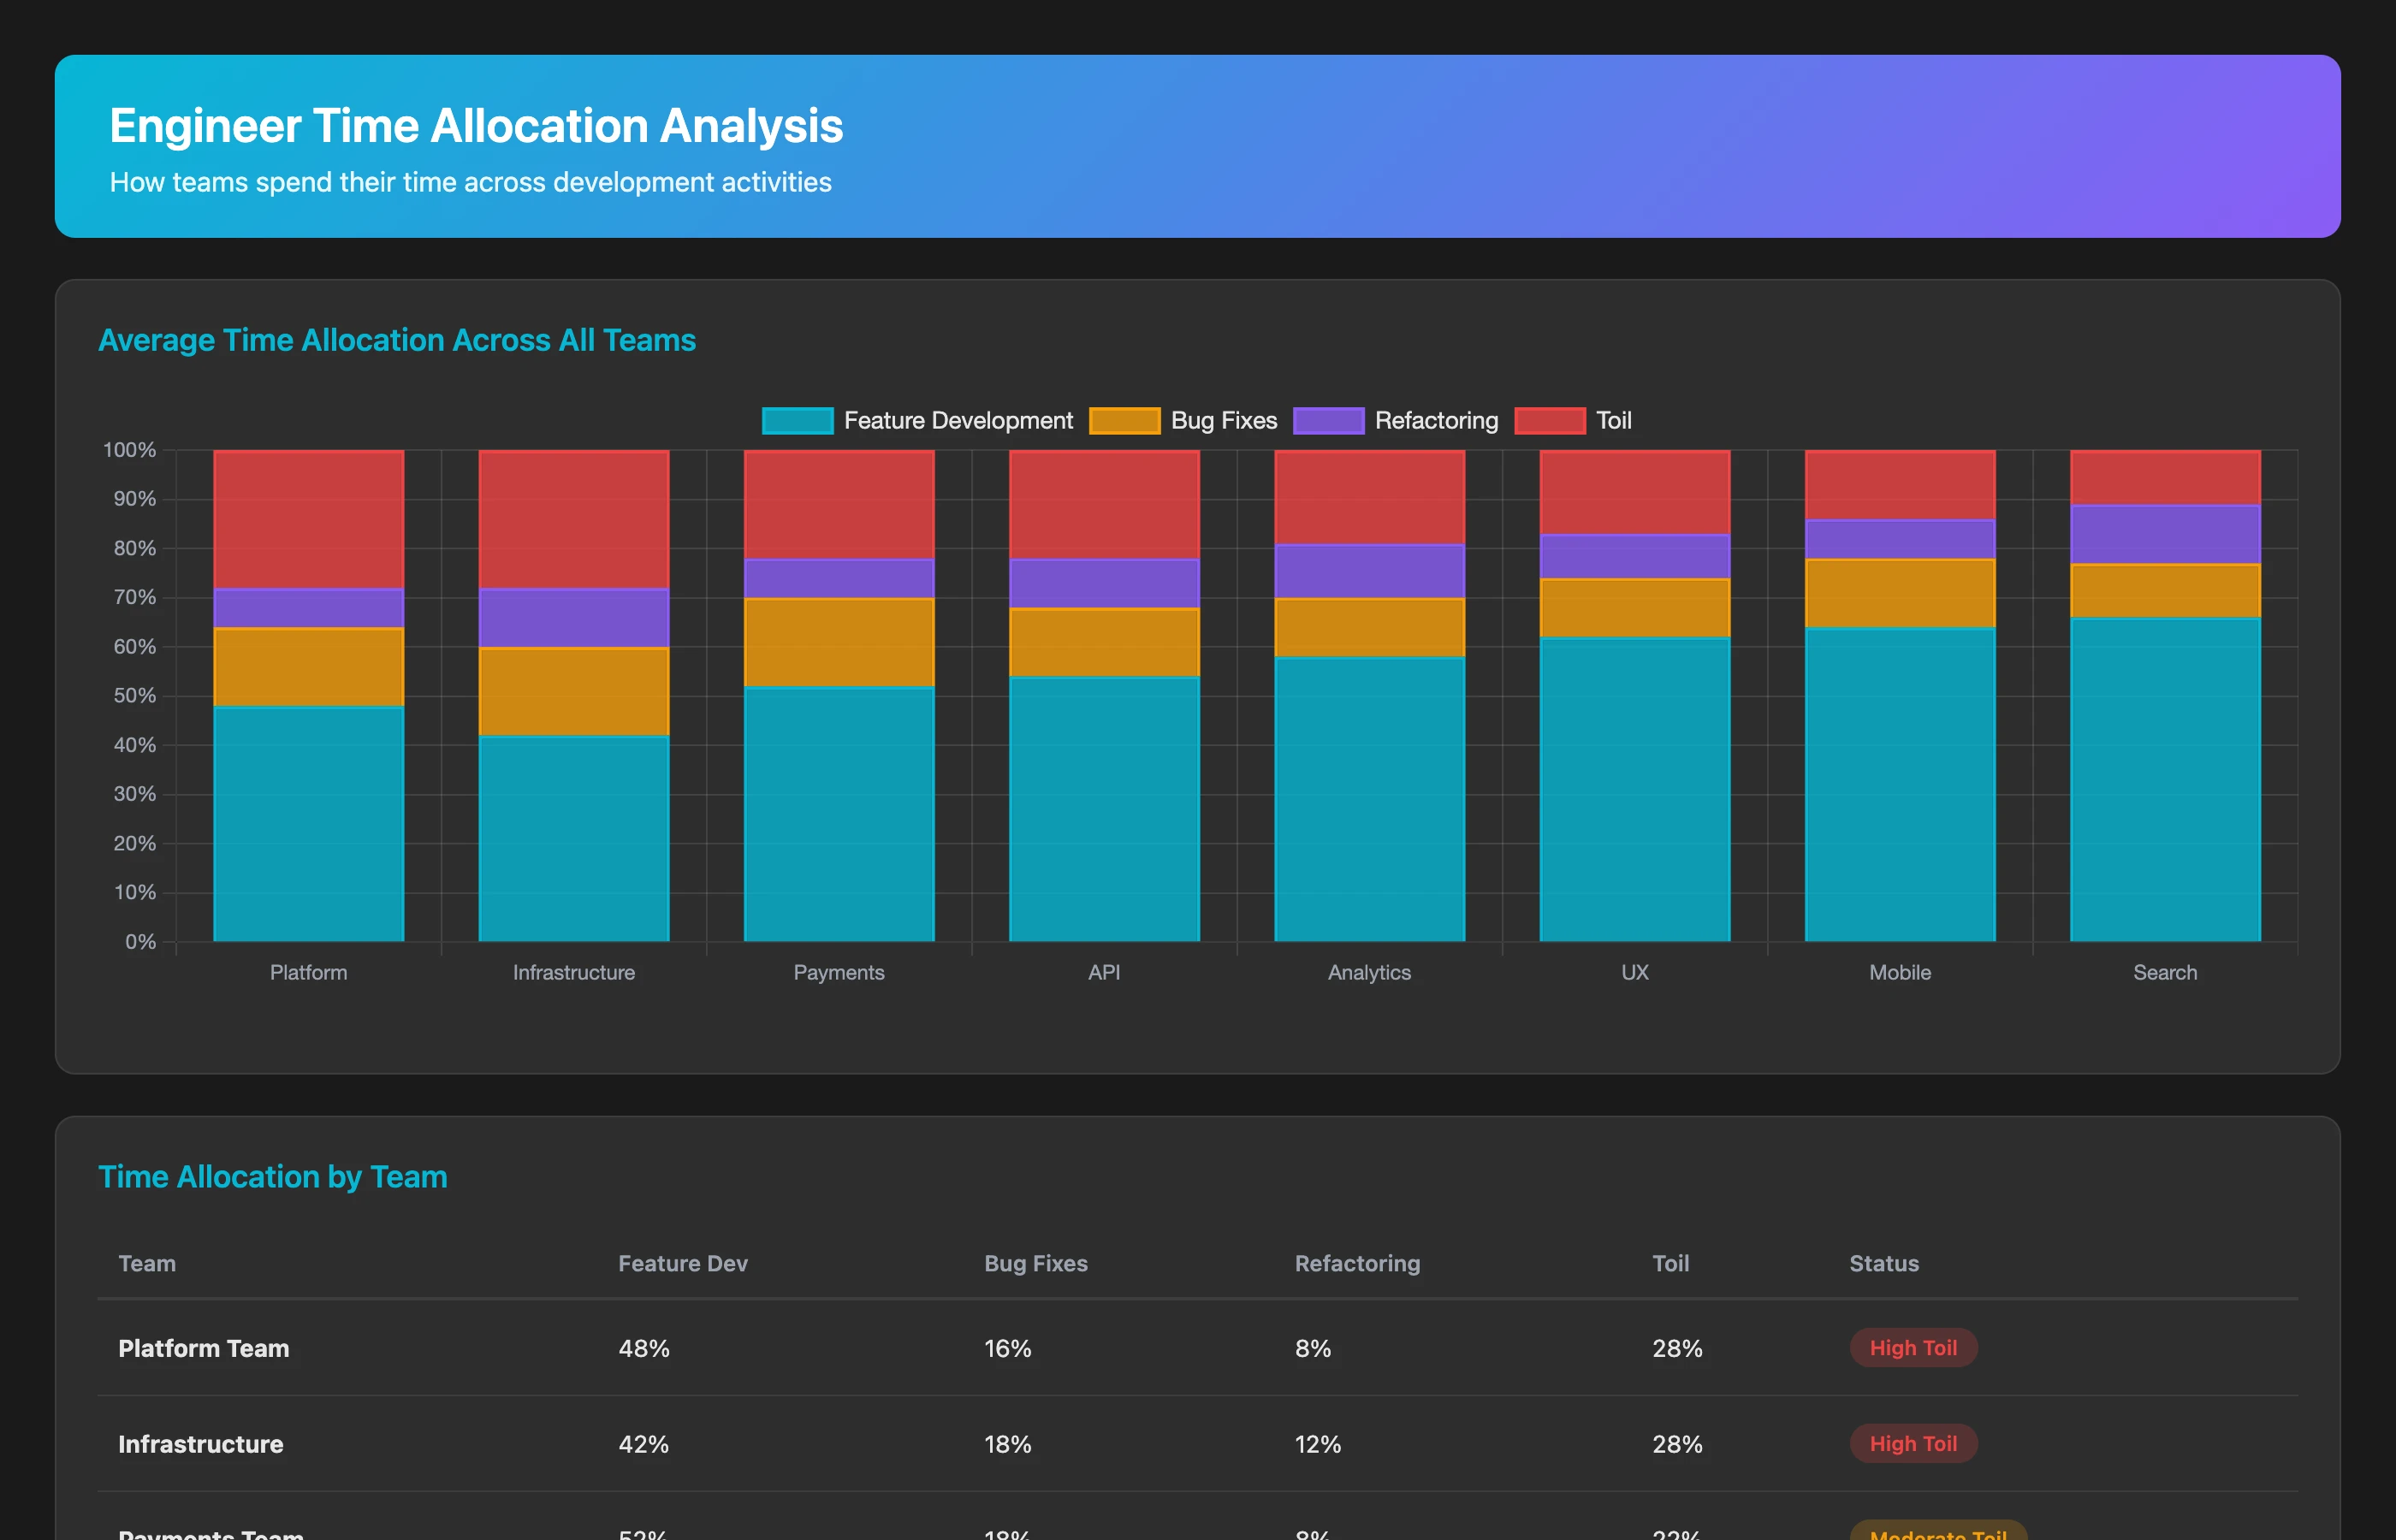
Analyze engineer activity patterns for Q2 2026. Categorize work as: feature development (PRs introducing new functionality), bug fixes (PRs with "fix" or "bug" in title/description), refactoring (PRs with "refactor" or "cleanup"), and toil (PRs with "deploy", "manual", "hotfix", "revert", "config"). For each engineer and team, show the percentage of time in each category. Flag teams spending over 20% of time on toil.
Teams spending over 20% of time on toil are drowning in process debt. That's one engineer in five doing repetitive work that could be automated, rather than building product value.
Uncovering Review Debt: When Code Reviews Don't Review
Code review processes exist in most engineering organizations, but many have accumulated significant review debt—reviews that check boxes without catching issues. Let's surface the patterns.
Detecting Rubber-Stamp Approvals
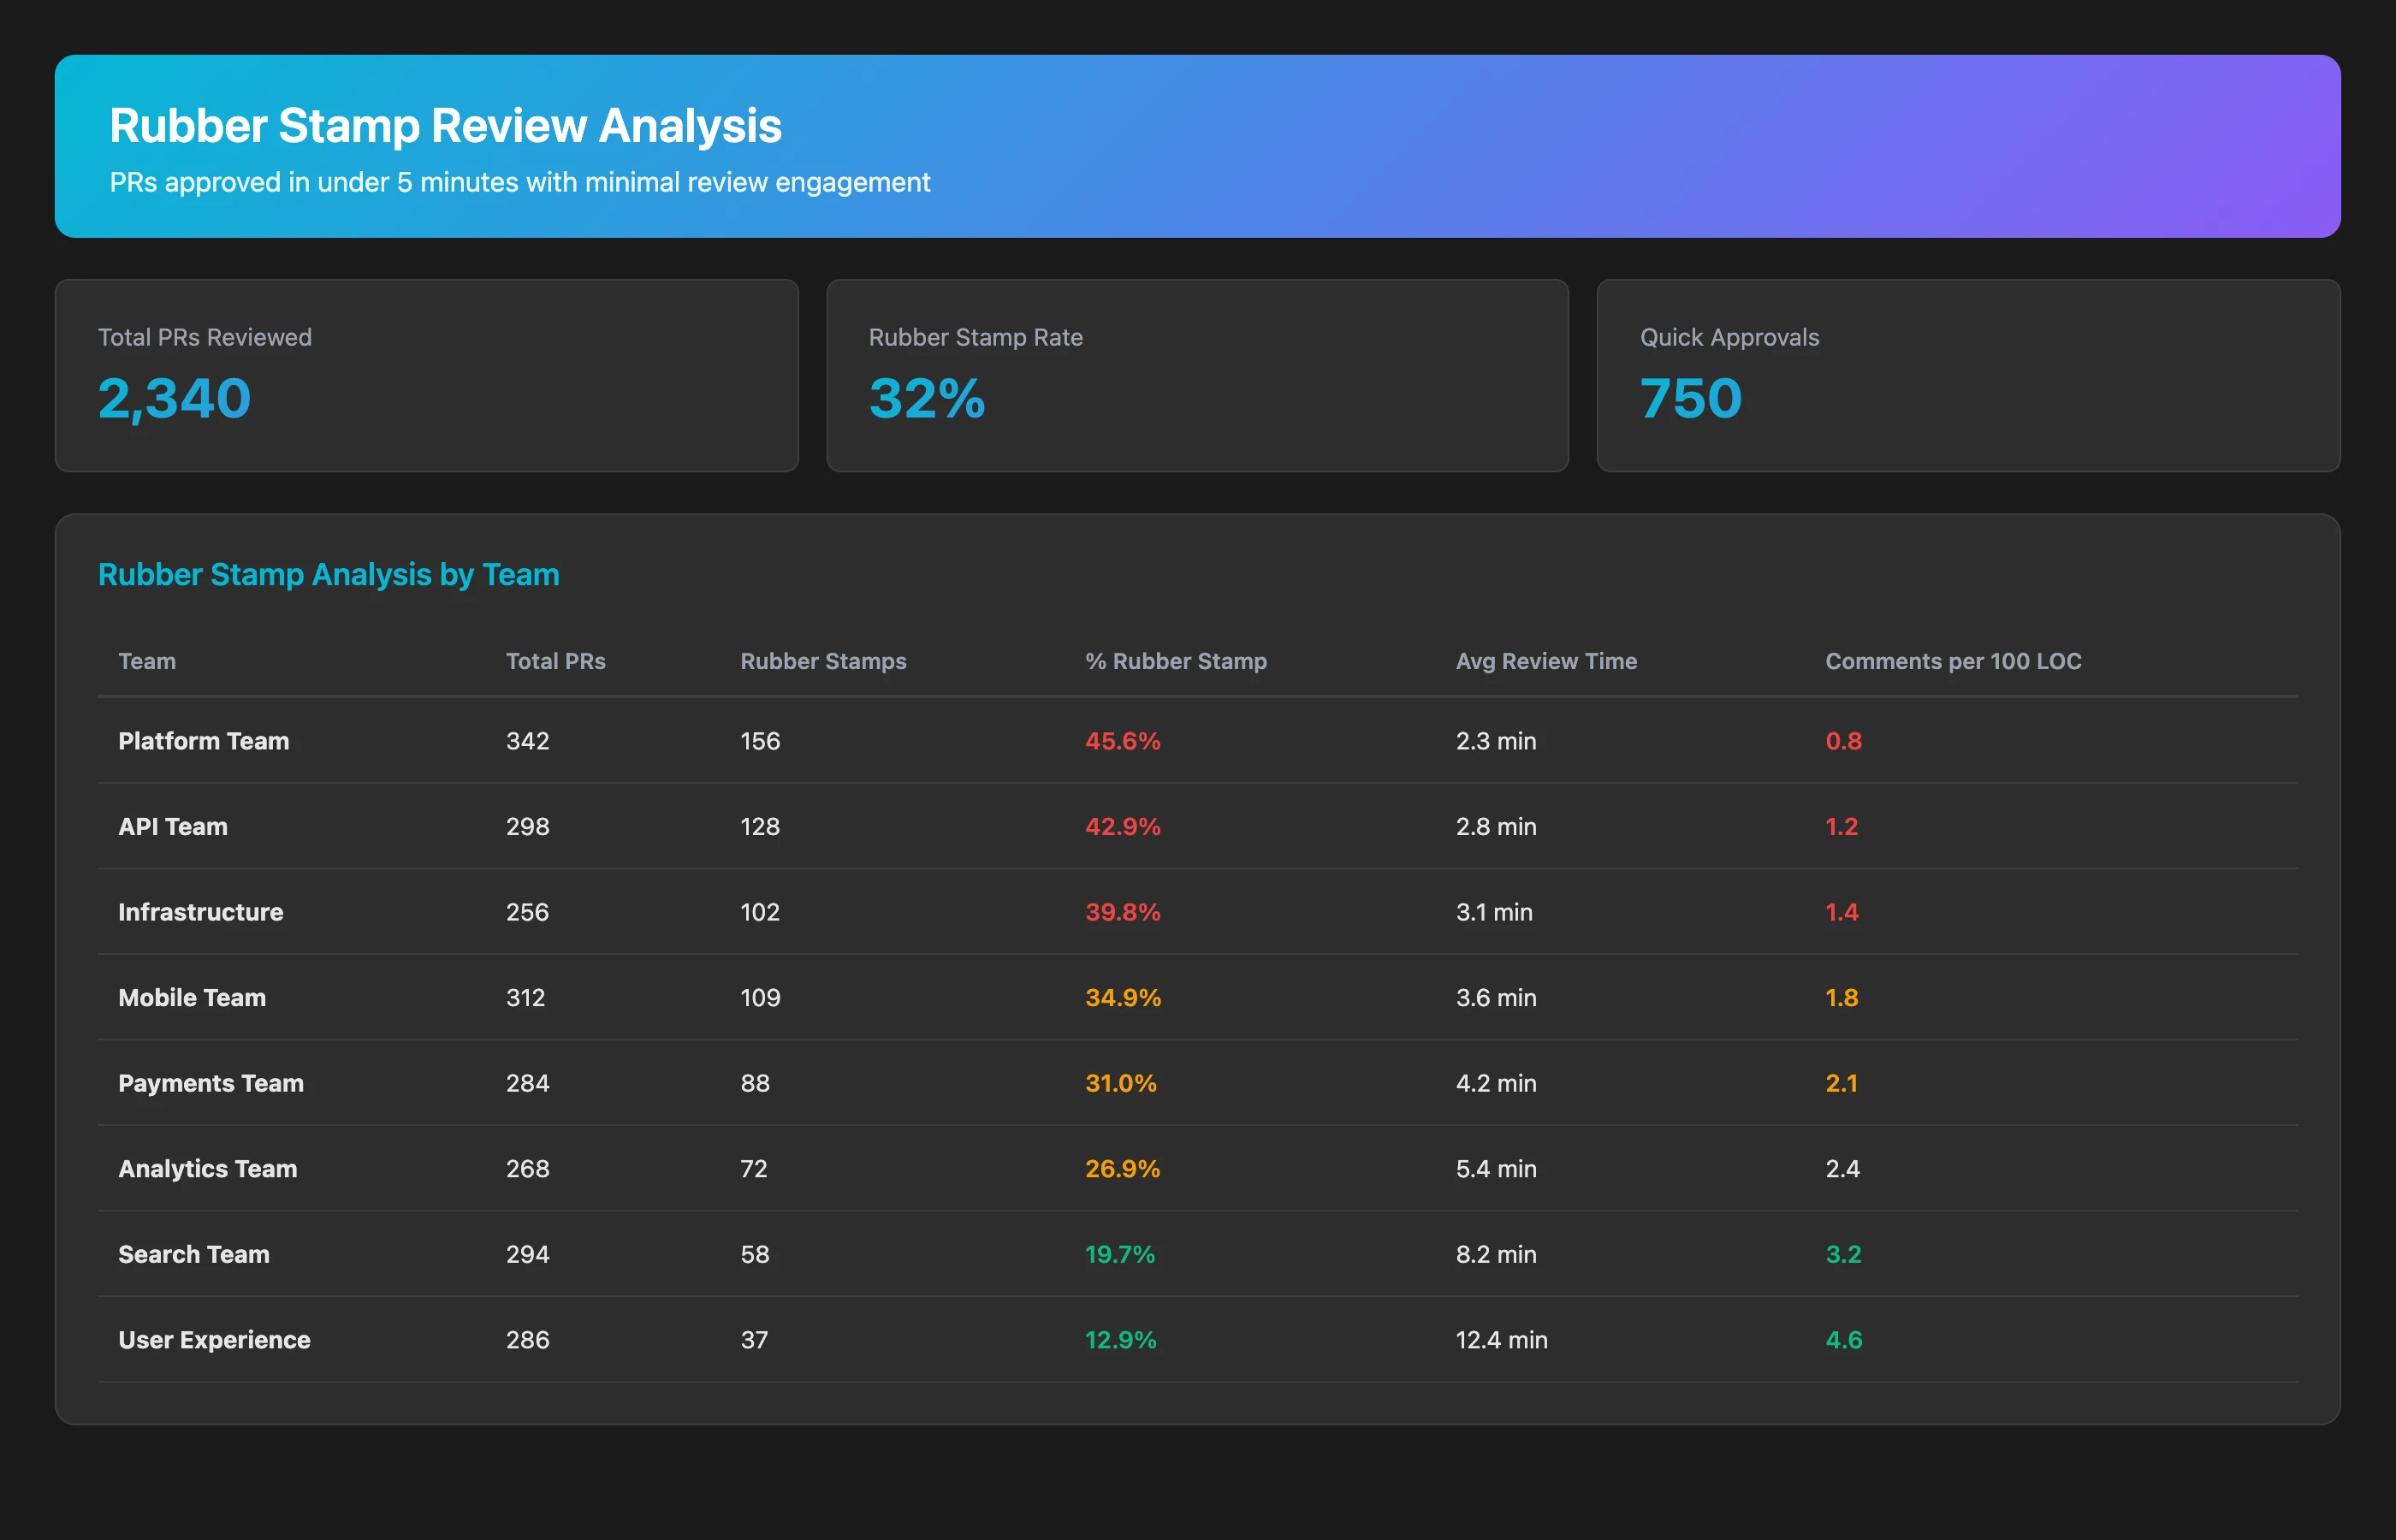
Quick approvals aren't inherently bad (small PRs should be fast), but patterns of consistently fast approvals without engagement suggest review debt:
Analyze code review quality for Q2 2026. For each PR, calculate: time to first review, time from first review to approval, number of review comments, reviewer engagement (comments per 100 lines changed), and whether substantive issues were raised. Identify "rubber stamp" reviews: approved in under 10 minutes with fewer than 2 comments on PRs over 100 lines. Show the percentage of rubber-stamp reviews by team and repository.
Warning signs of review debt:
- Over 30% rubber-stamp rate: Most reviews provide no meaningful feedback
- Large PRs with quick approvals: 500-line PRs approved in 5 minutes weren't actually read
- Declining comment rates: Reviewer engagement decreasing over time indicates growing fatigue
Correlating Review Quality with Defect Rates
Poor reviews let bugs through. Let's quantify the correlation:
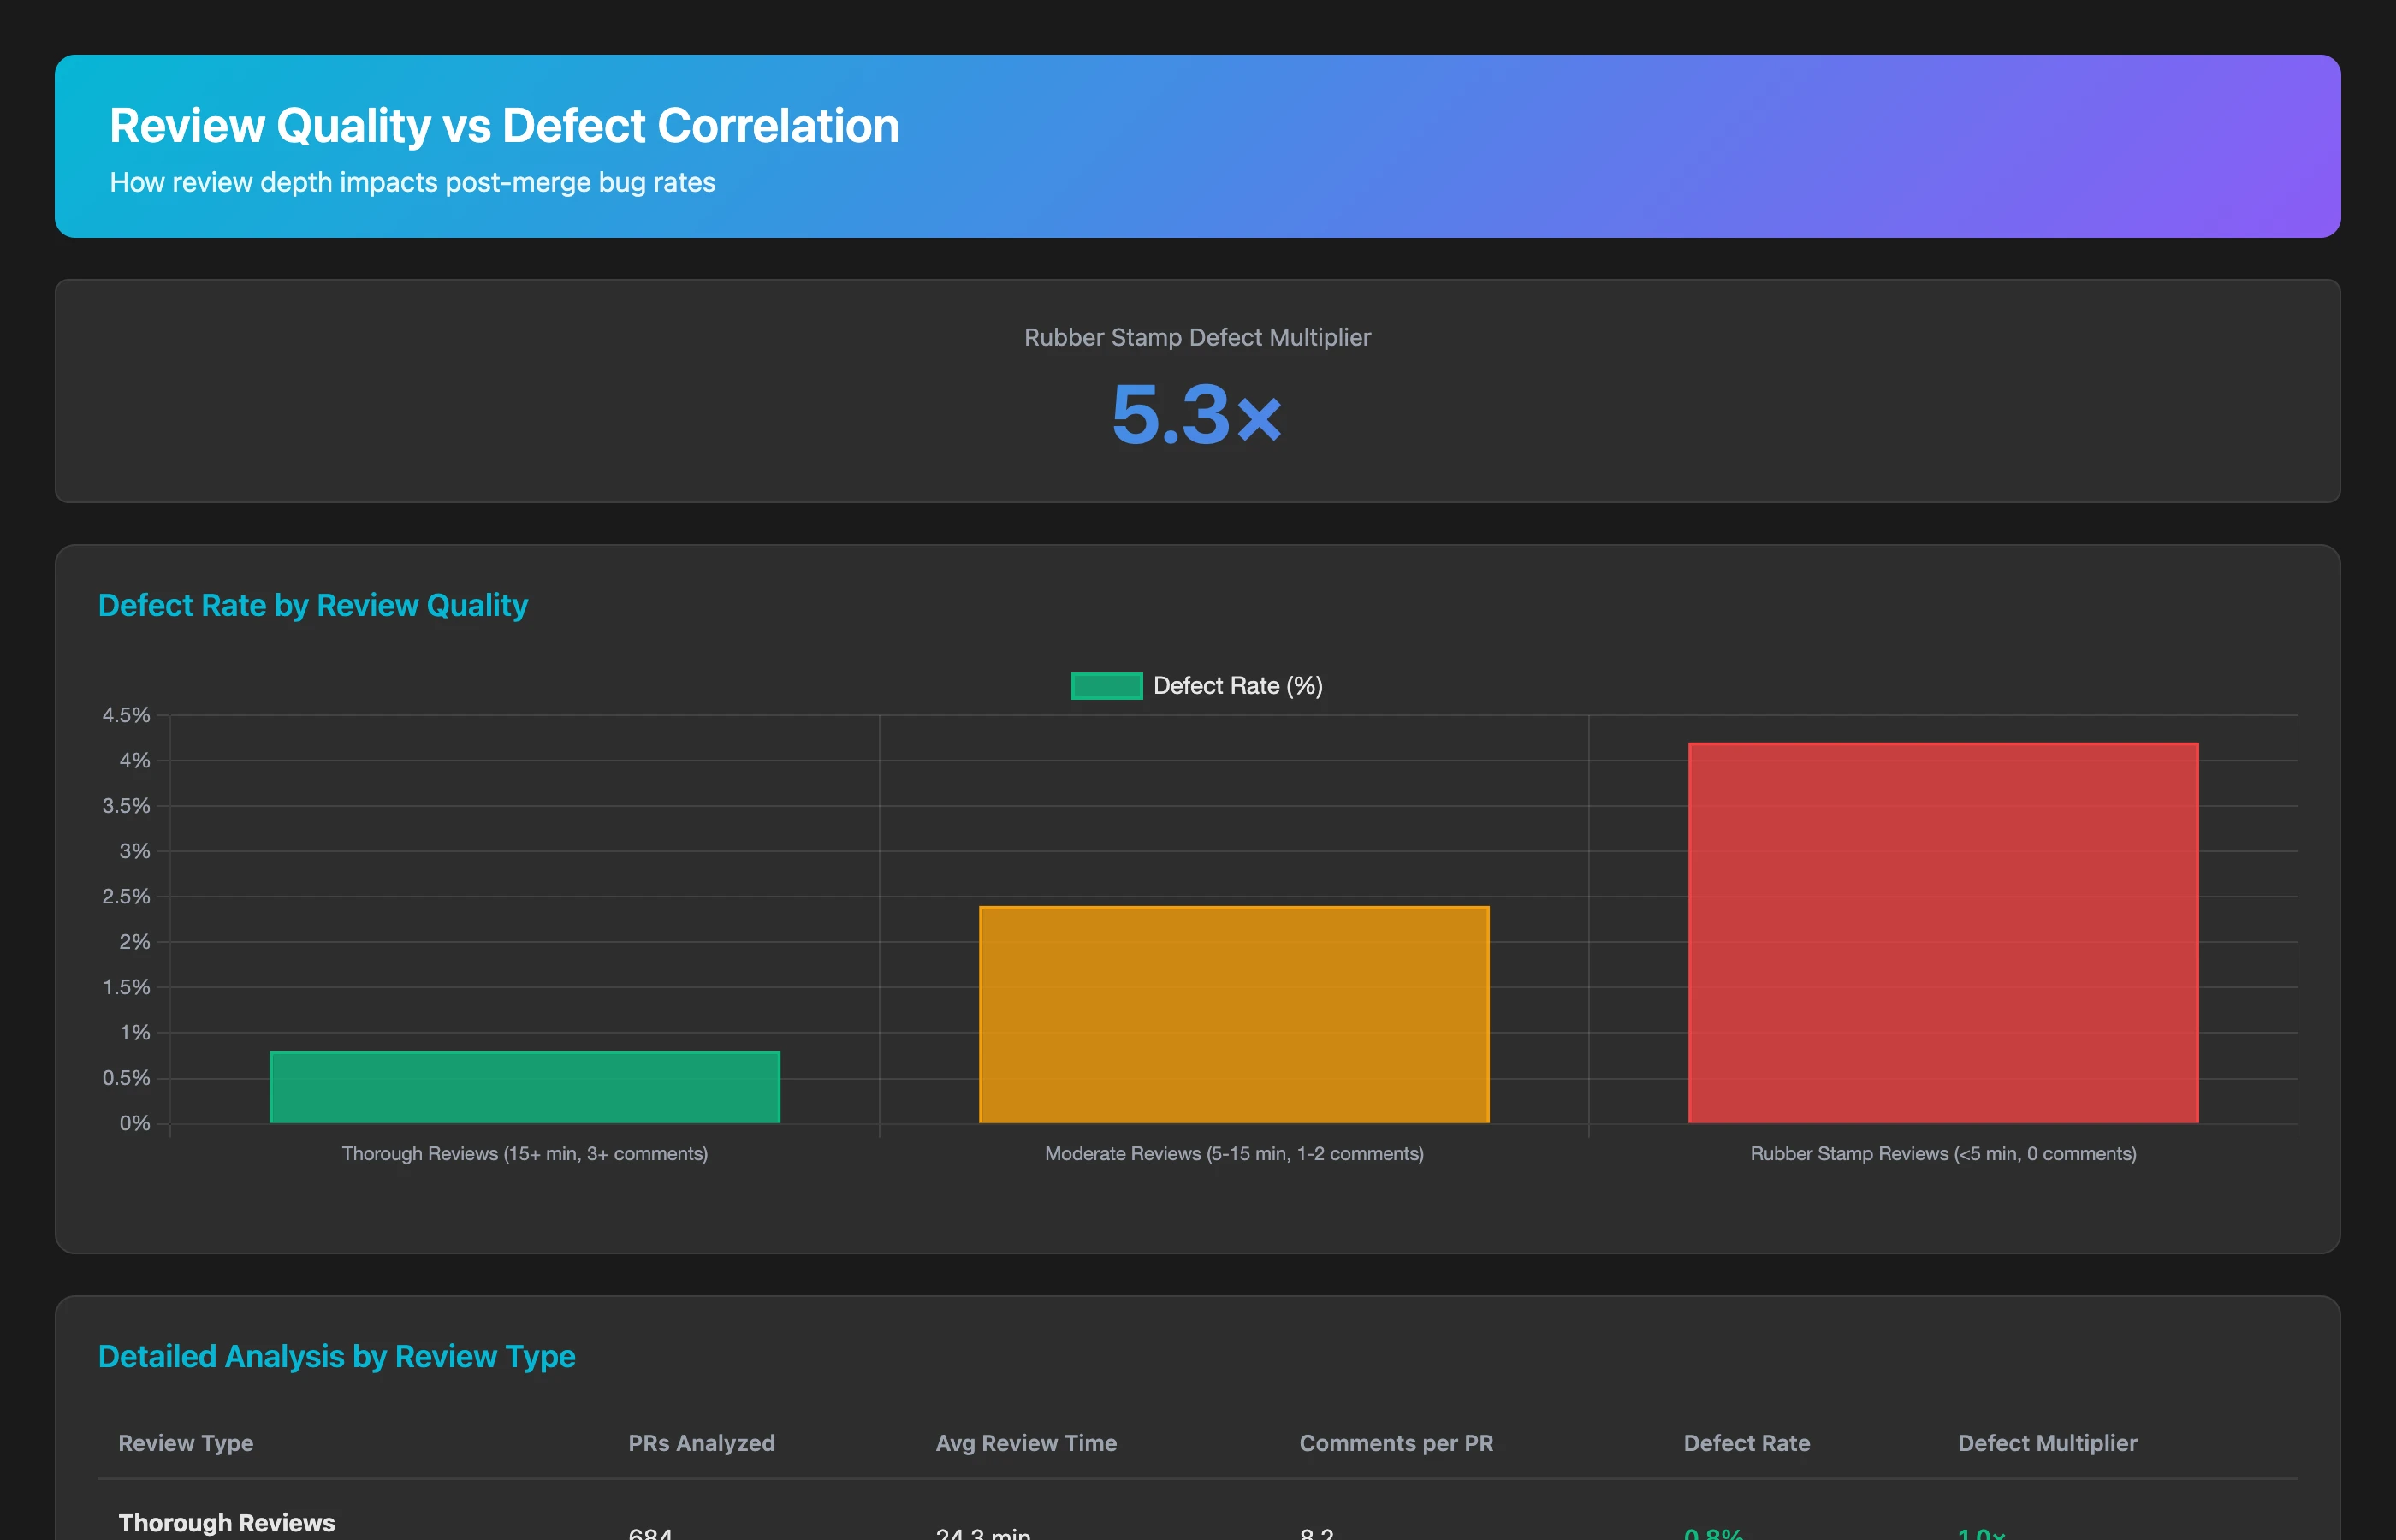
Correlate code review quality with post-merge defects for Q2 2026. For each PR, track: review depth (time spent, comments made, reviewer experience), and subsequent bug fixes (PRs within 2 weeks that fix issues introduced by the original PR). Calculate defect rate for: thorough reviews (over 20 minutes, multiple comments), moderate reviews (10-20 minutes, some comments), and rubber-stamp reviews (under 10 minutes, minimal comments). Show the defect multiplier for quick reviews vs. thorough reviews.
Typically, rubber-stamp reviews have 3-5× higher defect rates than thorough reviews. This correlation demonstrates that review debt doesn't just slow things down—it actively creates more work by letting bugs through.
Identifying Review Bottlenecks
Review debt also manifests as bottlenecks where PRs wait days for review:
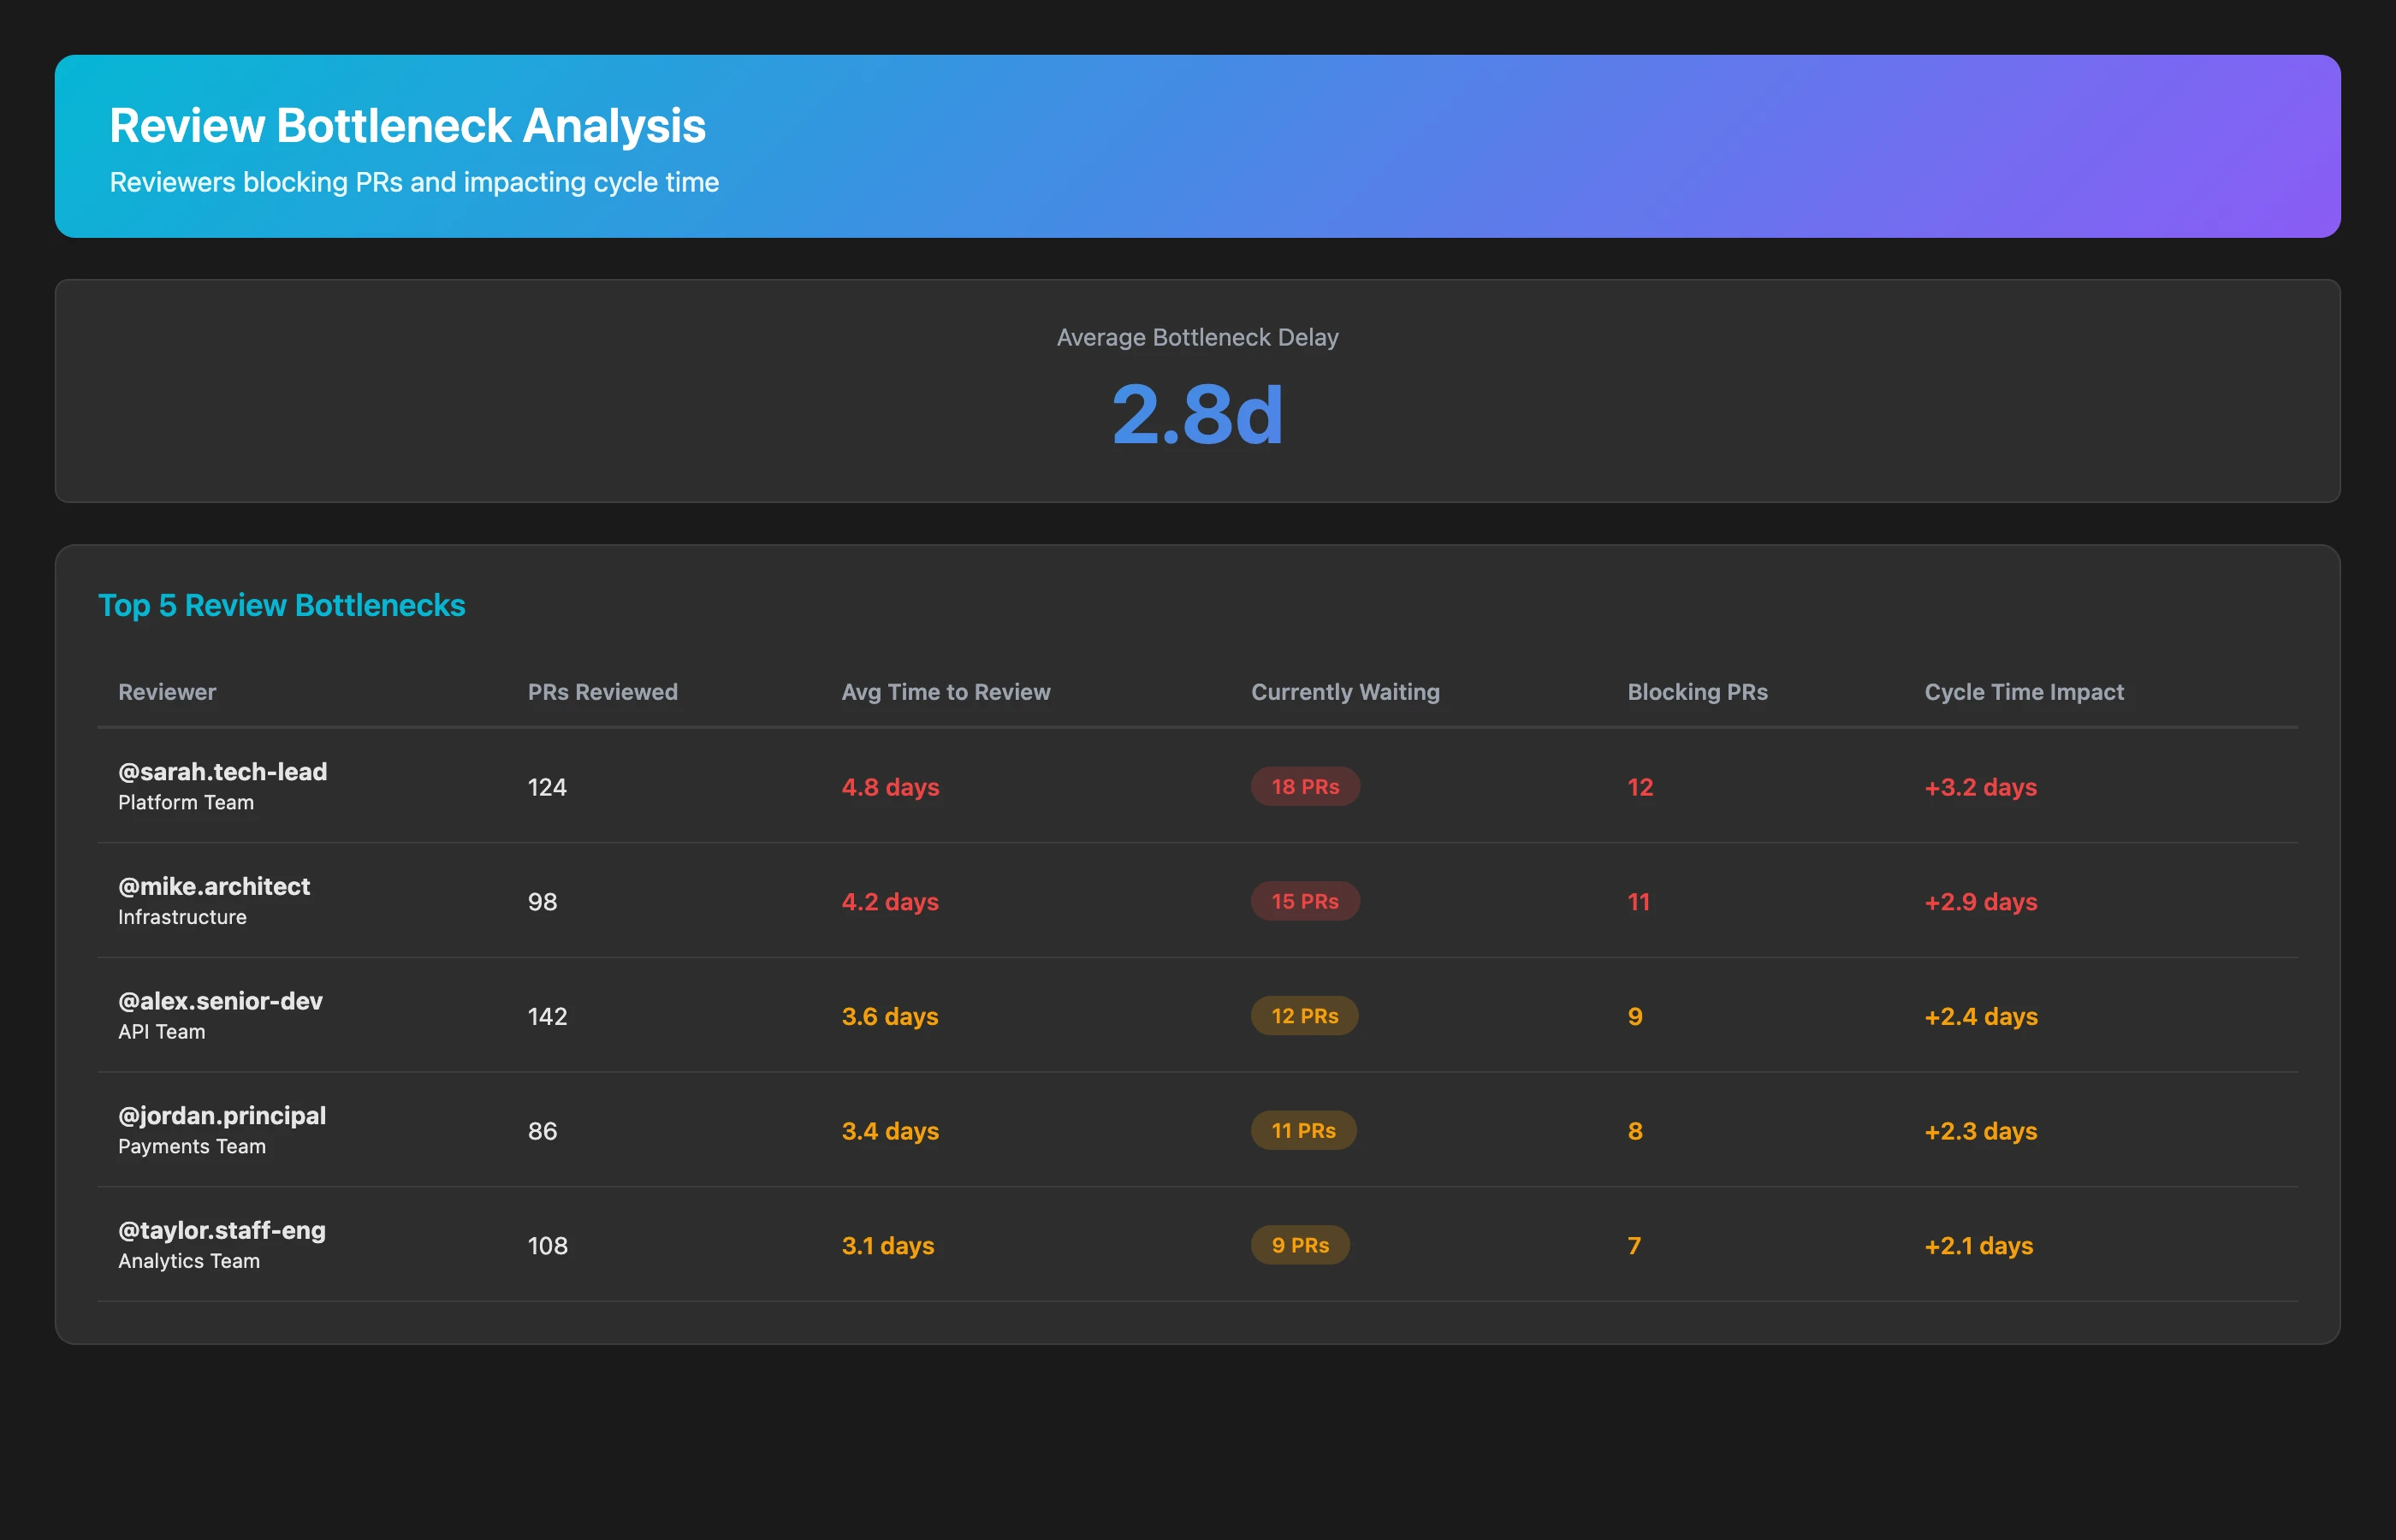
Analyze code review bottlenecks for Q2 2026. For each reviewer, calculate: number of PRs reviewed, average time to first review, number of PRs currently awaiting their review, and percentage of PRs where they are the blocking reviewer (waiting over 24 hours). Identify the top 5 review bottlenecks and estimate the cycle time impact (how much faster PRs would merge if these reviewers responded within 4 hours).
Review bottlenecks create a different form of review debt: delays that force context-switching, stale branches, and merge conflicts. A single bottleneck reviewer can add 2-3 days to every PR they're assigned.
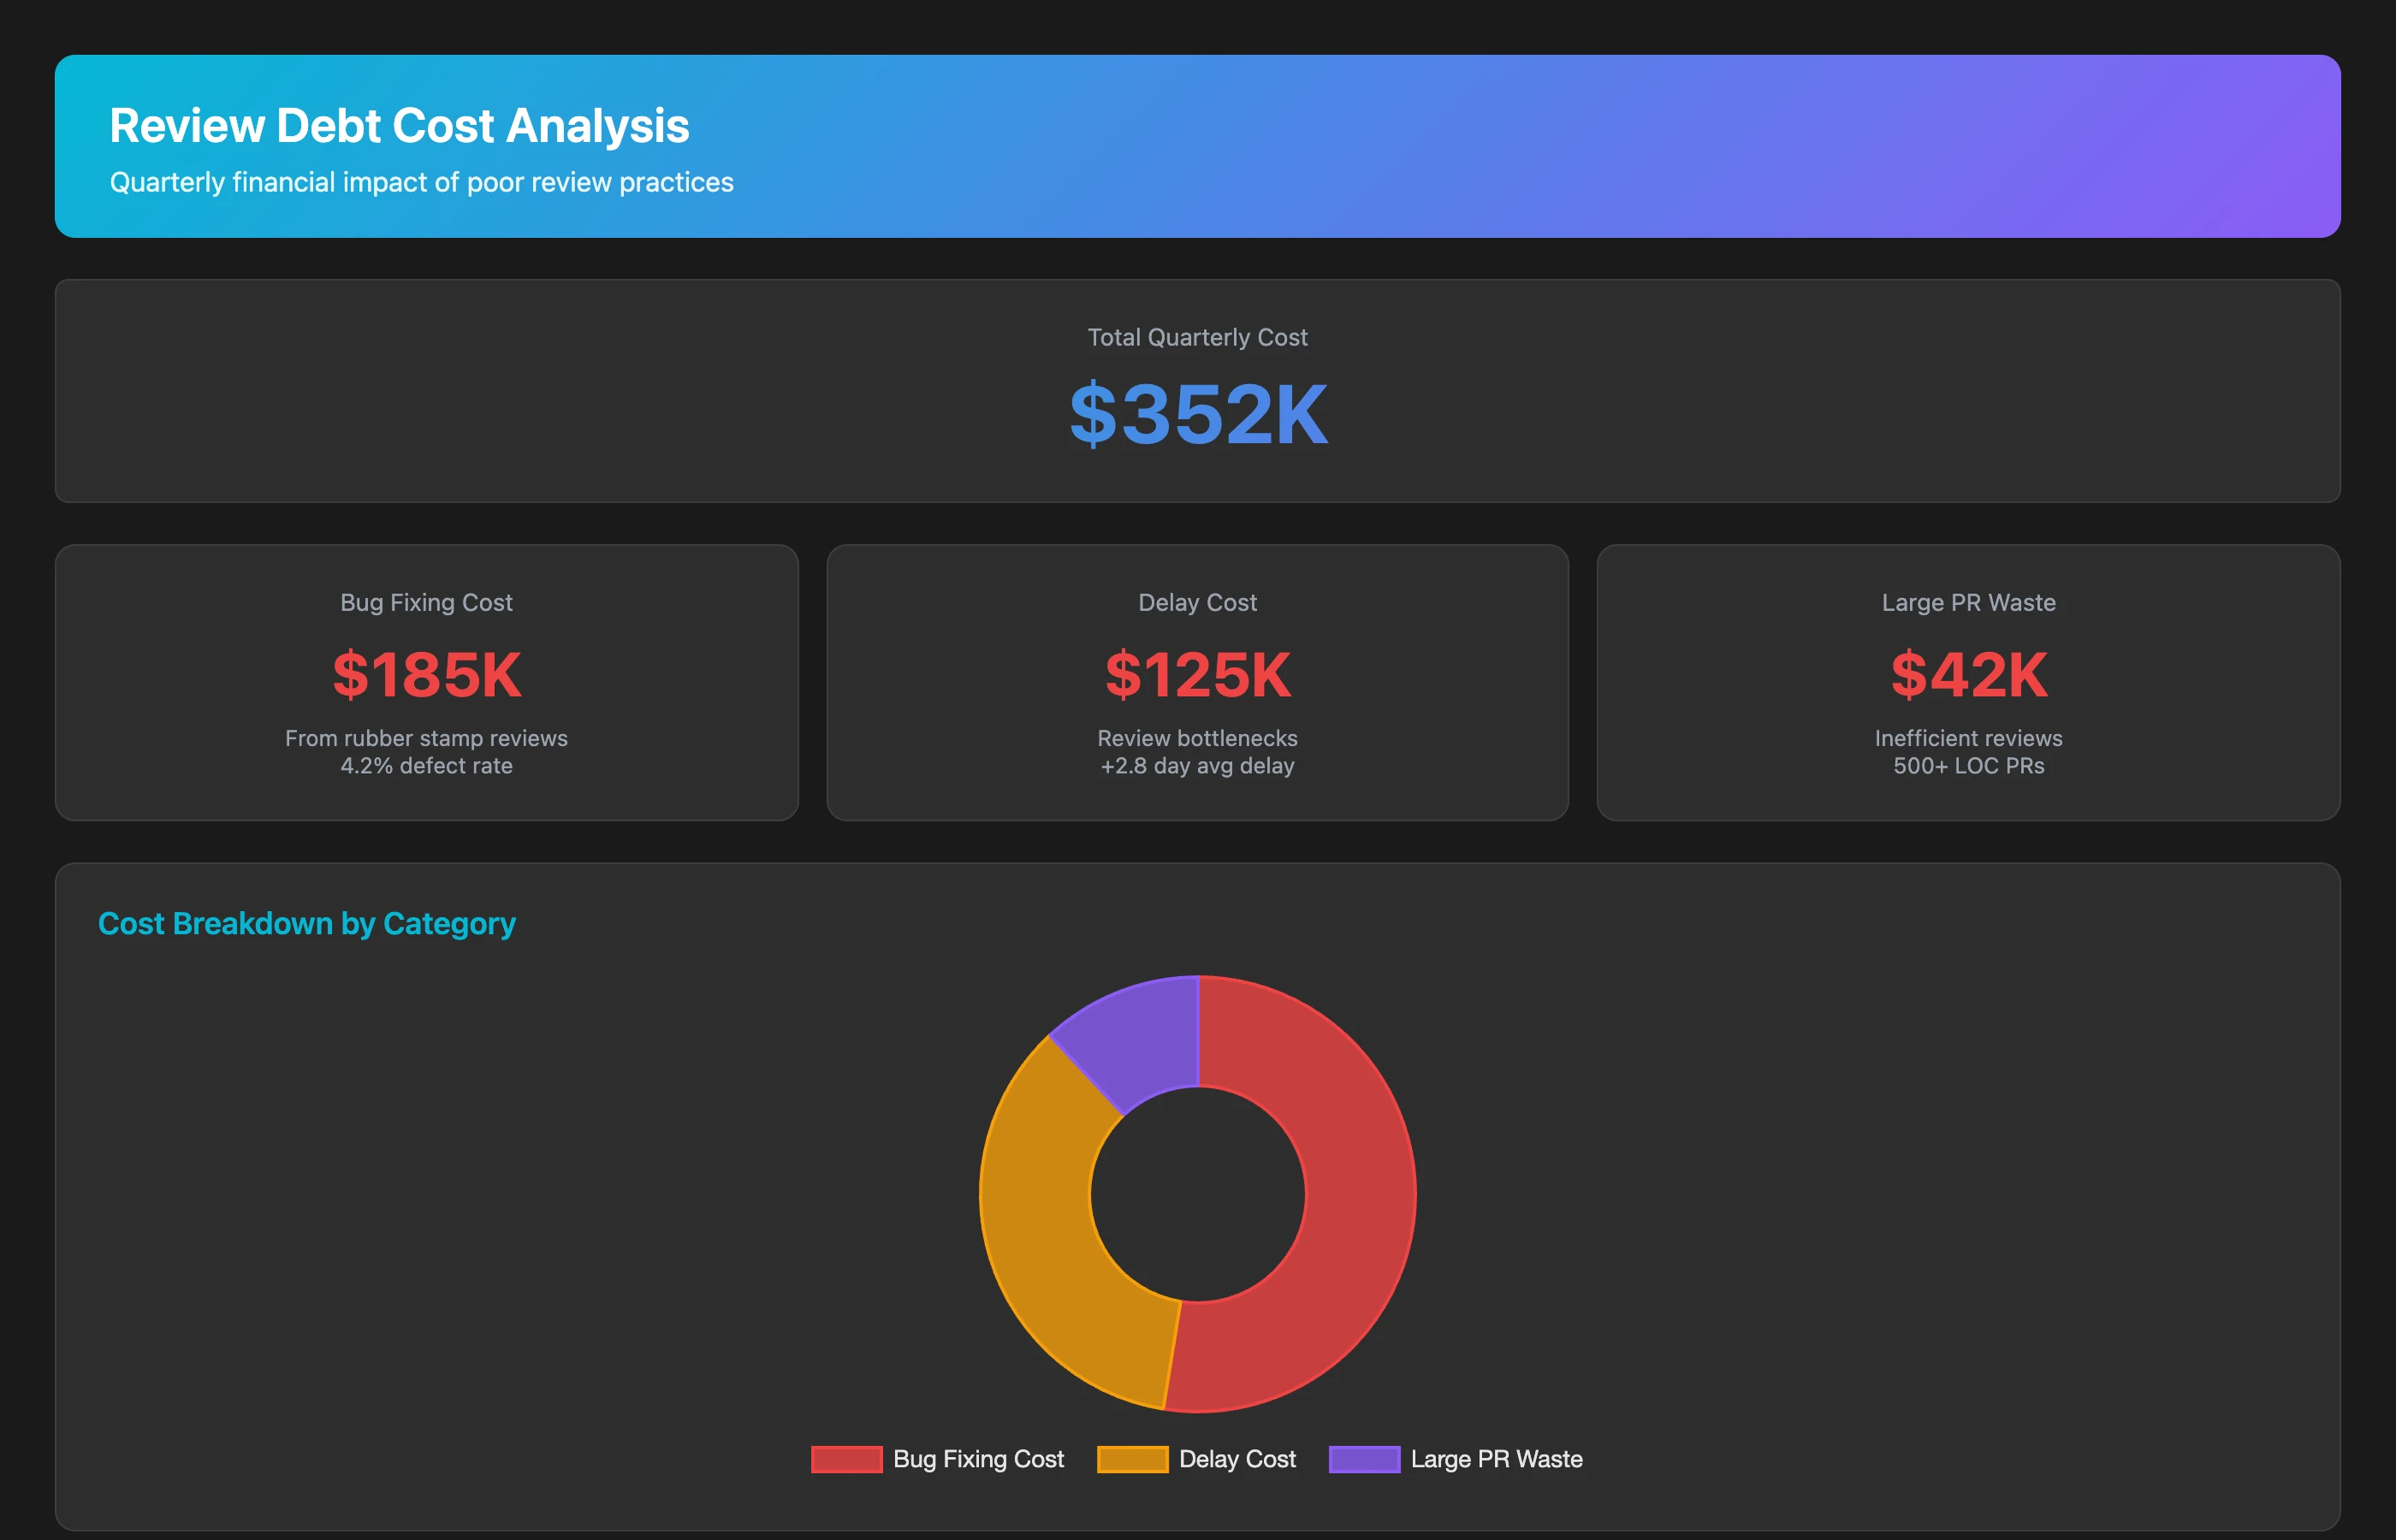
Measuring the Cost of Review Debt
Quantify the financial impact of poor review practices:
Calculate the cost of review debt for Q2 2026. Estimate: cost of rubber-stamp reviews that let bugs through (bug fix time × number of avoidable bugs × $125/hour), cost of review bottlenecks (cycle time delay × number of PRs affected × opportunity cost), and cost of large-PR review fatigue (time wasted on superficial review of PRs over 500 lines that should have been split). Show total quarterly cost and annual projection.
Review debt typically costs 10-15% of engineering capacity through a combination of bugs introduced, delays caused, and time wasted on ineffective reviews. For a 50-person engineering team, that's 5-7.5 FTE worth of productivity lost.
Quantifying Testing Debt: The CI/CD Confidence Crisis
Testing debt erodes confidence in your safety nets, leading teams to either over-test (slow pipelines) or under-test (production bugs). Let's identify and measure the patterns.
Detecting Flaky Tests
Flaky tests—tests that randomly fail without code changes—are the most toxic form of testing debt:
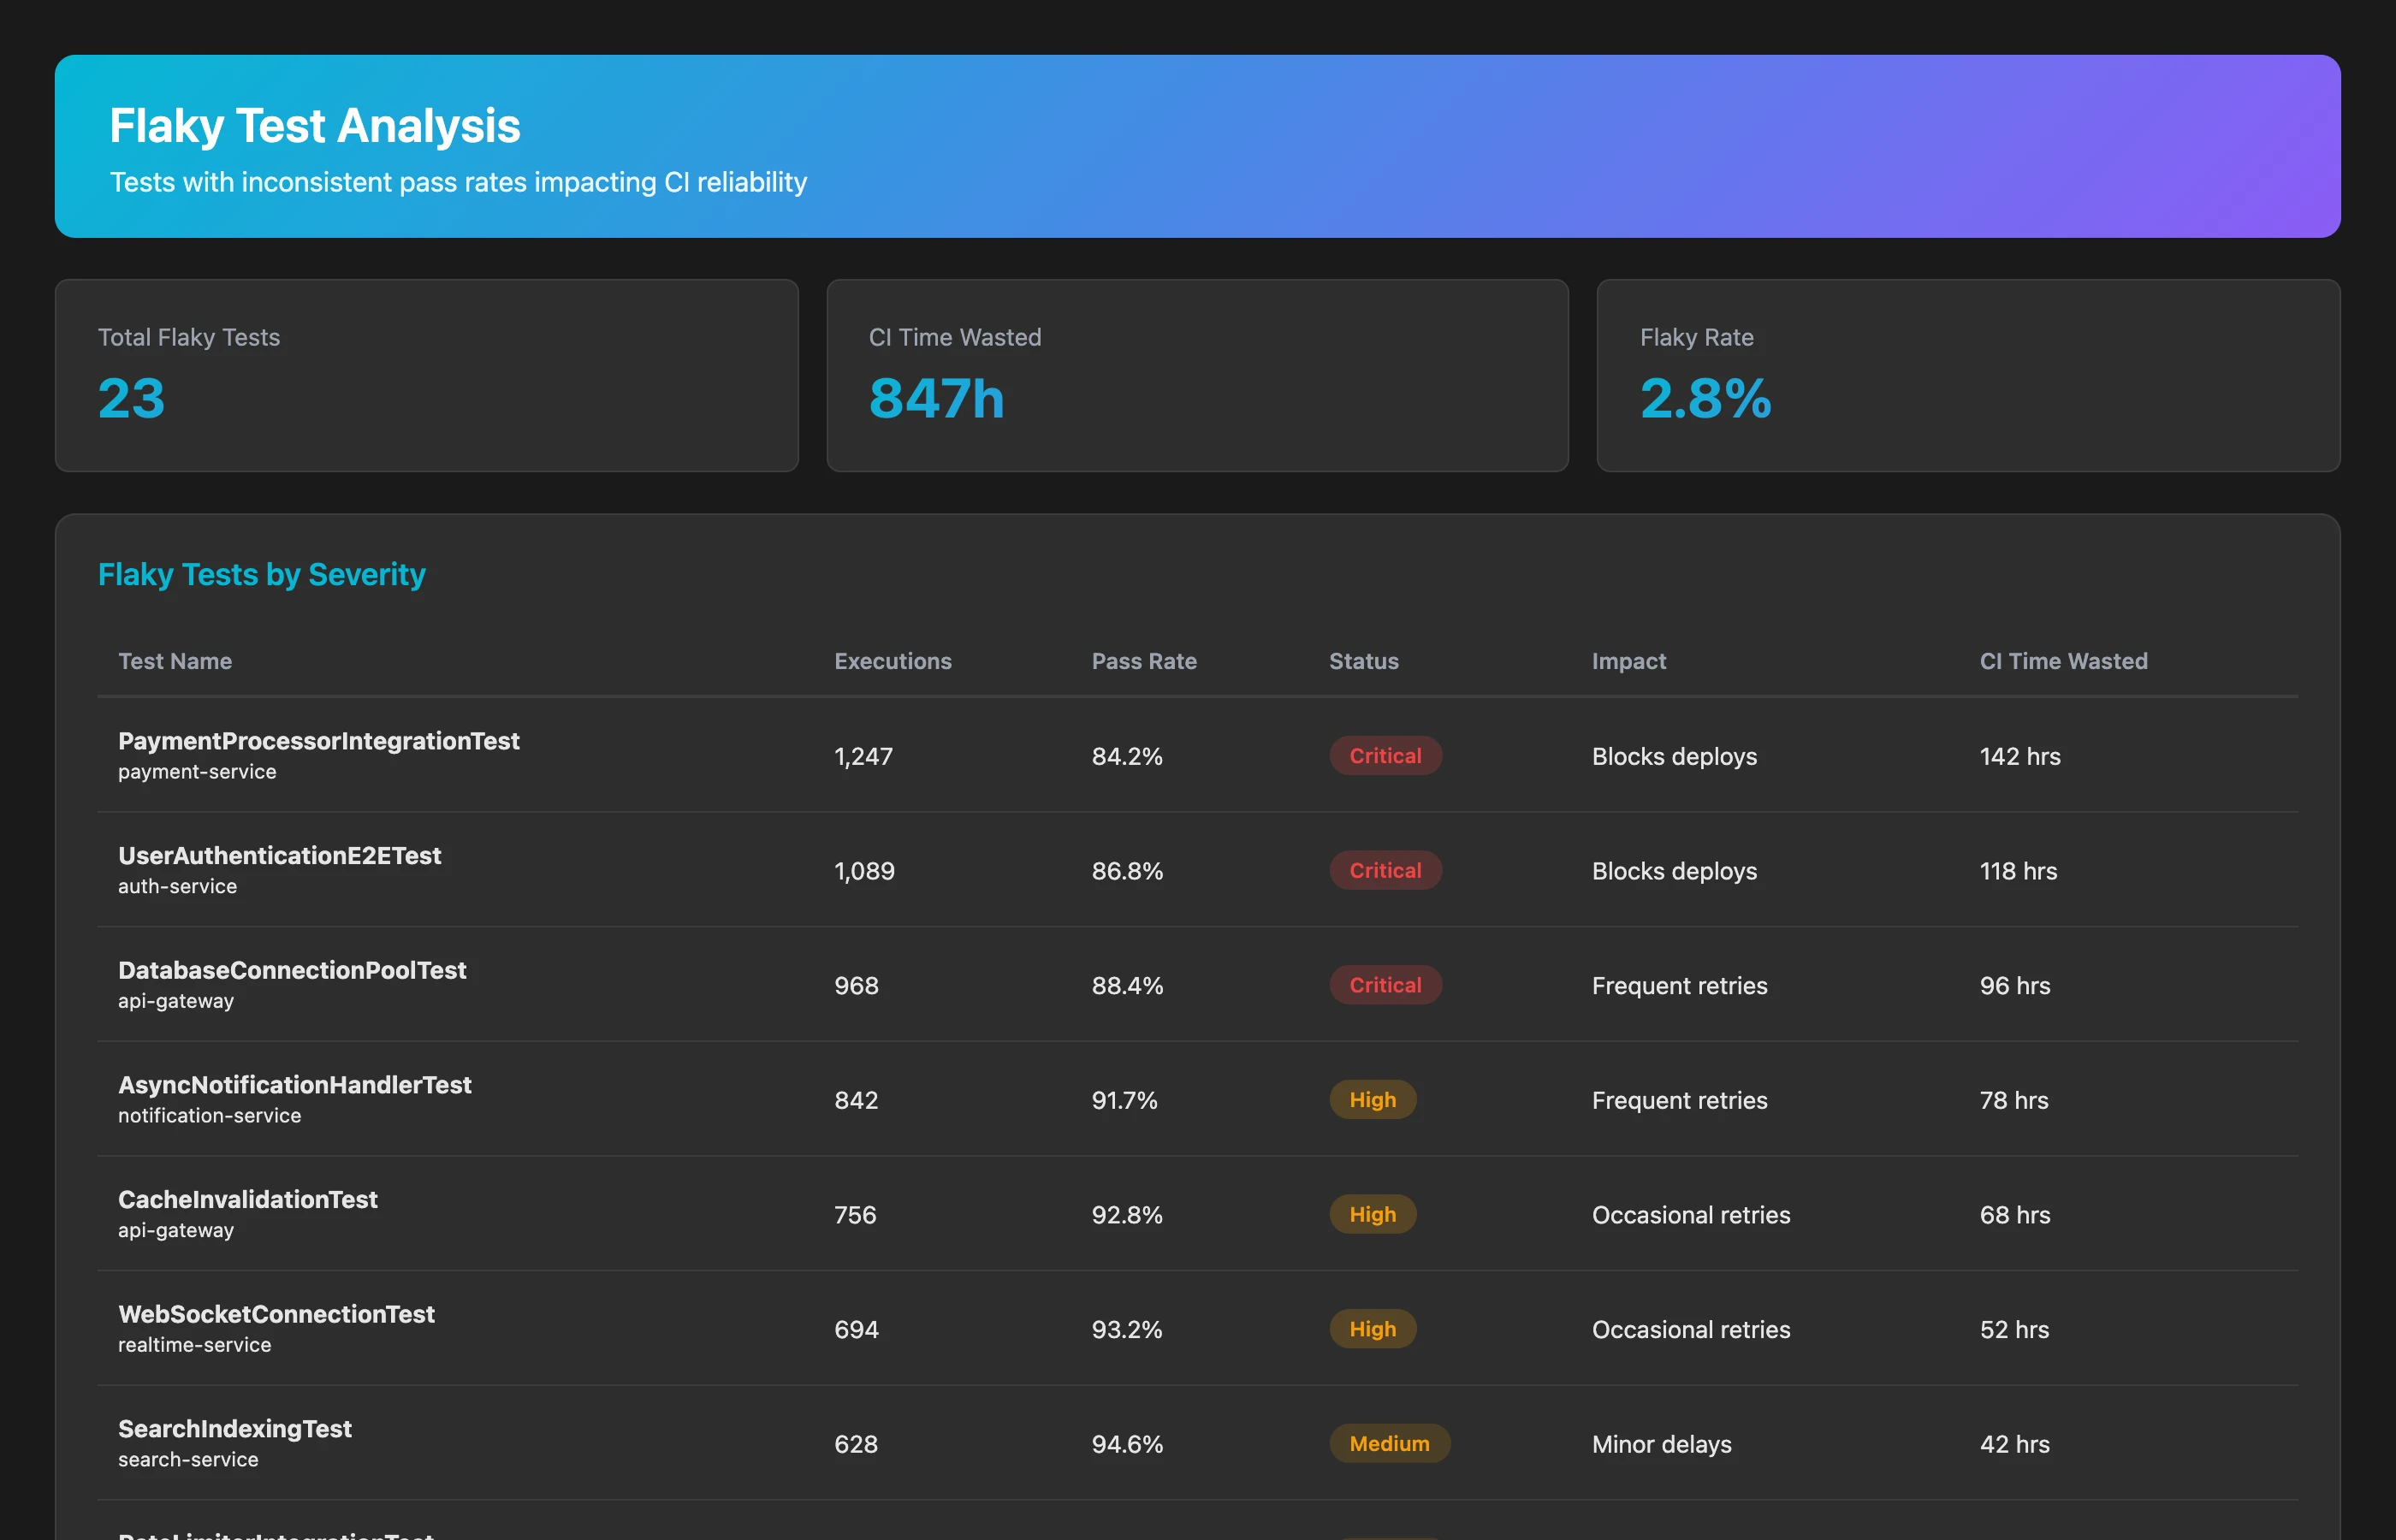
Identify flaky tests across all repositories for Q2 2026. For each test, analyze: number of executions, pass rate, whether failures correlate with code changes or appear random, time between failures, and impact (how many builds failed due to this test). Flag tests with pass rates between 90-99% (consistently flaky) and tests with pass rates under 90% (severely broken). Calculate the total CI/CD time wasted on flaky test re-runs.
The insidious impact of flaky tests:
- Each flaky test wastes 10-20 re-runs per week across all developers
- Flaky test rates over 2% cause teams to stop trusting CI entirely
- Developers start merging without waiting for CI, defeating the purpose of automated testing
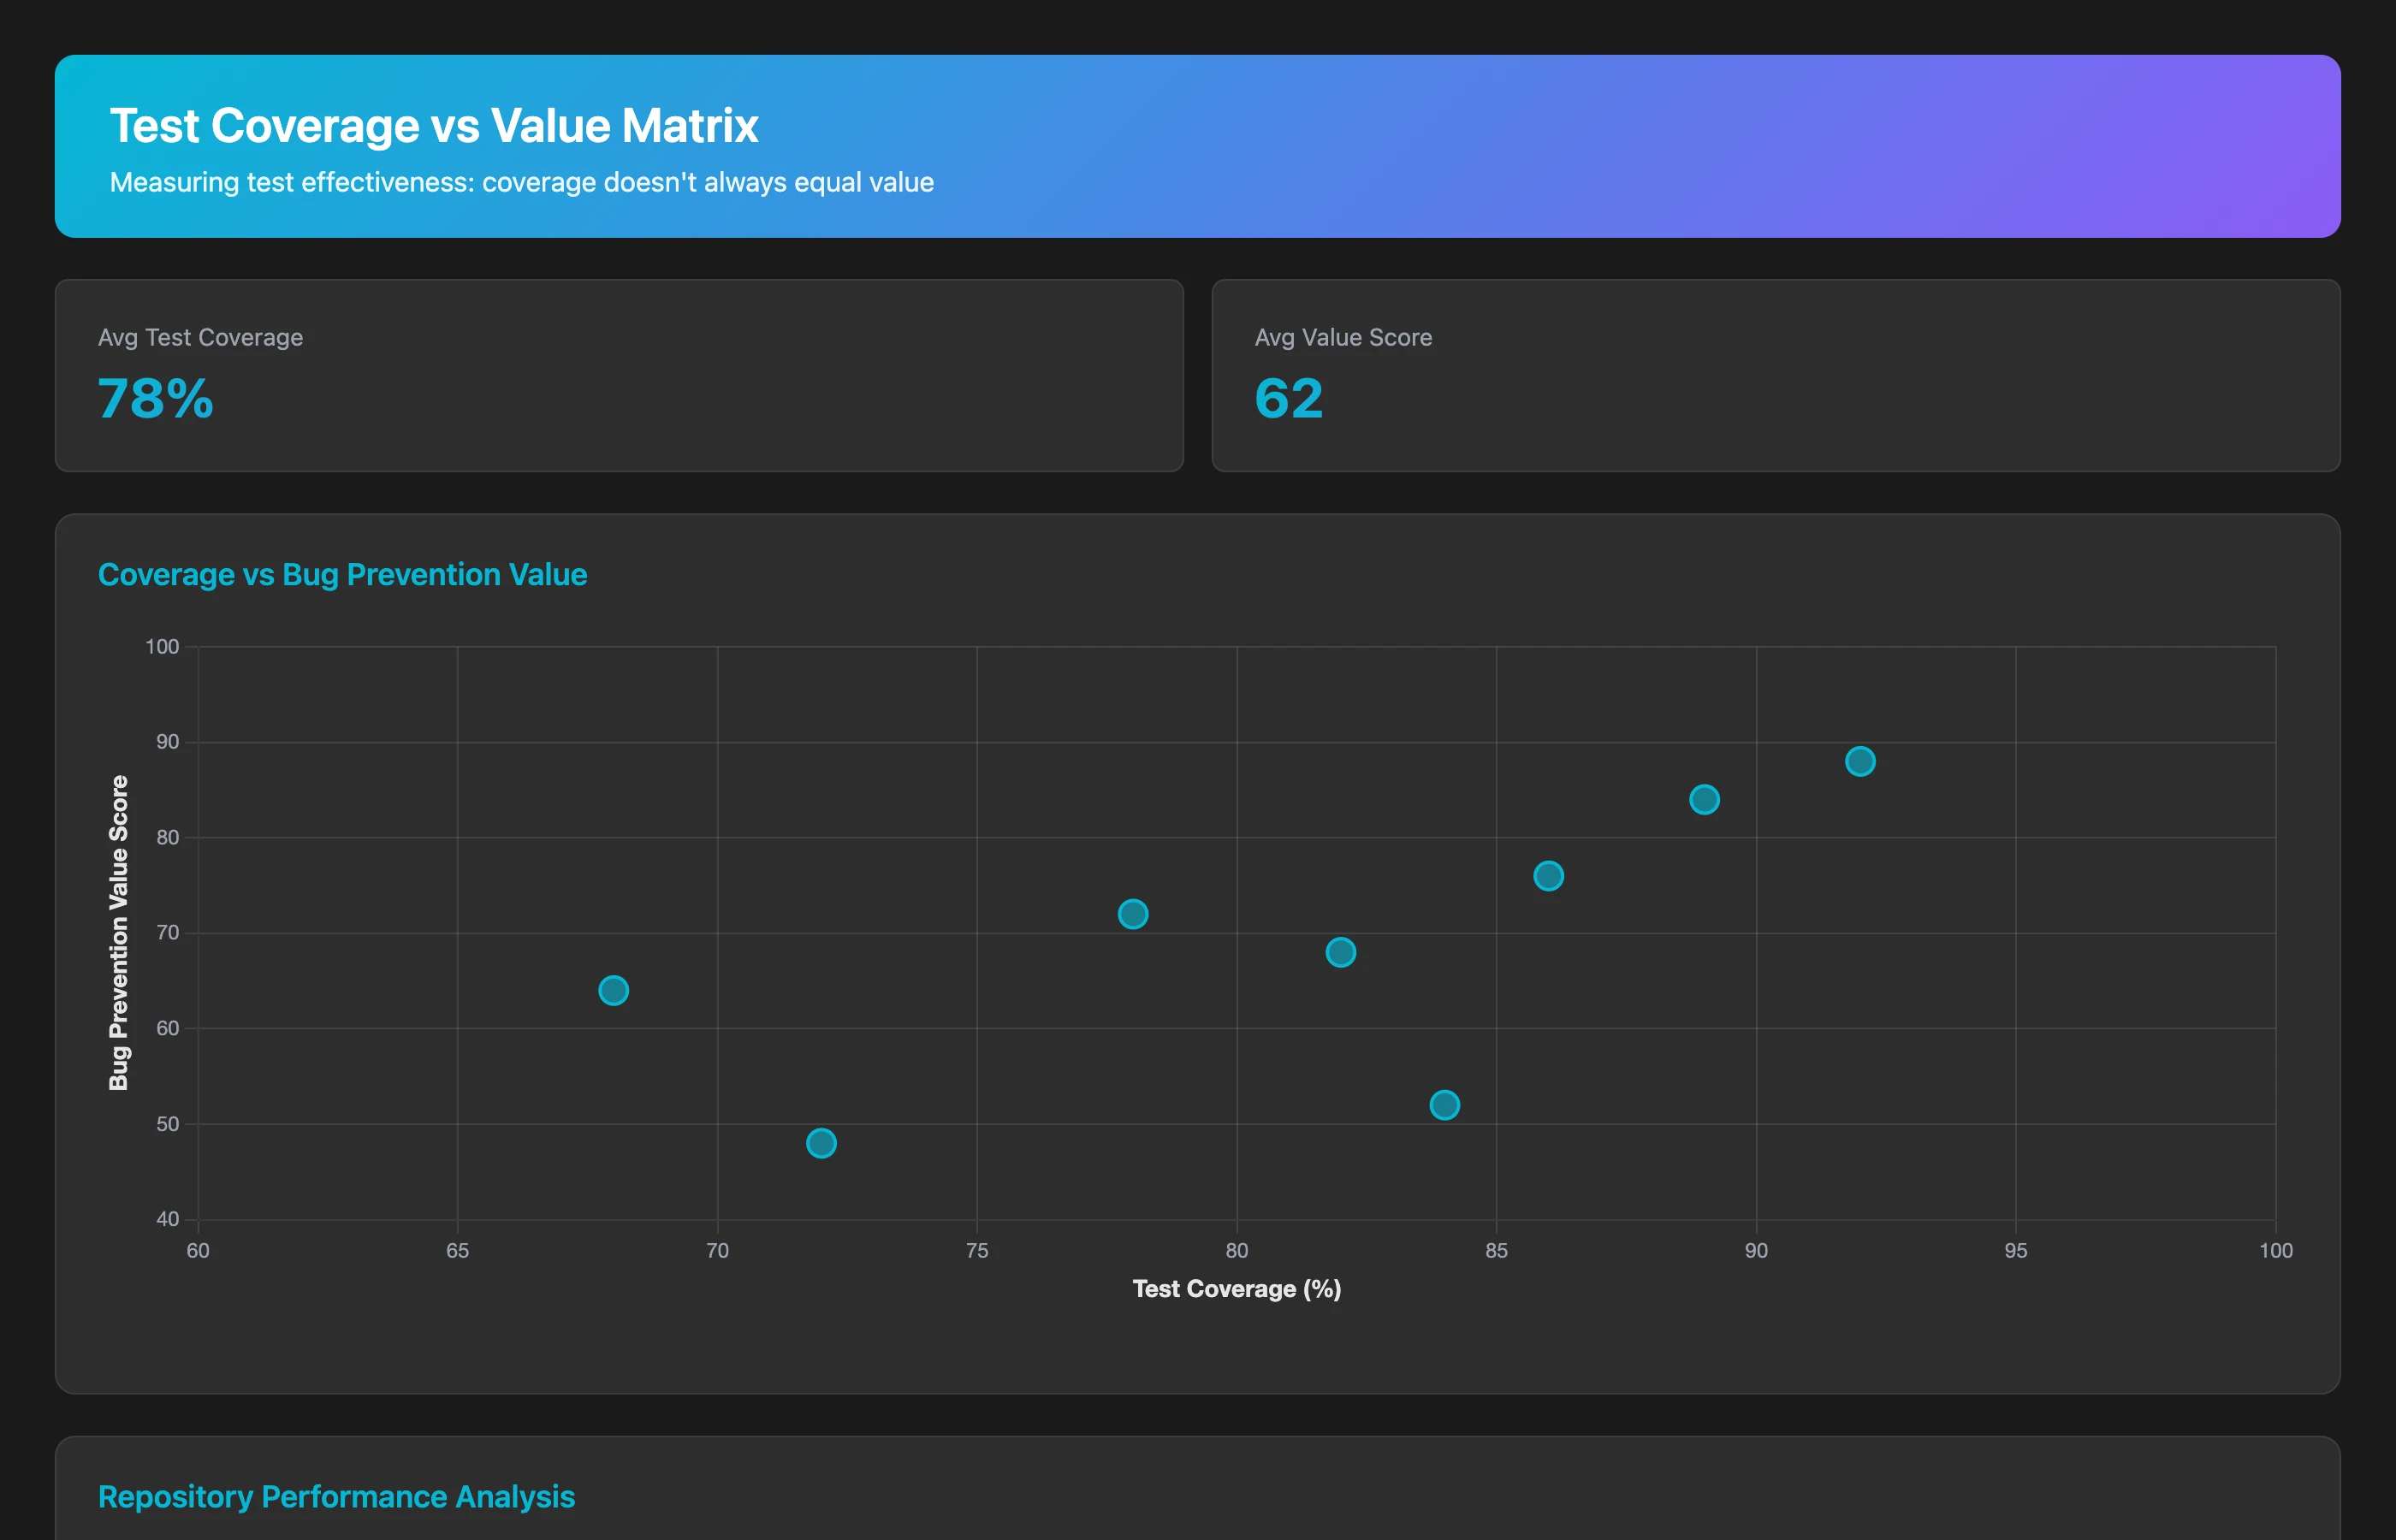
Analyzing Test Coverage vs. Test Value
Not all test coverage is created equal. Some tests provide genuine confidence; others just hit coverage targets:
Analyze test effectiveness for our top 10 repositories in Q2 2026. For each repository, show: test coverage percentage, number of tests, test execution time, and test value score (percentage of production bugs that tests would have caught, based on comparing tests to historical bug patterns). Identify repositories with high coverage but low value (tests that don't catch real issues) and low coverage but high value (small test suites that catch most bugs).
Testing debt isn't just "we need more tests"—it's "we have tests that don't catch the bugs that actually happen." This analysis reveals repositories where test suites are performative rather than protective.
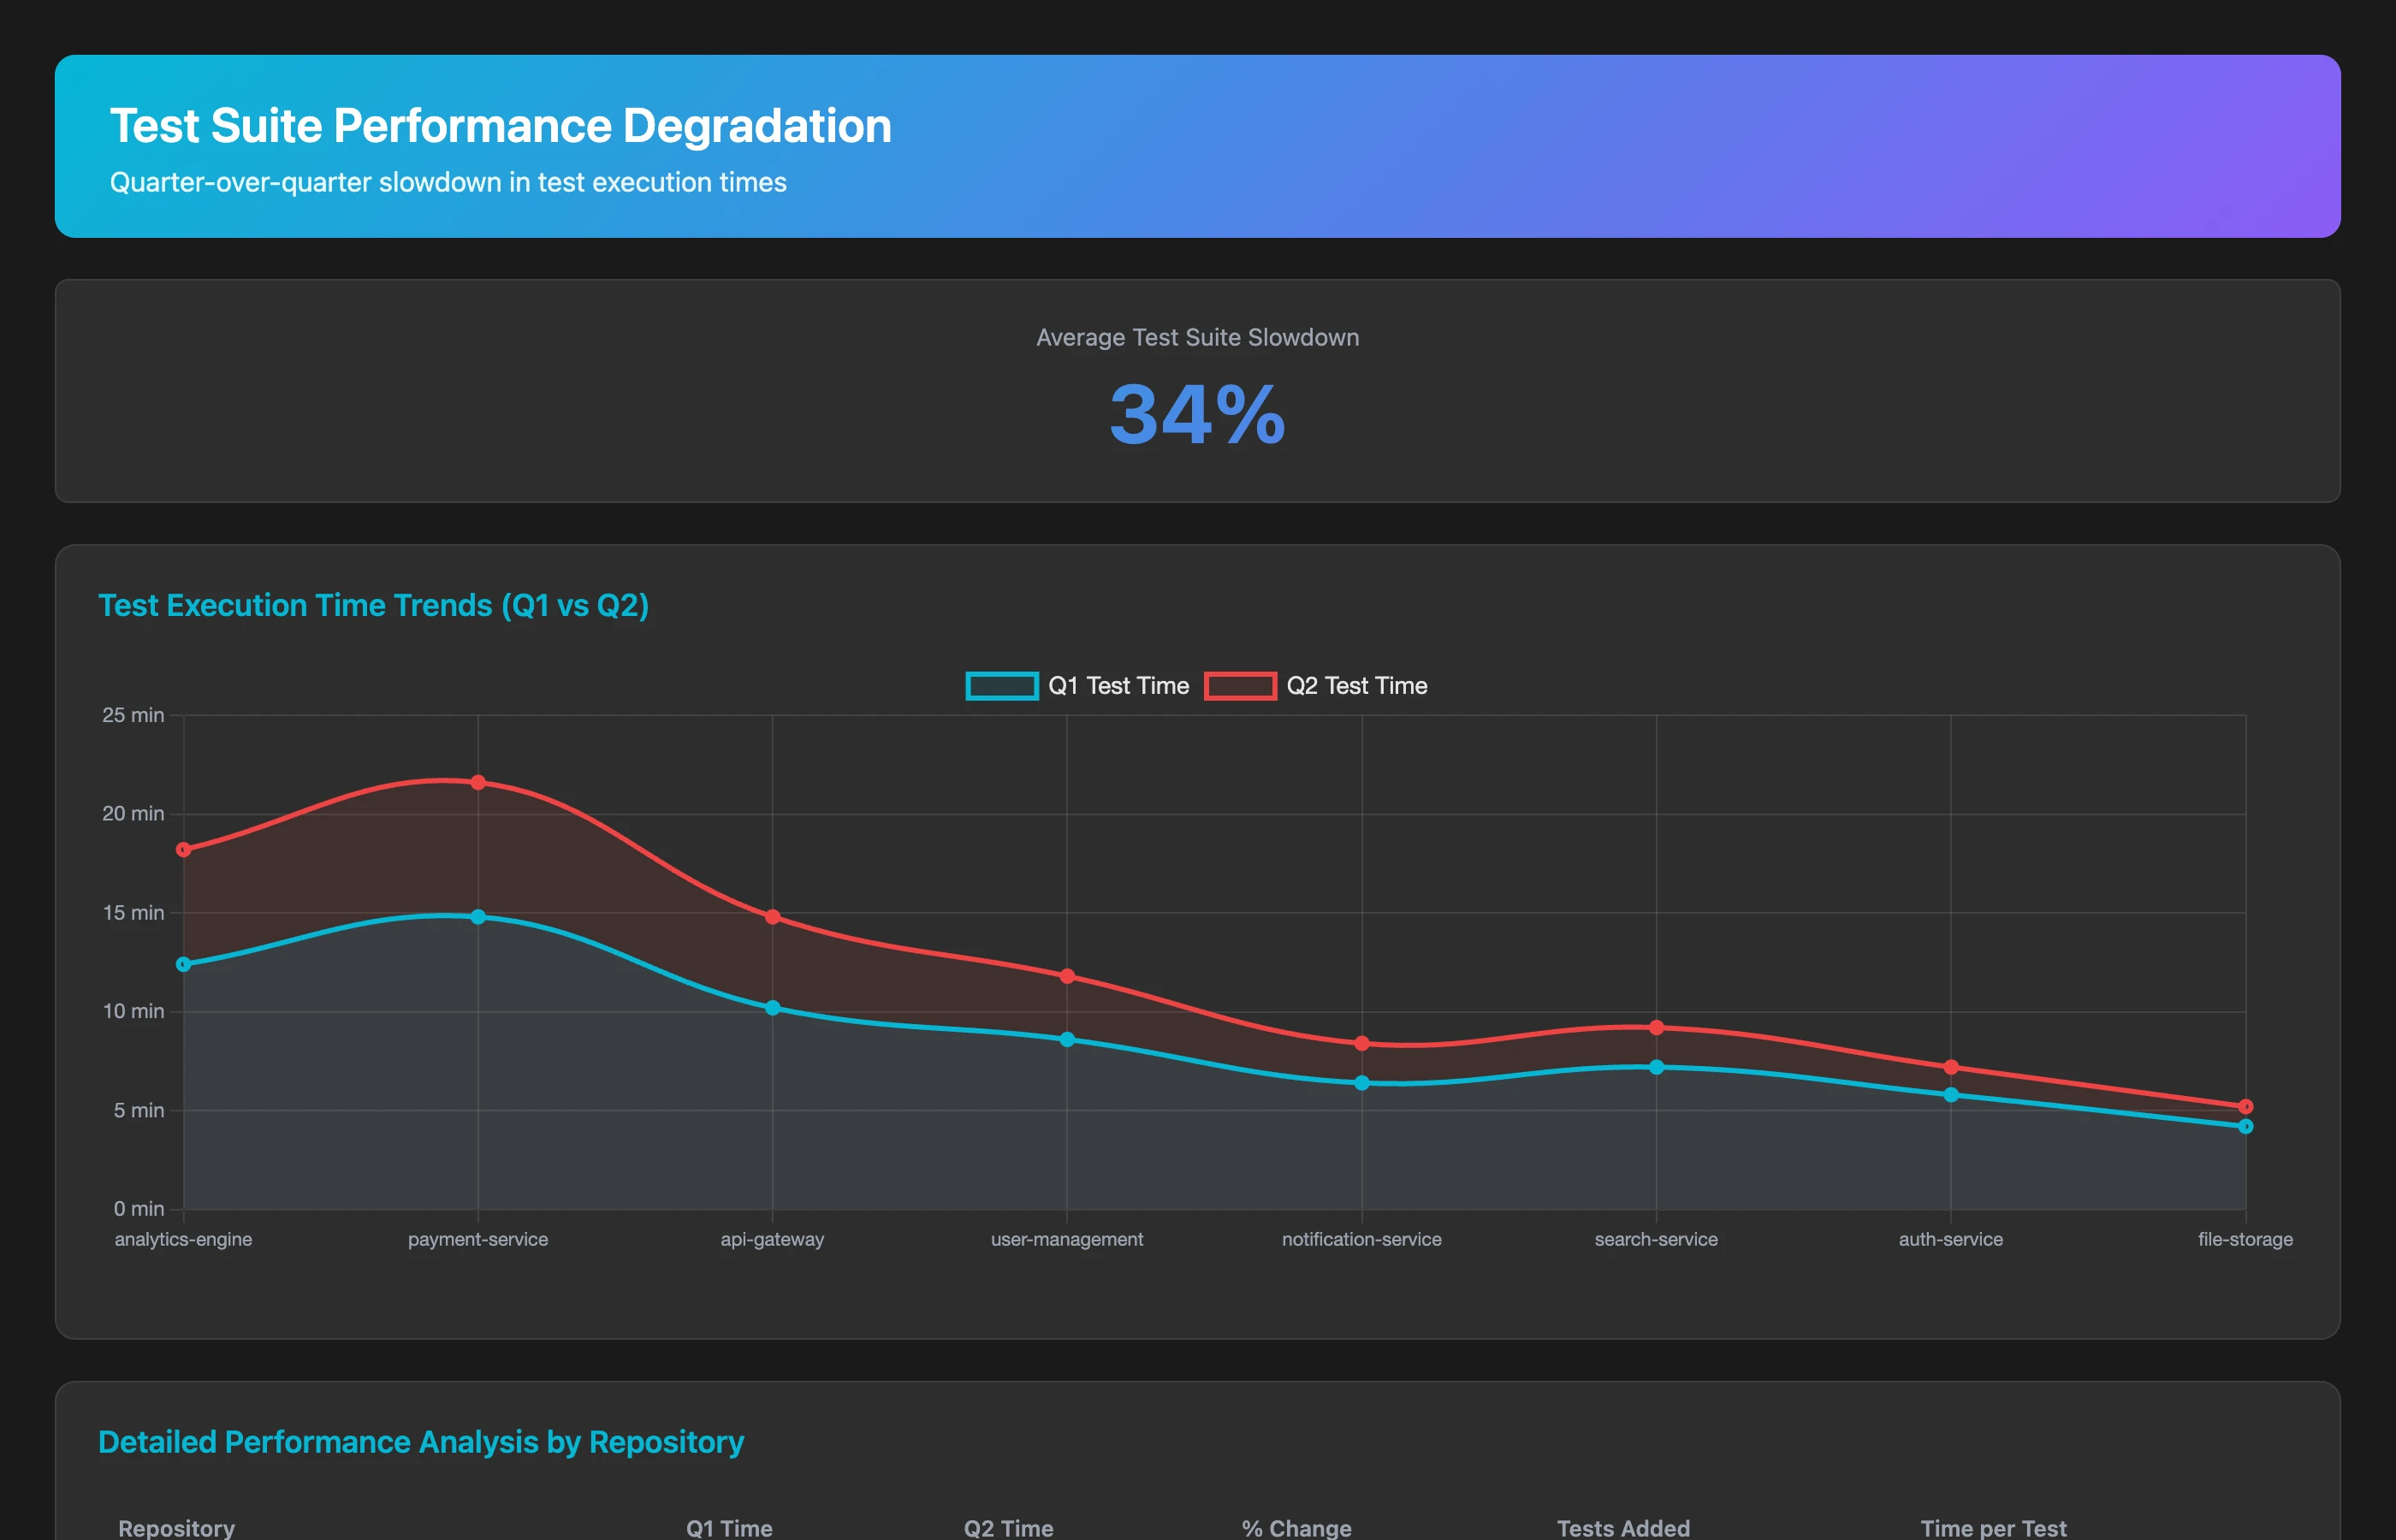
Test suites tend to slow down over time as tests accumulate without optimization:
Track test suite performance degradation over Q2 2026. For each repository, show: test execution time at start of quarter vs. end of quarter, number of tests added vs. removed, average test execution time per test, and trend analysis (is the suite getting slower faster than tests are being added?). Flag repositories where test time increased by more than 50% without corresponding test count increases, suggesting accumulating inefficiency.
Test suite slowdown is pure testing debt: teams wrote tests at reasonable speed, but didn't maintain them. Now a 5-minute test suite has become 45 minutes, discouraging developers from running tests locally.
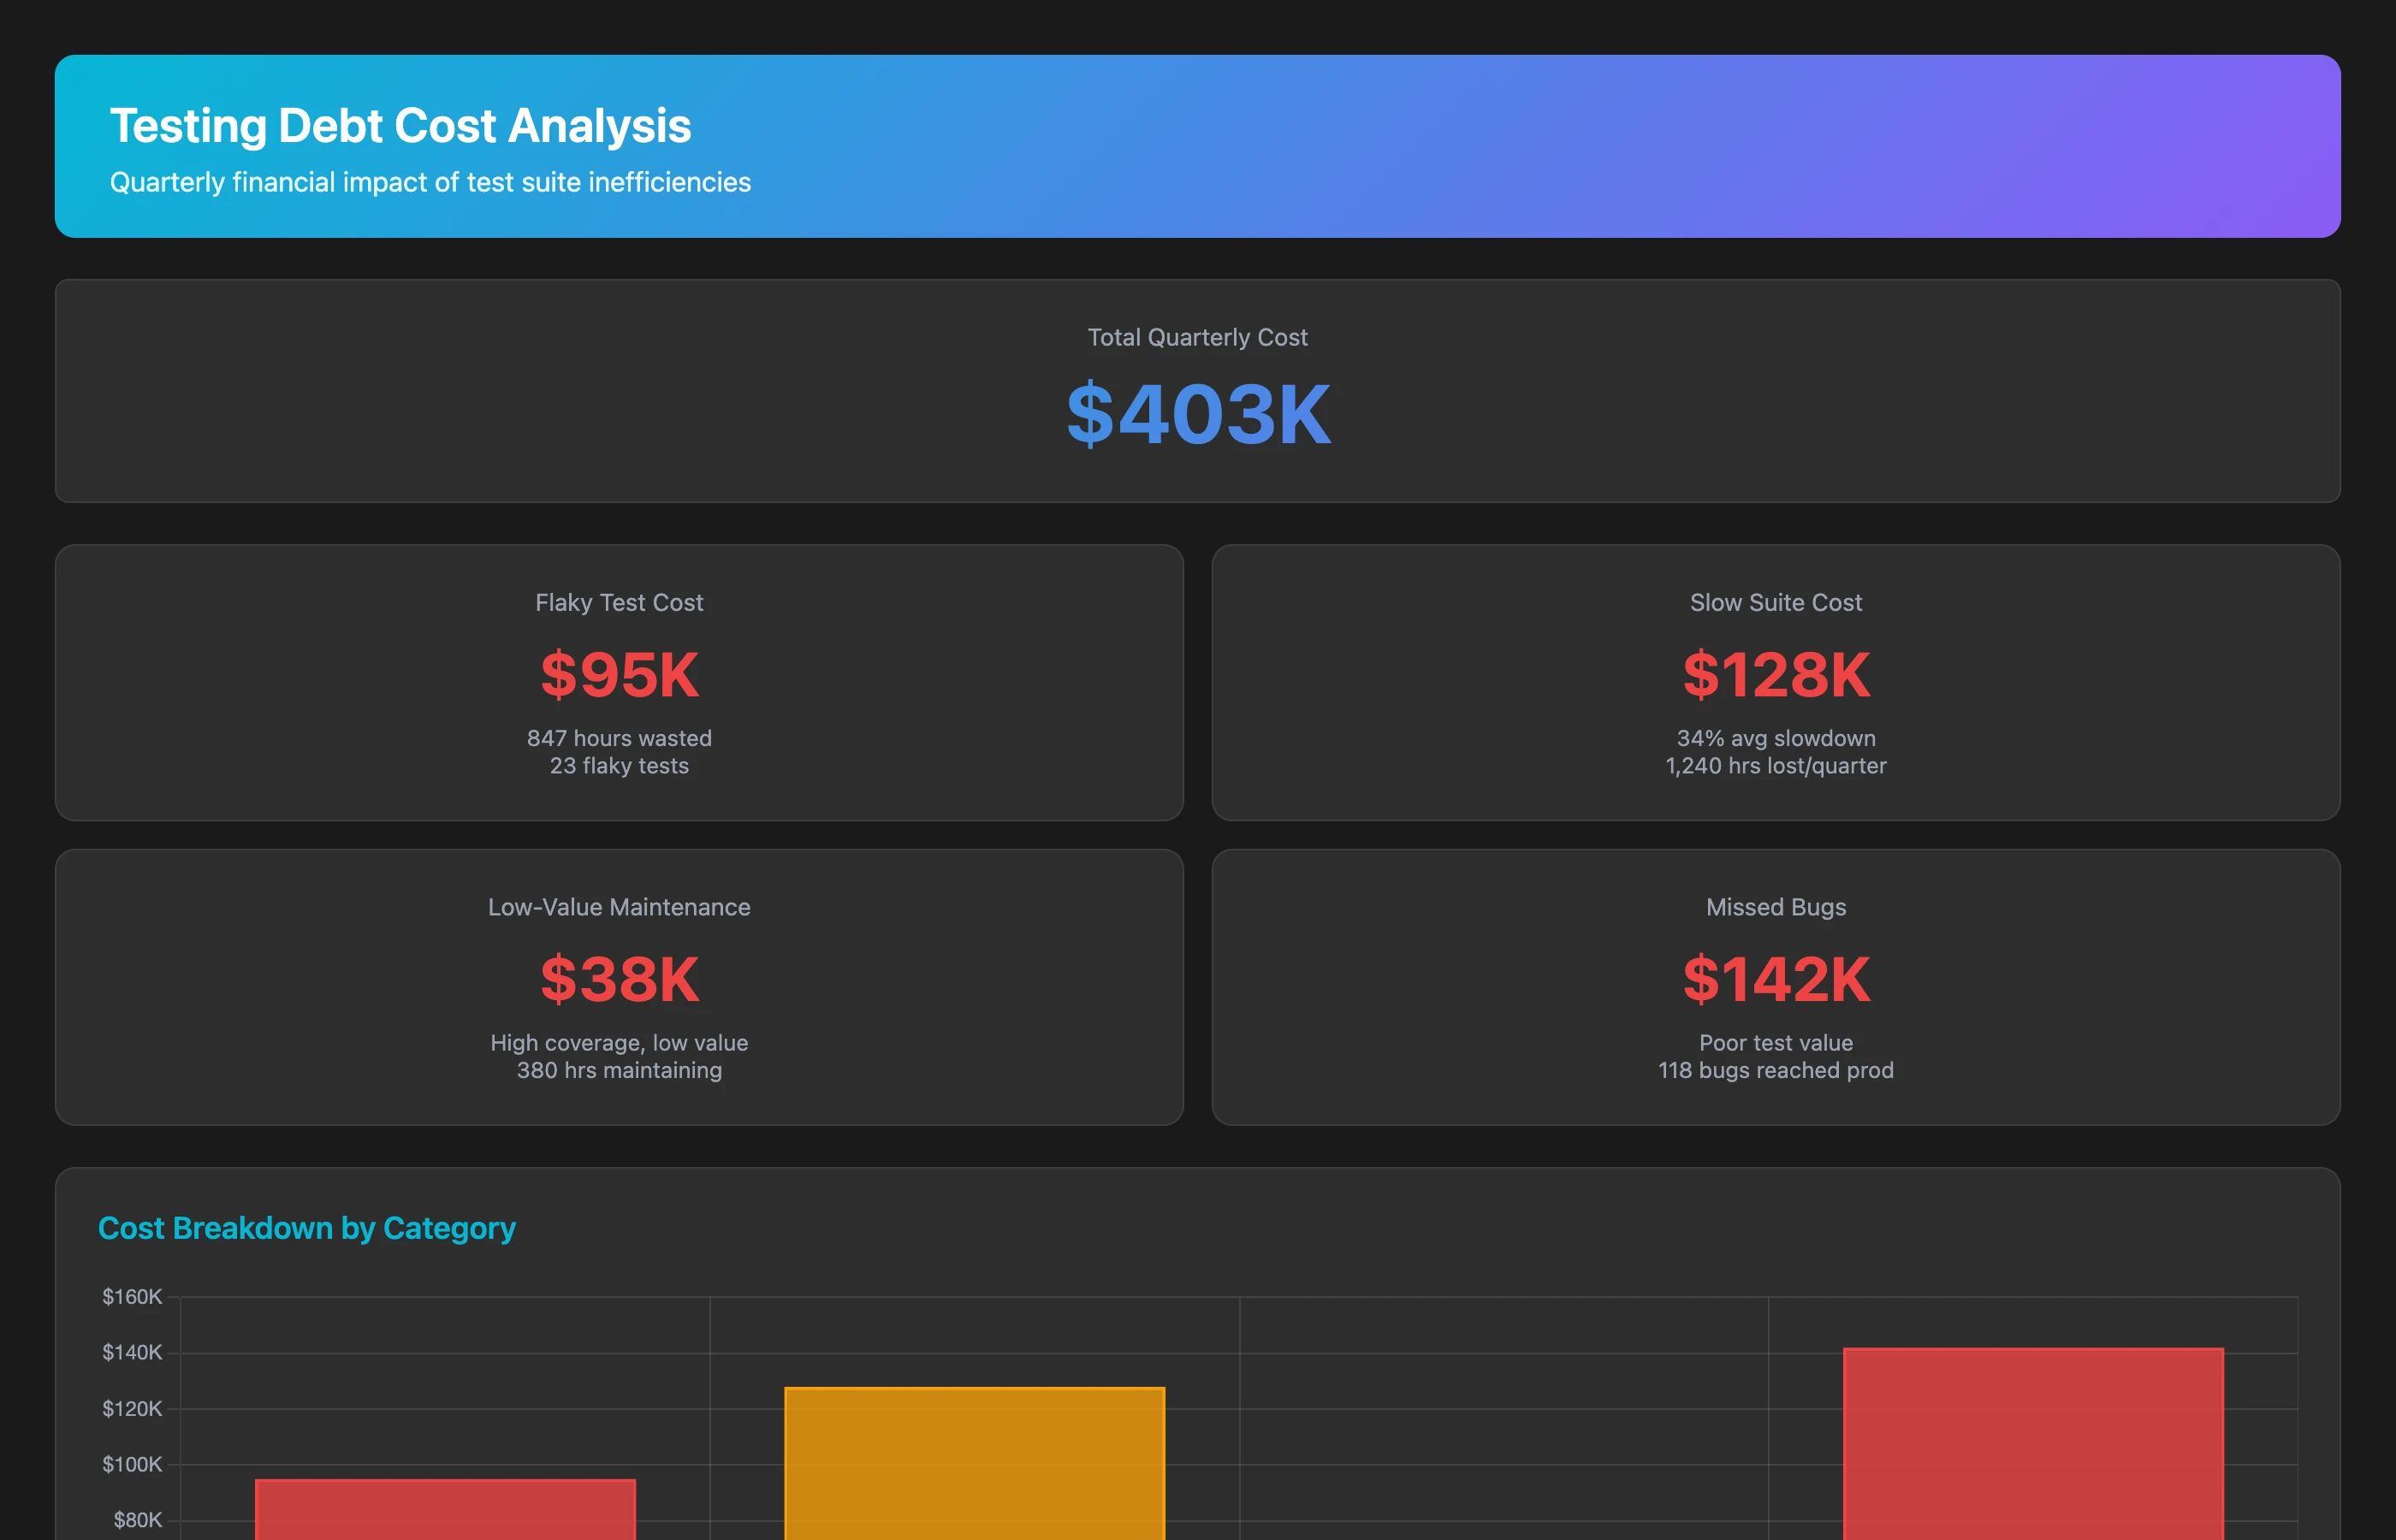
Calculating Testing Debt Cost
Quantify the impact of testing debt on velocity and quality:
Calculate the cost of testing debt for Q2 2026. Estimate: cost of flaky tests (time spent re-running failed builds × number of engineers affected × $125/hour), cost of slow test suites (time waiting for tests beyond industry benchmark × number of builds × $125/hour), cost of low-value tests (test maintenance time with no bug prevention benefit), and cost of production bugs that tests should have caught. Show total quarterly cost and annual projection.
Testing debt typically costs 8-12% of engineering capacity through slow test suites, flaky test re-runs, and low-value test maintenance. For a 50-person team, that's 4-6 FTE lost to testing inefficiency.
Exposing Documentation Debt: The Knowledge That Doesn't Exist
Documentation debt is the hardest to measure because the absence of documentation doesn't trigger alerts. But its impact is massive, especially as teams scale.
Measuring Onboarding Time as Documentation Proxy
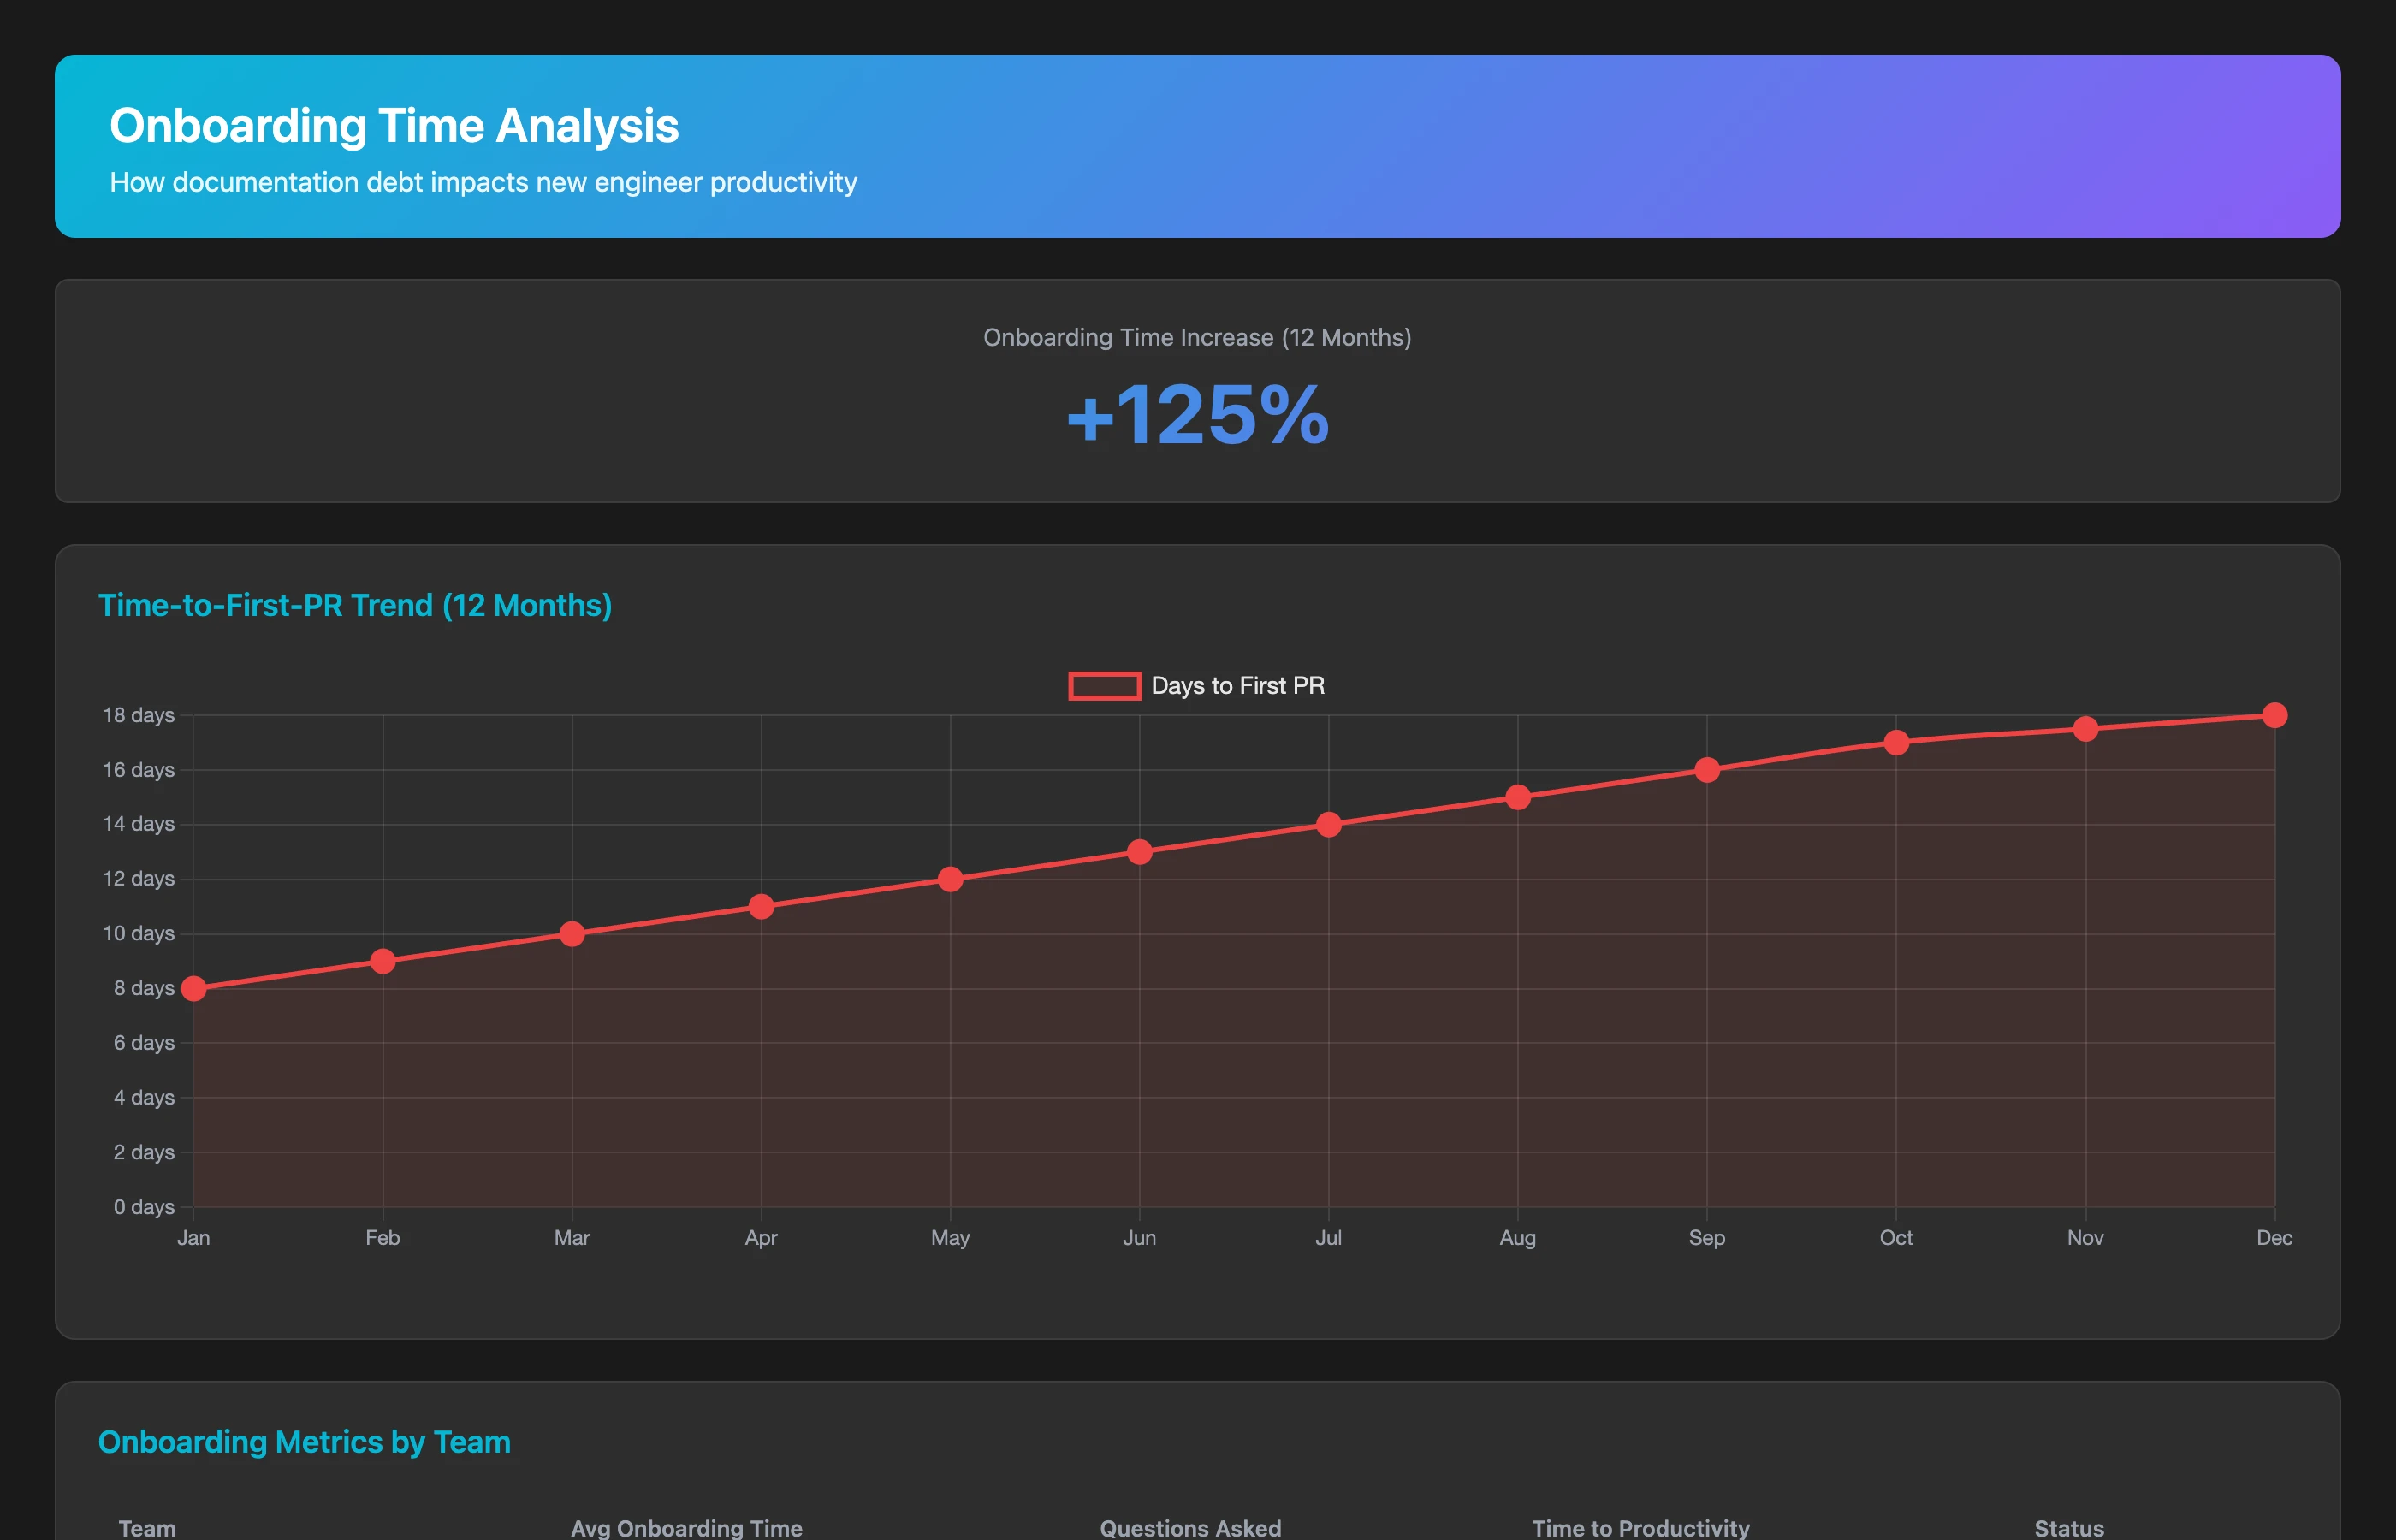
New engineer ramp-up time is a strong proxy for documentation quality:
Analyze new engineer onboarding efficiency for the last 12 months. For each engineer who joined, calculate: time to first PR merged, time to first non-trivial feature (PR over 200 lines), number of questions asked in #engineering-help channel during first month, and comparison to team average. Show the trend over time (is onboarding getting faster or slower?) and identify teams with the longest onboarding times, indicating documentation debt.
Onboarding times increasing over time signal accumulating documentation debt. As the codebase grows more complex, documentation doesn't keep pace, forcing new engineers to reverse-engineer everything.
Identifying Undocumented System Components
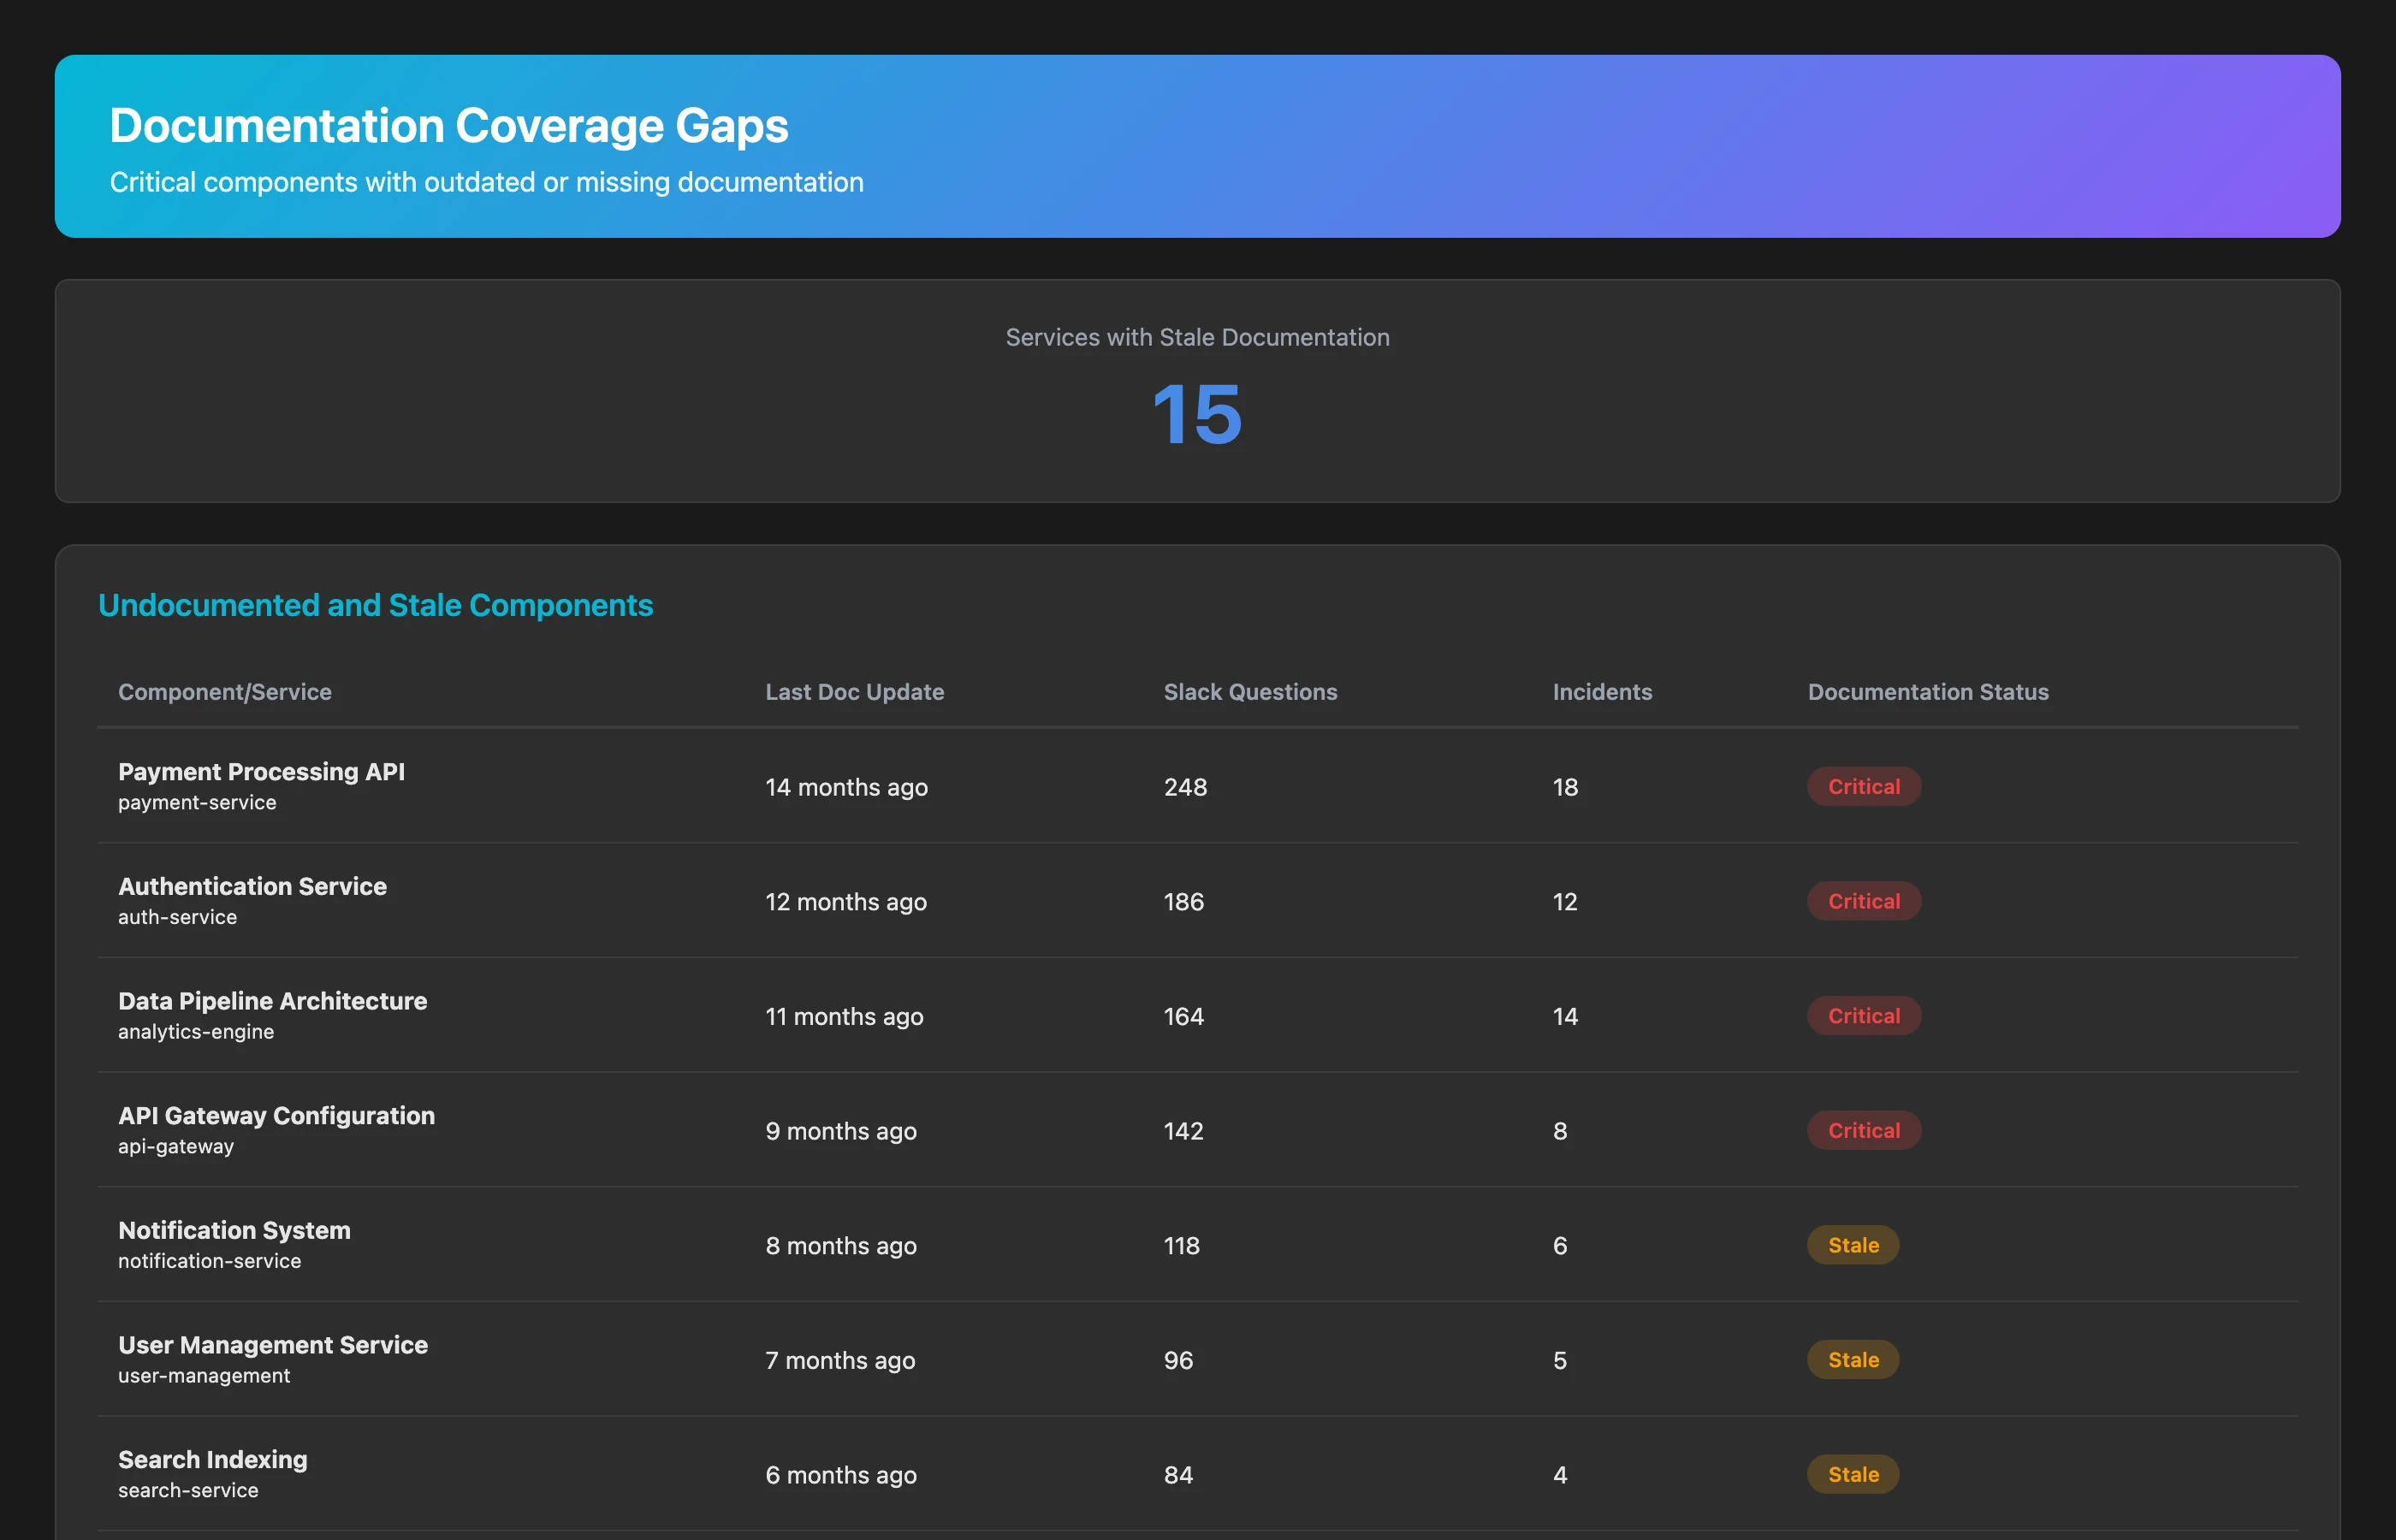
Some parts of the system have decent documentation; others have none. Let's find the gaps:
Analyze documentation coverage across our system architecture. For each major repository and service, check: when documentation was last updated (based on README and /docs folder commits), number of "how does X work?" questions in Slack related to this component, and incident frequency (services with more incidents often lack troubleshooting documentation). Flag components where documentation is over 6 months old or where incident response time suggests responders are reverse-engineering solutions each time.
Undocumented components create hidden taxes:
- Every incident takes longer because responders start from zero knowledge
- Every feature touching that component takes longer as engineers figure out how it works
- Knowledge silos form where only 1-2 people understand critical systems
Correlating Documentation Freshness with Developer Productivity
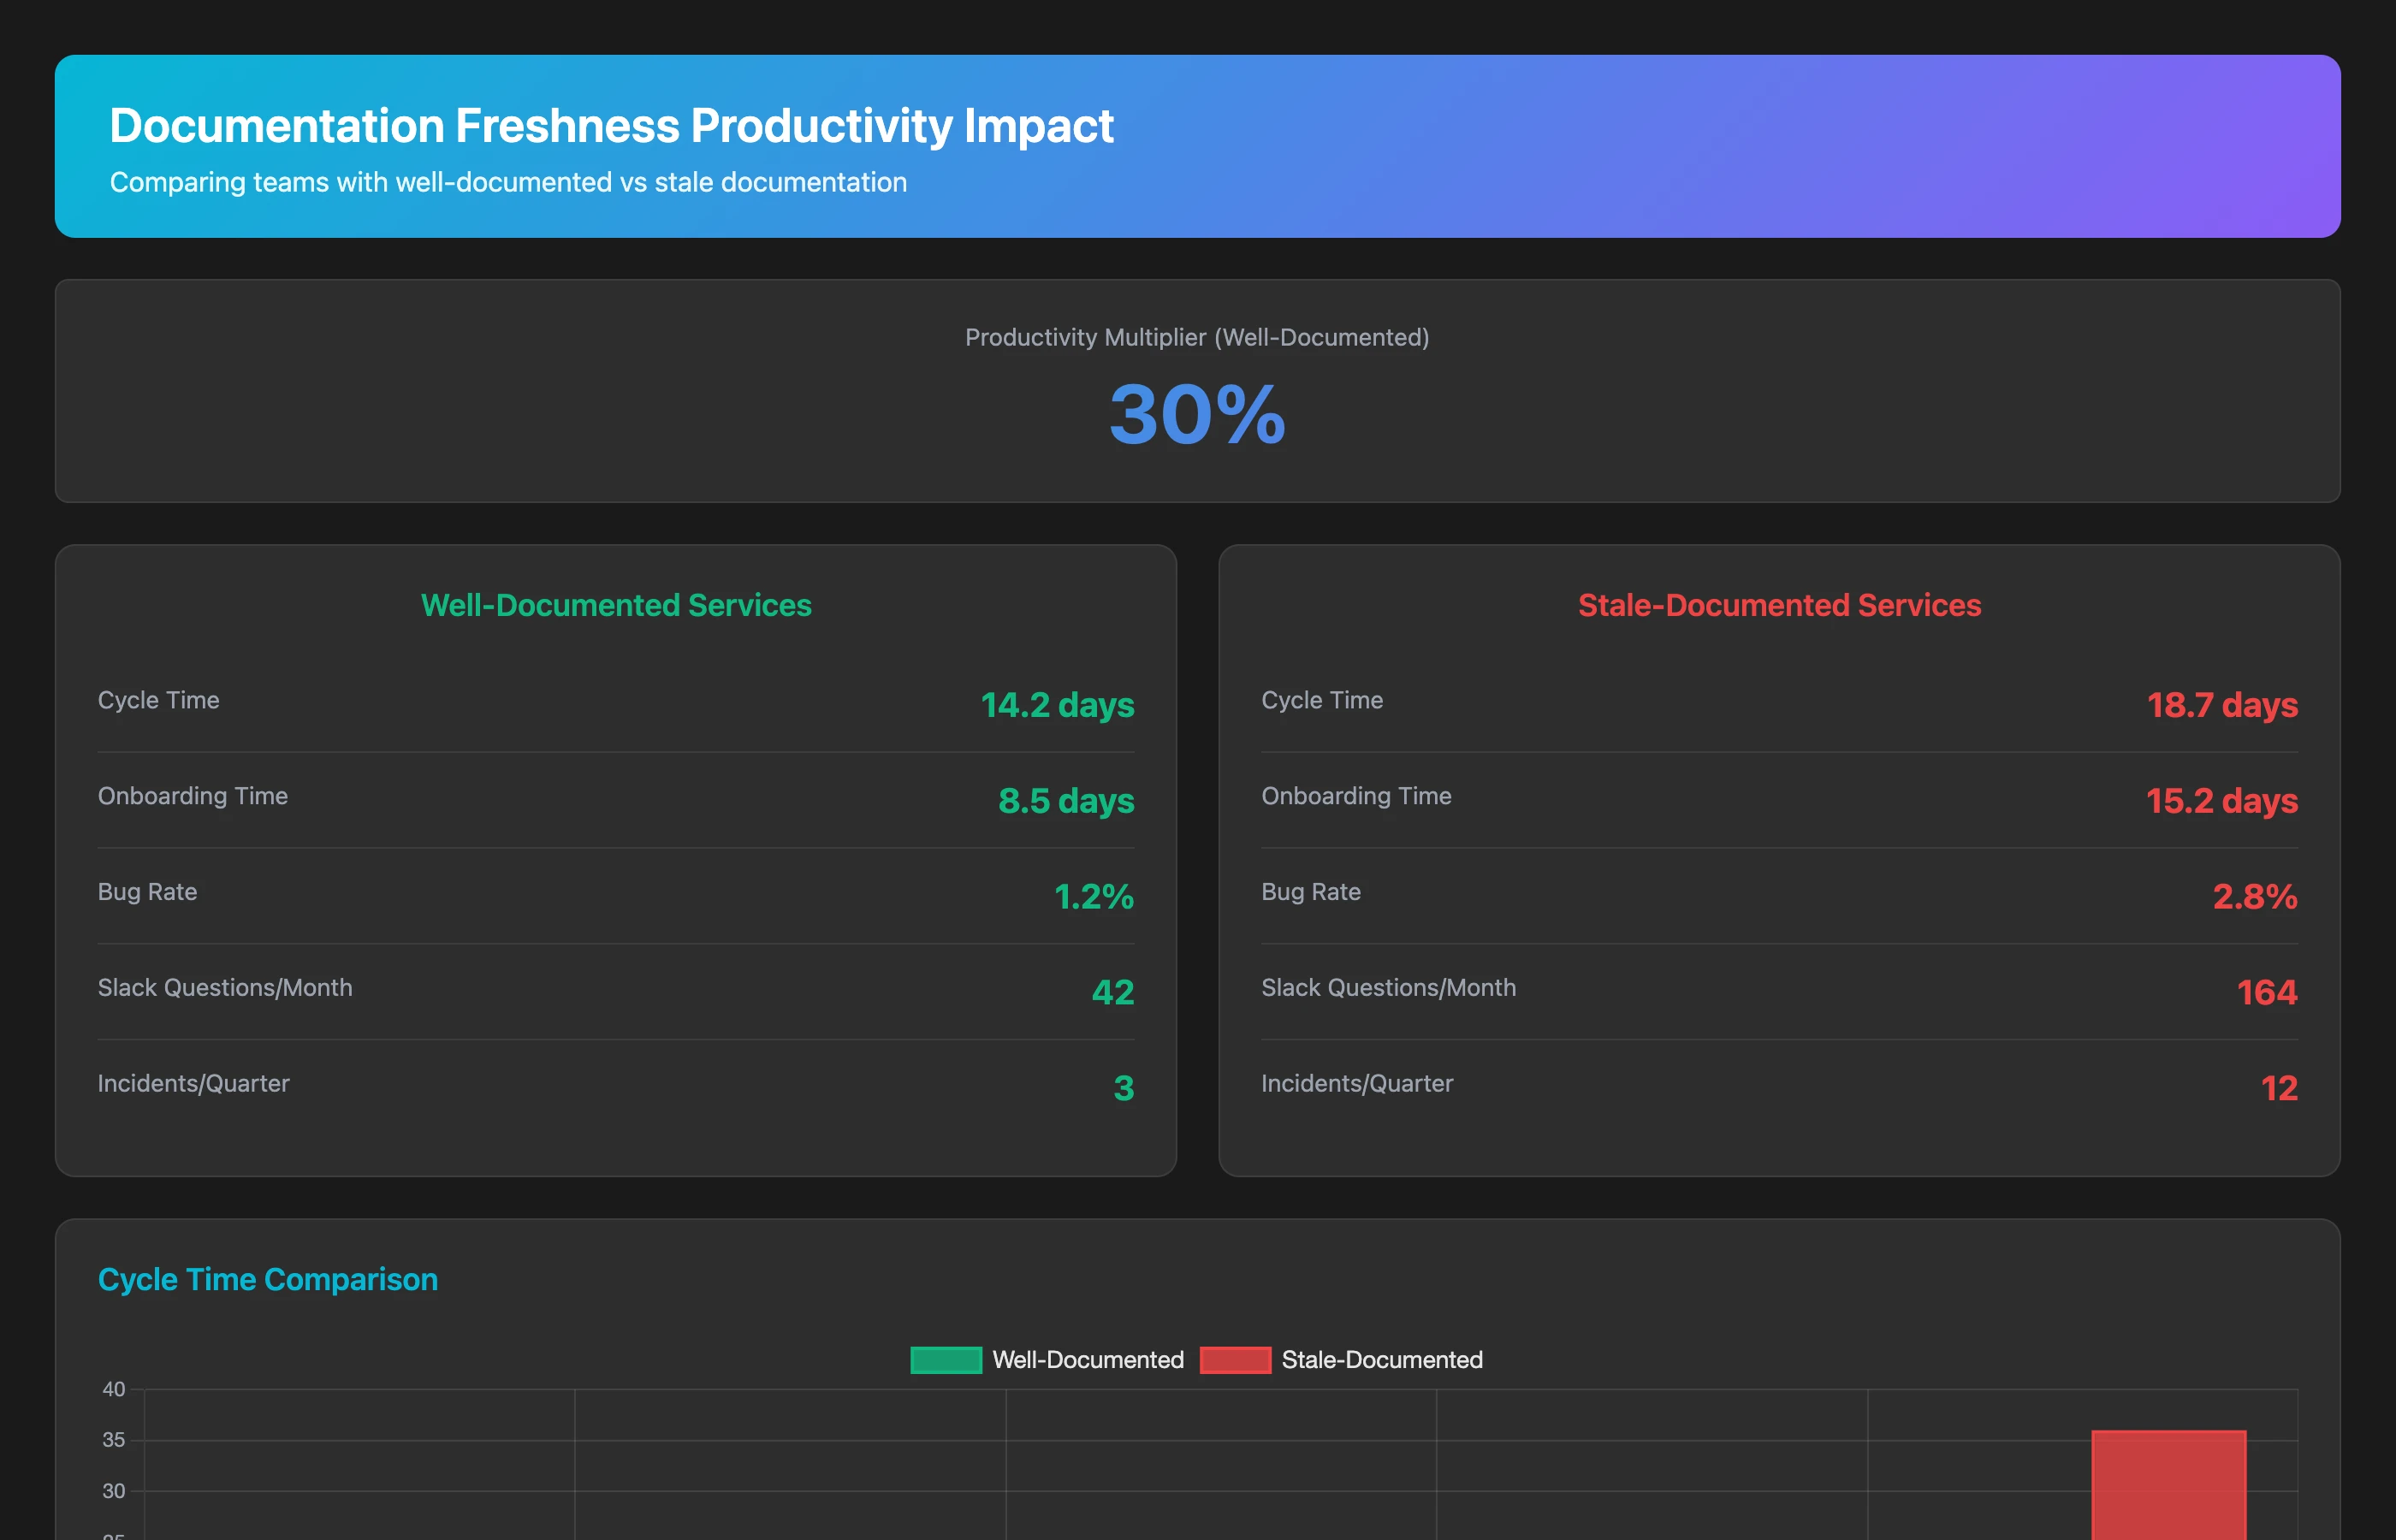
Fresh documentation speeds development; stale documentation slows it:
Correlate documentation freshness with developer productivity for Q2 2026. For repositories with active documentation (docs updated within 3 months) vs. stale documentation (docs not updated in over 6 months), compare: average cycle time for PRs, time to onboard new contributors to that repository, number of clarifying questions in code reviews, and bug rate. Show the productivity multiplier for well-documented vs. poorly-documented codebases.
Well-documented codebases typically see 20-30% faster development cycles because developers spend less time figuring out "how does this work?" and more time building features.
Calculating Documentation Debt Cost
Quantify the hidden cost of missing and outdated documentation:
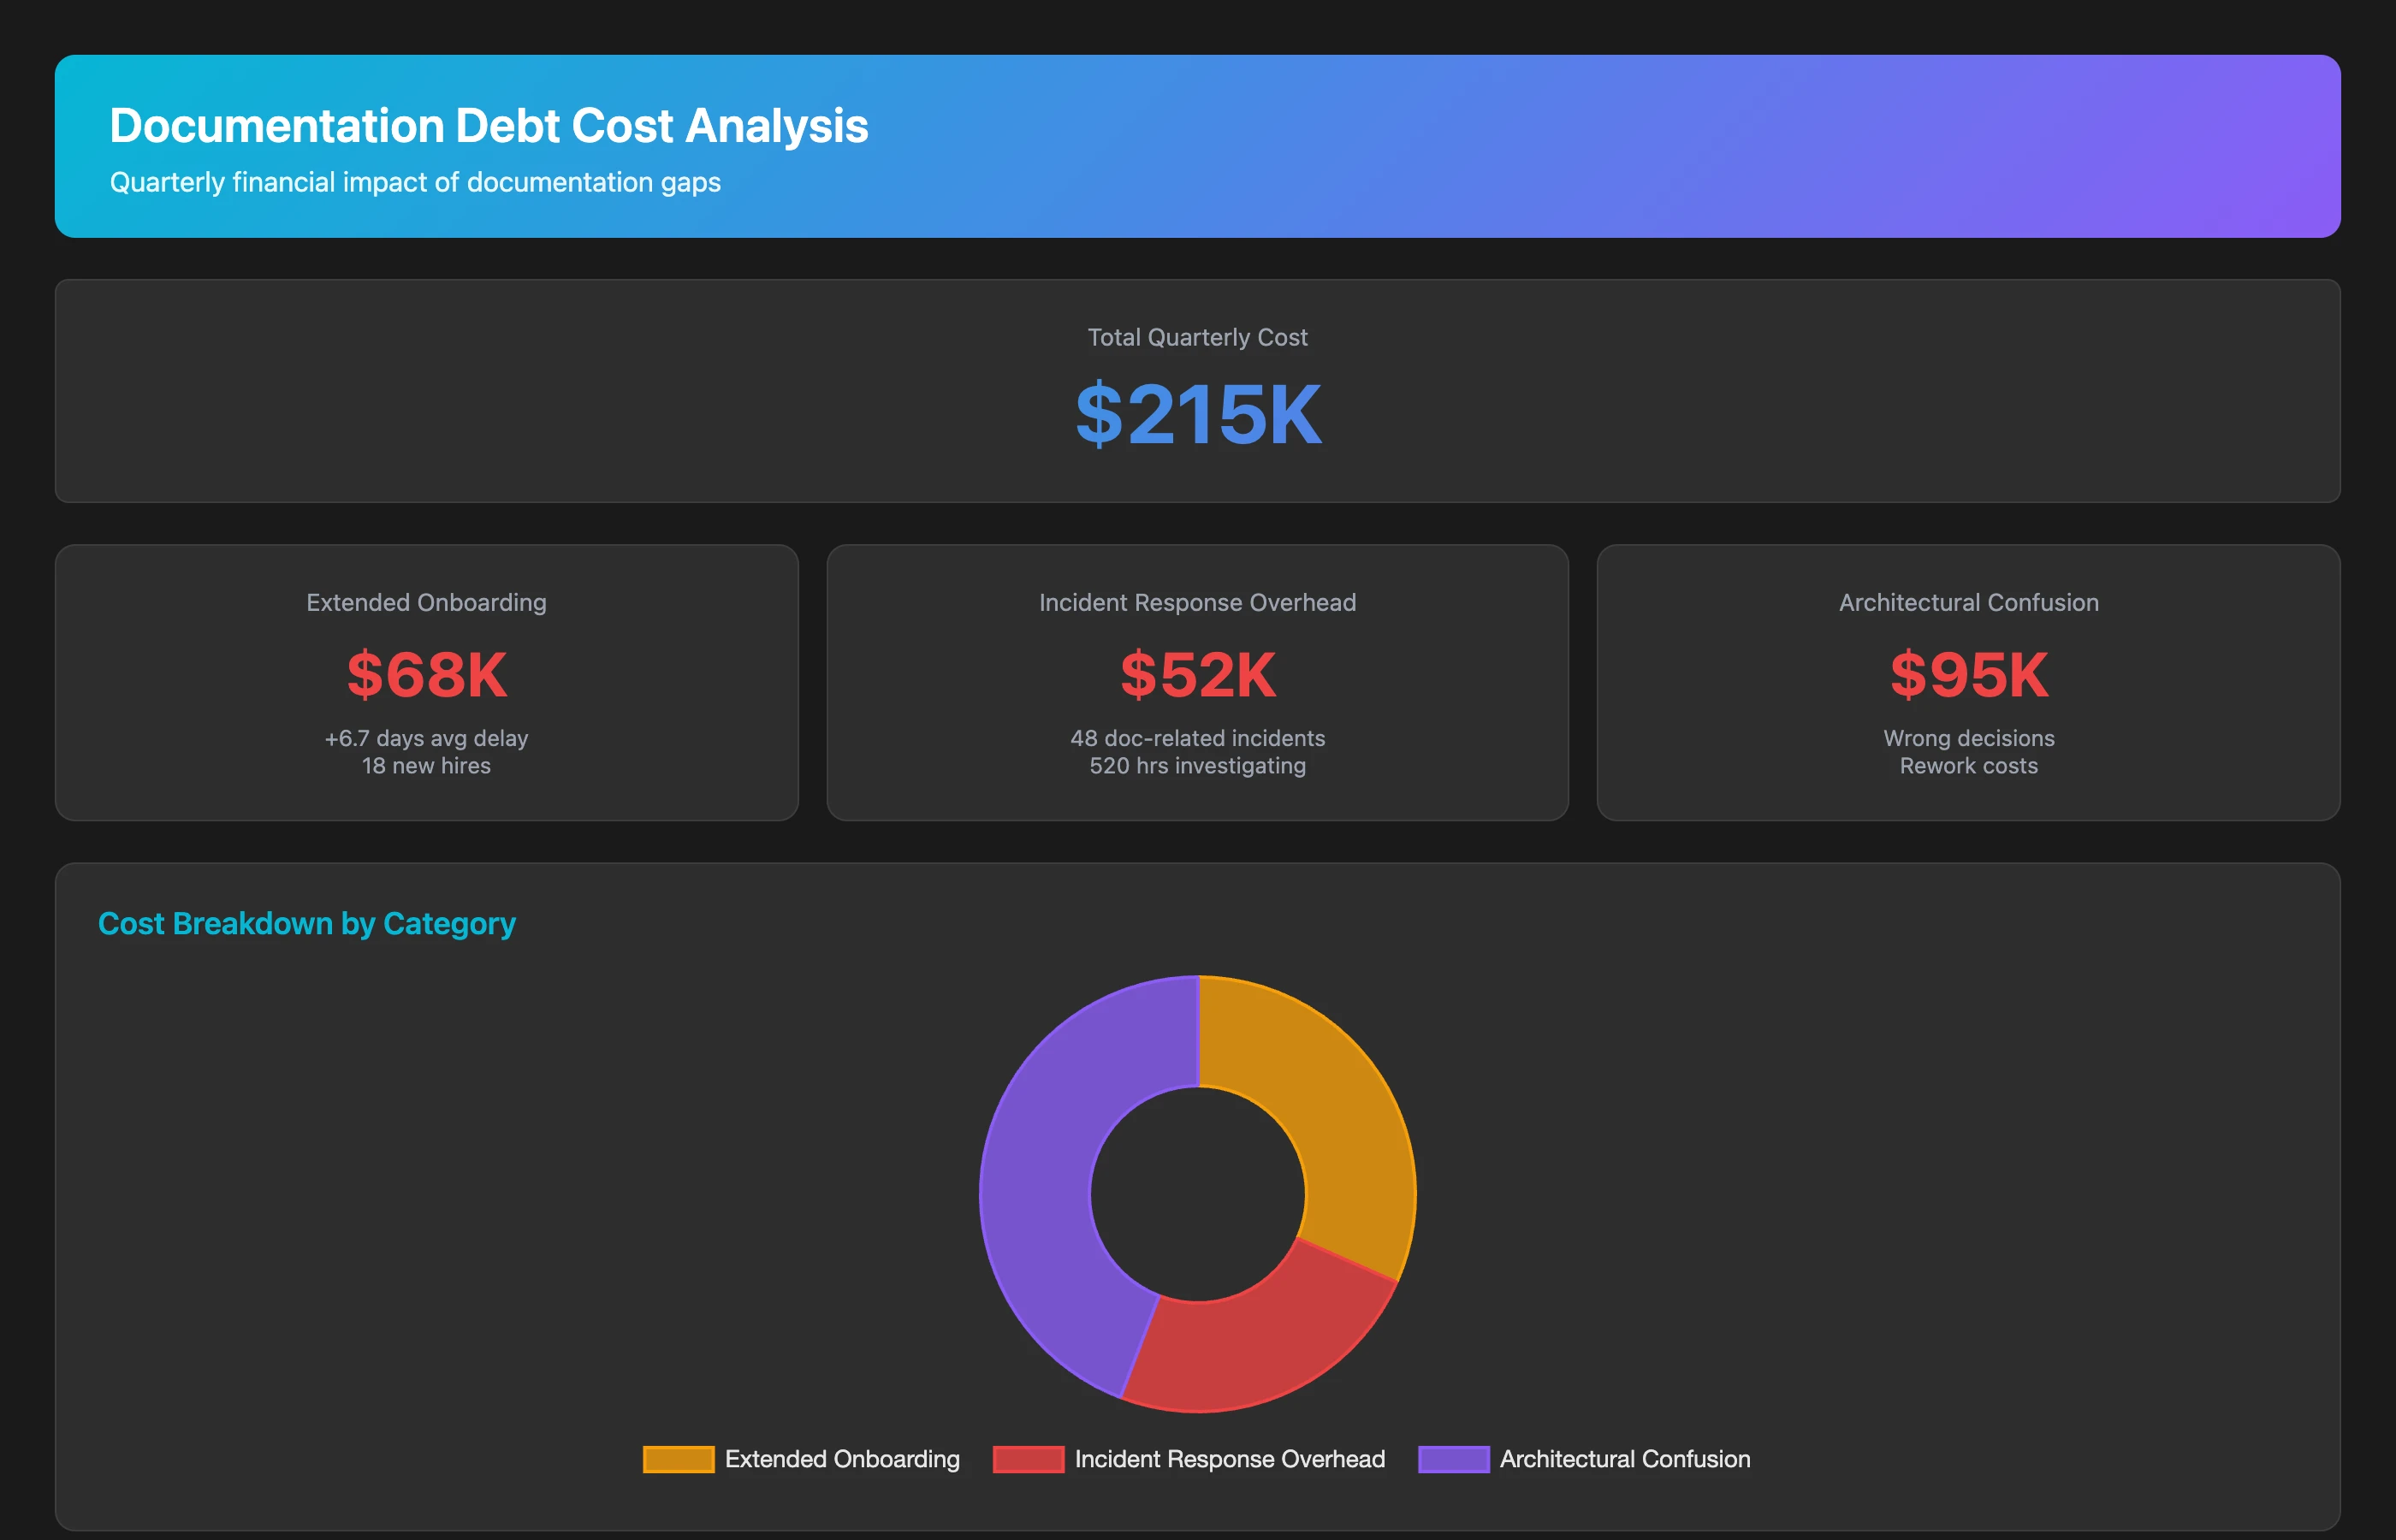
Calculate the cost of documentation debt for Q2 2026. Estimate: cost of extended onboarding time (extra weeks to productivity × number of new hires × $125/hour), cost of repeated incident response discovery work (incident response time overhead due to missing runbooks × number of incidents × $125/hour), cost of architectural confusion (PRs requiring major rework due to misunderstood system design × rework time × $125/hour). Show total quarterly cost and annual projection.
Documentation debt typically costs 5-10% of engineering capacity through extended onboarding, repeated discovery work, and architectural confusion. For a 50-person team growing 20% annually, poor documentation costs 2.5-5 FTE in lost productivity.
Prioritizing SDLC Debt Paydown: Where to Start
You've identified process debt, review debt, testing debt, and documentation debt. You've quantified the costs. Now comes the critical question: what should you fix first?
Not all technical debt is worth paying down. Some debt has low carrying costs and can be safely ignored. Other debt compounds rapidly and demands immediate attention. Let's use data to prioritize.
Creating a Debt Prioritization Matrix
Prioritize debt based on two factors: impact (cost to the organization) and ease of remediation:
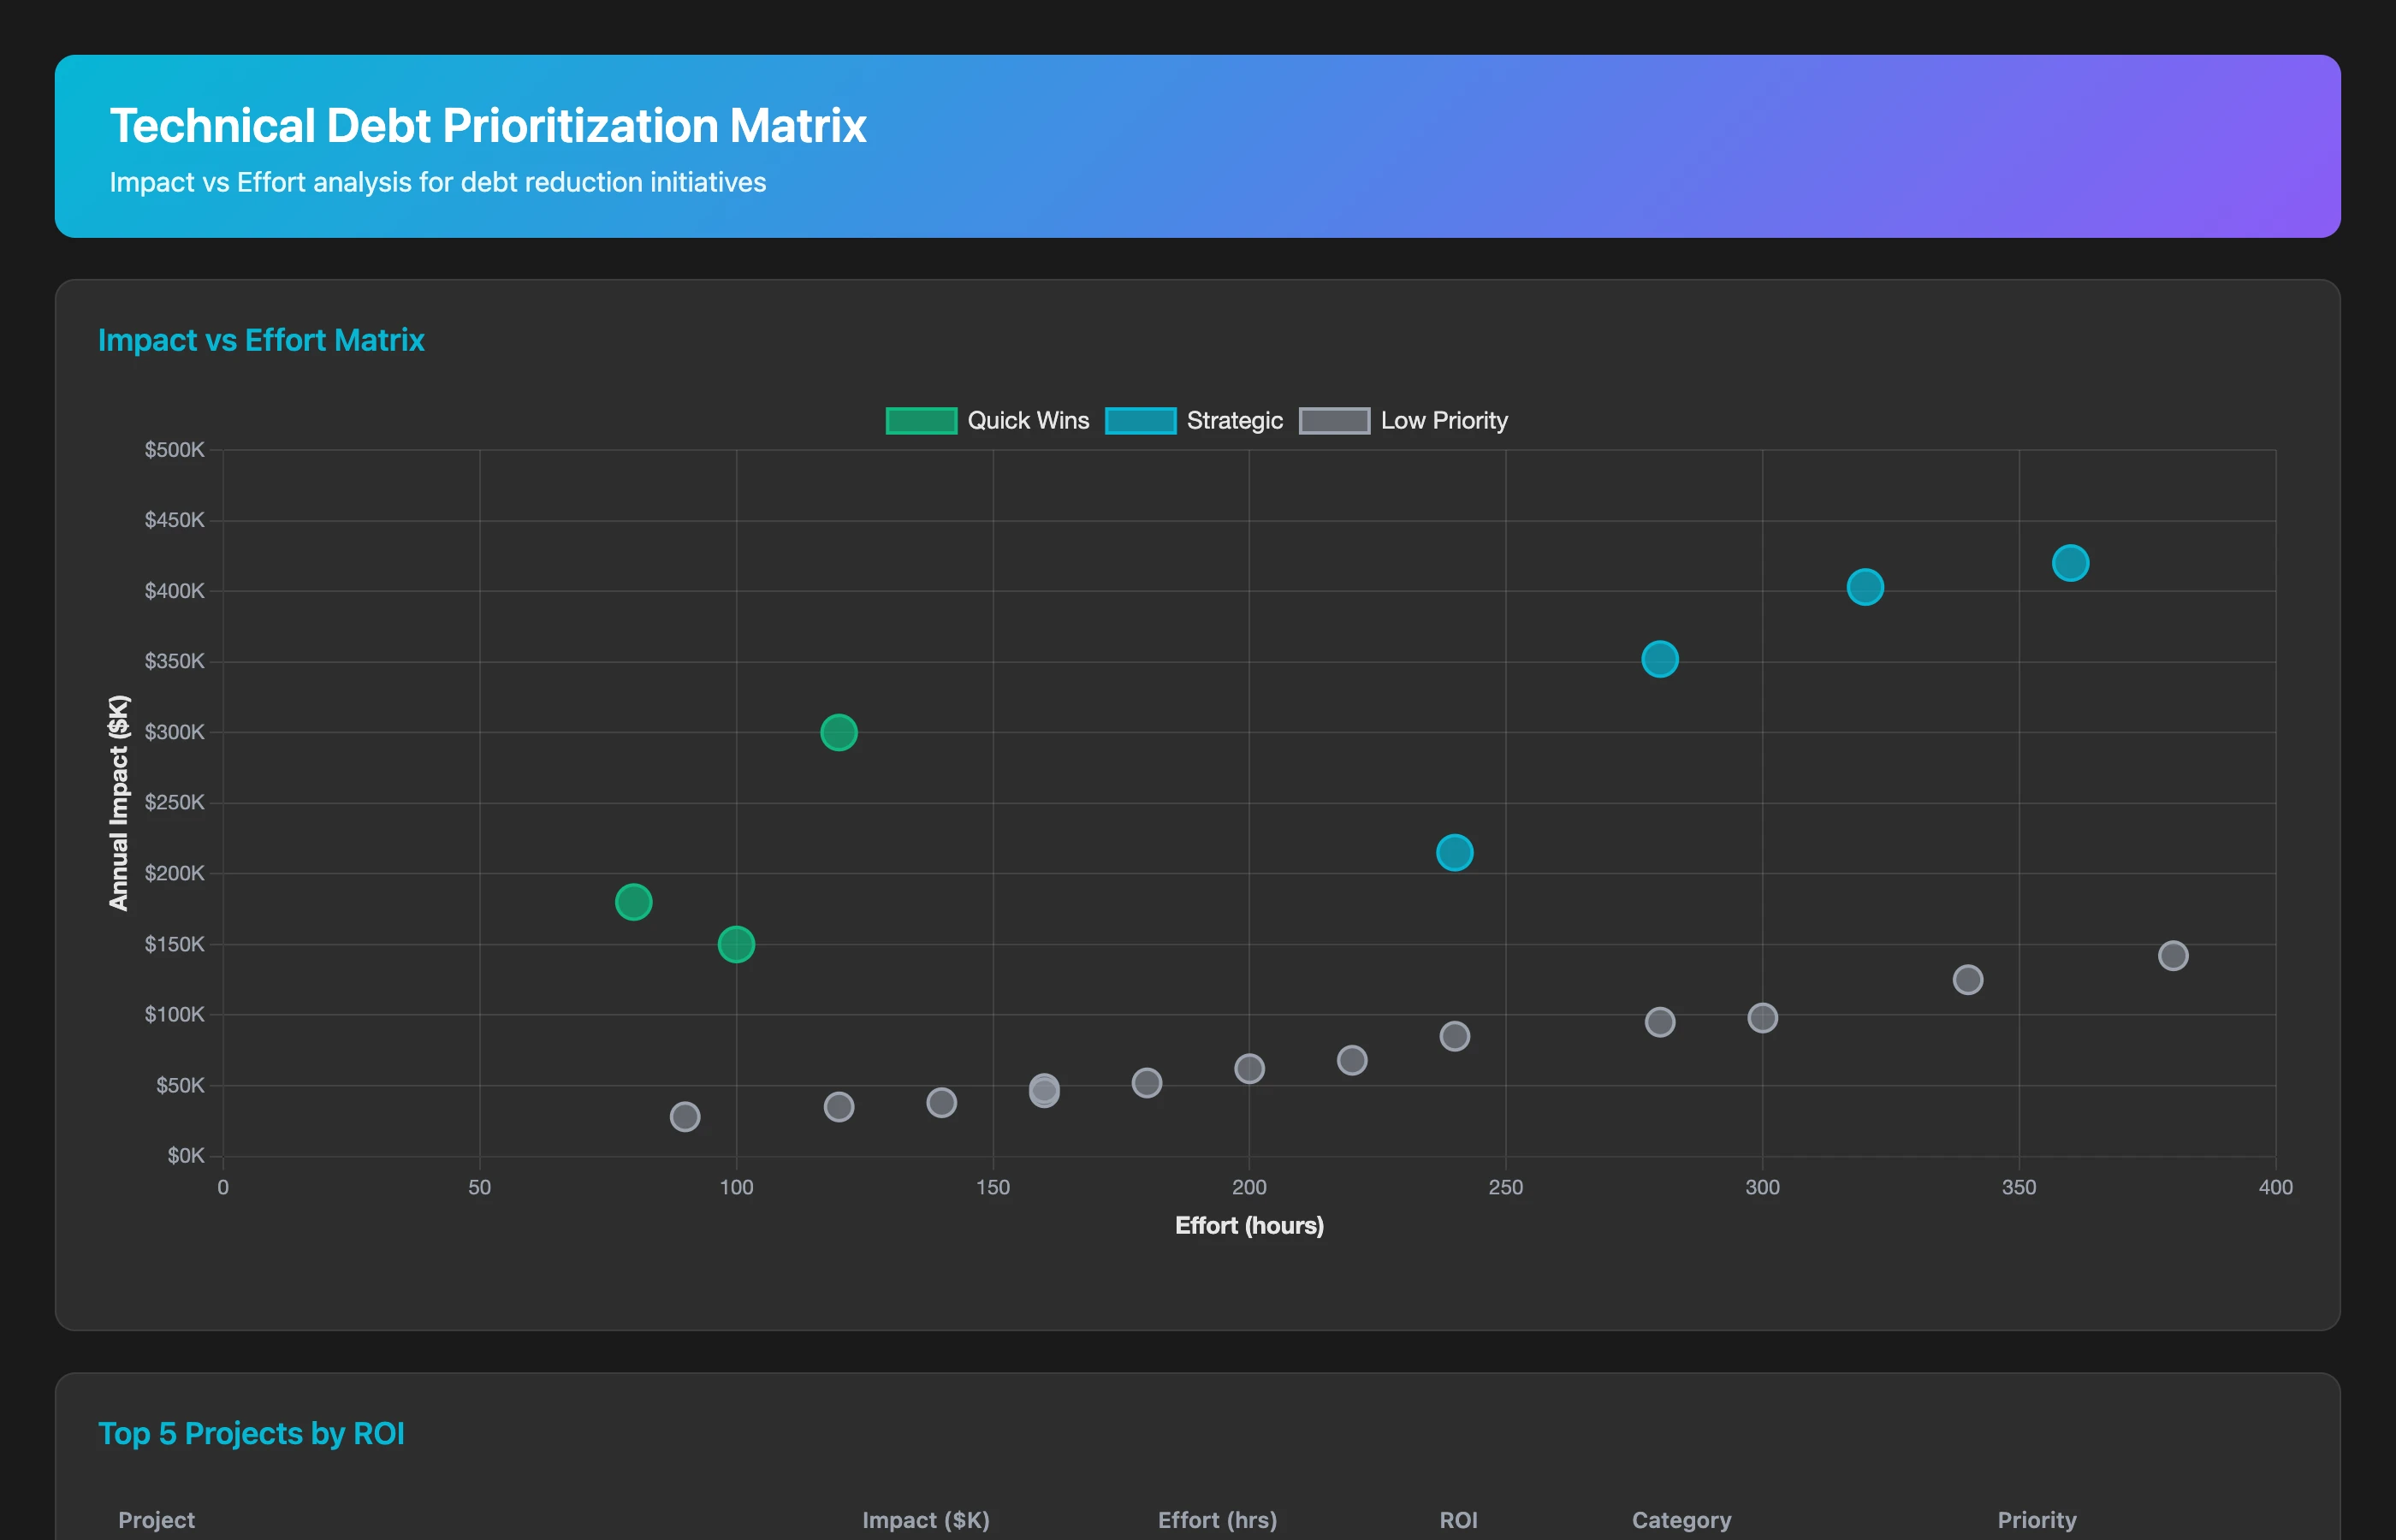
Create a technical debt prioritization matrix for all identified SDLC debt issues from Q2 2026. For each issue (flaky test, slow CI/CD pipeline, rubber-stamp review pattern, undocumented component, etc.), calculate: annual cost impact ($), effort to remediate (engineering hours), ROI (annual savings / remediation cost), and velocity impact score (how much faster would we ship if this were fixed?). Rank issues by ROI and flag "quick wins" (high impact, low effort) and "strategic investments" (very high impact, moderate effort).
This prioritization matrix transforms debt paydown from "we should fix everything" to a rational, ROI-based roadmap. Fix quick wins first for momentum, then tackle strategic investments.
Comparing Debt Paydown ROI vs. Feature Work
The hardest trade-off: should we pay down debt or build new features? Let's quantify:
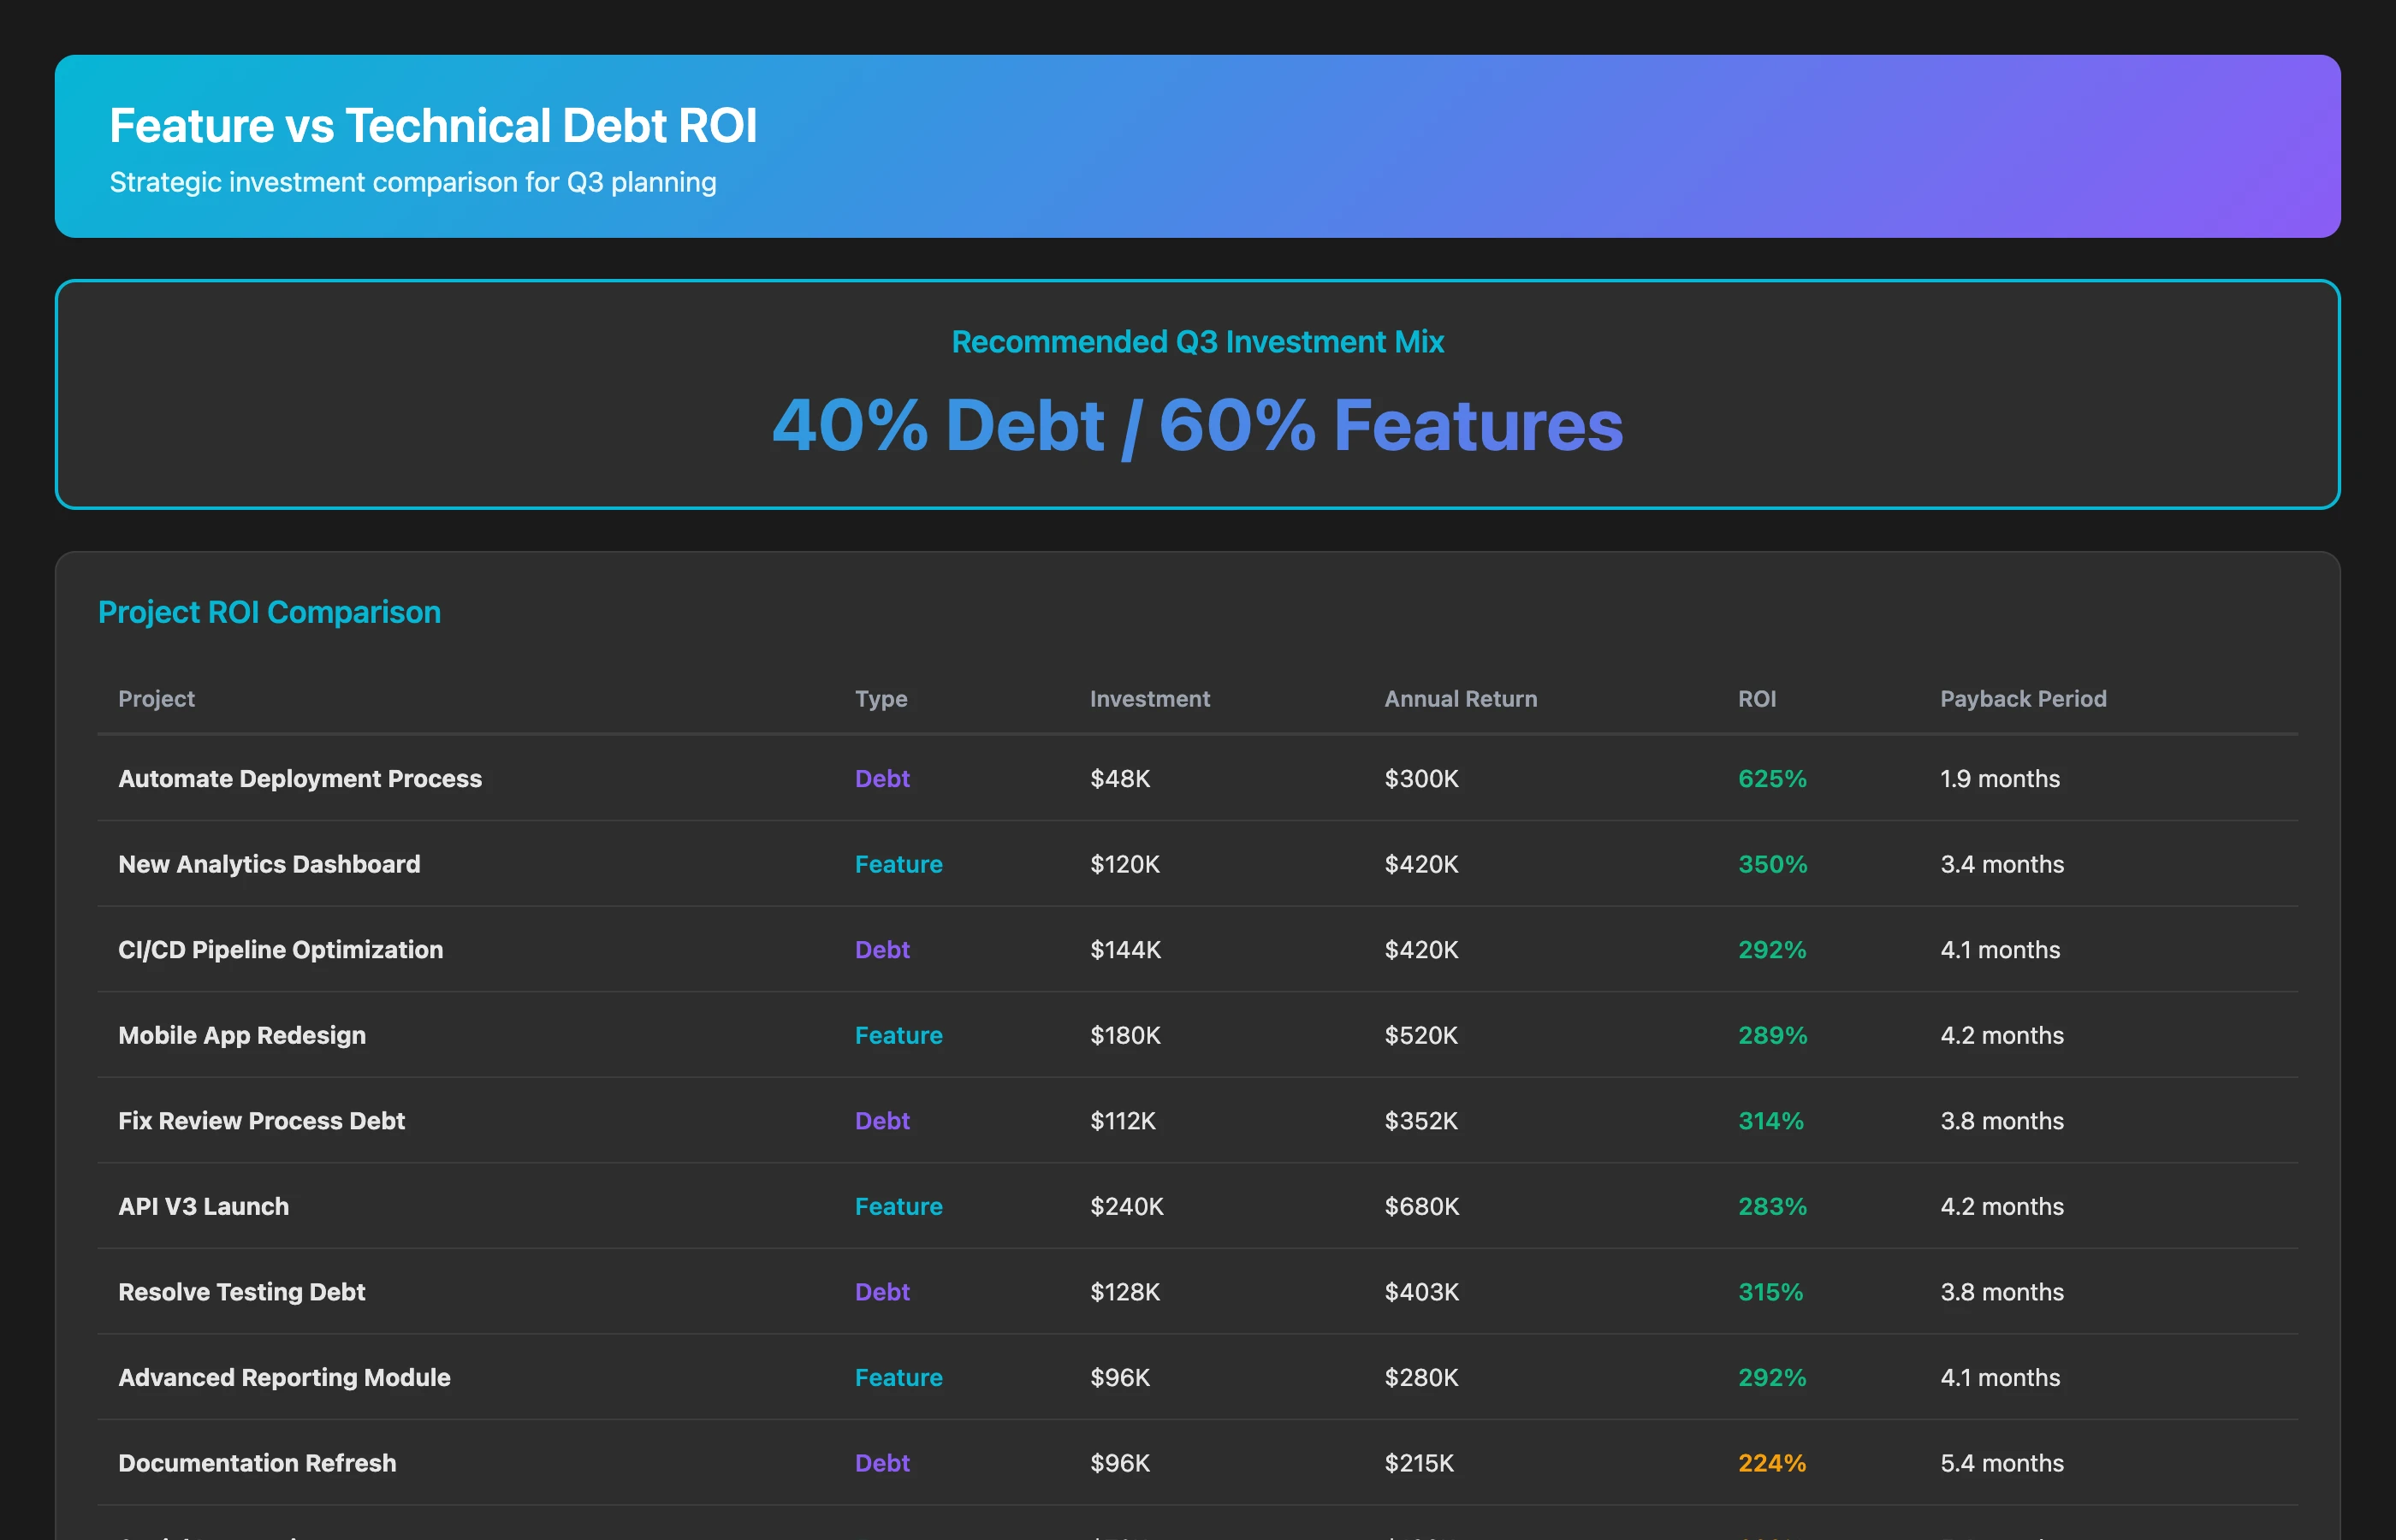
Compare ROI of technical debt paydown vs. new feature development for Q3 2026 planning. For proposed debt paydown projects (automate deployment, fix flaky tests, improve review process, update documentation), estimate: engineering effort required, velocity improvement, bug reduction, and annual cost savings. For proposed new features, estimate: engineering effort, expected revenue impact, and strategic value. Calculate ROI for each initiative and create a recommended Q3 roadmap that balances velocity improvement (debt paydown) with business impact (features).
This analysis often reveals that a few strategic debt paydown projects (e.g., automating deployment) deliver higher ROI than marginal features. Data replaces opinion in the "feature vs. debt" debate.
Tracking Debt Accumulation vs. Paydown Velocity
Monitor whether you're winning or losing the debt battle:
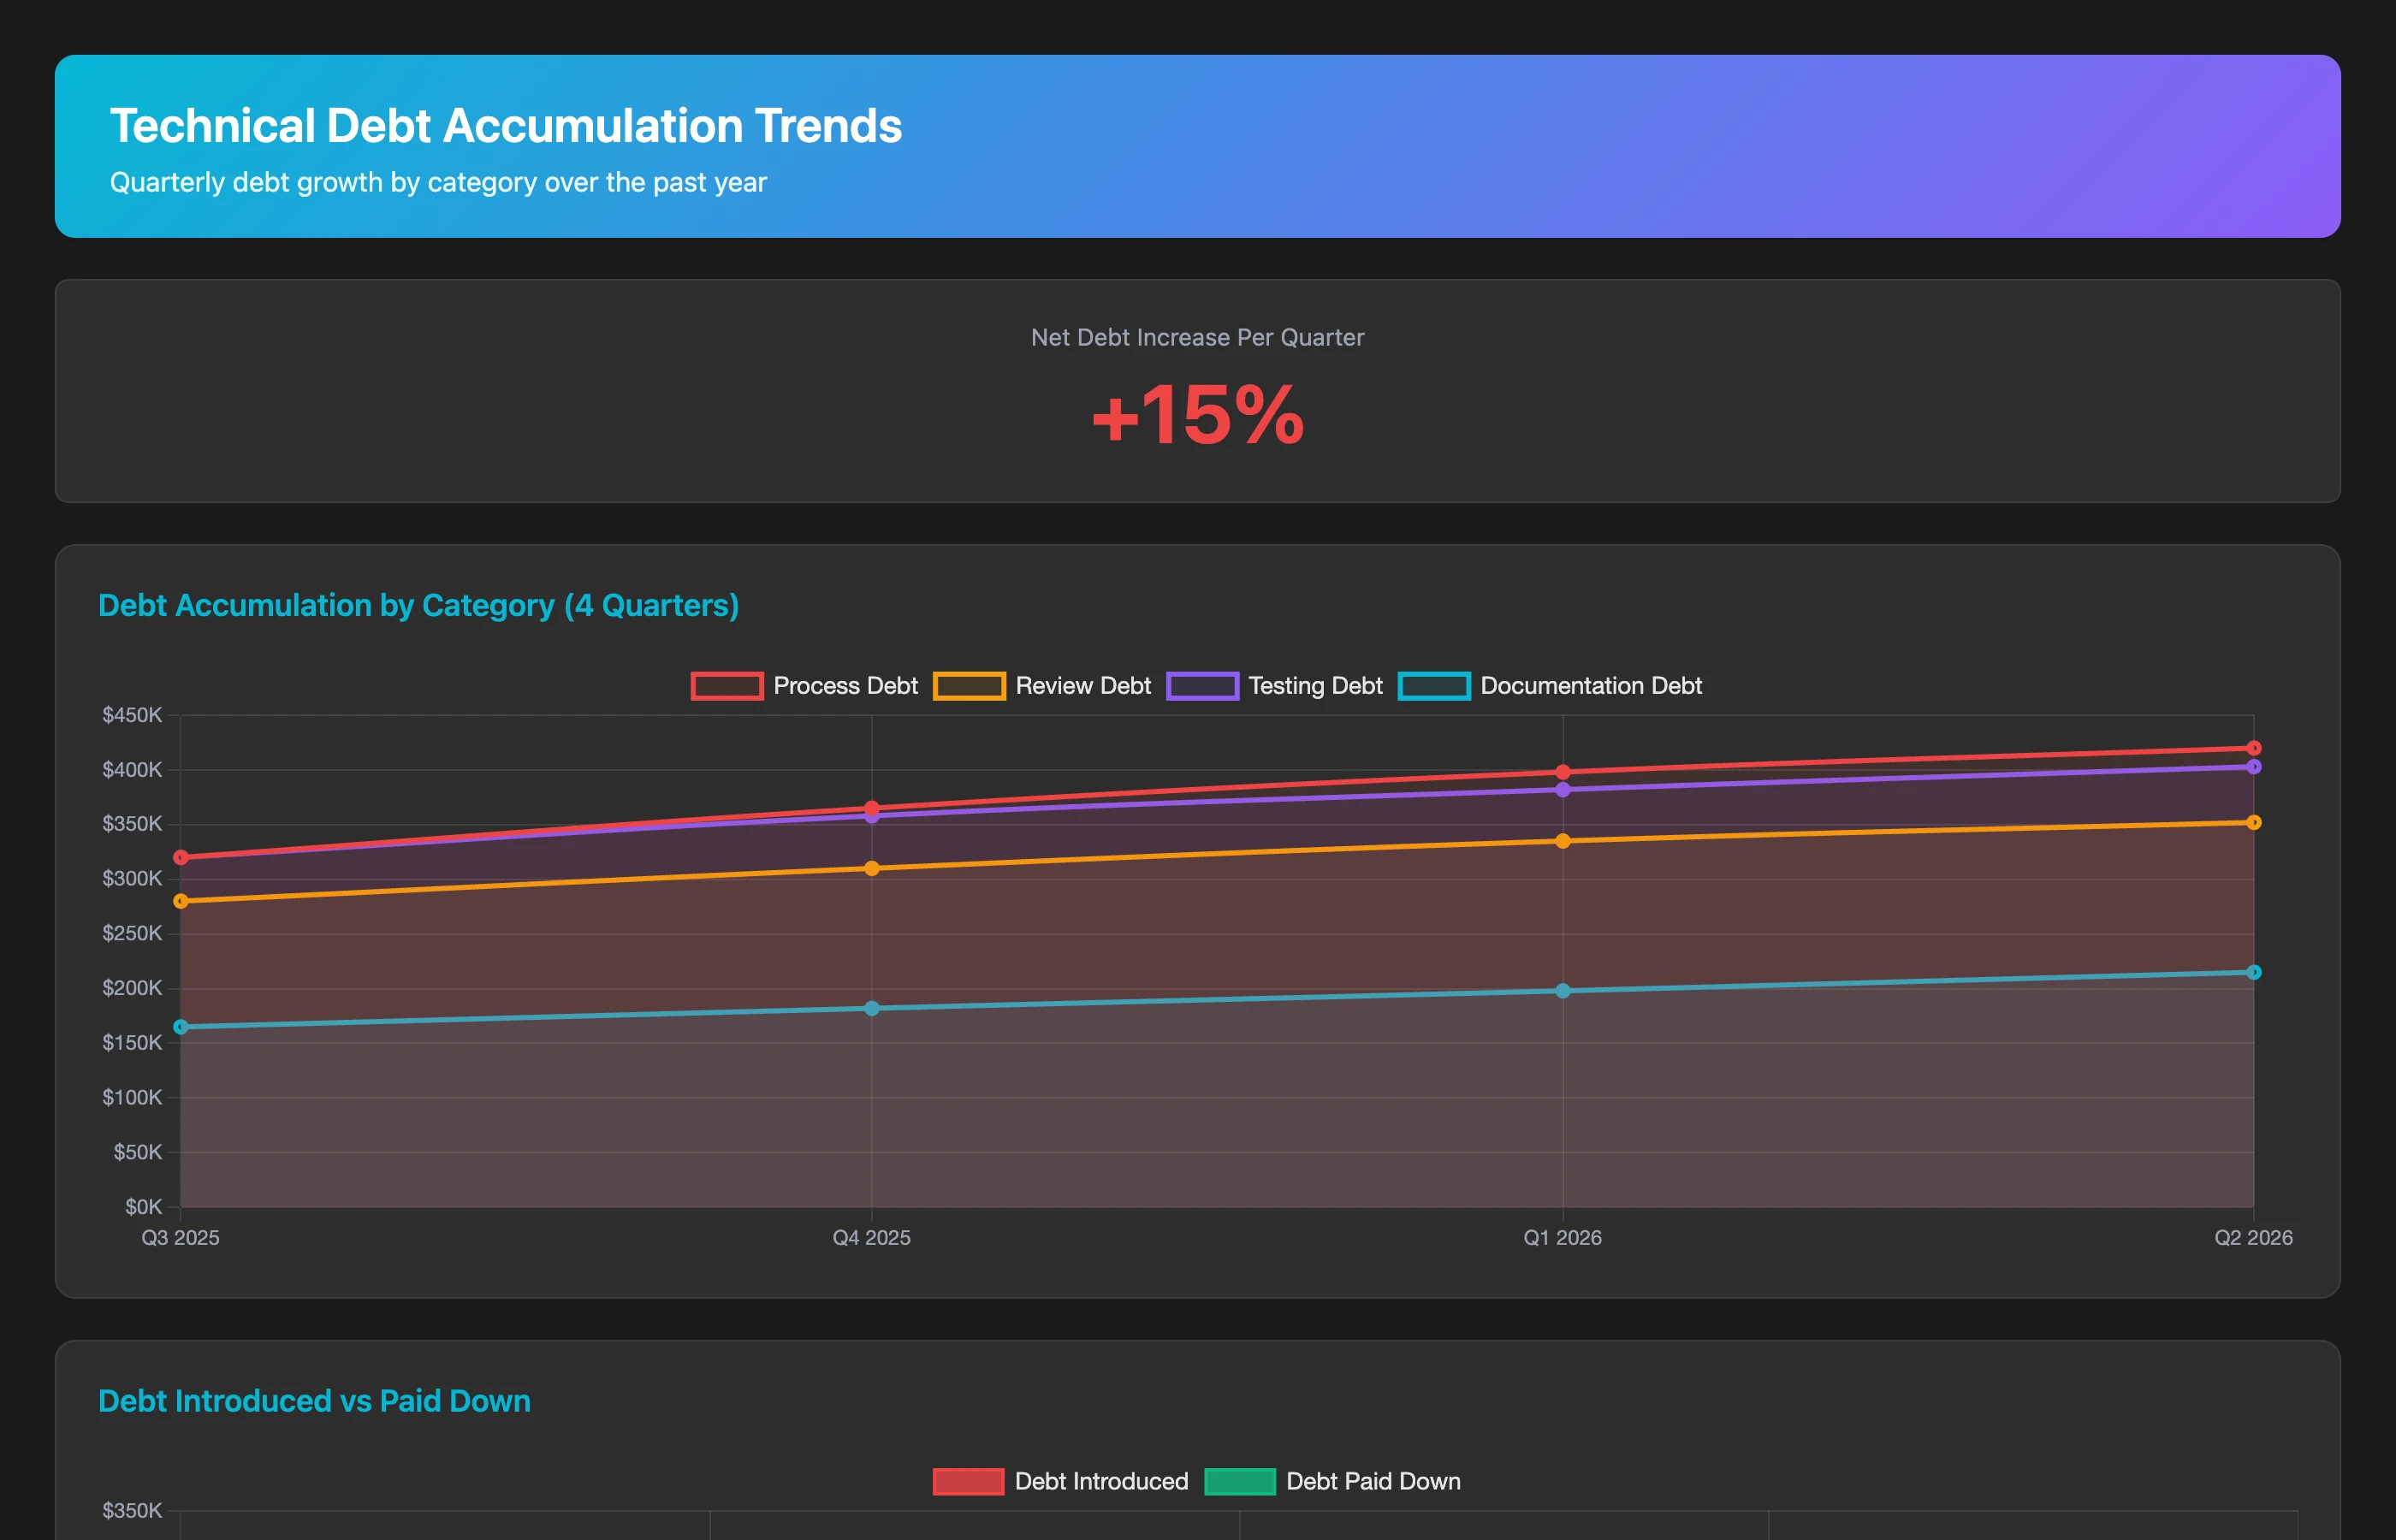
Track technical debt trend over the last 4 quarters. For each quarter, calculate: new debt introduced (new manual processes, new flaky tests, documentation falling out of date), debt paid down (automation implemented, tests fixed, docs updated), and net debt change. Show the trend by debt category (process, review, testing, documentation) and flag categories where debt is accelerating. Is our debt accumulation rate faster than our paydown rate?
If debt accumulation outpaces paydown, you're slowly drowning. This metric should be reviewed quarterly at the engineering leadership level to ensure sustainable velocity.
Practical Implementation: Building a Debt Reduction Program
Understanding SDLC debt is only valuable if you act on it. Here's how to build a systematic debt reduction program using insights from Keypup MCP.
Establish Debt SLAs
Not all debt must be fixed immediately, but it shouldn't grow unbounded. Set Service Level Agreements for debt accumulation:
- Flaky Tests SLA: No test with pass rate under 98% can exist for more than 2 weeks
- CI/CD Performance SLA: No repository can have build times over 30 minutes
- Review Quality SLA: No team can have rubber-stamp rate over 20%
- Documentation Freshness SLA: Critical system documentation must be updated at least quarterly
Use Keypup MCP to monitor compliance with these SLAs and alert when thresholds are crossed.
Allocate Debt Capacity
Reserve explicit engineering capacity for debt paydown:
- 15-20% of sprint capacity for debt work (not just feature development)
- One engineer per team as "debt champion" responsible for tracking and prioritizing debt
- Quarterly debt sprints where entire team focuses on paydown (no feature work)
Track debt capacity allocation using MCP to ensure teams actually spend this time on debt, not let it get consumed by feature pressure.
Implement Debt Gates
Prevent new debt from accumulating by creating quality gates:
- PR merge gates: PRs cannot merge if they introduce flaky tests or skip code review
- CI/CD gates: Build time increases over 20% trigger mandatory investigation
- Documentation gates: New services cannot launch without documentation meeting standards
Use MCP to enforce these gates by flagging violations in real-time during development.
Celebrate Debt Paydown Wins
Make debt paydown visible and rewarded:
- Quarterly debt reduction reports showing cost savings from debt paydown
- Recognition for high-impact debt fixes (e.g., engineer who fixed 10 flaky tests)
- Velocity improvements attributed to debt paydown to demonstrate business value
Use MCP to generate these reports automatically, quantifying the business impact of debt work so it's valued as much as feature development.
Technical debt isn't just code—it's embedded in every aspect of your software development lifecycle. Process debt from manual workflows. Review debt from superficial code reviews. Testing debt from flaky test suites. Documentation debt from knowledge that lives in Slack threads.
These hidden debts compound into massive costs: 15-25% of engineering capacity lost to process toil, 10-15% lost to review inefficiencies, 8-12% lost to testing problems, and 5-10% lost to documentation gaps. For a 50-person engineering team, that's 19-32 FTE worth of productivity consumed by SDLC debt instead of building product value.
The challenge has always been visibility. Unlike code debt that triggers compiler warnings, SDLC debt is invisible to traditional metrics. Slow deployments feel normal. Rubber-stamp reviews become culture. Flaky tests become accepted. Documentation rot goes unnoticed until a crisis hits.
Keypup MCP Server changes this by analyzing comprehensive SDLC data and making the invisible visible. Instead of vague complaints about "deployment is painful," you get "our deployment process costs $380K annually and automation would save $300K/year." Instead of debates about whether to build features or fix tests, you get ROI calculations showing that fixing those 15 flaky tests delivers 4× better ROI than building feature X.
This transforms technical debt from a morale problem ("we should clean this up someday") into a strategic asset. Teams that systematically identify, measure, and pay down SDLC debt don't just move faster—they move sustainably faster, with quality improving rather than degrading over time.
The organizations that win the next decade of software development won't be those who accumulate the least debt (impossible in any fast-moving engineering culture). They'll be the organizations that measure debt systematically, prioritize paydown ruthlessly, and maintain sustainable velocity by keeping SDLC debt within manageable bounds.
Start measuring your SDLC debt today. Use Keypup MCP to quantify the costs hiding in your processes, reviews, tests, and documentation. Then build a systematic debt reduction program that balances feature velocity with sustainable quality.
Your codebase isn't the only thing accumulating debt. Your entire development lifecycle is. It's time to measure it, manage it, and use it as a competitive advantage.