TL;DR: Board reporting for software development has evolved from simple headcount and budget tracking to strategic intelligence that drives company decisions. CTOs and VPs of Engineering must now connect SDLC metrics with financial outcomes, demonstrate ROI on engineering investments, and provide forward-looking analysis. Keypup's MCP Server transforms this challenge from manual spreadsheet compilation into AI-powered intelligence that answers board questions in natural language.
- Key Point 1: Board-level software development reporting requires connecting engineering metrics (velocity, quality, efficiency) with business outcomes (revenue impact, cost per feature, time-to-market) to demonstrate strategic value and inform resource allocation decisions.
- Key Point 2: Effective board reports move beyond lagging indicators (what happened) to include leading indicators (what's coming) and diagnostic analysis (why it matters), enabling proactive strategy adjustments rather than reactive problem-solving.
- Key Point 3: Keypup MCP Server enables conversational queries that combine SDLC data with financial information, providing instant answers to board questions like "What's our cost per deployed feature?" and "How does engineering efficiency correlate with revenue growth?"
Introduction: When the Board Asks "What Are We Getting for Our Engineering Investment?"
Every quarter, CTOs and VPs of Engineering face their most challenging audience: the company board. Unlike daily standups with engineers or weekly syncs with product managers, board presentations demand a fundamentally different communication style. Board members don't want to hear about sprint velocity improvements or pull request cycle times—they want to understand how engineering investments translate into competitive advantage, revenue growth, and strategic capability.
The question that keeps engineering leaders awake before board meetings isn't "What did my team accomplish?" but rather "How do I prove that our $15M annual engineering spend is driving business outcomes that matter to shareholders?" This question has become more urgent as software development has evolved from a cost center to a strategic differentiator. Companies increasingly compete on their ability to deliver software quickly, reliably, and efficiently. The board needs visibility into this capability.
Traditional approaches to engineering board reporting fall into two traps. The first trap is metric overload: presenting dozens of engineering KPIs (deployment frequency, change failure rate, code coverage, technical debt ratio) without connecting them to business outcomes. Board members glaze over during deep dives into DORA metrics because they can't translate "our deployment frequency increased from 3x/week to daily" into strategic value. The second trap is anecdotal reporting: showcasing feature releases and customer wins without quantitative backing, leaving board members to wonder whether success is systematic or serendipitous.
I spent years perfecting my engineering metrics dashboards—beautiful visualizations of velocity trends, quality indicators, efficiency ratios. At board meetings, I'd walk through 20 slides of data. Board members would nod politely, then ask, 'But what does this mean for our ability to win the enterprise market?' I realized I was answering questions nobody asked. They didn't want engineering metrics; they wanted strategic intelligence about our product delivery capability and how it connected to market opportunity.
The solution lies in outcome-oriented reporting that connects engineering execution with business strategy. This requires three capabilities that most engineering organizations lack:
- Financial Alignment: Mapping SDLC metrics to cost structures, revenue impact, and ROI to demonstrate how engineering efficiency translates into business value
- Predictive Intelligence: Moving beyond "what happened last quarter" to "what we expect next quarter and why," enabling proactive strategy adjustments
- Diagnostic Analysis: Explaining not just what the metrics show but what they mean—identifying root causes, forecasting consequences, and recommending actions
Building this reporting capability manually is extraordinarily difficult. It requires pulling data from multiple systems (Git platforms, project management tools, CI/CD pipelines, financial systems), reconciling inconsistencies, performing complex analysis, and presenting findings in business-friendly formats—all under quarterly time pressure. Most engineering leaders resort to spreadsheet compilations that become obsolete the moment they're completed.
Keypup's MCP (Model Context Protocol) Server fundamentally transforms this challenge by enabling conversational intelligence over unified engineering and financial data. Instead of building static reports, engineering leaders can ask natural language questions that combine SDLC metrics with financial information: "What was our cost per deployed feature last quarter compared to the year prior?" or "Show me engineering efficiency trends correlated with customer acquisition costs." The MCP Server provides instant, accurate answers backed by comprehensive data analysis, transforming board reporting from a quarterly burden into ongoing strategic intelligence.
This article explores what CTOs and VPs of Engineering should report to their boards, why these metrics matter for strategic decisions, and how Keypup MCP Server provides the analysis, diagnosis, and recommendations that turn raw data into actionable board intelligence. We'll cover five essential reporting areas: strategic execution visibility, financial efficiency, quality and reliability, capacity and capability, and predictive forecasting—all illustrated with practical MCP queries that deliver board-ready insights.
What Boards Actually Care About: Strategic Context Over Tactical Metrics
Before diving into specific reporting frameworks, engineering leaders must understand what boards fundamentally care about regarding software development. This understanding shapes which metrics to present and, more importantly, how to present them. Boards operate at a strategic level focused on three core questions:
Strategic Question 1: Can Engineering Execute Our Strategy?
The board's primary concern isn't whether engineering is busy or productive—it's whether engineering can execute the product strategy necessary to achieve business goals. This manifests in questions like:
- "Can we build the enterprise features needed to move upmarket within 18 months?"
- "Do we have the engineering capacity to support our planned customer growth?"
- "How quickly can we respond to competitive threats with new product capabilities?"
These questions require engineering leaders to demonstrate strategic delivery capability: the ability to consistently ship high-priority, high-impact work on timelines that align with market opportunity. Board members need evidence that engineering isn't just executing tasks but delivering strategic outcomes.
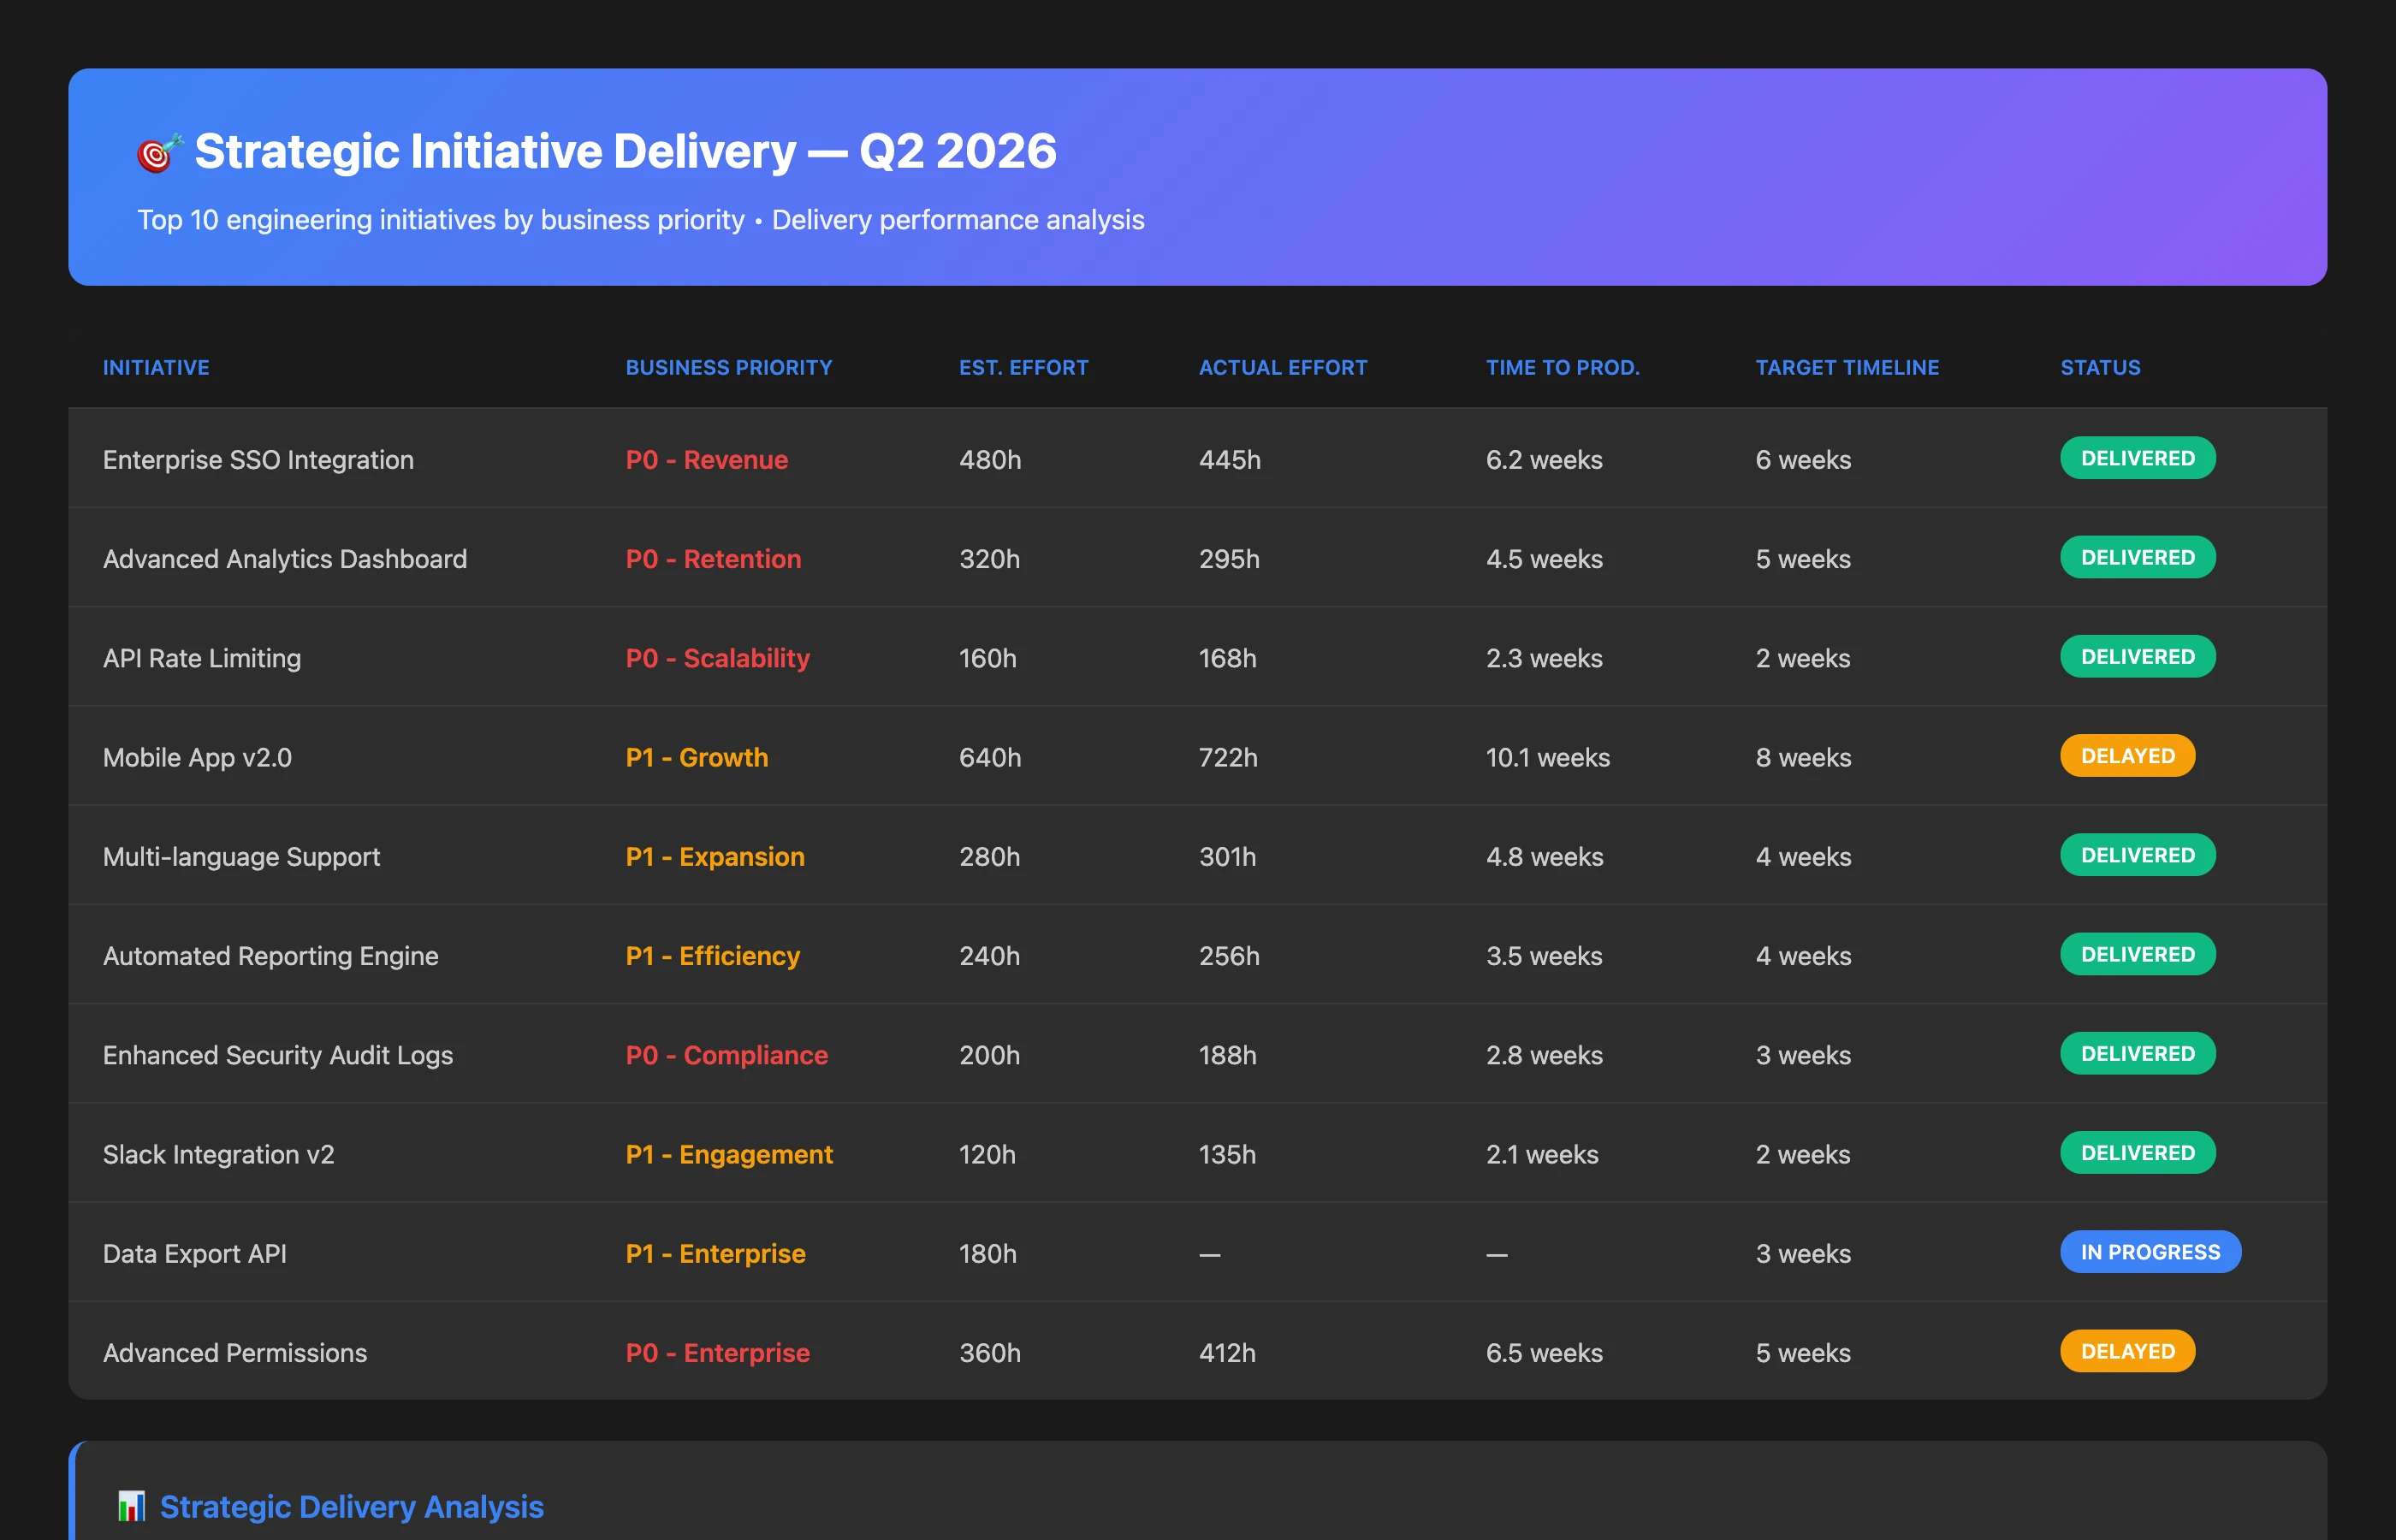
Show me our top 10 engineering initiatives by business priority over the last 6 months. For each initiative, include: estimated effort, actual effort, time from start to production, business impact category, and whether delivery met the target timeline. Highlight initiatives that delivered early and those that missed deadlines, with root cause analysis for delays.
This query demonstrates strategic execution capability by connecting engineering work with business priorities, showing not just what was delivered but whether the right things were delivered on time. Board members can immediately see patterns: Are delays concentrated in specific areas? Are high-priority initiatives getting appropriate attention? Is engineering execution aligned with strategic bets?
Strategic Question 2: Is Engineering Investment Efficient?
Boards think in financial terms. Every dollar allocated to engineering competes with sales expansion, marketing campaigns, and operational improvements. Engineering leaders must demonstrate that software development investment generates appropriate returns—not in abstract "productivity" terms but in concrete business value.
This manifests in questions like:
- "What's our cost per new feature compared to industry benchmarks?"
- "How much engineering expense is maintenance versus new capability development?"
- "Are we getting more efficient over time, or are costs rising faster than output?"
Answering these questions requires connecting engineering metrics with financial data to calculate engineering ROI: the relationship between development costs and business outcomes delivered.
Calculate our cost per deployed feature for the last 4 quarters. Break down engineering costs by: personnel expenses, infrastructure costs, and tooling subscriptions. Count deployed features as: new product capabilities that reached production and were enabled for customers. Show the trend and compare to our revenue per employee over the same period.
This analysis transforms abstract engineering productivity into concrete financial efficiency. Board members can assess whether engineering investment scales appropriately with business growth and whether efficiency improvements are accelerating or stagnating.
Strategic Question 3: What Risks Threaten Execution?
Boards hate surprises. Their third core concern is understanding execution risks: what could derail the product roadmap, cause quality incidents, or force costly rework. This manifests in questions like:
- "What's our technical debt burden, and when does it become a strategic constraint?"
- "Are we seeing leading indicators of quality degradation before it impacts customers?"
- "Do we have engineering capacity bottlenecks that will limit our ability to execute next quarter?"
Effective board reporting proactively identifies these risks with sufficient lead time for strategic adjustments. Rather than reporting problems after they've impacted customers or missed deadlines, engineering leaders should present early warning indicators that enable preventive action.
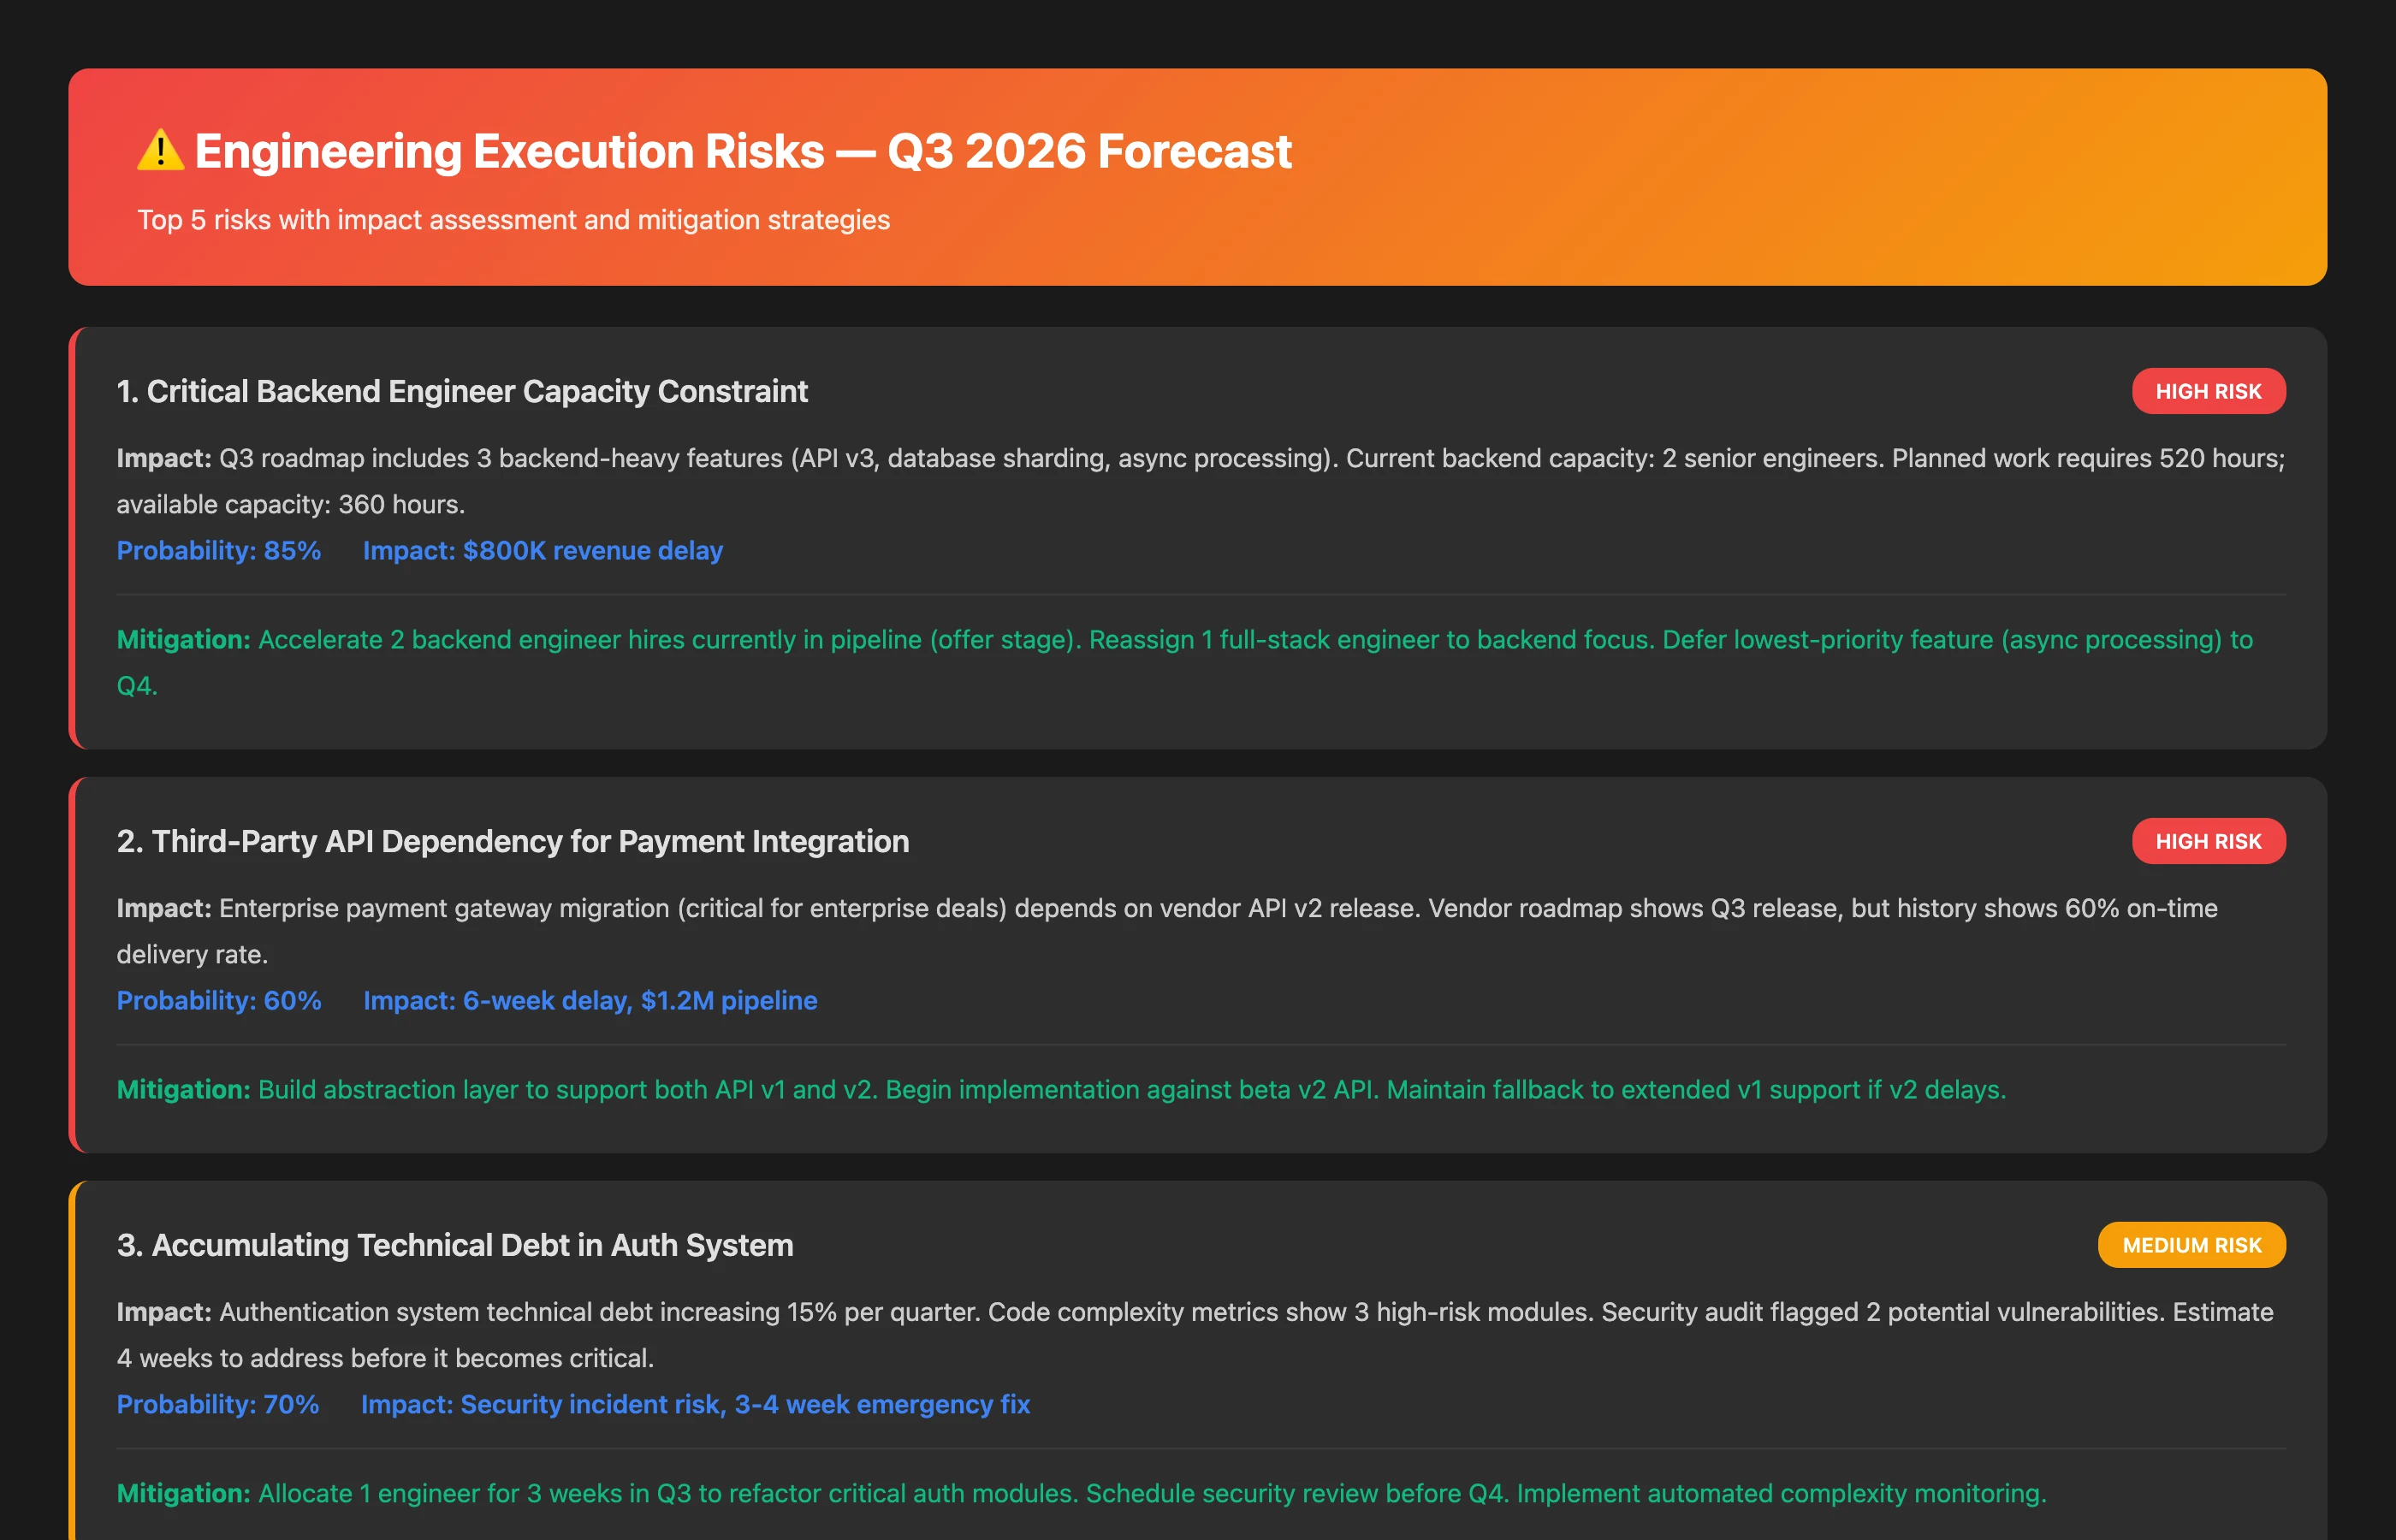
Identify top 5 engineering execution risks for next quarter based on: current sprint velocity trends, critical dependency delays, high-severity bug accumulation rates, team capacity constraints, and technical debt in planned feature areas. For each risk, provide impact assessment, probability estimate, and recommended mitigation actions.
This forward-looking risk analysis positions engineering leadership as strategic partners who anticipate problems rather than reactive operators who report failures. Boards value this predictive capability because it enables better resource allocation and strategic planning.
Understanding these three strategic questions shapes effective board reporting: every metric presented should connect to strategic execution capability, financial efficiency, or risk management. Tactical metrics (like code review turnaround time or test coverage percentages) only belong in board reports when they directly explain strategic outcomes, efficiency changes, or emerging risks.
The Five Essential Board Reporting Categories
With strategic context established, let's explore the five essential reporting categories that CTOs and VPs of Engineering should present to boards, along with practical guidance on which metrics matter, how to present them, and how Keypup MCP Server enables instant analysis.
What to Report: Demonstrate that engineering is delivering strategic value aligned with business priorities, not just completing tasks. Focus on high-impact outcomes rather than raw output volume.
Key Metrics:
- Strategic initiative completion rate (planned vs. delivered)
- Time-to-market for critical features (concept to customer availability)
- Alignment score (% of engineering effort allocated to top strategic priorities)
- Delivery predictability (variance between estimated and actual timelines)
Why It Matters: Boards need confidence that engineering investments are directed toward strategic objectives that drive competitive advantage. Misalignment between what engineering builds and what the business needs is the most expensive form of waste.
Presentation Approach: Frame metrics in business terms. Instead of "We completed 47 user stories," report "We delivered 3 of 4 planned enterprise features, enabling our move upmarket. The fourth feature (SSO integration) is delayed 3 weeks due to vendor API changes."
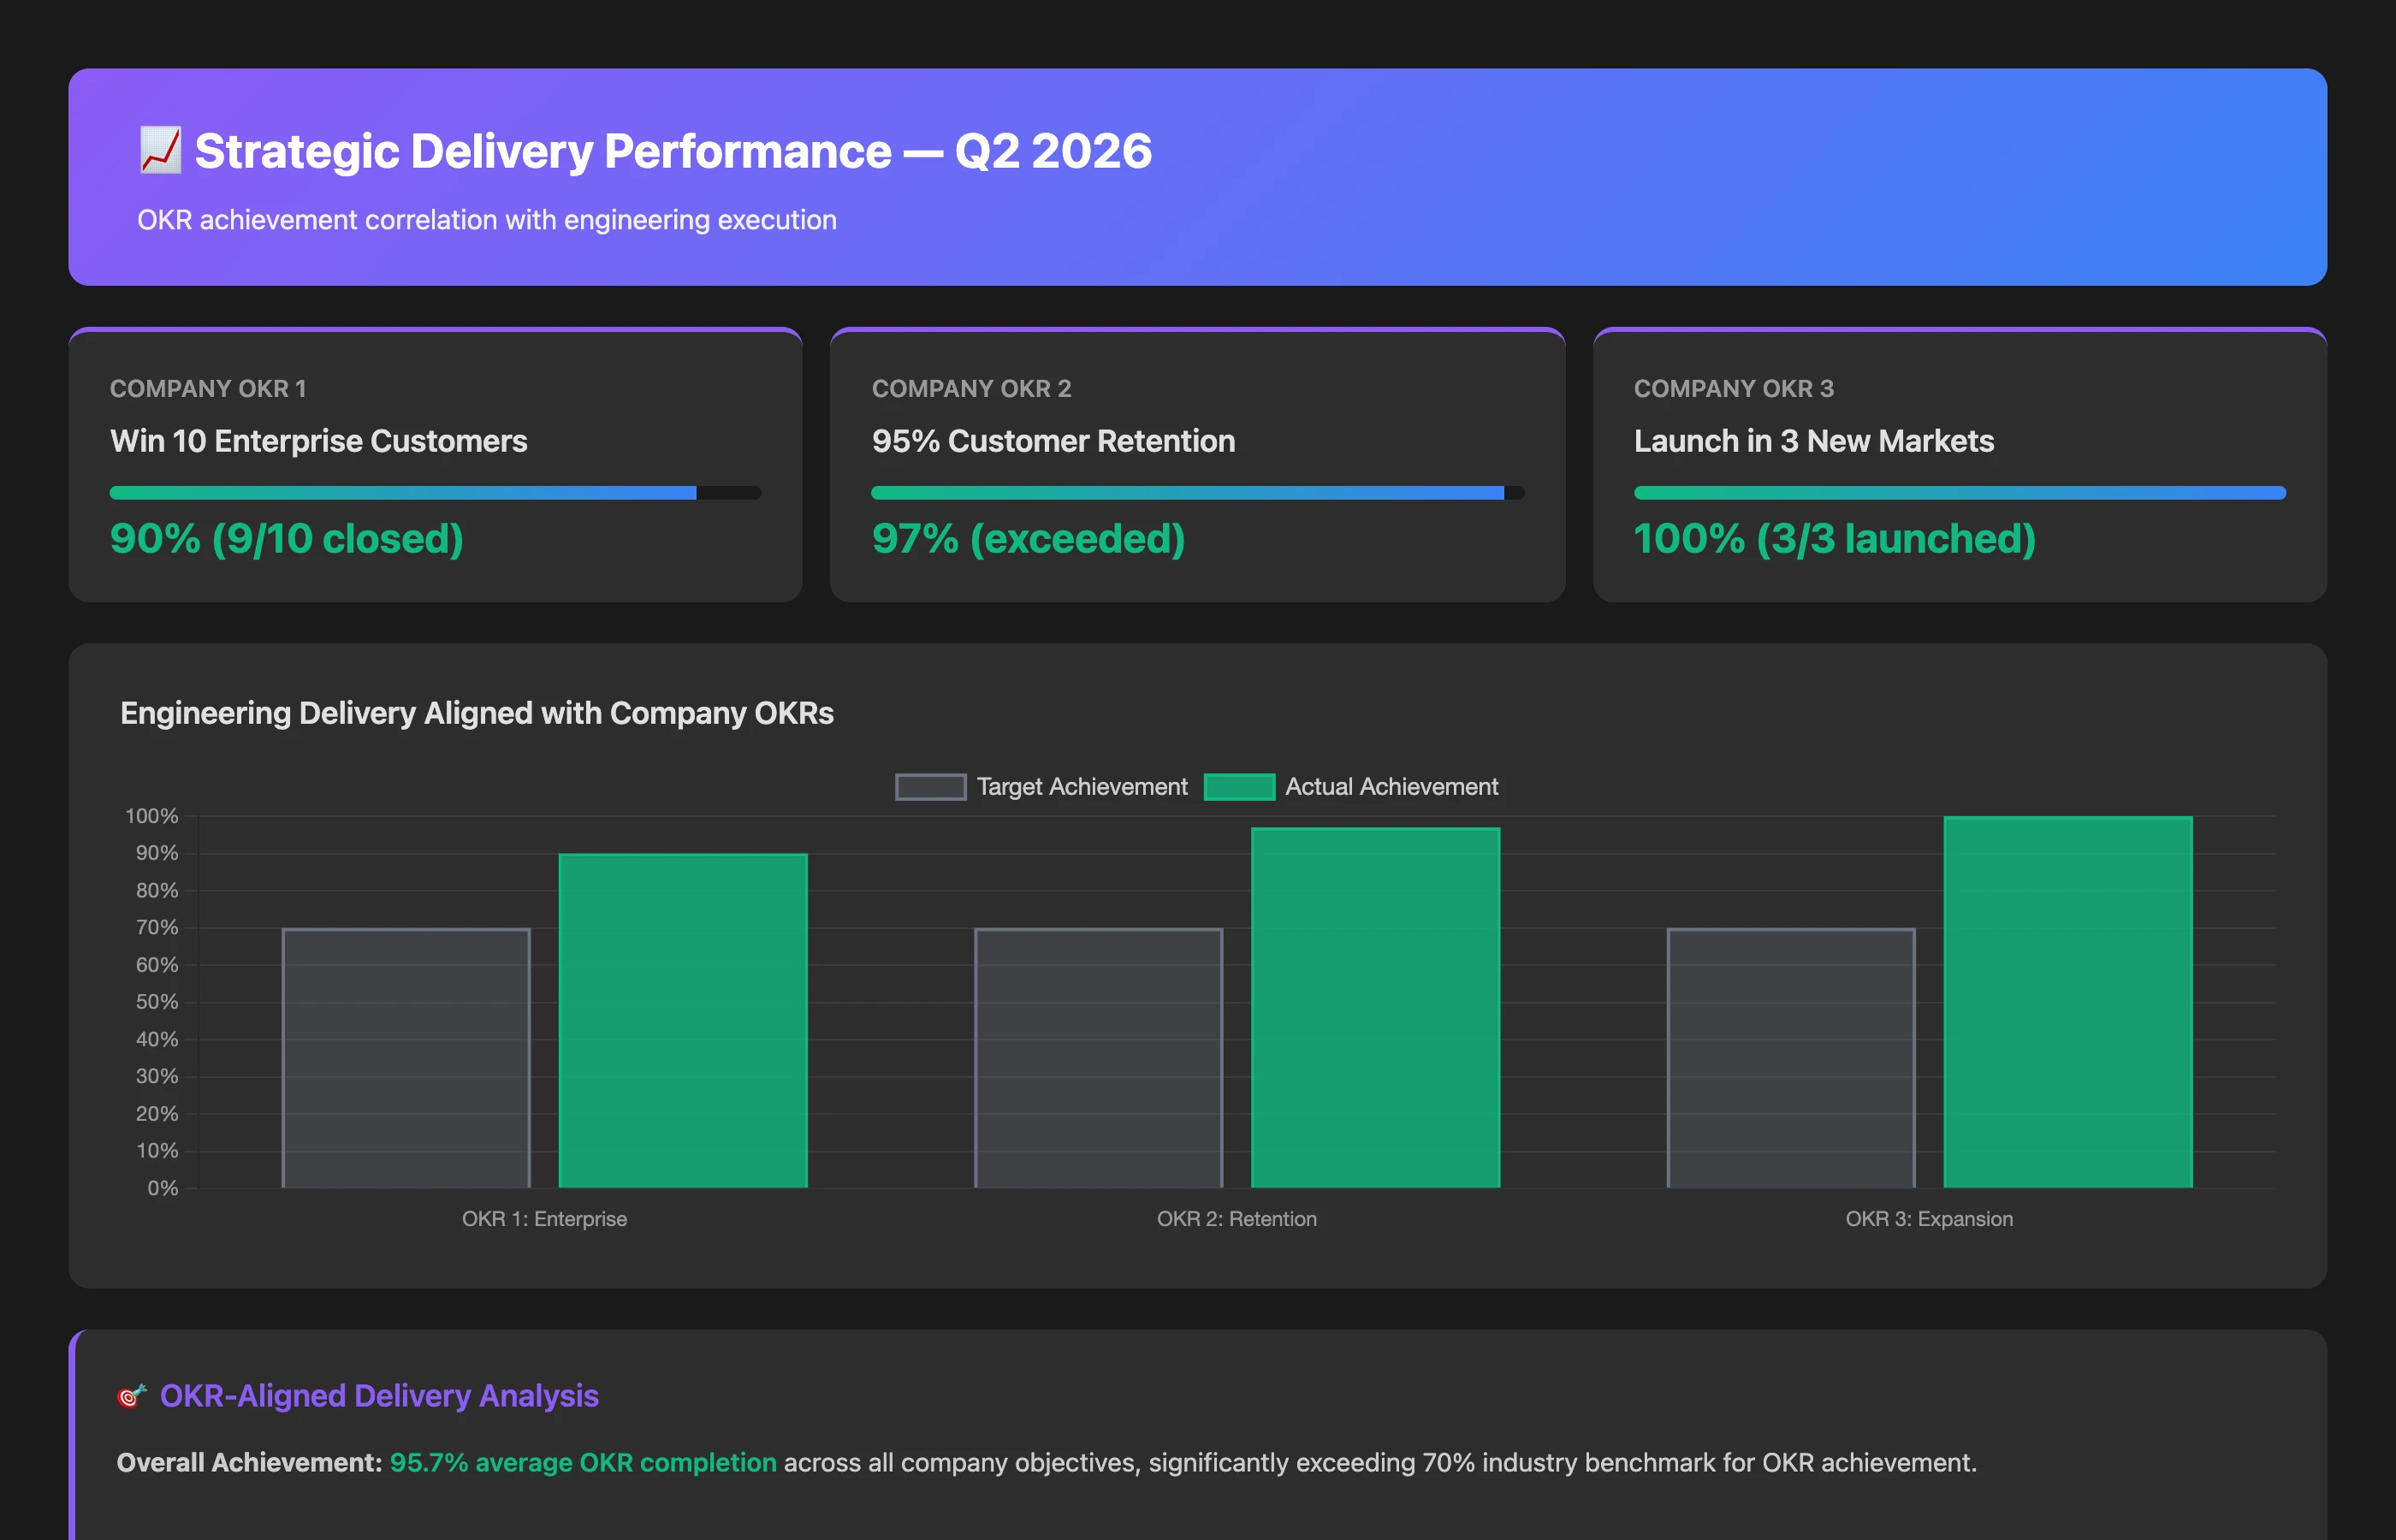
Generate a strategic delivery report for Q2 2026. Show: enterprise features planned vs. delivered, revenue-impacting initiatives completion status, customer-requested features delivered, and technical foundation work (% of total effort). For each delayed initiative, include root cause and revised timeline. Correlate delivery performance with company OKR achievement.
Financial Connection: The most powerful enhancement is connecting delivery performance to revenue impact. "The 3-week SSO delay means we can't close the $500K Acme Corp deal until Q3" transforms an engineering metric into a business decision point.
What to Report: Demonstrate that engineering investment generates appropriate returns and that efficiency improves over time as the organization matures.
Key Metrics:
- Cost per deployed feature (engineering expenses divided by production releases)
- Engineering cost as % of revenue (benchmark against industry standards)
- Efficiency trend (output per engineering dollar over time)
- Build vs. buy vs. partner allocation (strategic spend distribution)
Why It Matters: Boards allocate capital based on returns. Engineering must demonstrate that software development investment drives business value competitive with alternative uses of capital (sales expansion, marketing, M&A).
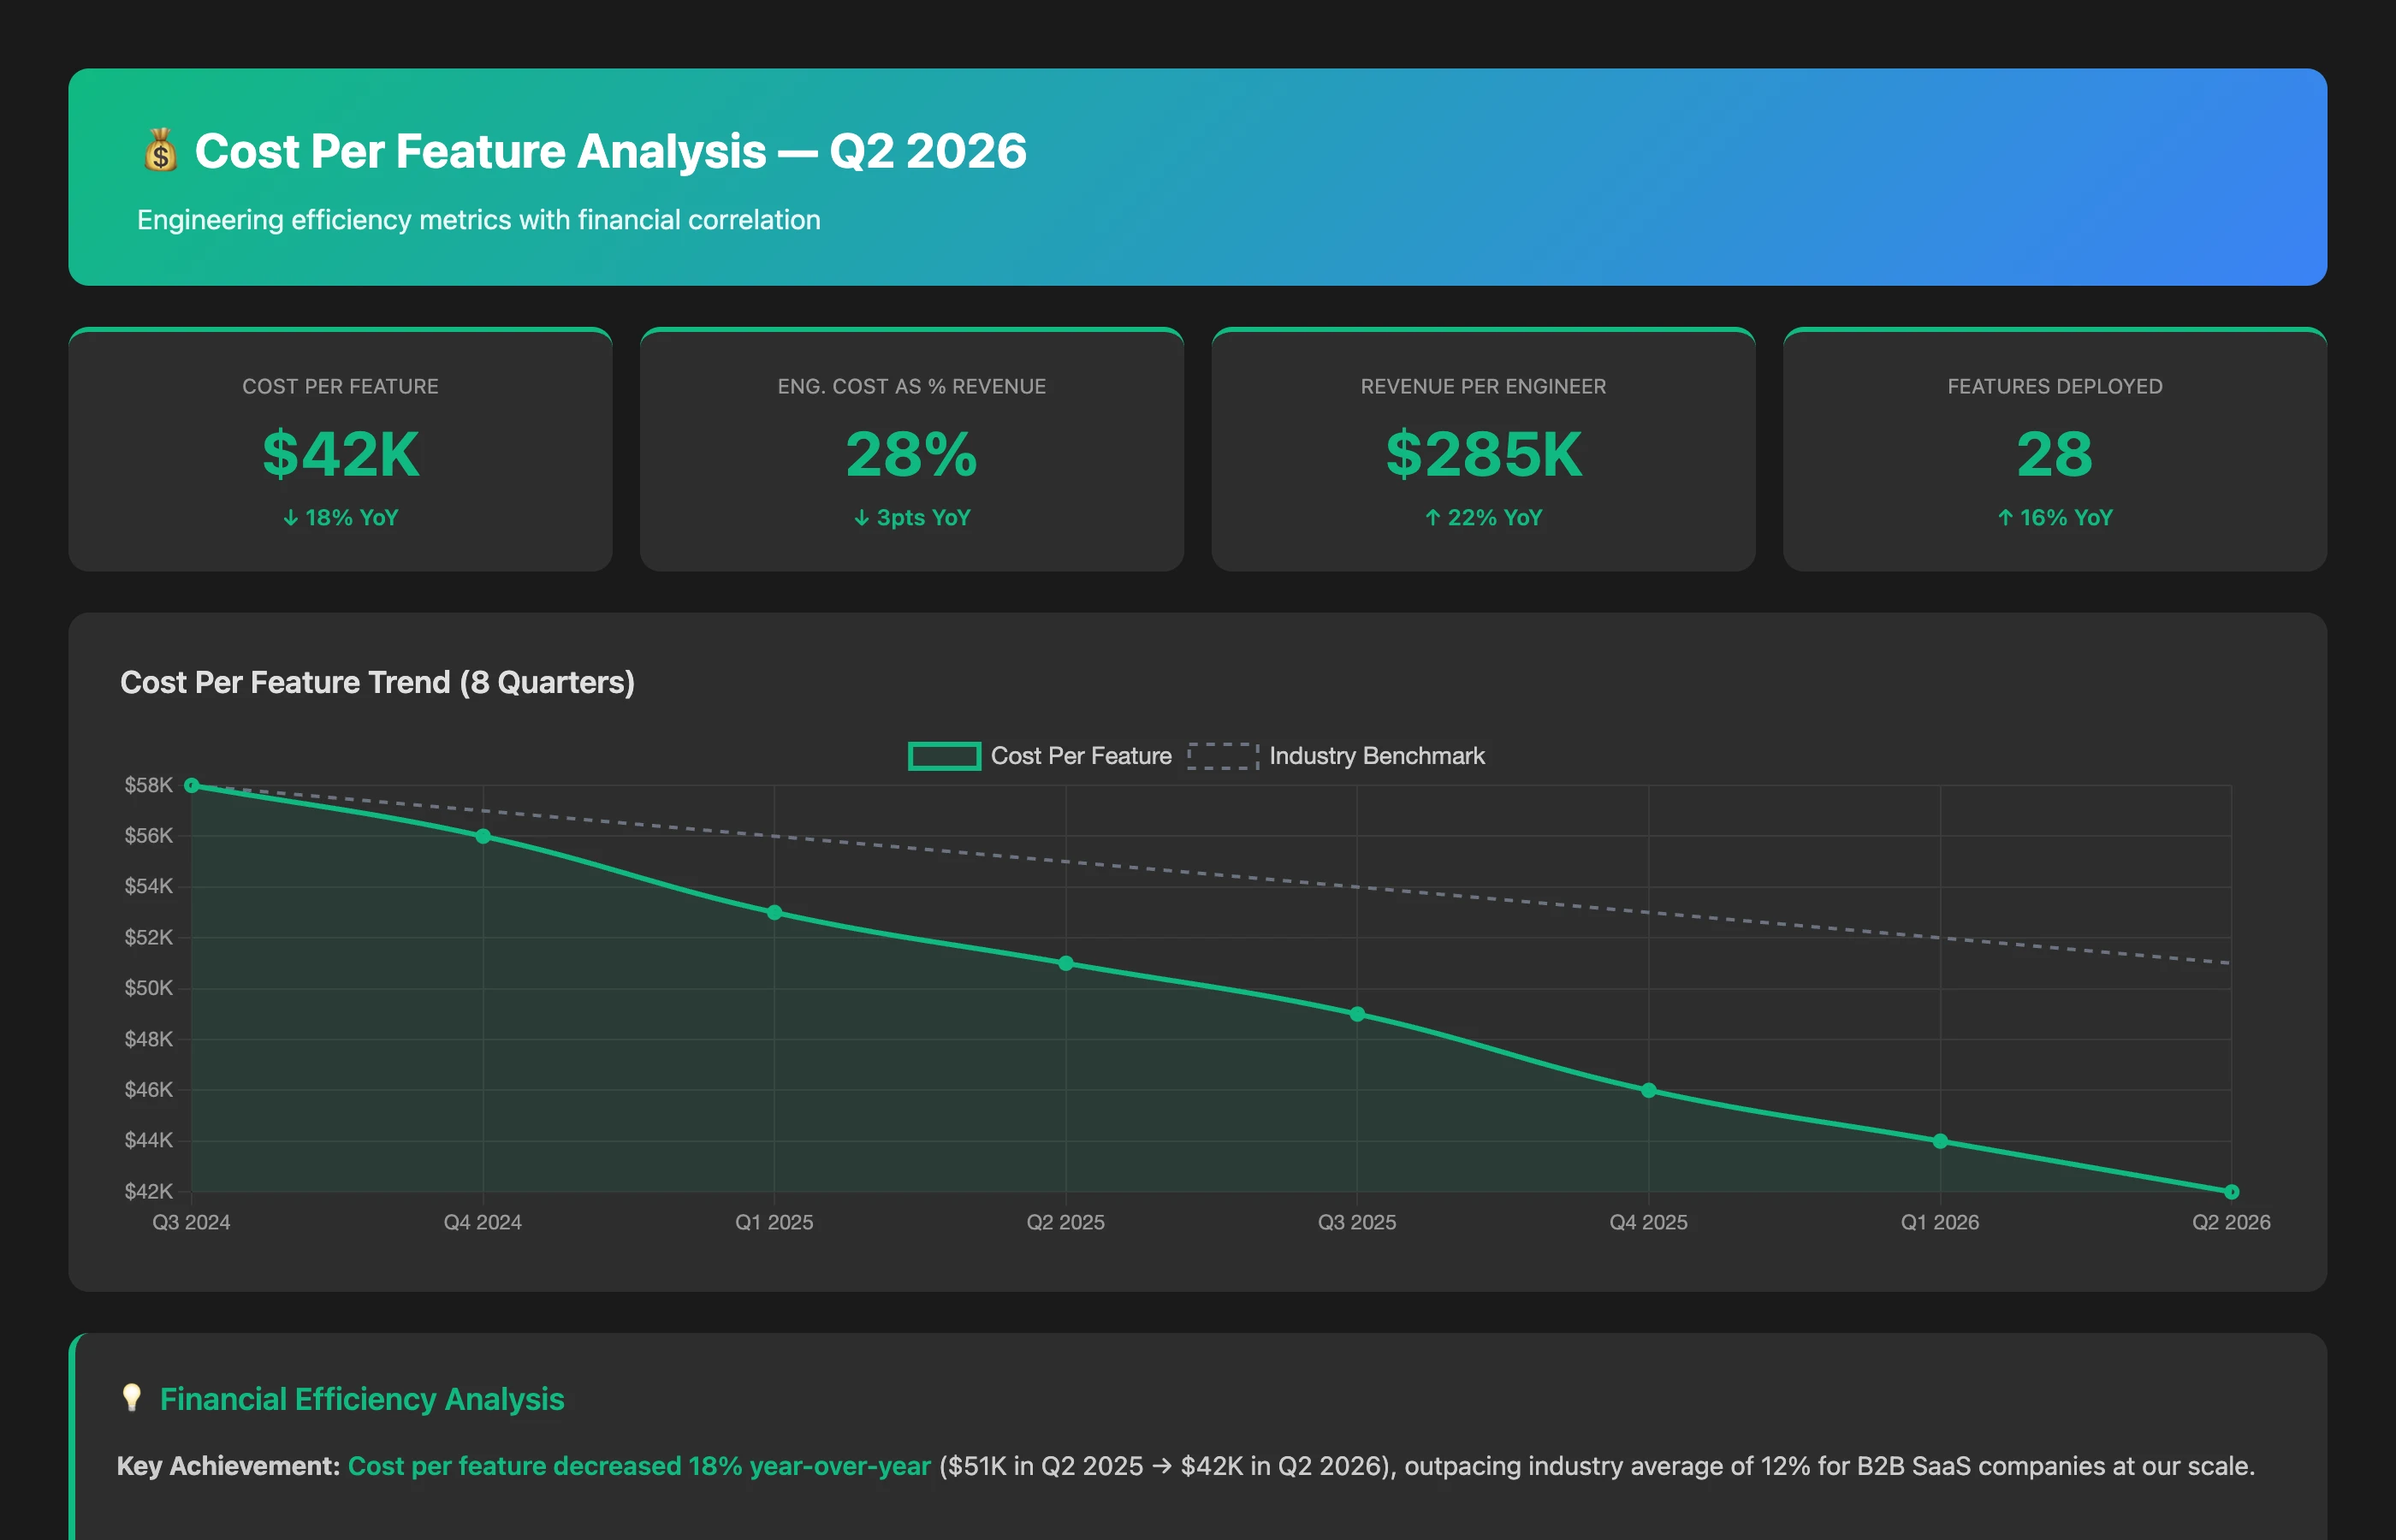
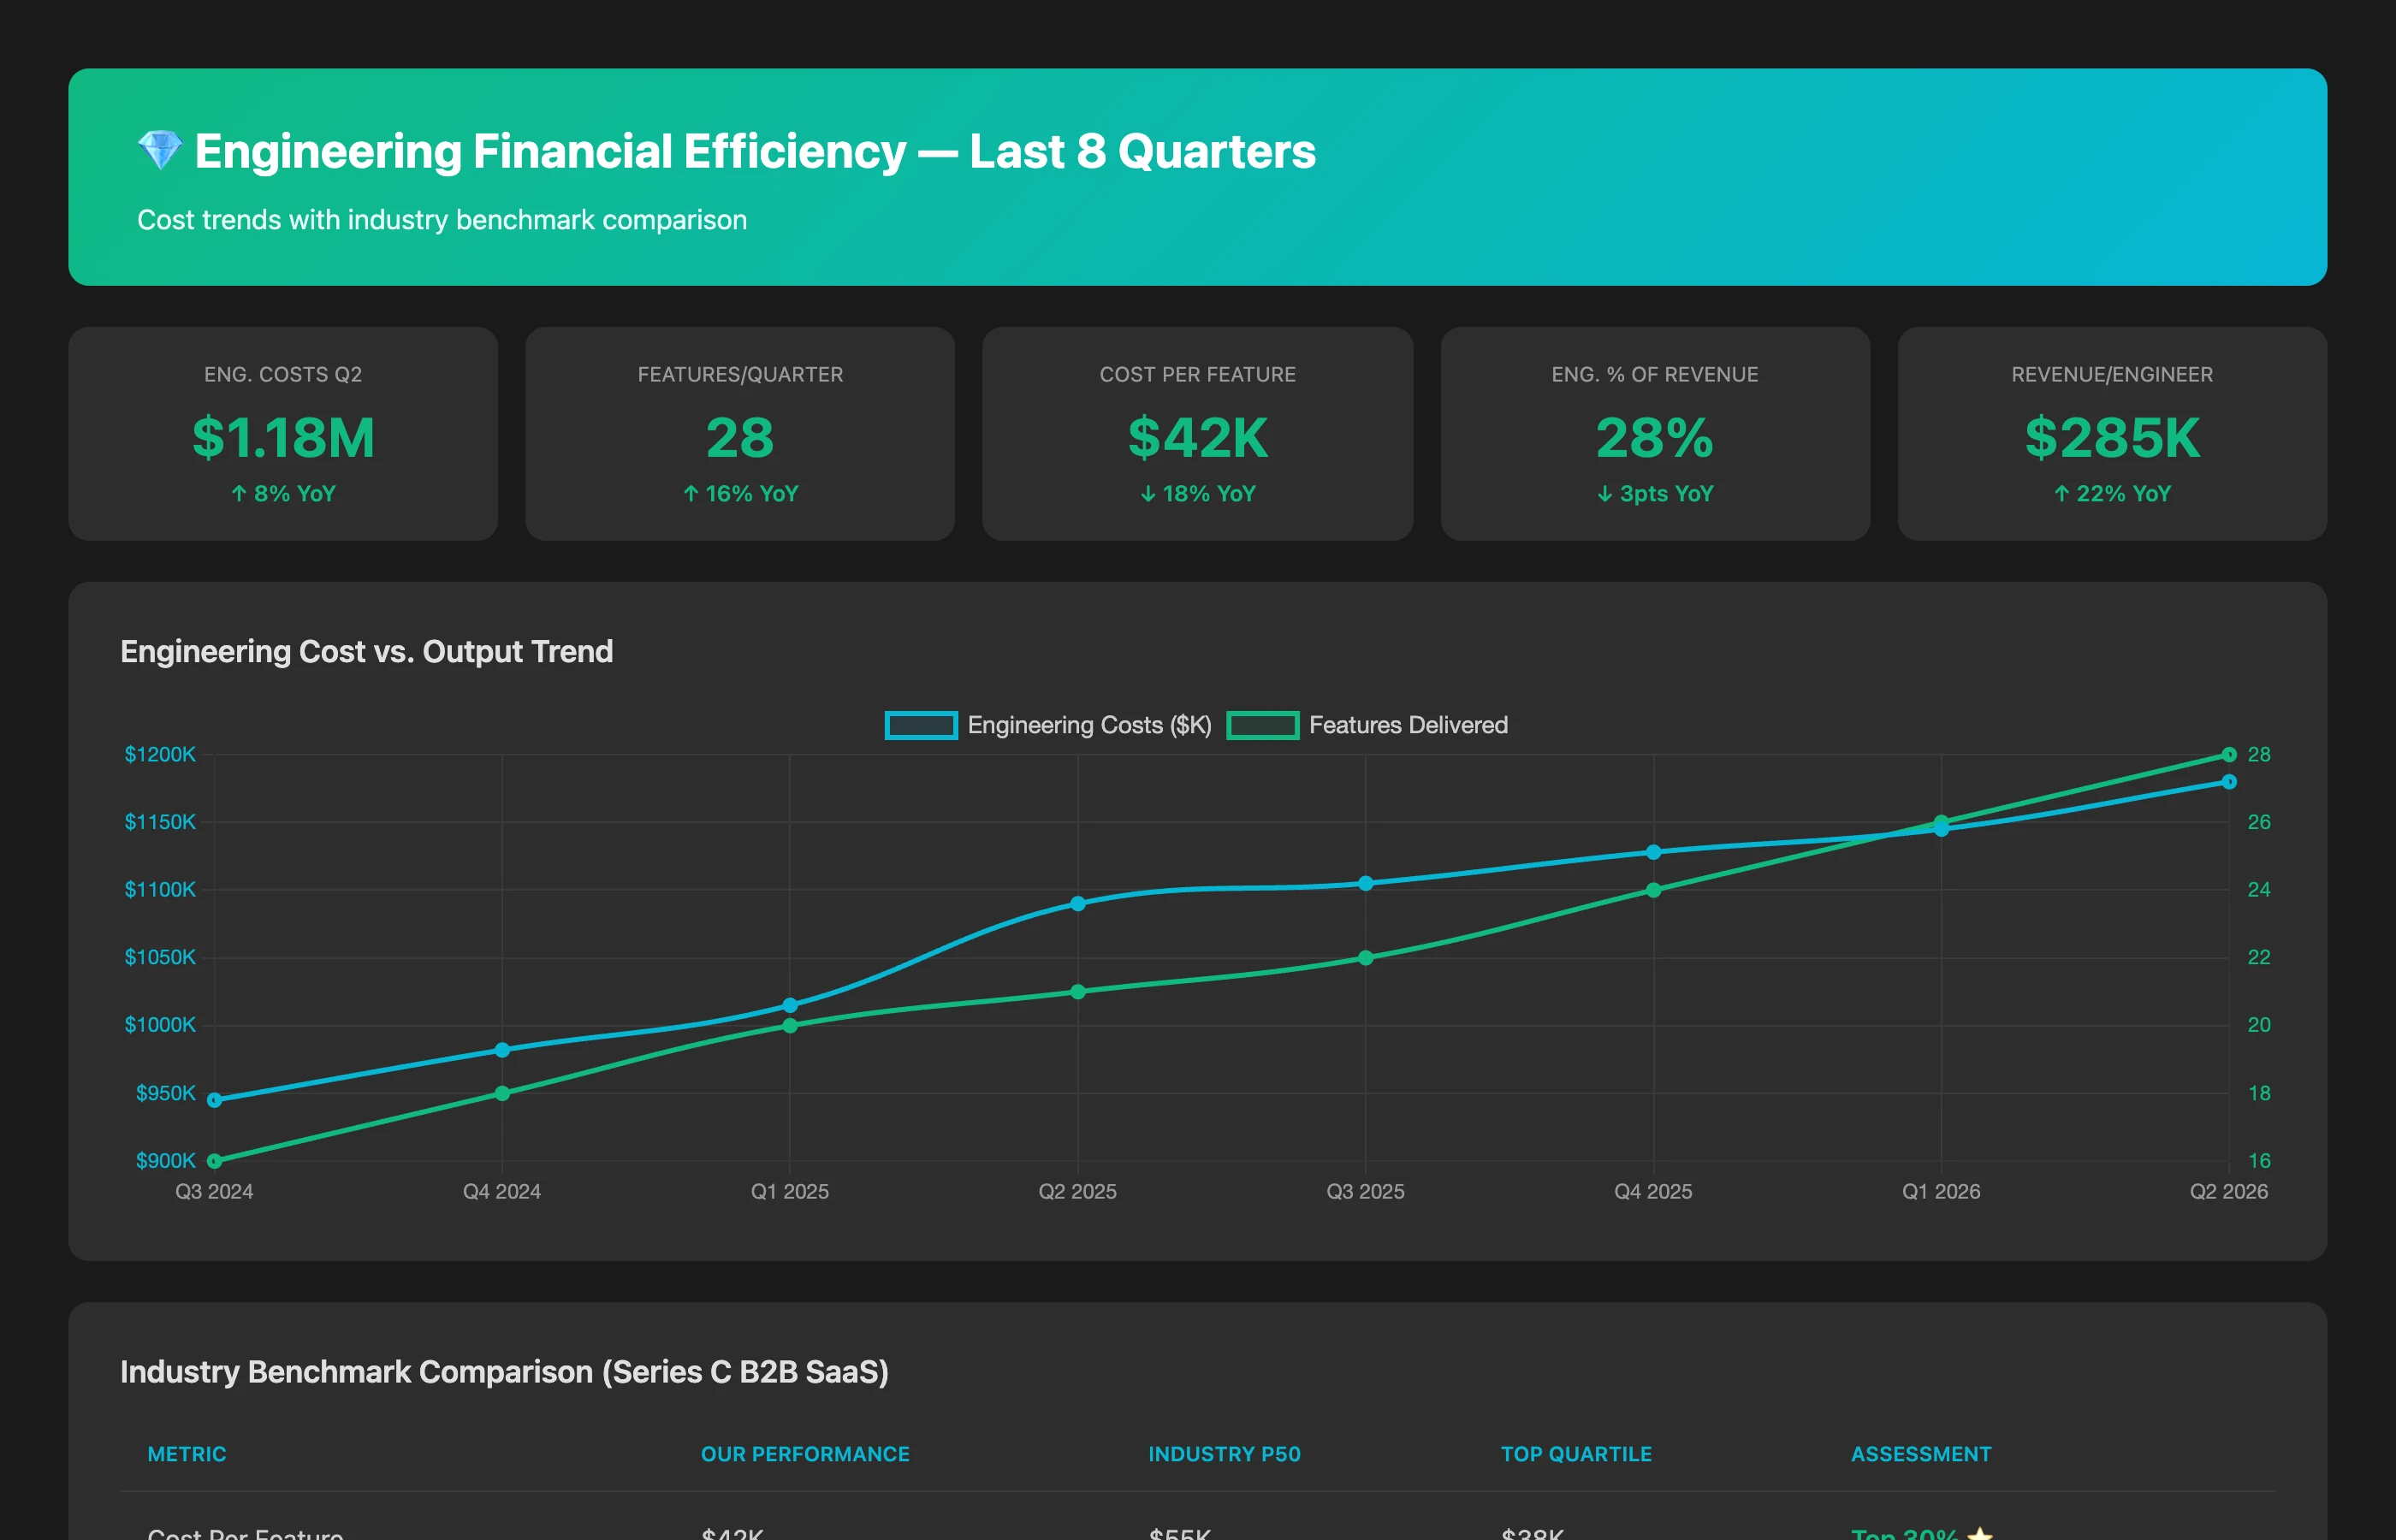
Presentation Approach: Always show trends (quarter-over-quarter or year-over-year) to demonstrate improvement. Contextualize with industry benchmarks: "Our cost per feature decreased 18% year-over-year, outpacing the industry average of 12% according to DORA research."
Calculate engineering financial efficiency metrics for the last 8 quarters. Include: total engineering costs (loaded personnel costs + infrastructure + tooling), features deployed to production, cost per feature, engineering cost as % of company revenue, and revenue per engineer. Show trends and calculate improvement rates. Compare our cost per feature against industry benchmarks for B2B SaaS companies of similar scale.
Advanced Analysis: The most sophisticated boards want to understand marginal efficiency: "If we add 10 engineers, how much additional output can we expect?" This requires analyzing historical data on team size, output, and coordination overhead to model scaling economics.
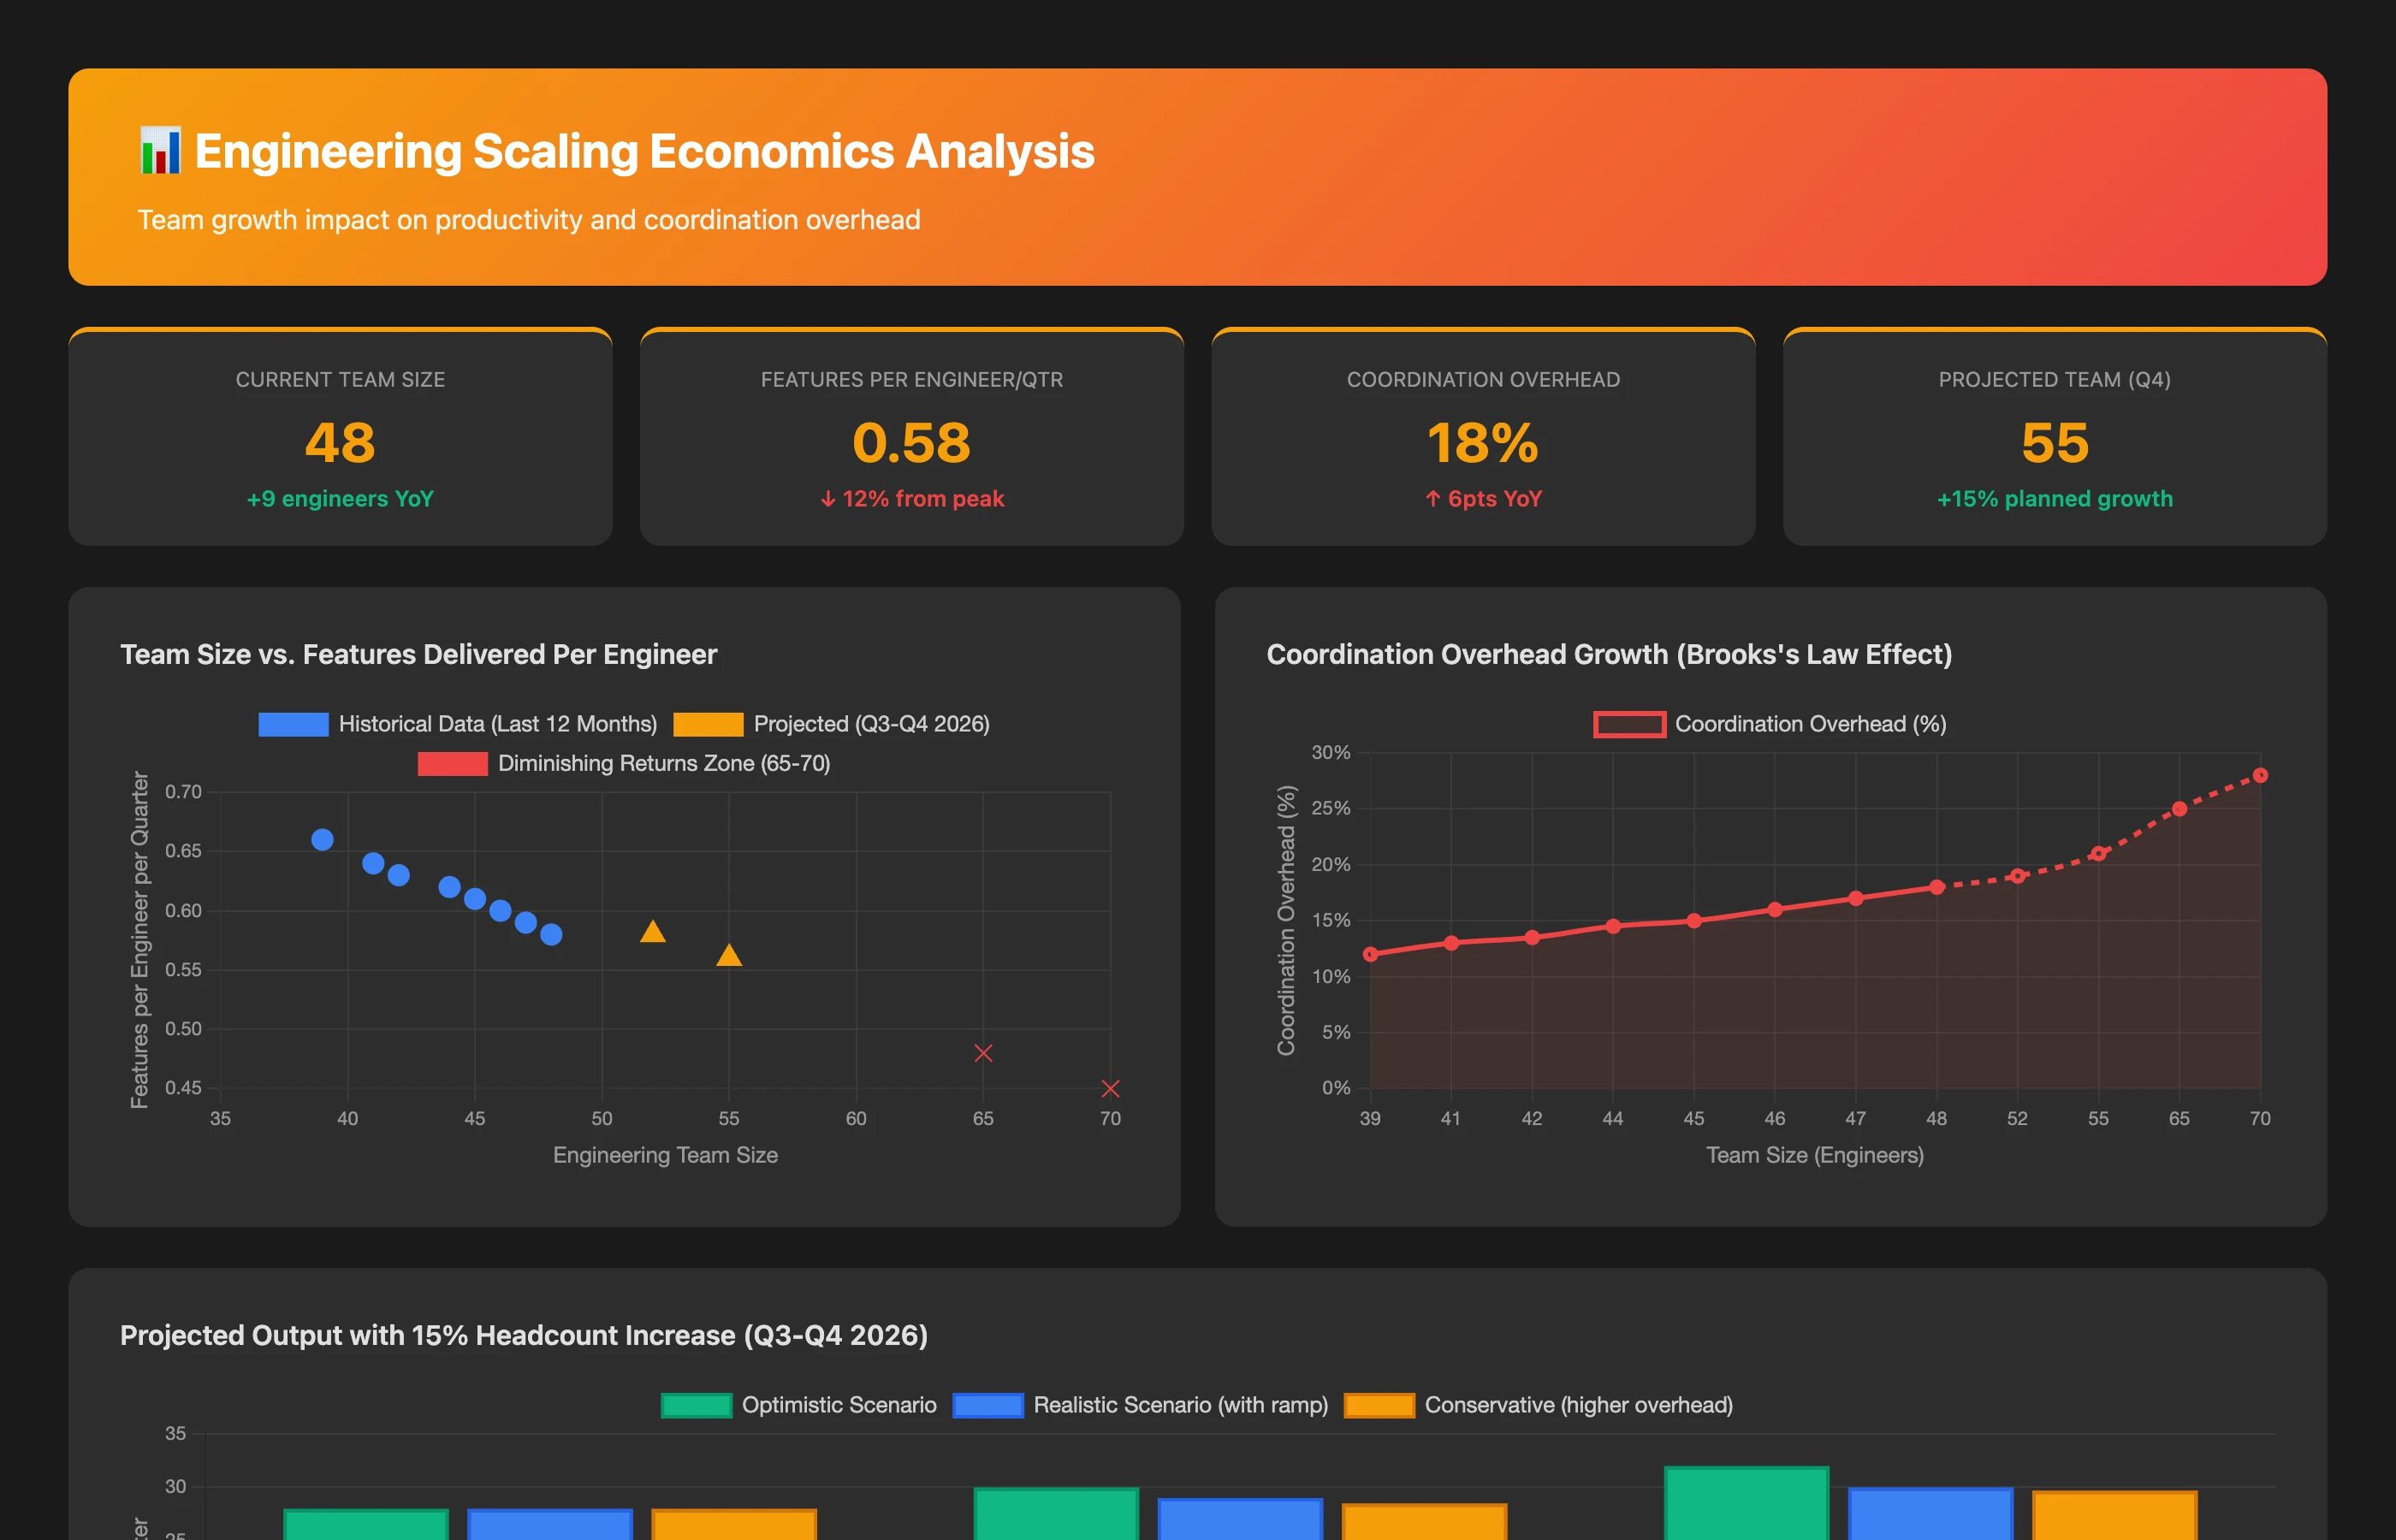
Model engineering scaling economics. Show: engineering headcount over last 12 months, features delivered per engineer per quarter, and calculated coordination overhead (efficiency loss as team size grows). Project expected output if we increase headcount by 15% as planned for Q3-Q4. Identify the point where marginal returns diminish significantly.
Financial Connection: Understanding scaling economics enables data-driven hiring decisions. The analysis shows our planned 15% headcount increase (48 → 55 engineers) remains within optimal scaling range, projecting 7-11% net productivity gain and $2.0M incremental annual revenue against $1.05M cost (1.9:1 ROI). However, the analysis also identifies that beyond 65-70 engineers, coordination overhead exceeds 25% and marginal returns drop to 0.3-0.4 features per engineer—indicating when organizational restructuring becomes necessary to maintain efficiency.
Category 3: Quality, Reliability & Technical Health
What to Report: Demonstrate that quality and reliability support business growth and customer retention, and that technical debt is managed strategically rather than accumulating dangerously.
Key Metrics:
- Customer-impacting incidents (frequency, severity, MTTR)
- Deployment success rate and rollback frequency
- Defect escape rate (bugs found in production vs. caught pre-release)
- Technical debt ratio and paydown progress
- DORA metrics (deployment frequency, lead time, change failure rate, MTTR)
Why It Matters: Poor quality and reliability directly impact revenue (churn, brand damage) and cost (support burden, emergency fixes). Technical debt creates strategic constraints that limit future execution capability.
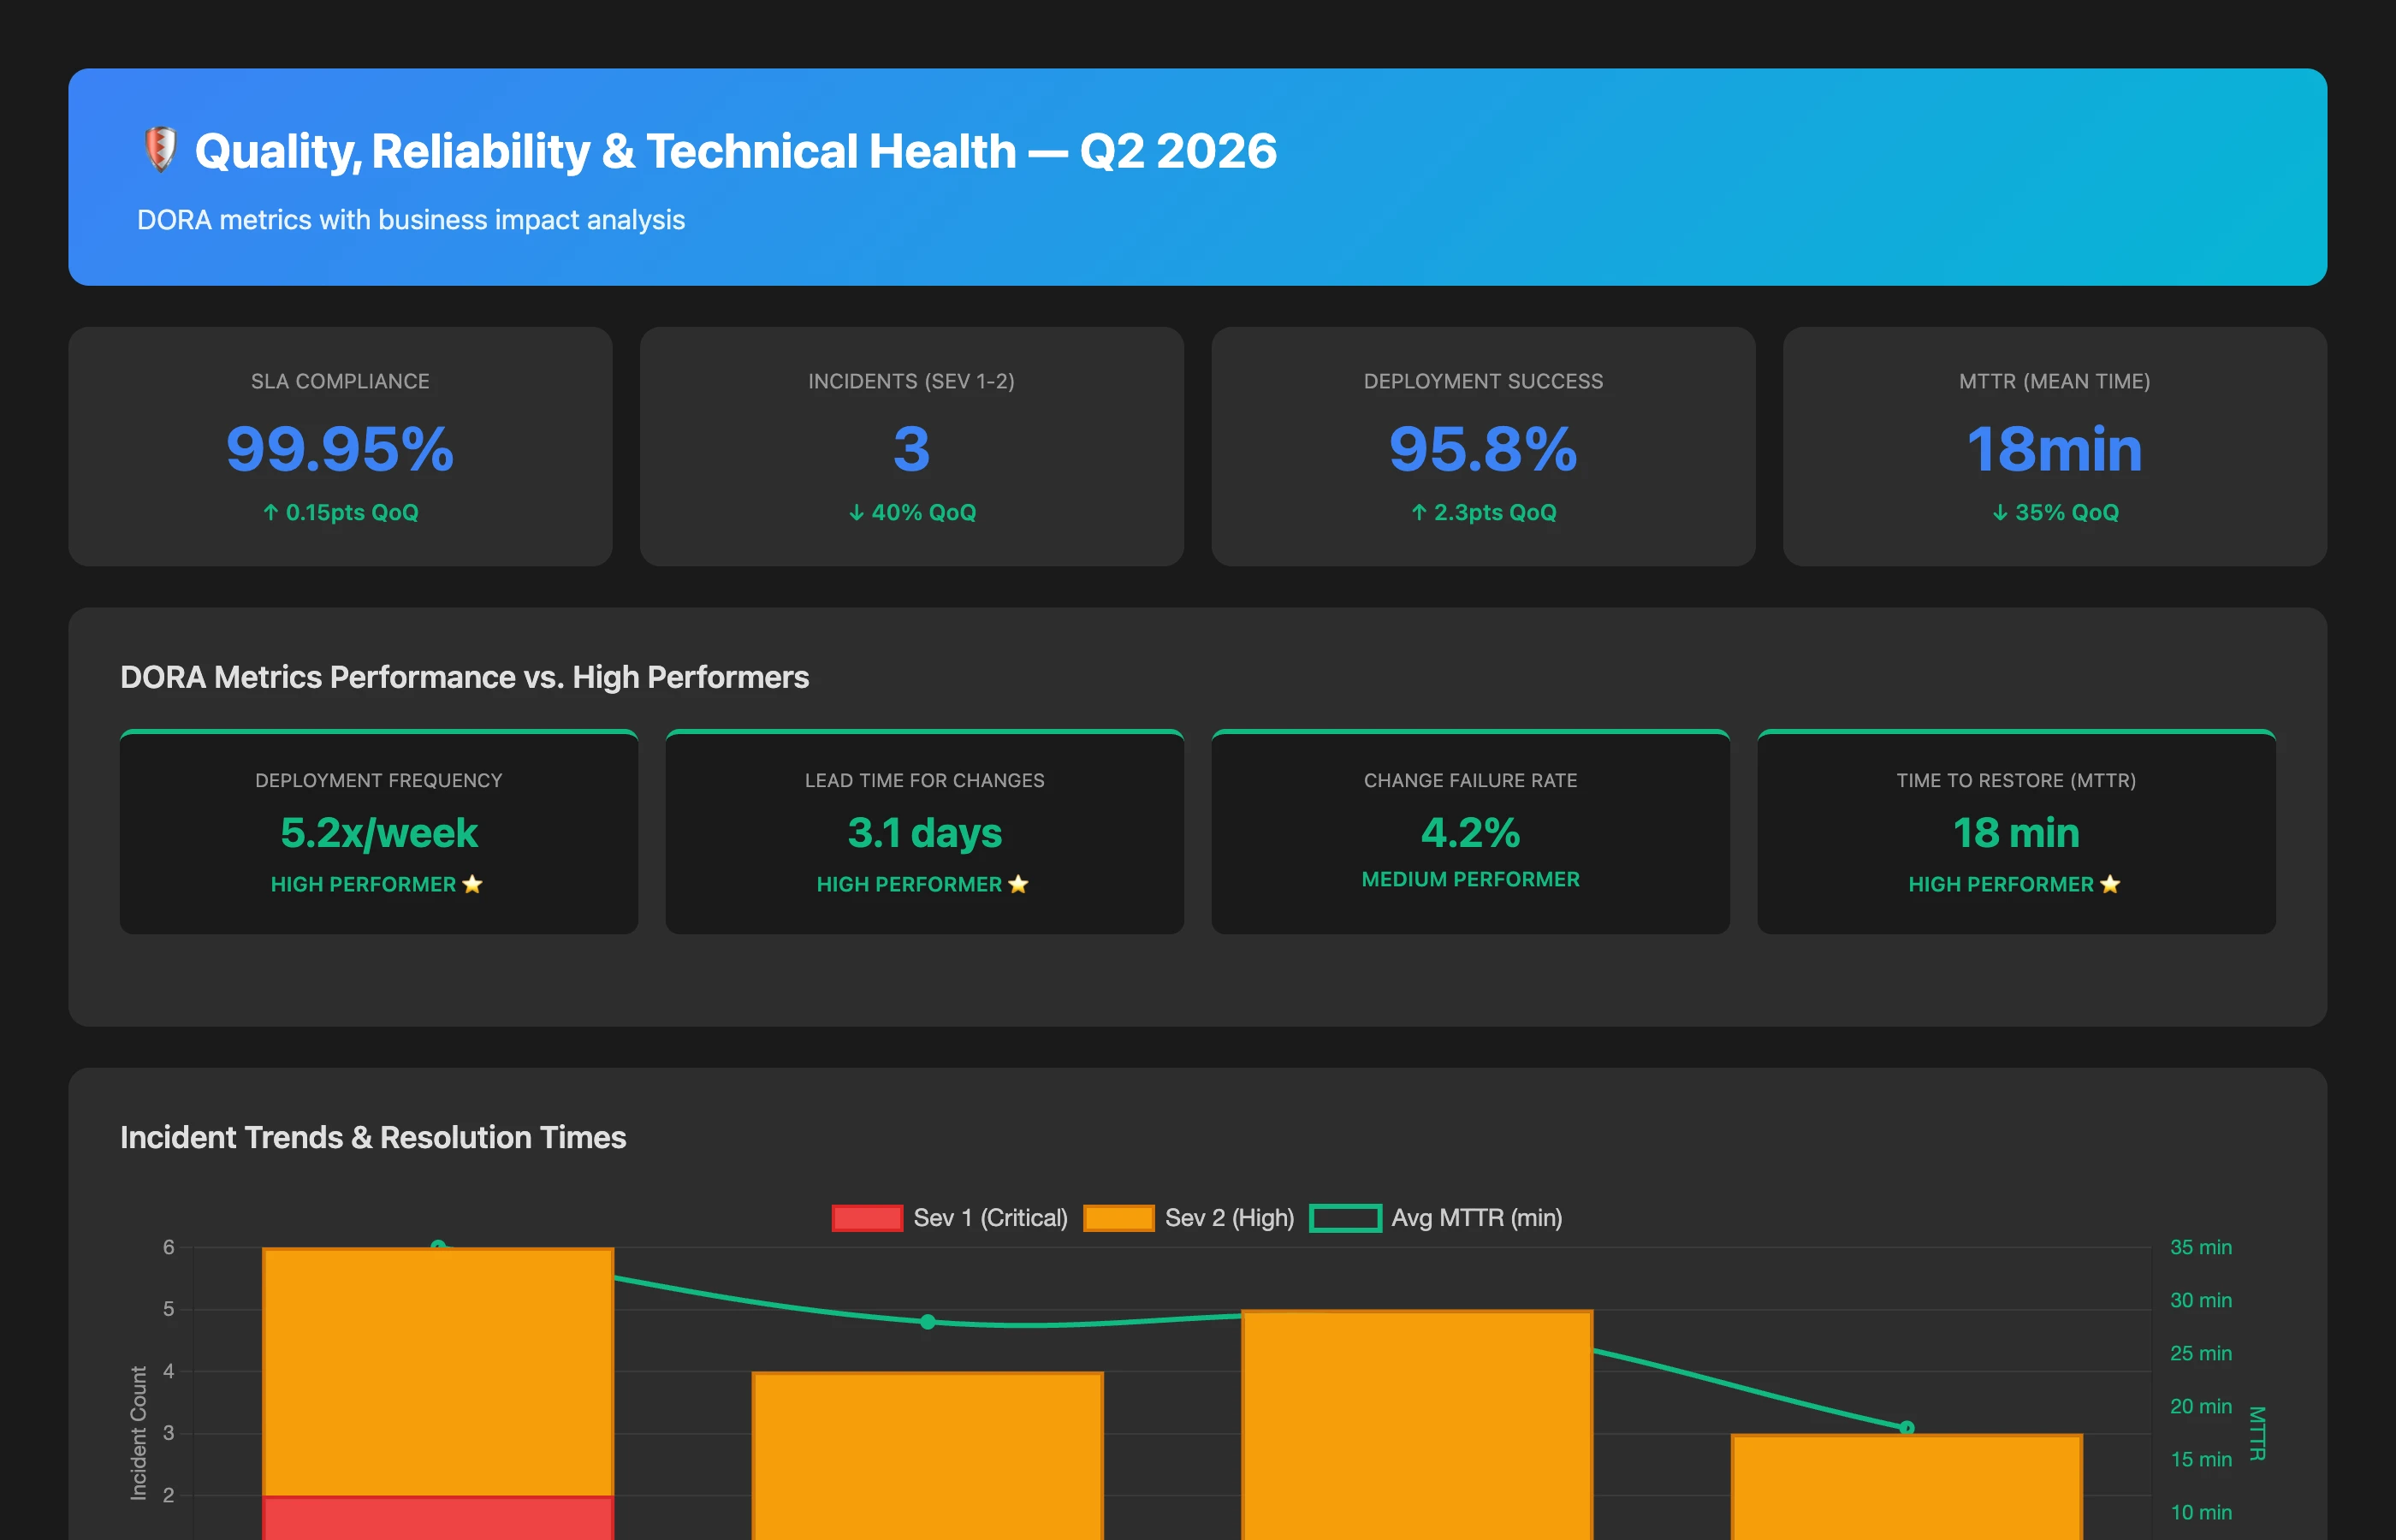
Presentation Approach: Translate technical metrics into business impact. Instead of "Change failure rate was 4.2%," report "98 of 100 deployments succeeded without rollback, maintaining our 99.95% SLA and avoiding the $50K penalty clause in our largest customer contract."
Generate a quality and reliability board report for Q2 2026. Include: customer-impacting incidents by severity, SLA compliance rates, DORA metrics compared to high-performing organizations, deployment risk analysis, and technical debt assessment. For any concerning trends, provide root cause analysis and remediation plans. Calculate the business cost of quality issues: incident-related churn, support burden, and penalty clause exposure.
Strategic Framing: Position quality investment as strategic enablement. "We invested 20% of Q2 engineering time in platform reliability improvements. This enabled us to pursue enterprise customers requiring 99.99% SLAs, opening a $15M annual addressable market previously inaccessible."
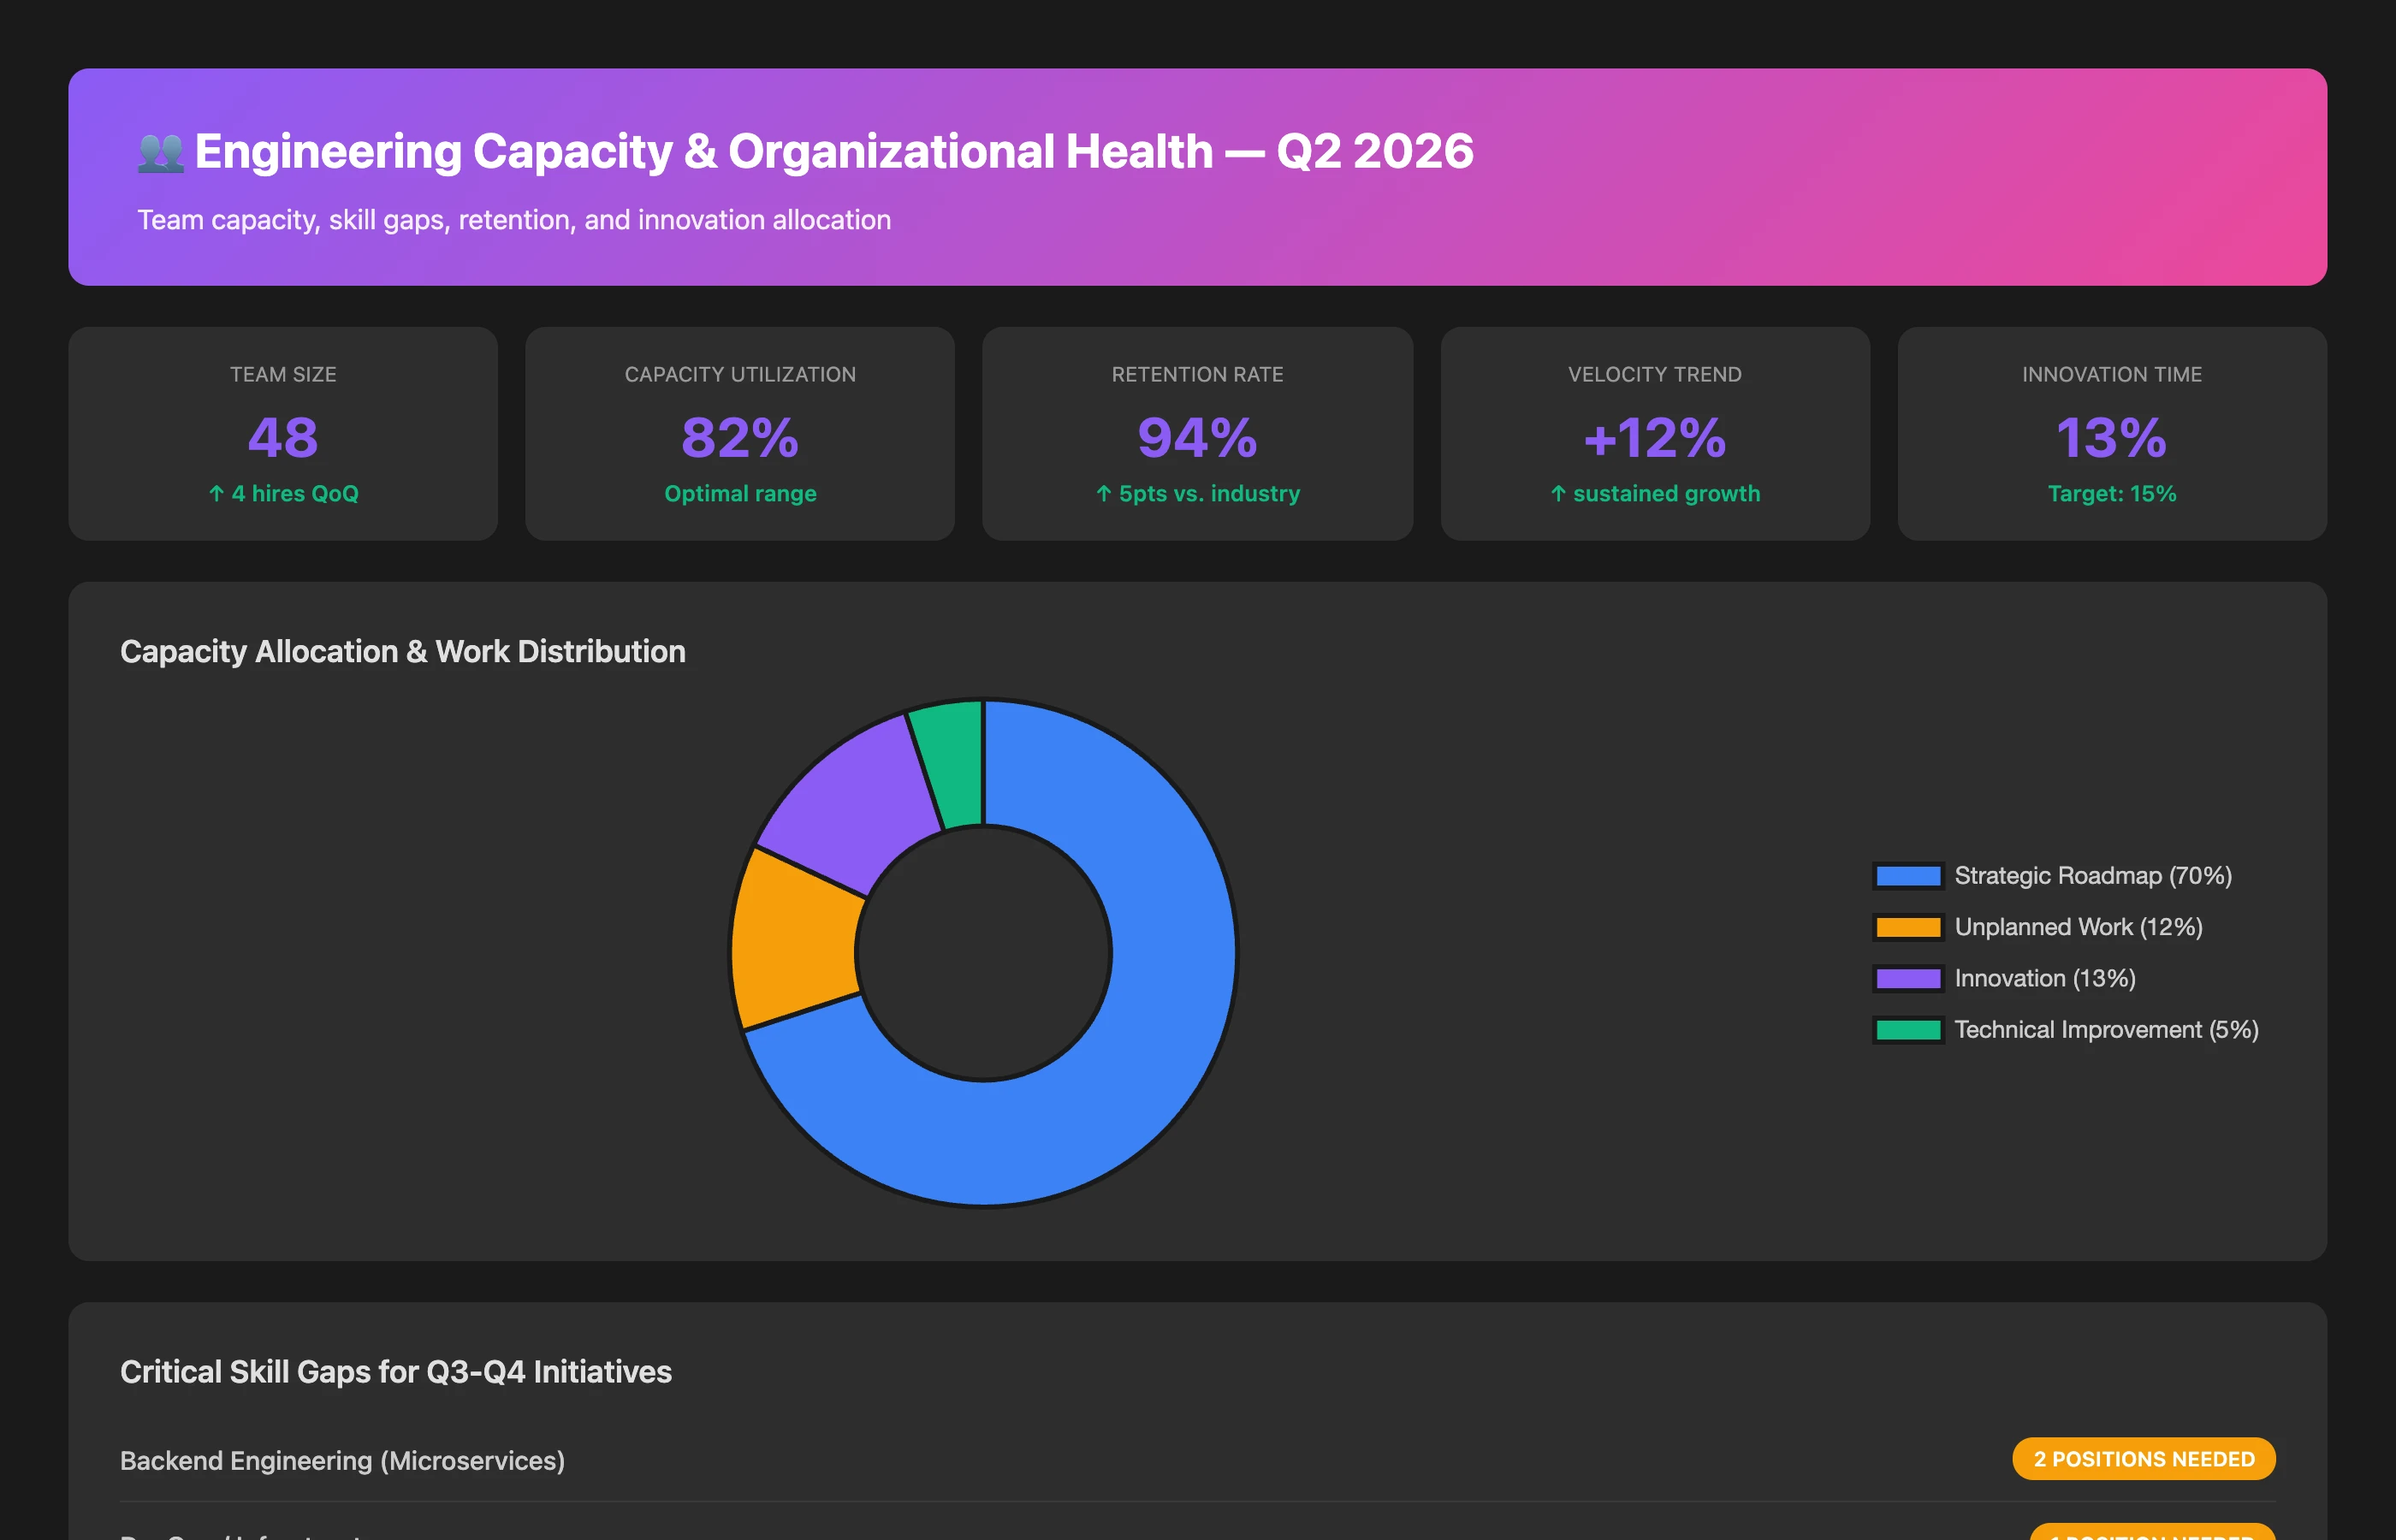
Category 4: Capacity, Capability & Organizational Health
What to Report: Demonstrate that the engineering organization can support planned business growth and that you're building sustainable capability rather than burning out the team.
Key Metrics:
- Engineering capacity utilization (planned work vs. available capacity)
- Team velocity trends (sustainable output over time)
- Critical skill gaps and hiring progress
- Engineering retention rate and attrition cost
- Innovation time (% of capacity allocated to exploratory work)
Why It Matters: Boards invest in engineering organizational capability as a strategic asset. They need confidence that current capacity supports planned growth and that the organization attracts, develops, and retains talent.
Presentation Approach: Connect capacity to business scalability. "Our current engineering capacity can support 300% customer growth before requiring additional headcount, giving us 18 months of runway at projected acquisition rates."
Analyze engineering capacity and organizational health for Q2 2026. Show: team capacity utilization trends, velocity sustainability assessment, critical skill gaps for planned Q3-Q4 initiatives, recruiting pipeline status, retention rate compared to industry benchmarks, and innovation capacity (time allocated to technical exploration vs. roadmap execution). Flag any capacity constraints that could limit planned business growth.
Financial Connection: Quantify retention value. "Our 94% engineering retention rate (vs. 89% industry average) saves approximately $850K annually in recruiting, onboarding, and productivity ramp costs, while maintaining institutional knowledge that accelerates delivery."
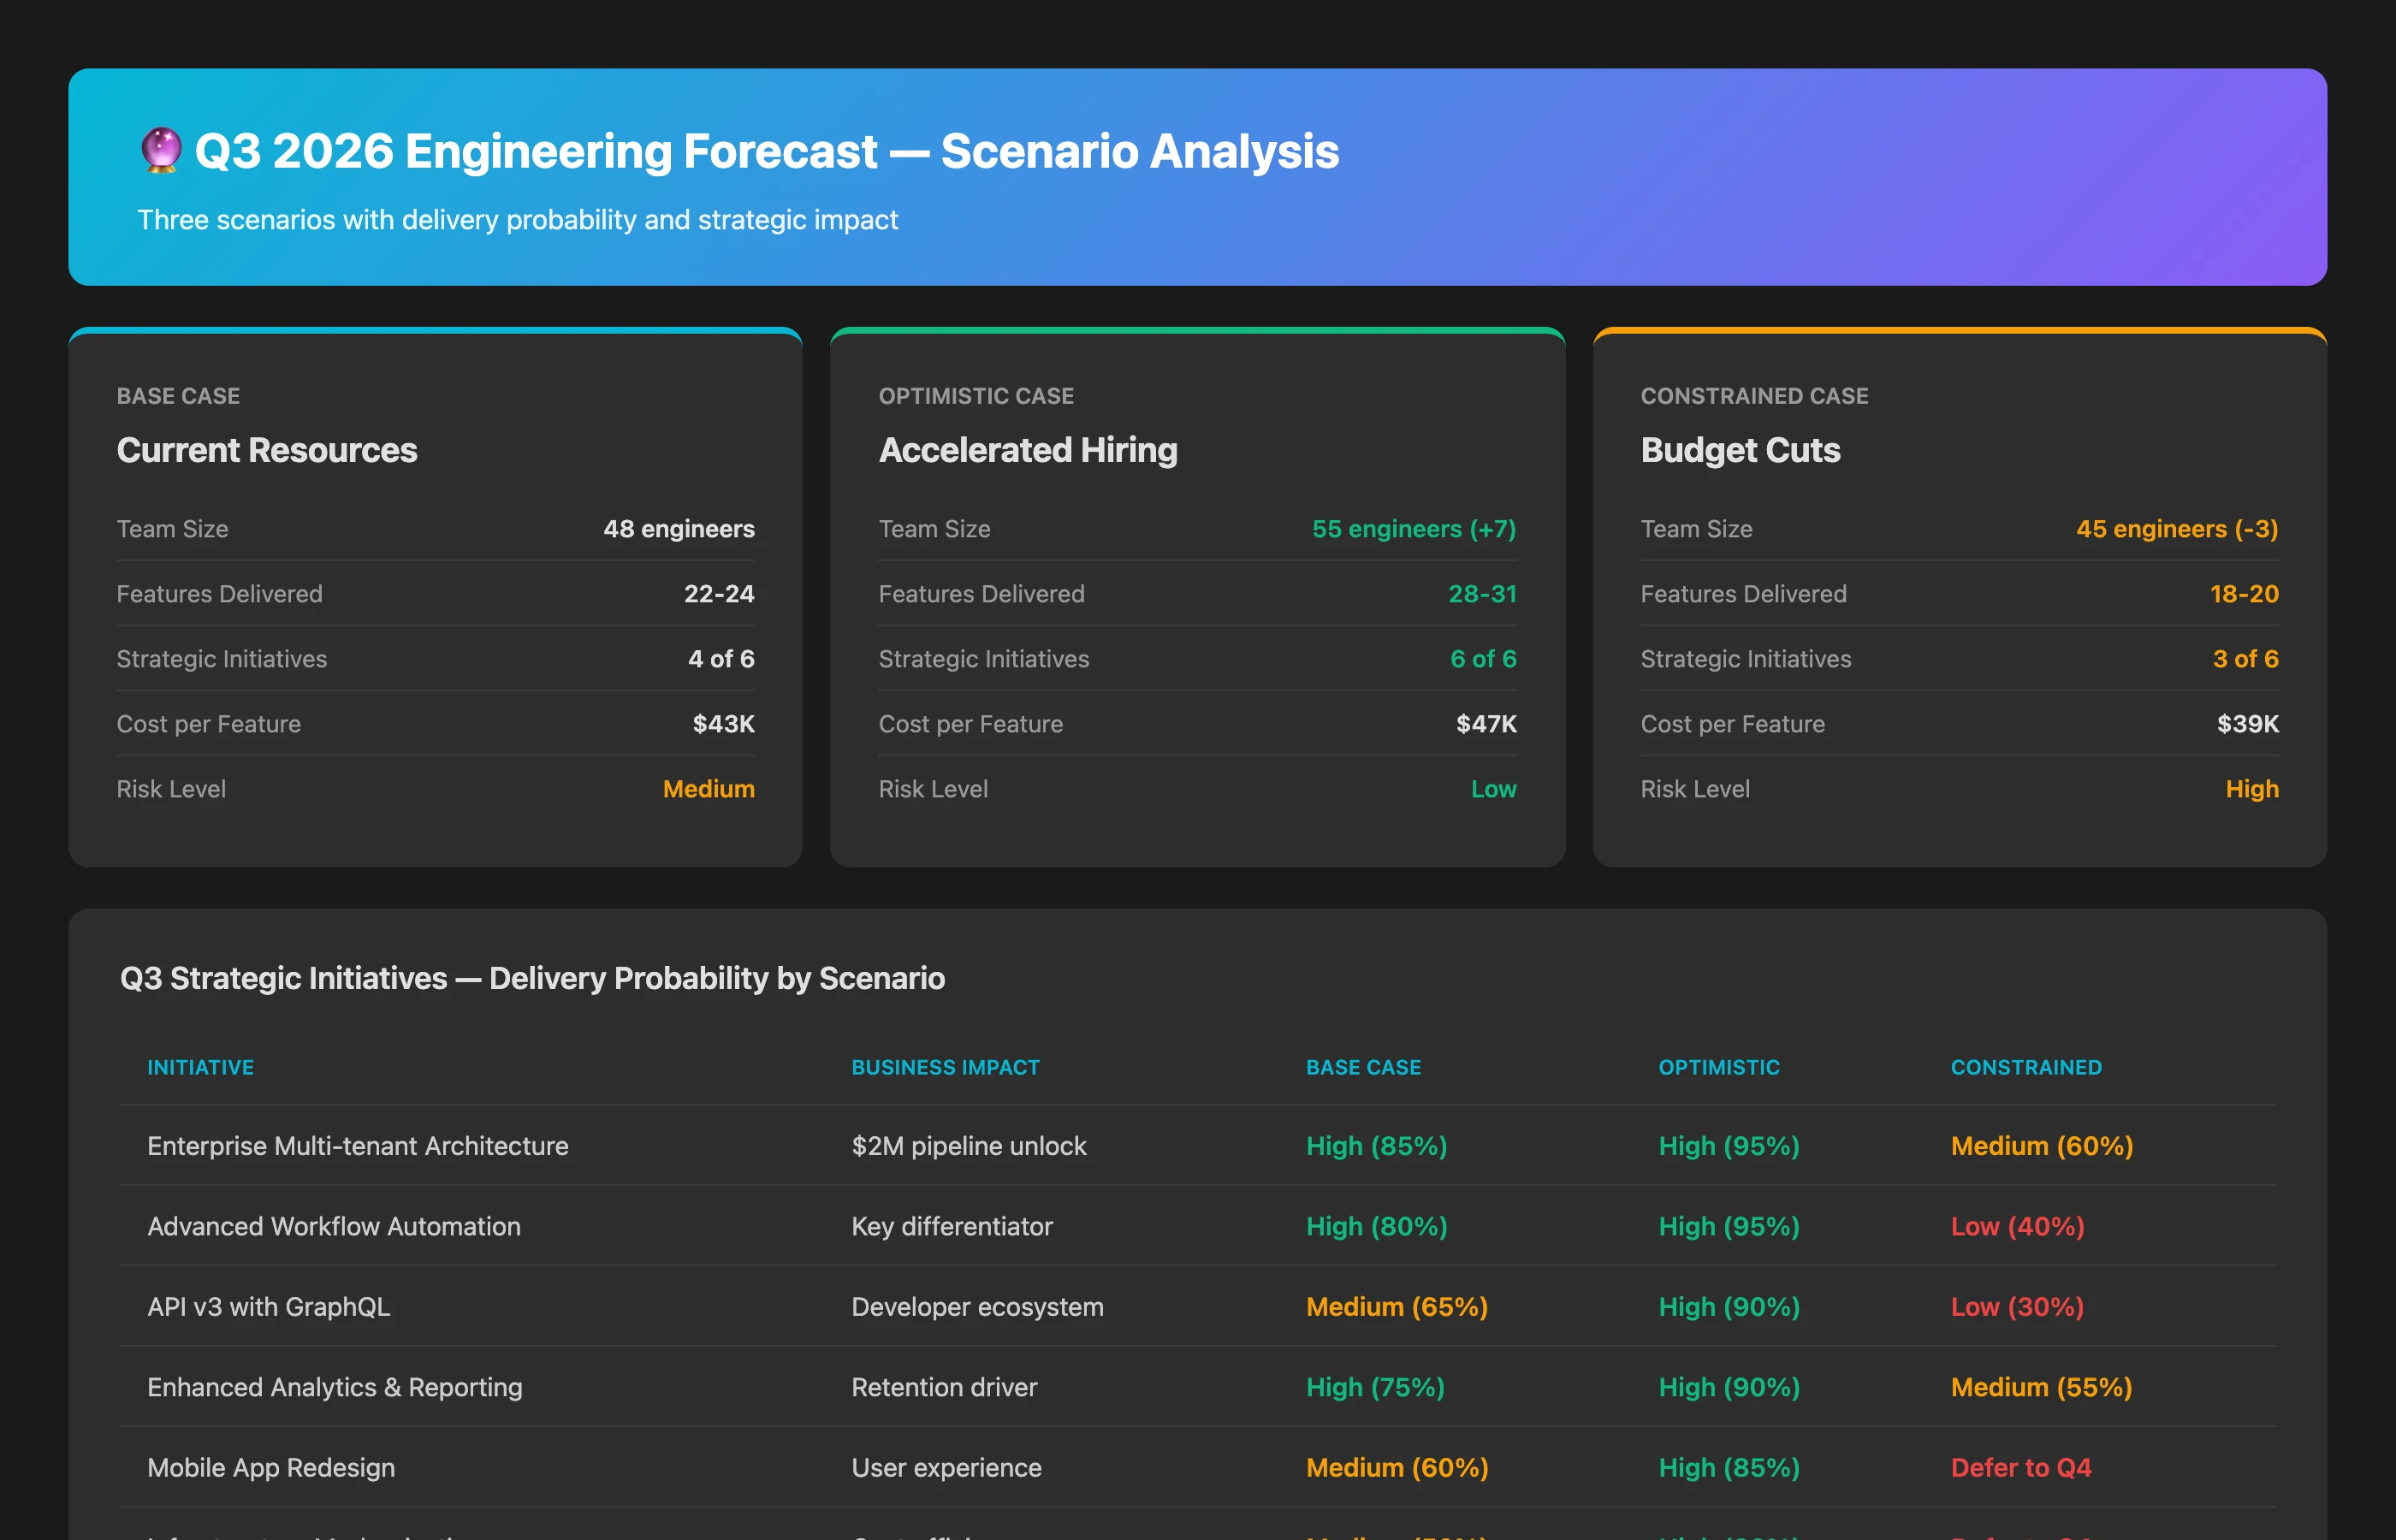
Category 5: Forward-Looking Forecast & Strategic Recommendations
What to Report: Provide predictive intelligence that enables proactive strategy adjustments rather than reactive problem-solving.
Key Elements:
- Next quarter delivery forecast (high-confidence commitments vs. stretch goals)
- Emerging risks and mitigation strategies
- Strategic investment recommendations (where to allocate incremental resources)
- Competitive capability gaps and proposed solutions
Why It Matters: Boards exist to make forward-looking strategic decisions. Historical reporting without predictive intelligence provides limited decision-making value.
Presentation Approach: Clearly distinguish high-confidence forecasts from aspirational targets. "We have high confidence in delivering 4 of 6 planned Q3 features based on current velocity. The remaining 2 are stretch goals requiring external dependencies to resolve as expected."
Generate a forward-looking engineering forecast for Q3 2026. Include: planned strategic initiatives with delivery probability assessment, capacity forecast considering hiring plans and historical velocity, emerging technical risks with quantified business impact, and strategic investment recommendations (where additional resources would generate highest ROI). Compare multiple scenarios: base case (current resources), optimistic case (accelerated hiring), and constrained case (budget cuts or key departures).
Strategic Framing: Position recommendations as strategic options with clear trade-offs. "Option A: Maintain current investment to deliver core roadmap. Option B: Add 3 senior engineers ($600K annual cost) to accelerate enterprise features, potentially unlocking $3M incremental ARR. Recommendation: Option B delivers 5:1 ROI within 9 months."
Mapping SDLC Metrics to Financial Outcomes
The transformative element of modern board reporting is connecting engineering execution metrics with financial outcomes. This section explores practical approaches to financial alignment and how Keypup MCP Server enables instant cross-domain analysis.
Understanding the SDLC-Finance Mapping Challenge
Traditional engineering metrics and financial reporting exist in separate worlds with different languages, timescales, and systems. Engineering thinks in sprints, velocity points, and deployment frequency. Finance thinks in quarters, OPEX/CAPEX, and margin impact. Bridging this gap requires translation frameworks that connect execution metrics to financial outcomes.
The challenge is both technical and conceptual. Technically, SDLC data lives in Git platforms, project management tools, and CI/CD systems, while financial data resides in ERP systems, financial planning tools, and accounting software. These systems don't naturally integrate. Conceptually, the mapping isn't always obvious: how do you calculate the financial value of "deployment frequency increased from weekly to daily"?
Keypup MCP Server solves both challenges by:
- Unified Data Access: Connecting to both SDLC systems and financial data sources, enabling cross-domain queries
- Intelligent Analysis: Using AI to identify correlations, calculate derived metrics, and explain relationships between engineering execution and financial outcomes
Core SDLC-Finance Mappings
Here are the essential mappings every engineering leader should establish:
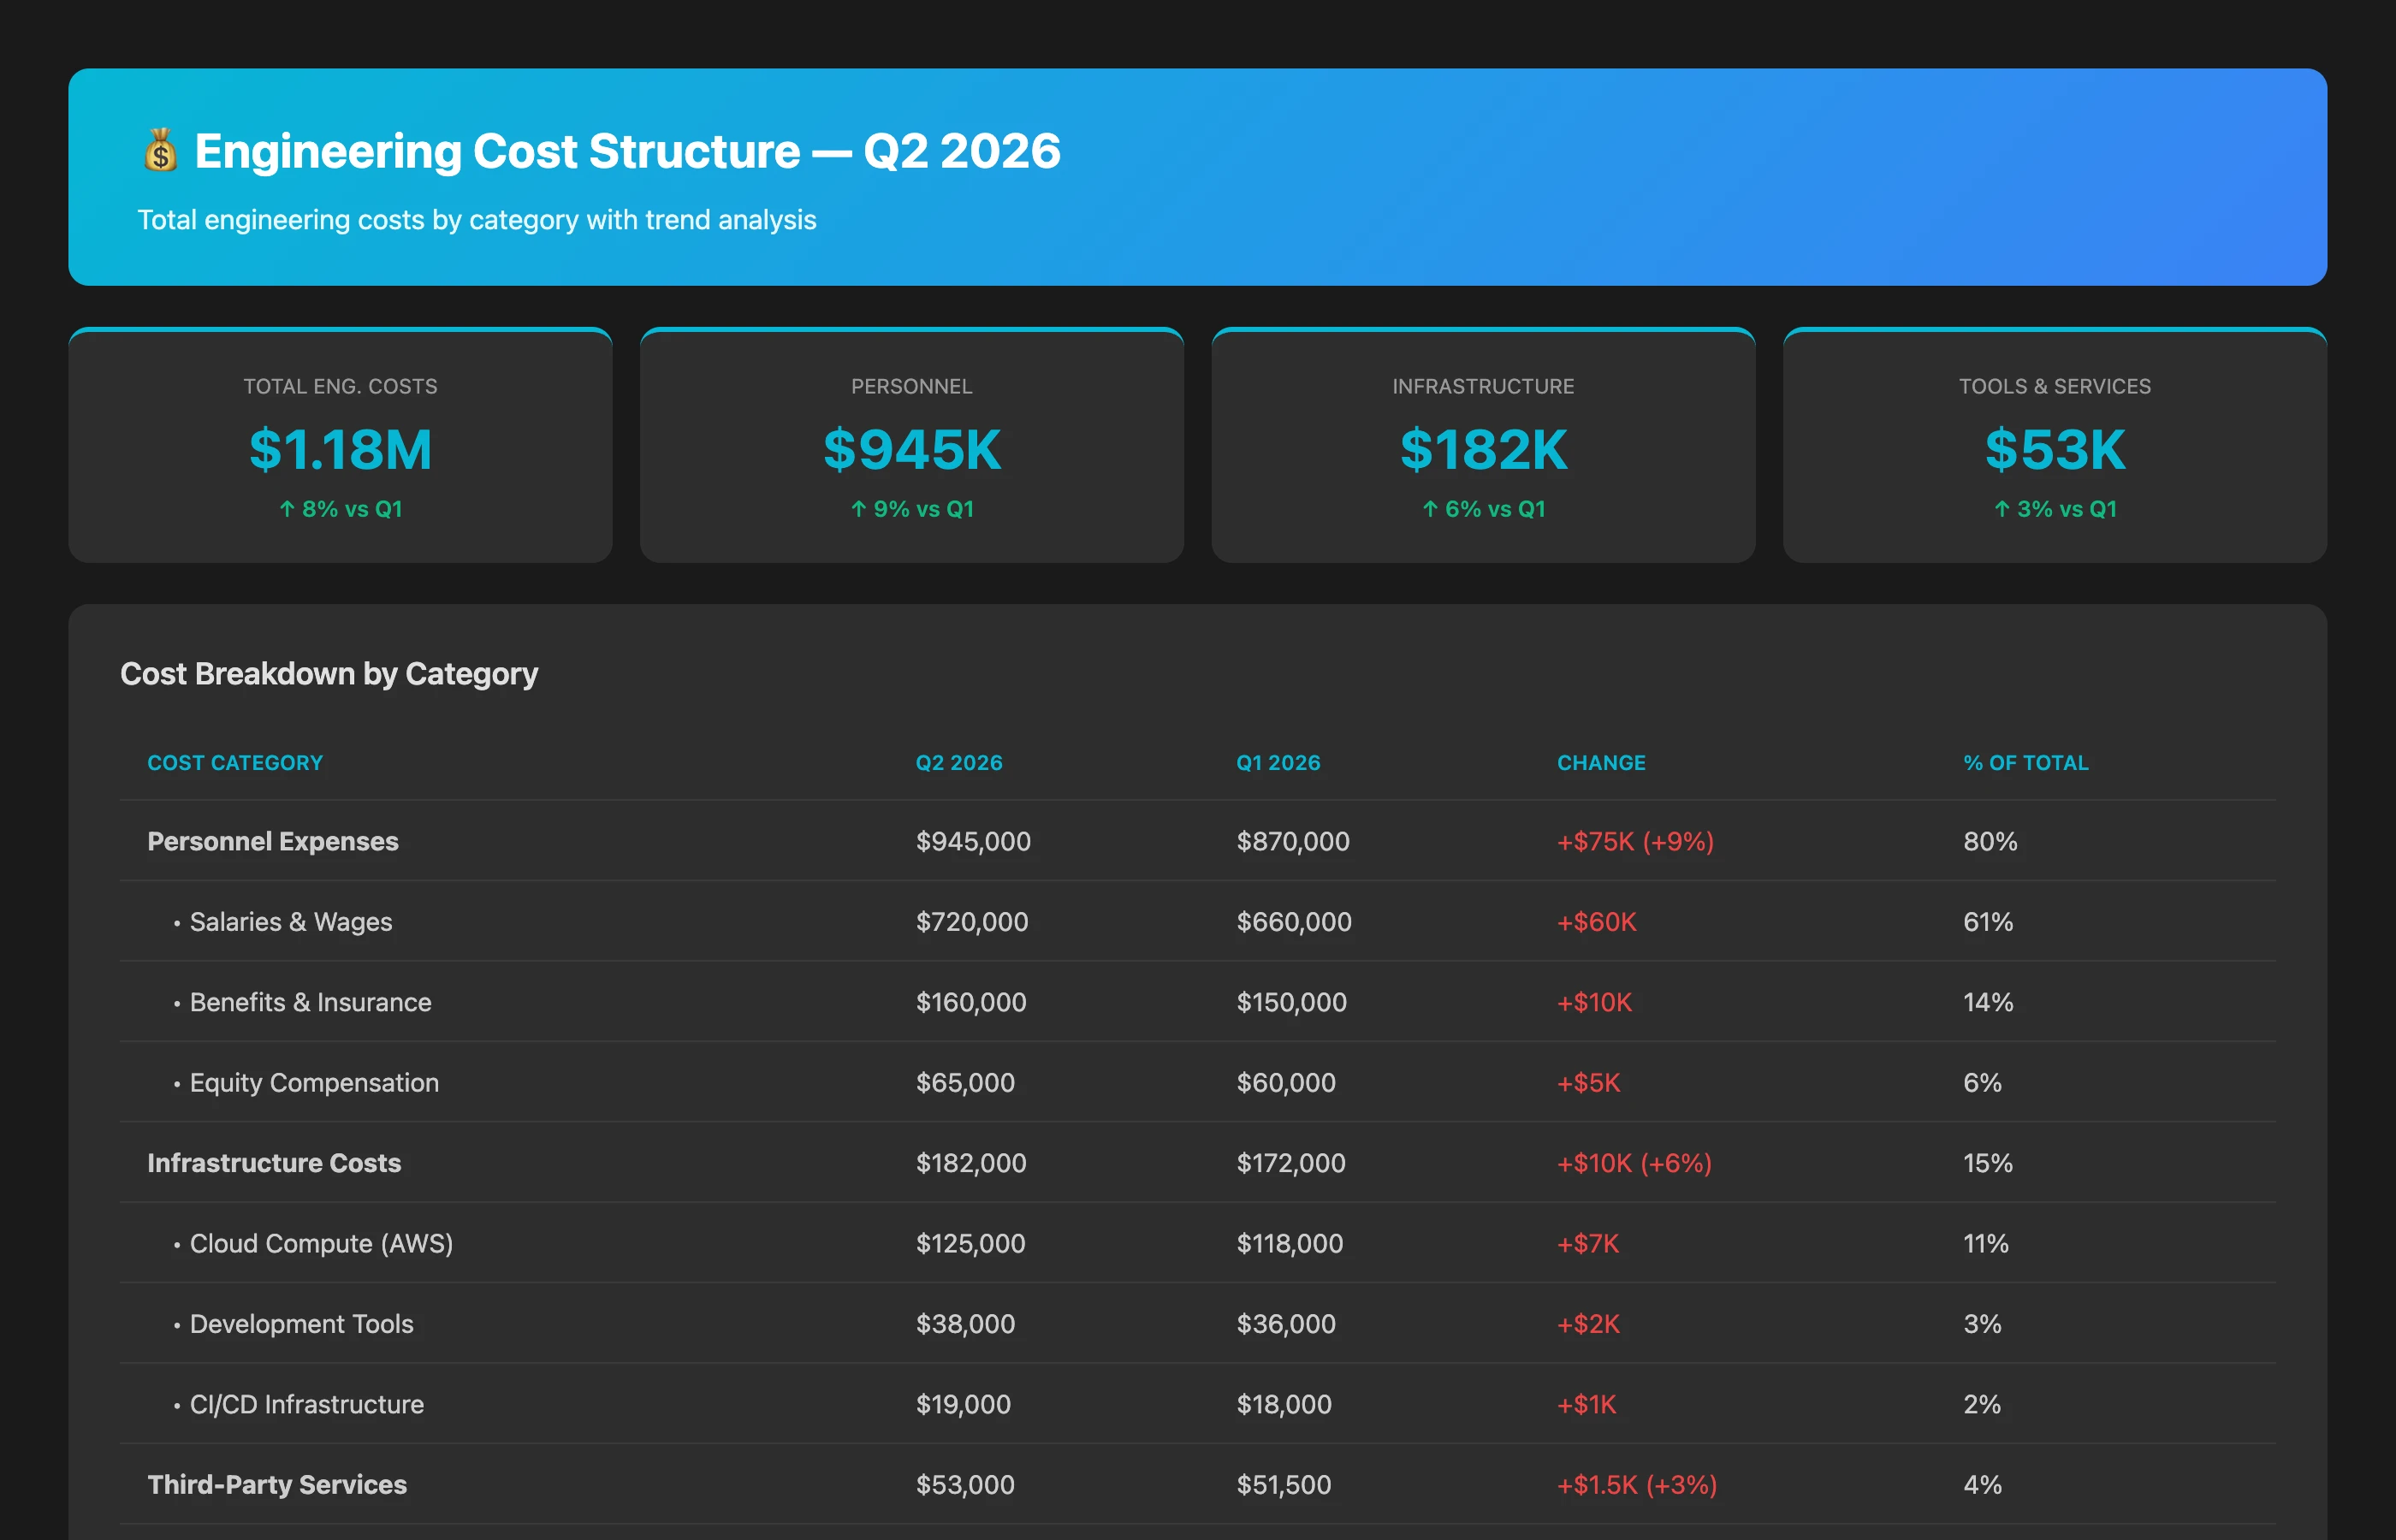
Mapping 1: Engineering Cost Structure
Understanding total cost of engineering enables per-unit analysis (cost per feature, cost per story point, etc.).
Calculate total engineering costs for Q2 2026. Include: engineering personnel expenses (salaries, benefits, equity) from financial system, infrastructure costs (cloud compute, development tools, CI/CD), third-party services (APIs, monitoring, security tools), and allocated overhead (office space, IT support). Break down by cost category and show trend vs. Q1 2026.
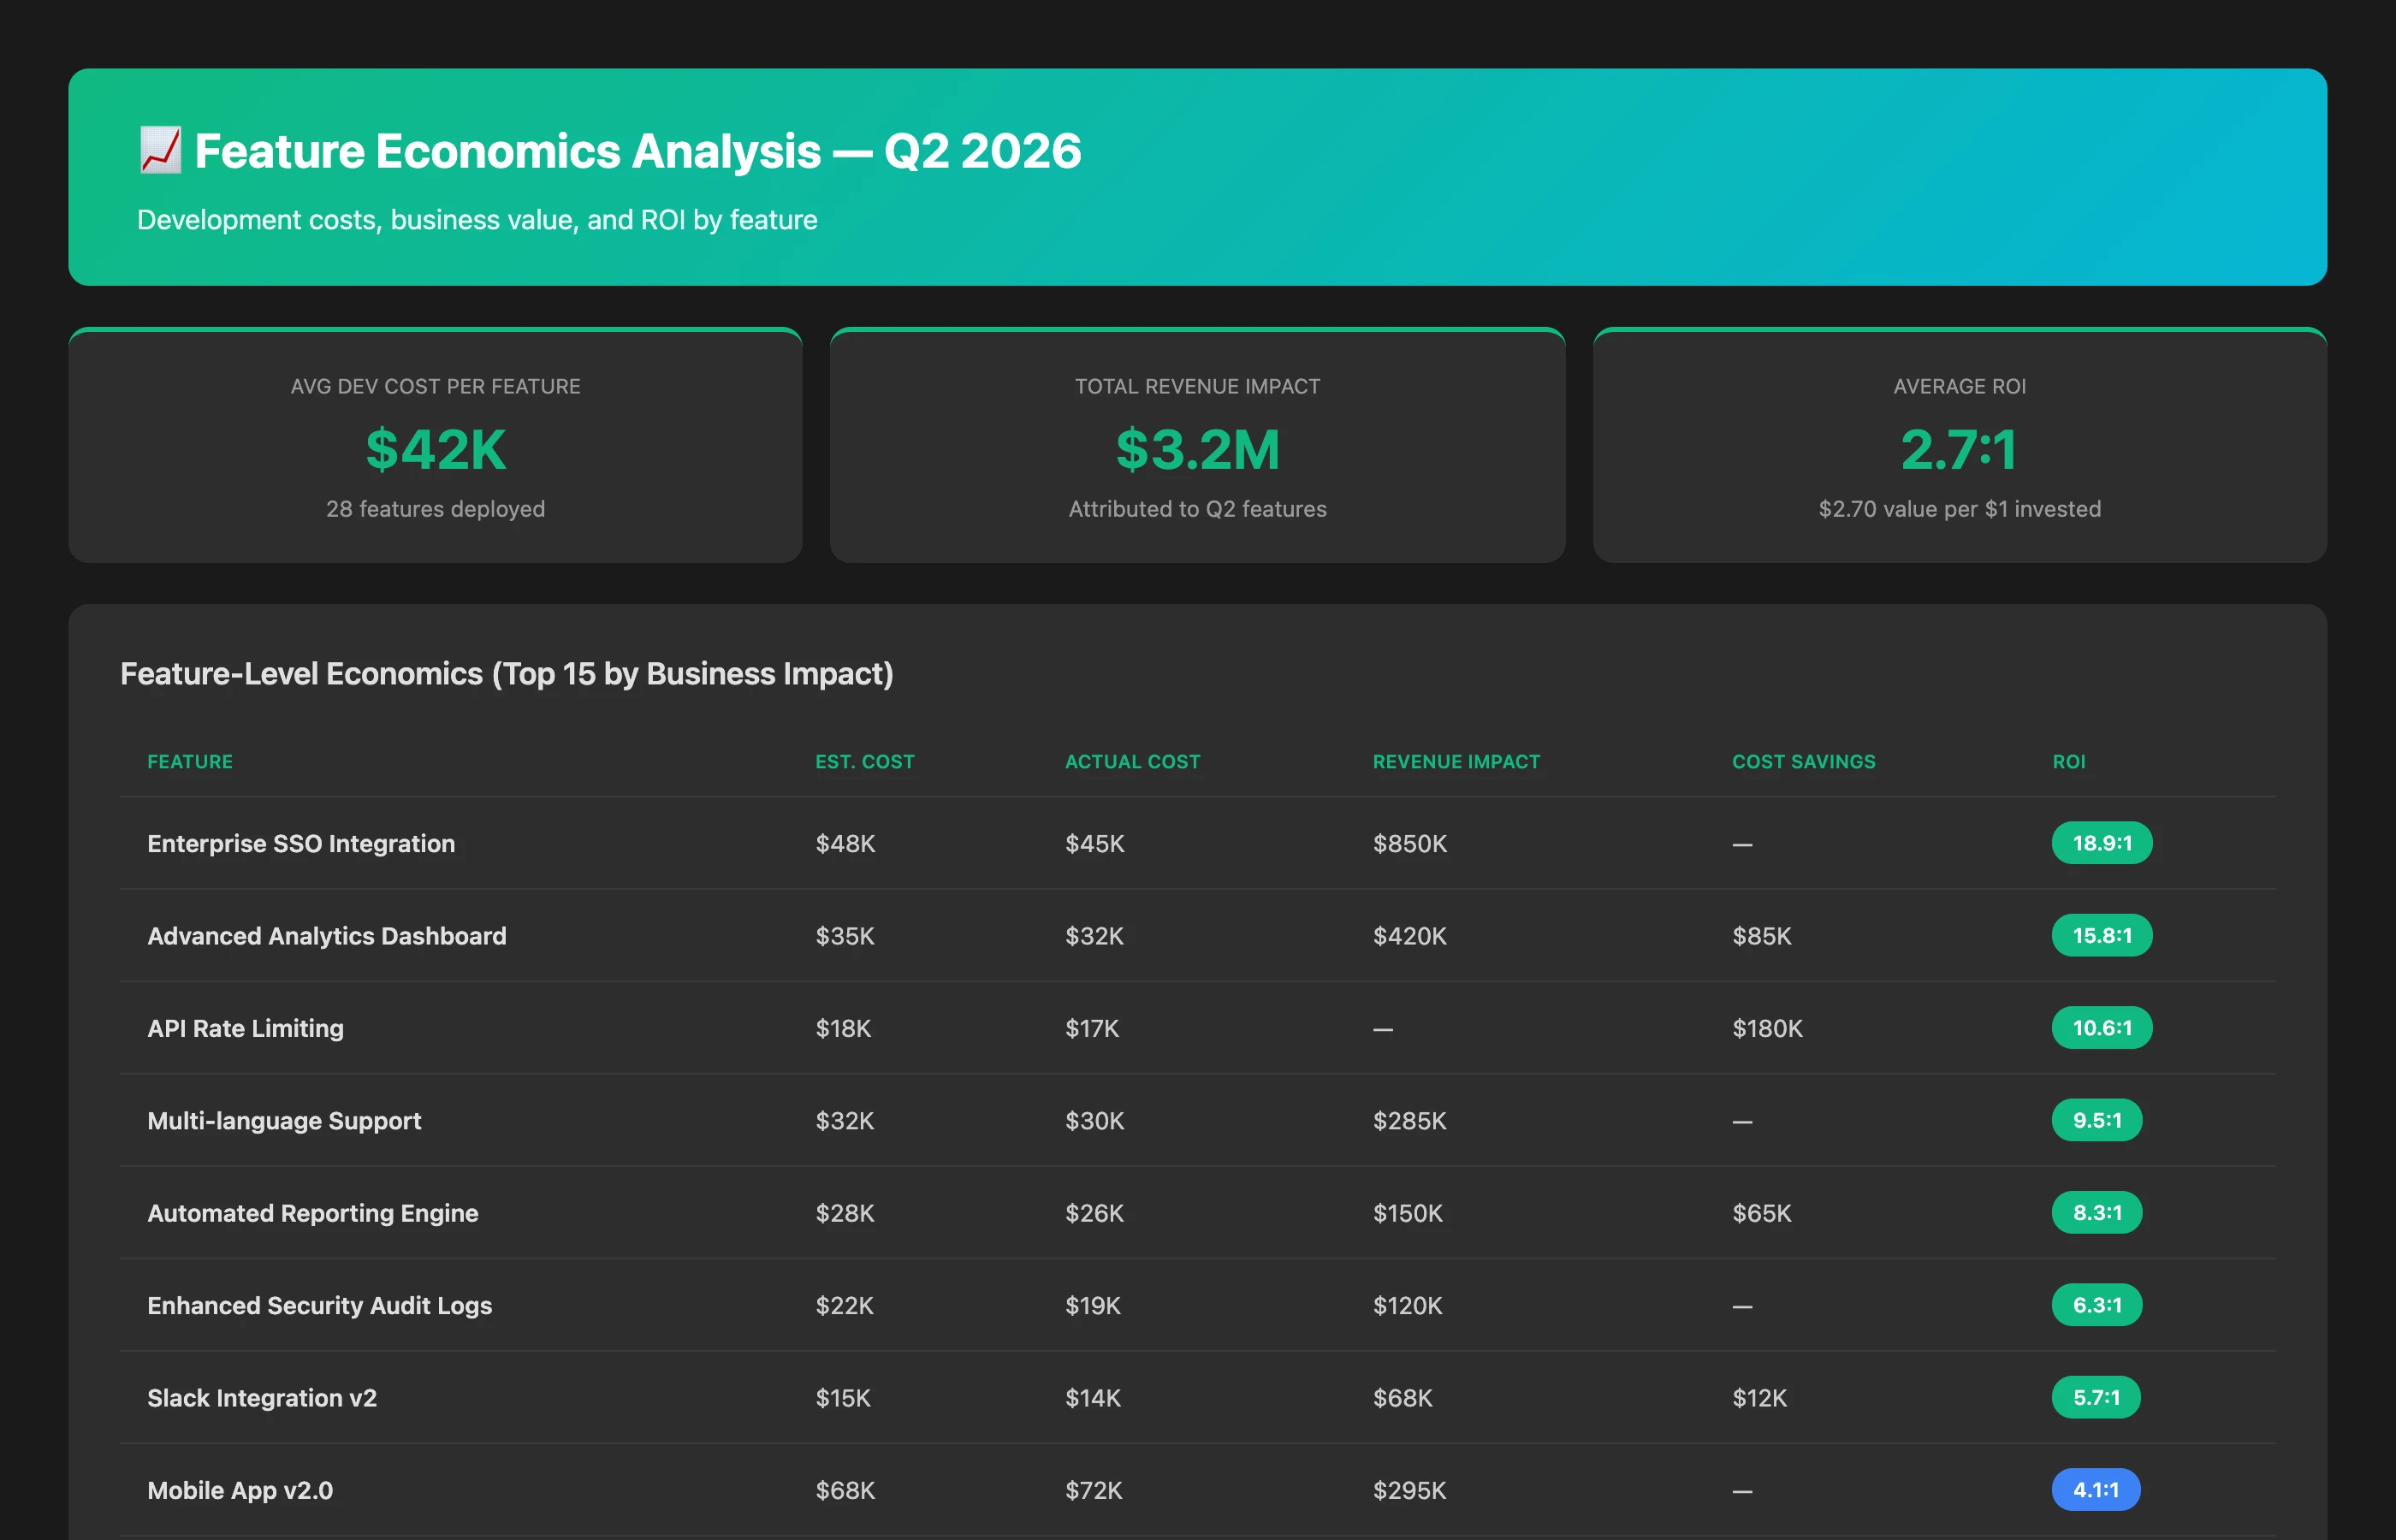
Mapping 2: Feature Economics
Connecting development costs with business value delivered shows ROI on engineering investment.
For features deployed in Q2 2026, calculate feature economics. For each feature: estimated development cost (team size × time × loaded cost rate), actual development cost, revenue impact (features tied to customer purchases or upsells), cost savings (features reducing support burden or operational costs), and calculated ROI. Identify highest and lowest ROI features to inform future prioritization.
Mapping 3: Quality Costs
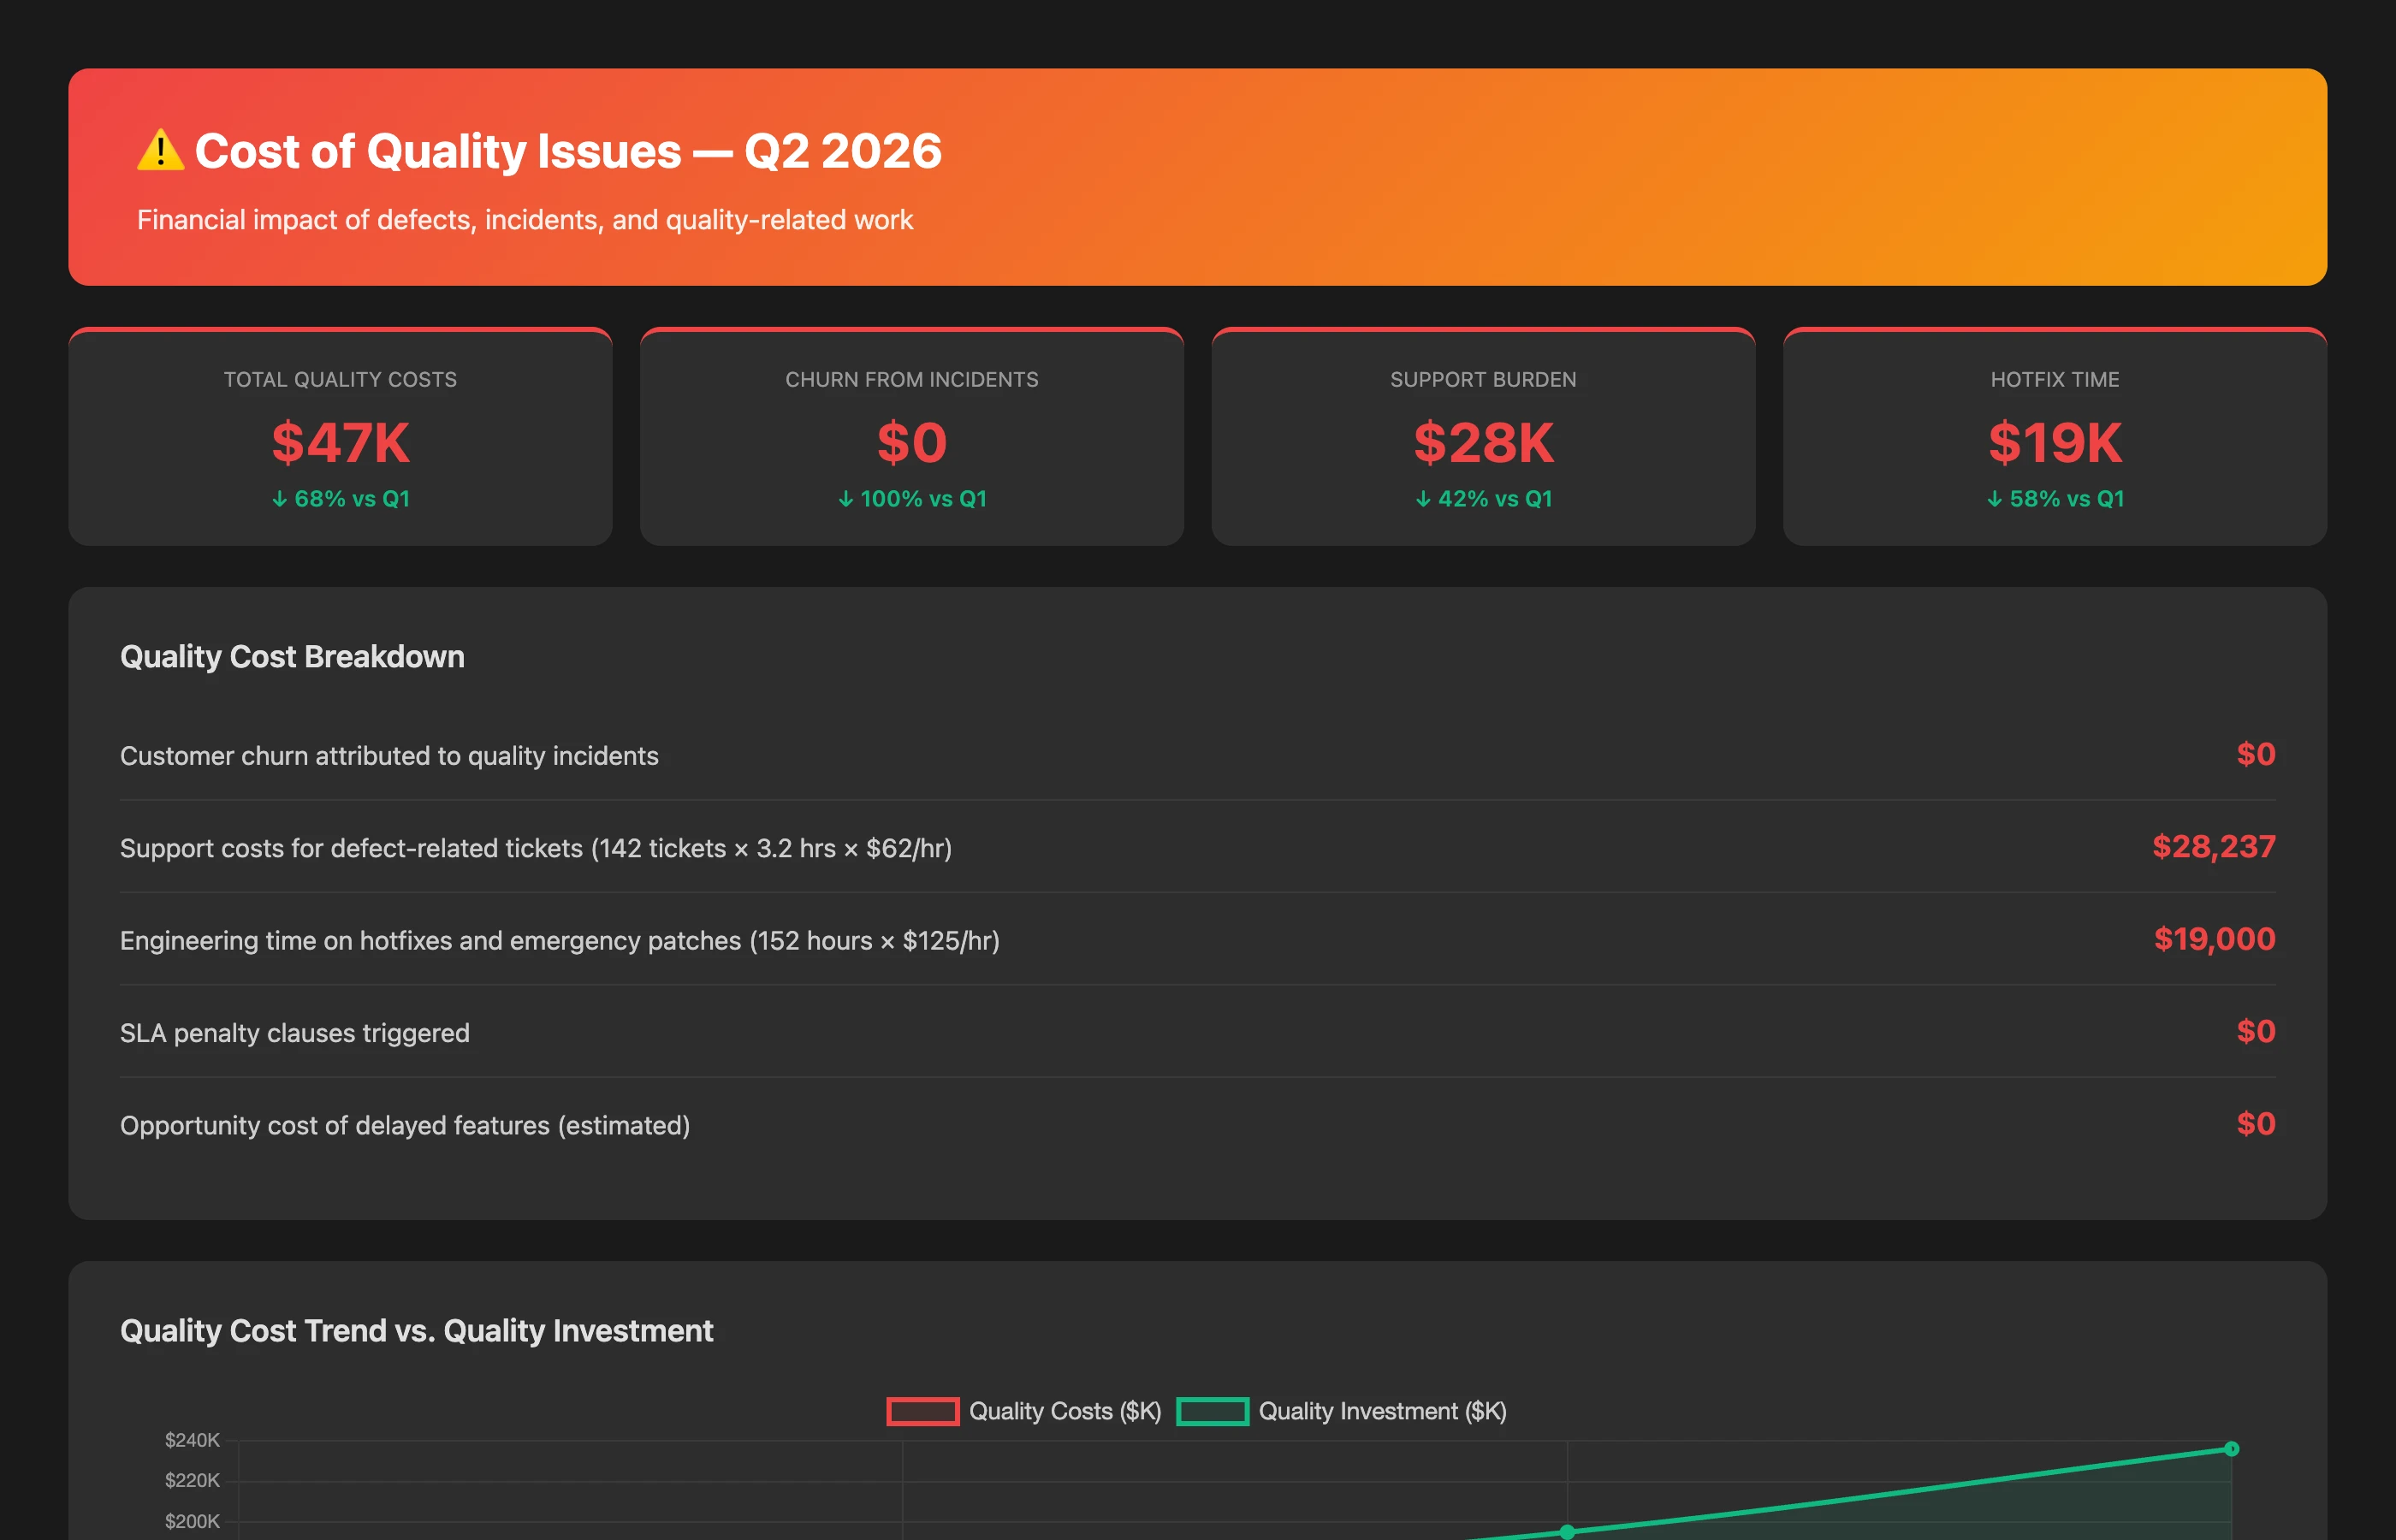
Quantifying the financial impact of quality issues demonstrates the value of quality investment.
Calculate the cost of quality issues in Q2 2026. Include: customer churn attributed to quality incidents (churned ARR), support costs for defect-related tickets (hours × loaded cost rate), engineering time spent on hotfixes and emergency patches, SLA penalty clauses triggered, and opportunity cost of delayed features. Show trend vs. Q1 2026 and correlate with quality investment levels.
Mapping 4: Capacity Utilization Economics
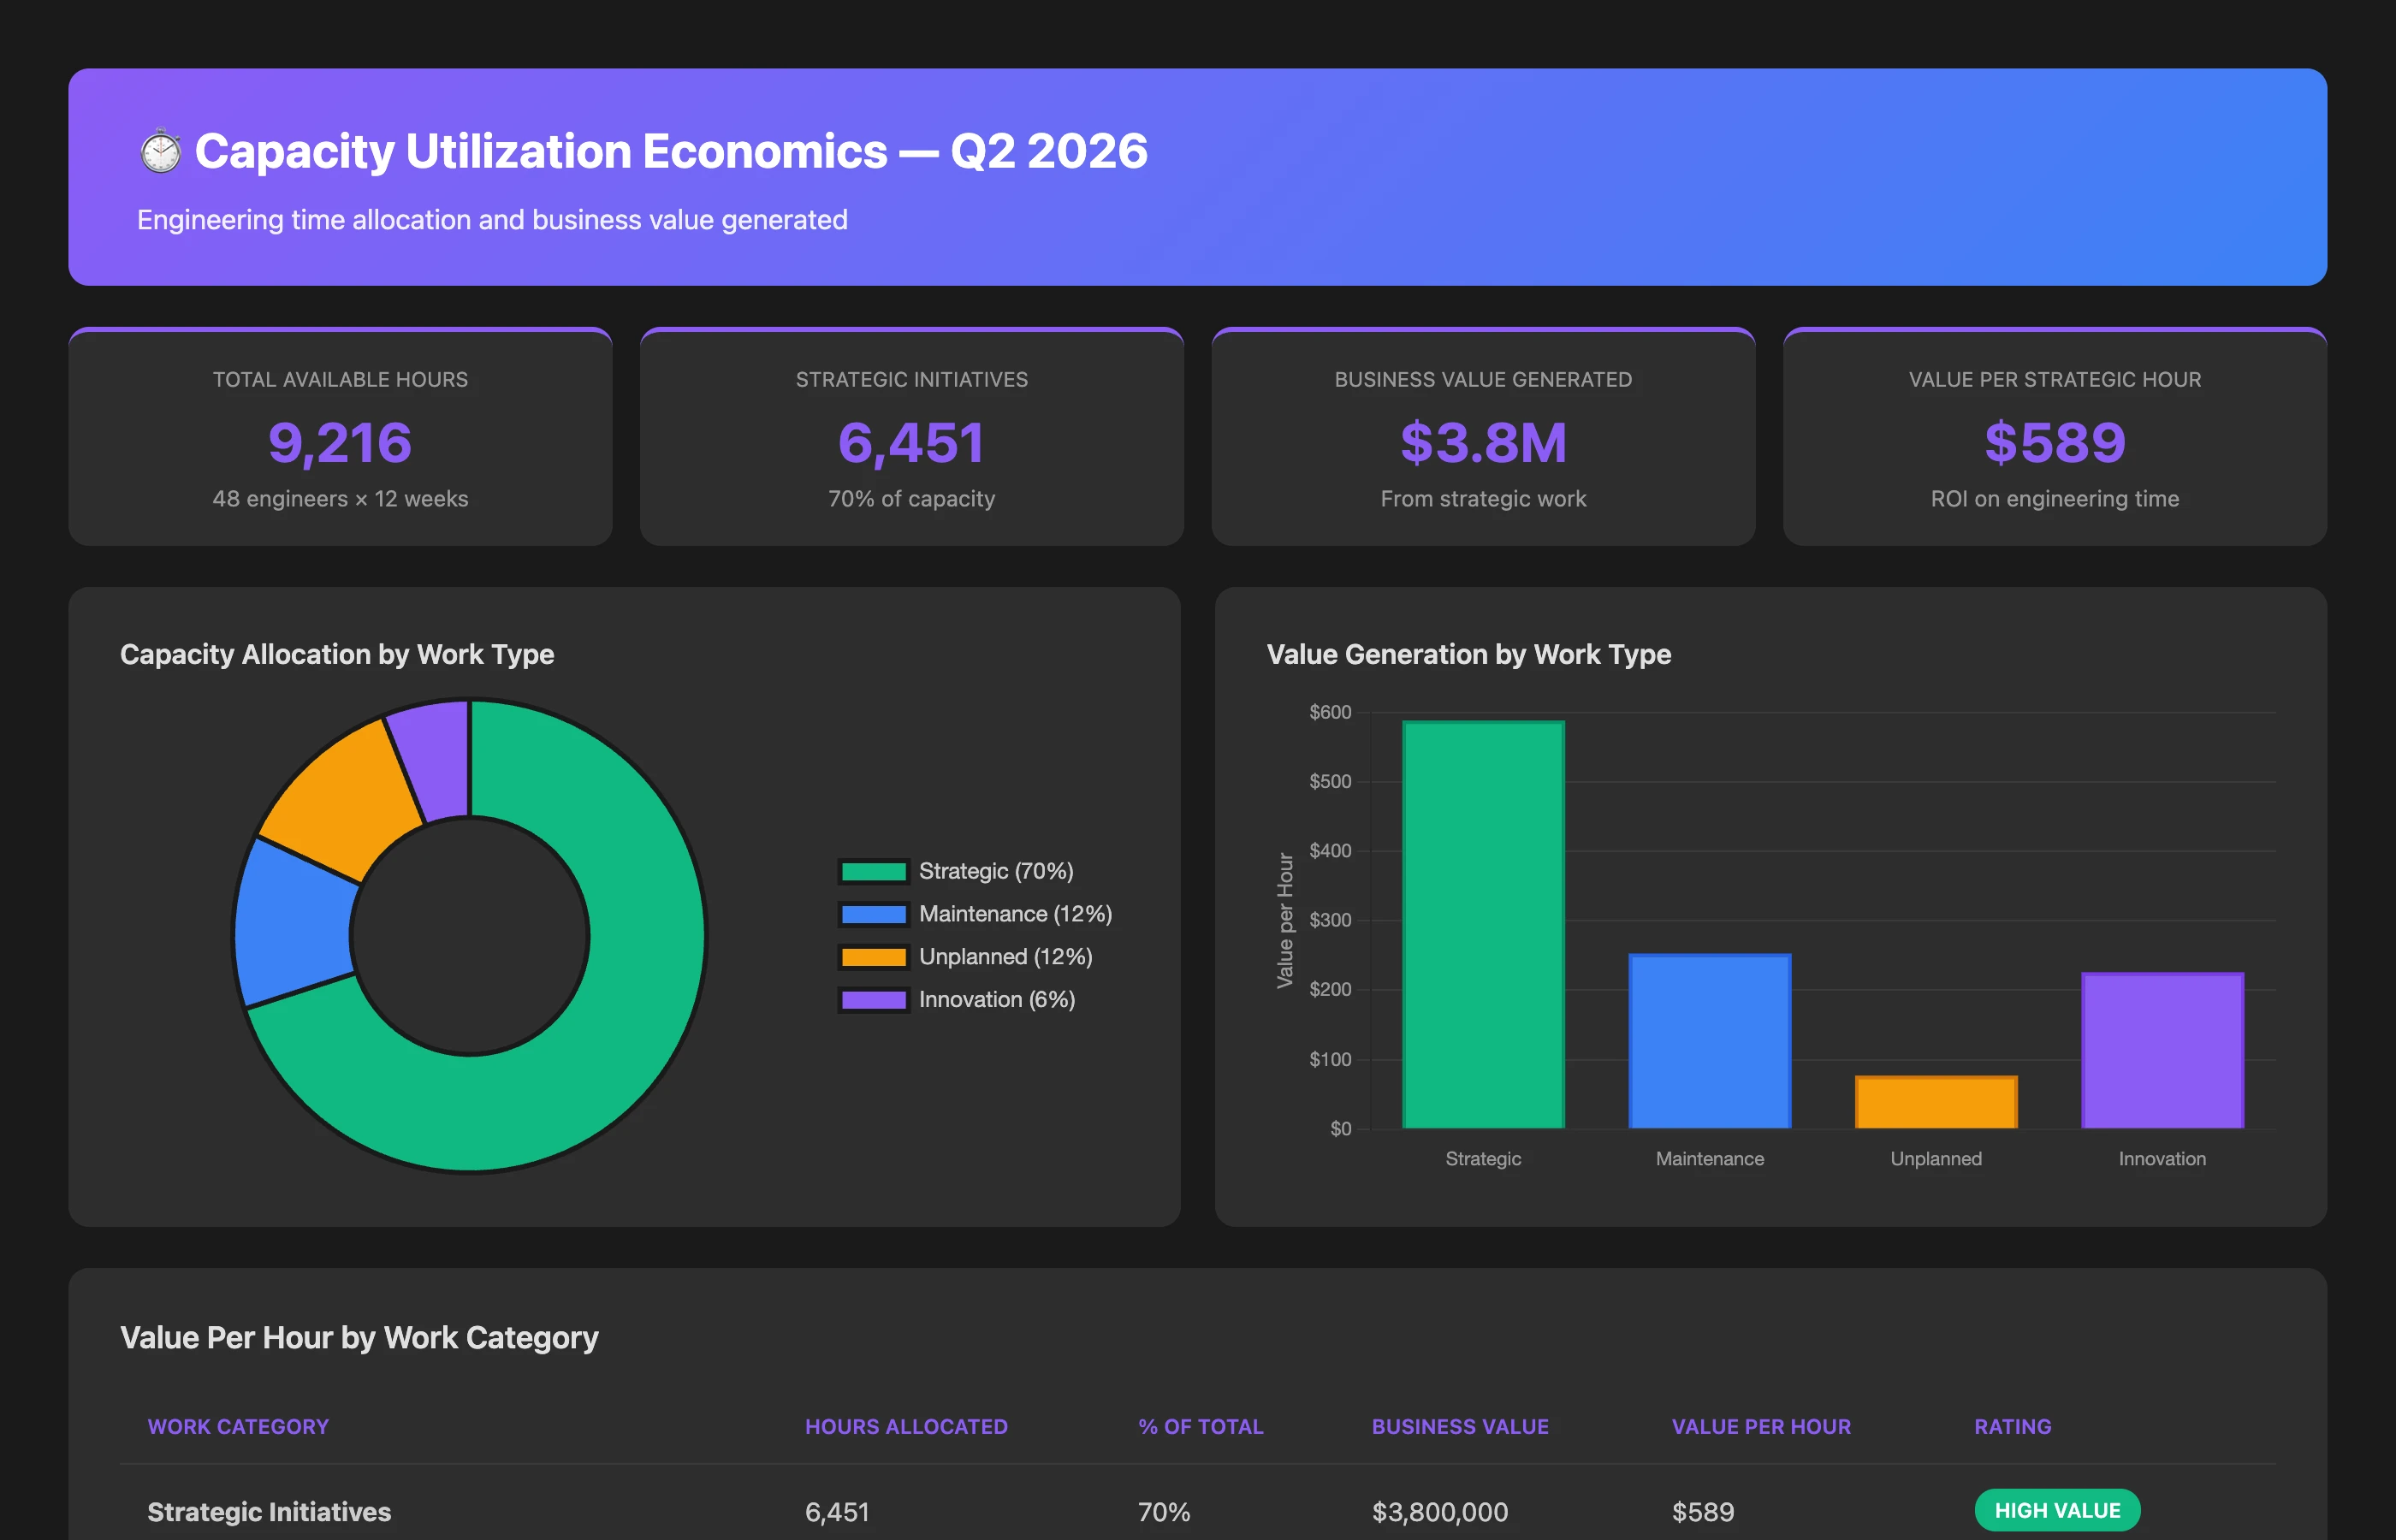
Understanding how engineering capacity translates to business value delivered shows efficiency of resource allocation.
Analyze capacity utilization economics for Q2 2026. Calculate: total available engineering hours, hours allocated to strategic initiatives, hours spent on maintenance and technical debt, hours on unplanned work (bugs, incidents), and hours on innovation exploration. For strategic initiative hours, calculate business value delivered (revenue impact, cost savings, strategic capability). Show value-per-hour for different work types to inform allocation decisions.
Advanced Integration: Real-Time Financial Correlation
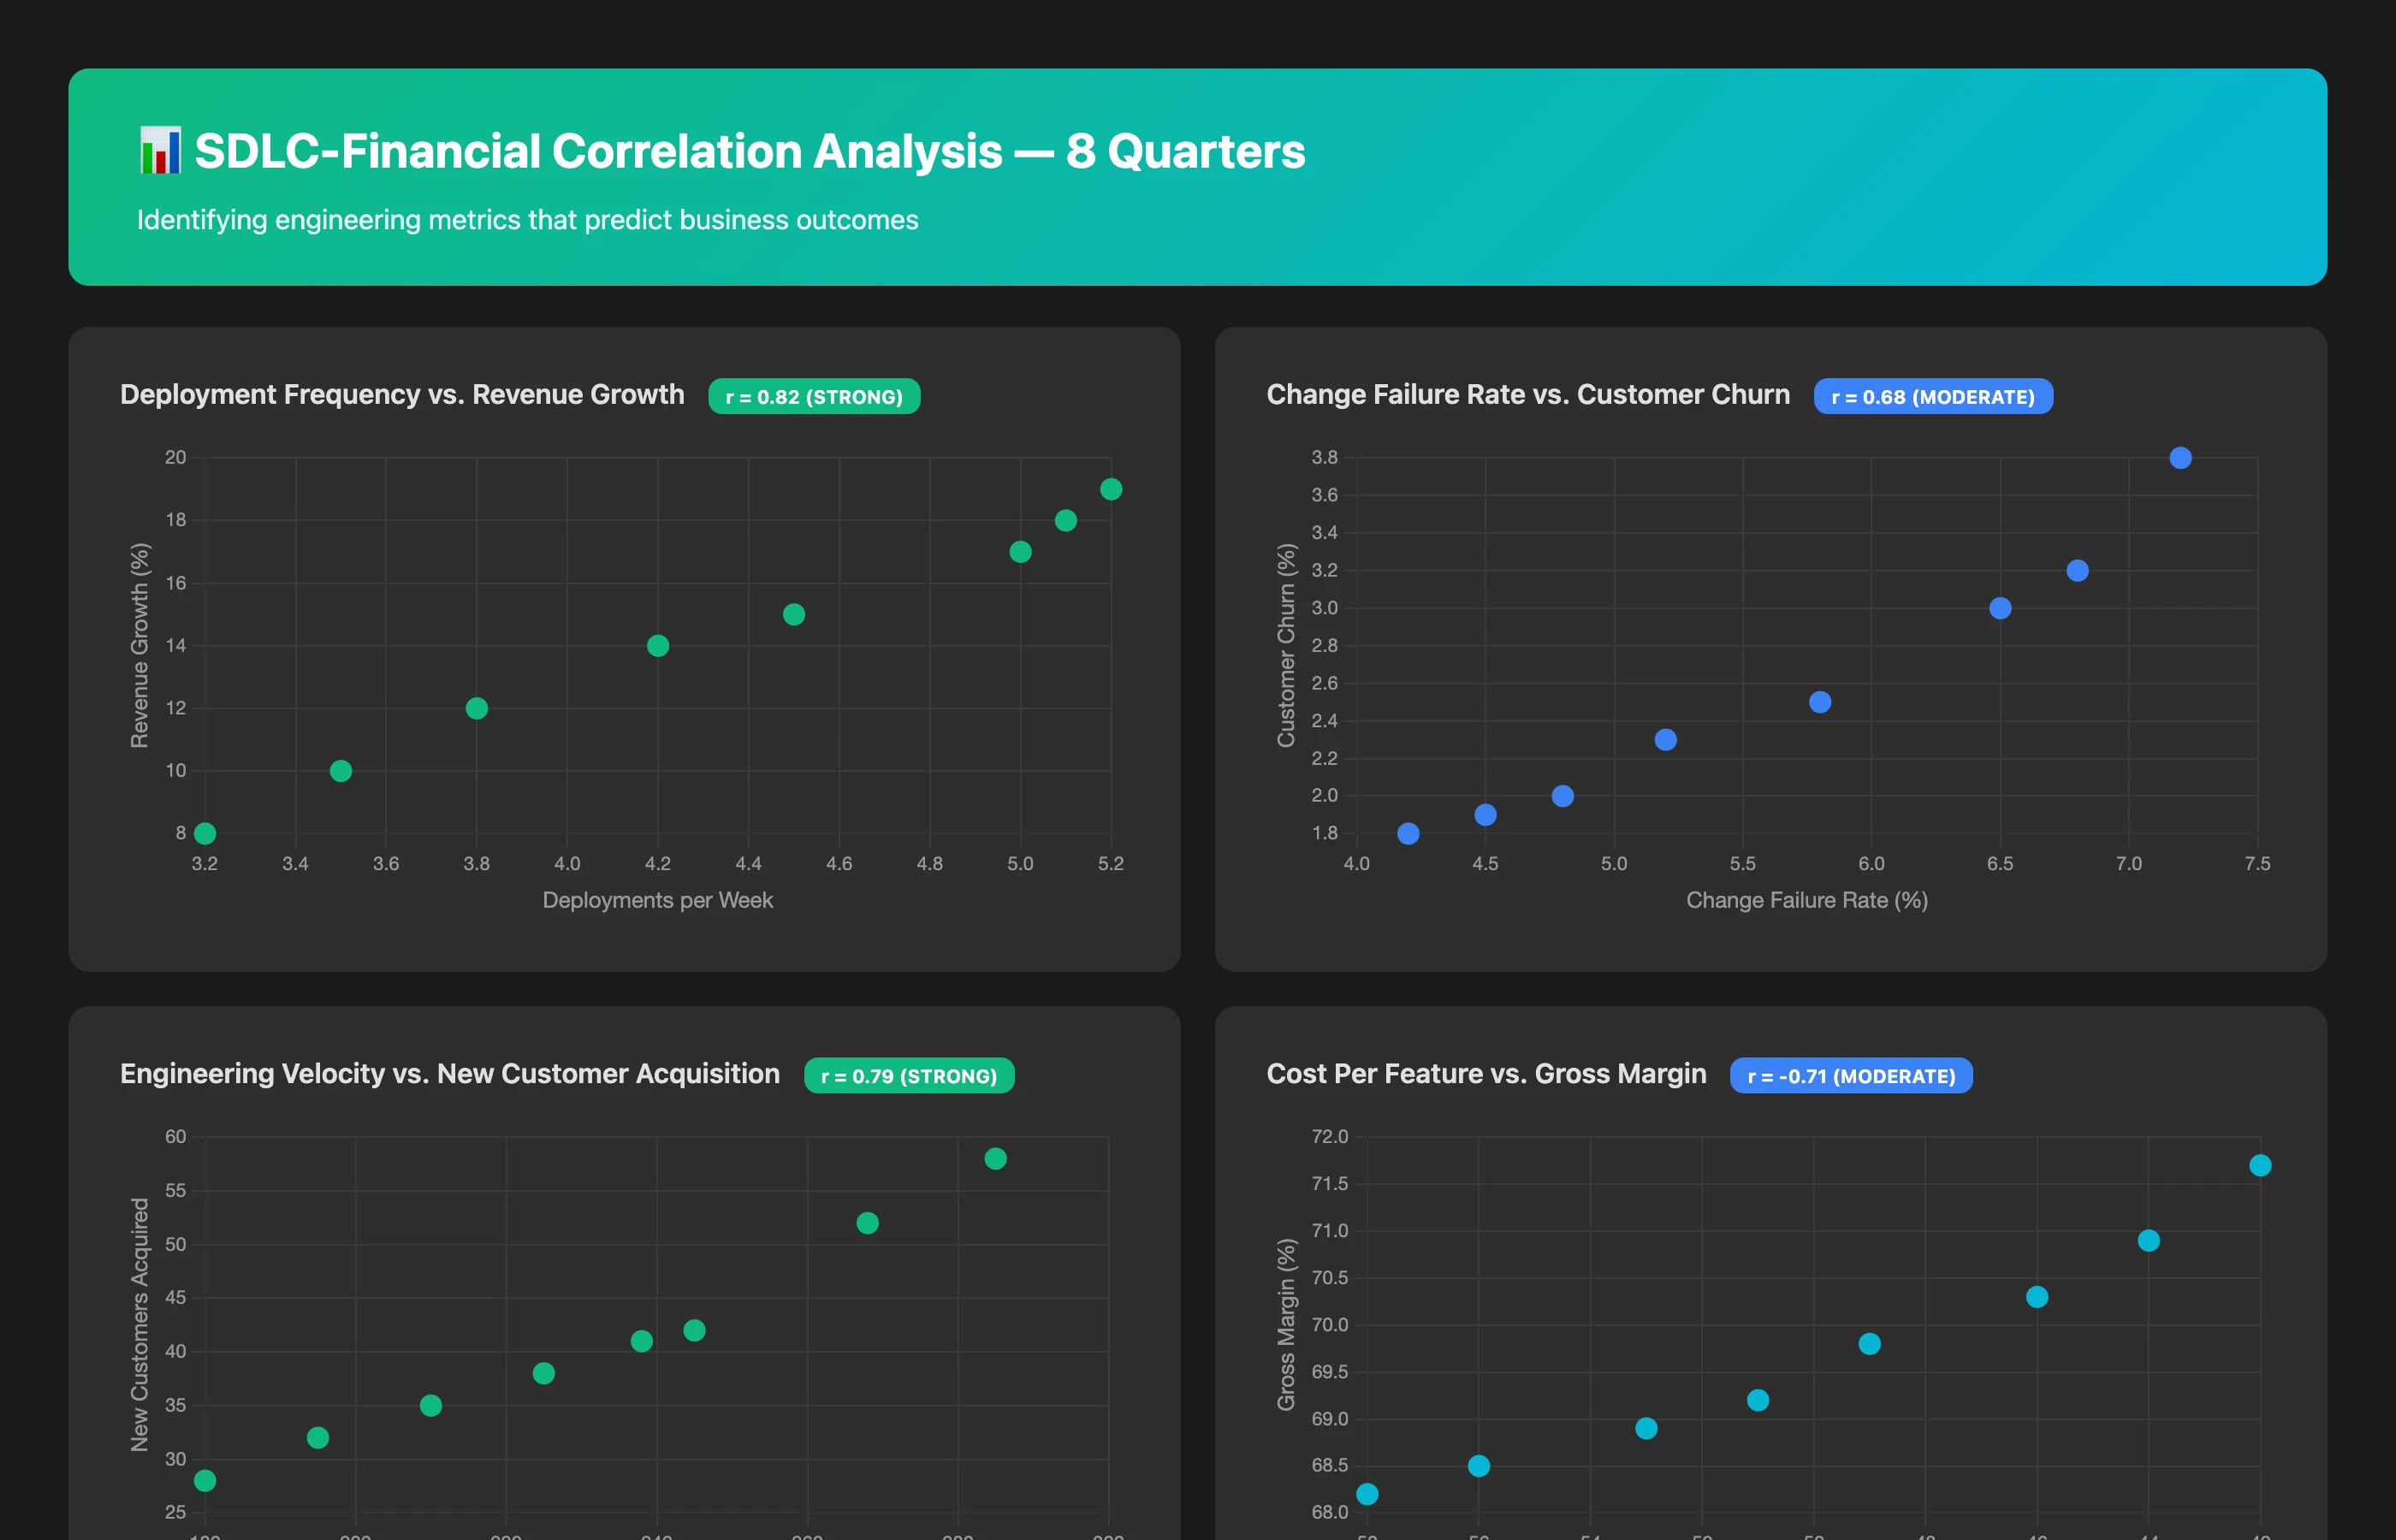
The most powerful capability is real-time correlation between engineering metrics and financial performance to identify leading indicators and causal relationships.
Correlate engineering efficiency metrics with business financial performance over the last 8 quarters. Compare: deployment frequency vs. new customer acquisition rate, change failure rate vs. customer churn, engineering velocity vs. revenue growth, cost per feature vs. gross margin. Identify statistically significant correlations and potential causal relationships. Which engineering improvements most strongly predict financial performance?
This analysis reveals which engineering investments drive measurable business outcomes, enabling data-driven prioritization. For example, discovering that "reducing cycle time by 20% correlates with 15% faster revenue growth" provides powerful justification for process improvement investment.
Traditional board reporting requires weeks of manual effort: extracting data from multiple systems, reconciling inconsistencies, performing calculations in spreadsheets, creating visualizations, and compiling into presentation decks. By the time the report is complete, data is stale and new questions from the board require starting the process over.
Keypup MCP Server transforms this paradigm through three core capabilities:
Capability 1: Unified Data Access
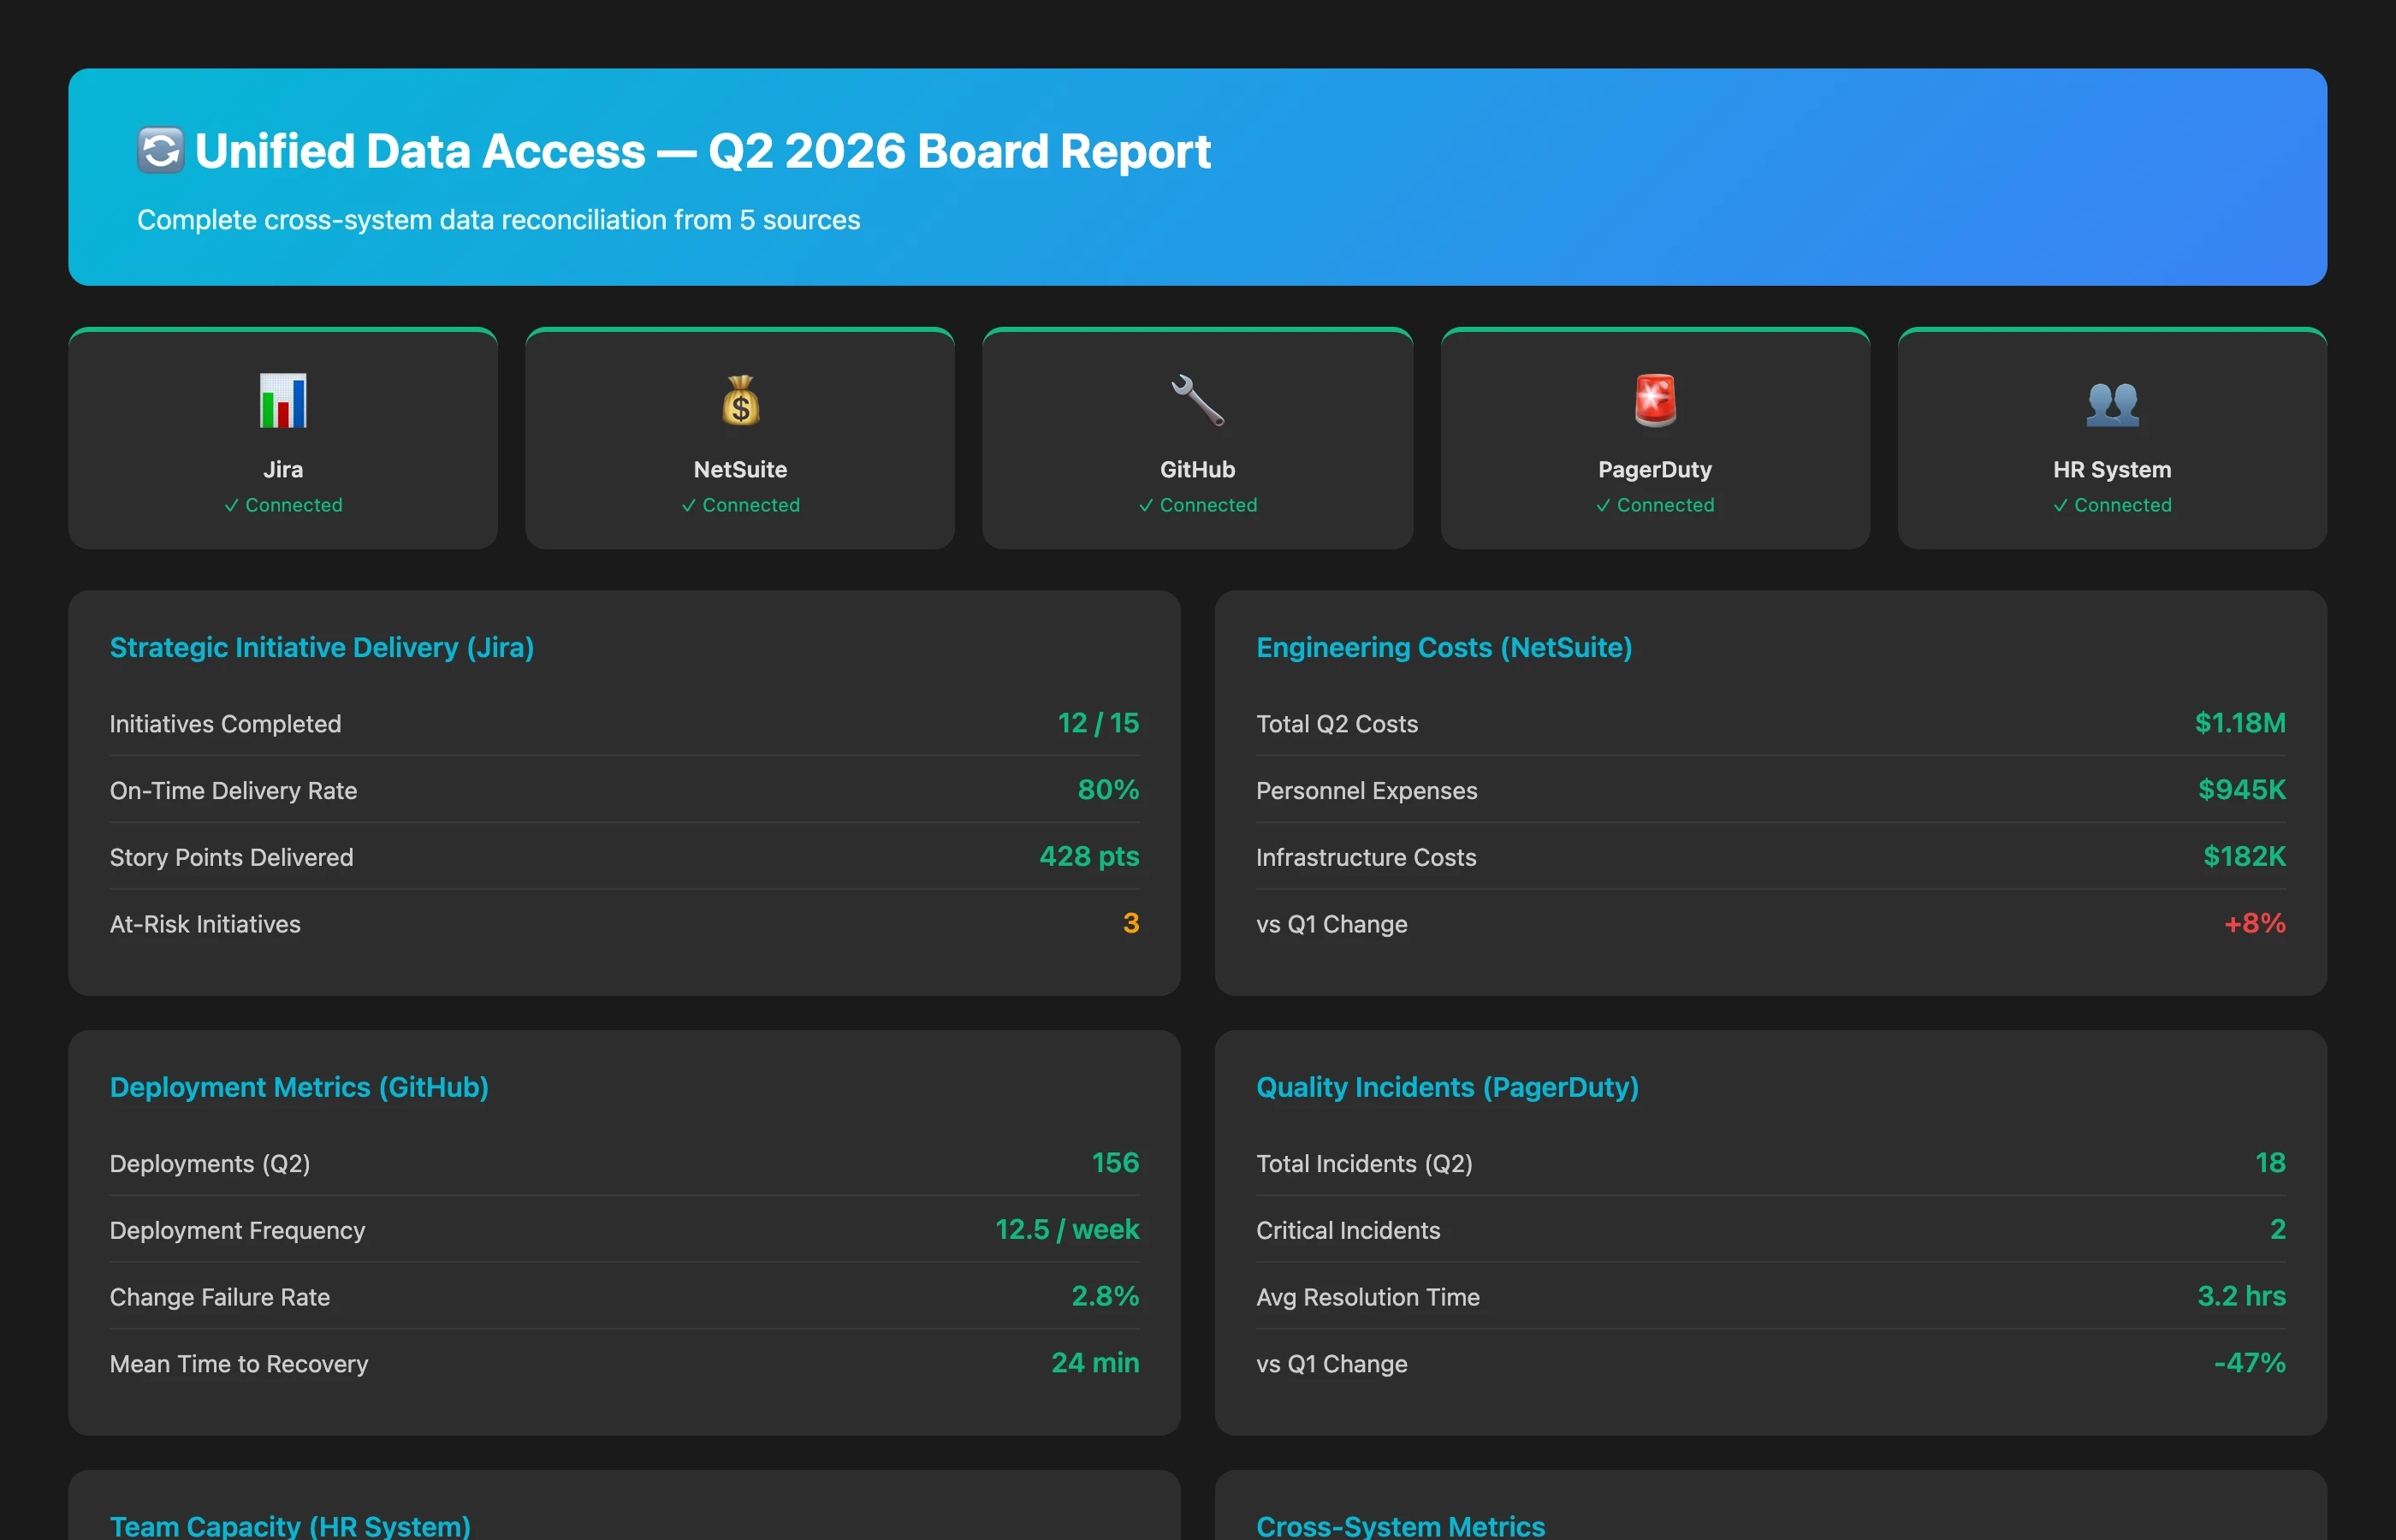
Keypup connects to your entire SDLC and financial toolchain—Git platforms (GitHub, GitLab, Bitbucket), project management (Jira, Linear, Asana), CI/CD (GitHub Actions, Jenkins, CircleCI), and financial systems (QuickBooks, NetSuite, Sage). Instead of manually extracting and reconciling data, engineering leaders query a unified intelligence layer.
Show me complete Q2 2026 board report data: strategic initiative delivery from Jira, engineering costs from NetSuite, deployment metrics from GitHub, quality incidents from PagerDuty, and team capacity from our HR system. Reconcile data inconsistencies automatically and flag any missing information.
This unified access eliminates the majority of manual reporting effort and ensures consistency across all analyses.
Capability 2: AI-Powered Analysis and Diagnosis
Beyond data access, Keypup MCP provides intelligent analysis that would require hours of manual calculation: trend identification, correlation analysis, anomaly detection, root cause diagnosis, and forecasting. The AI understands engineering domain concepts and financial relationships, enabling sophisticated analysis through simple natural language queries.
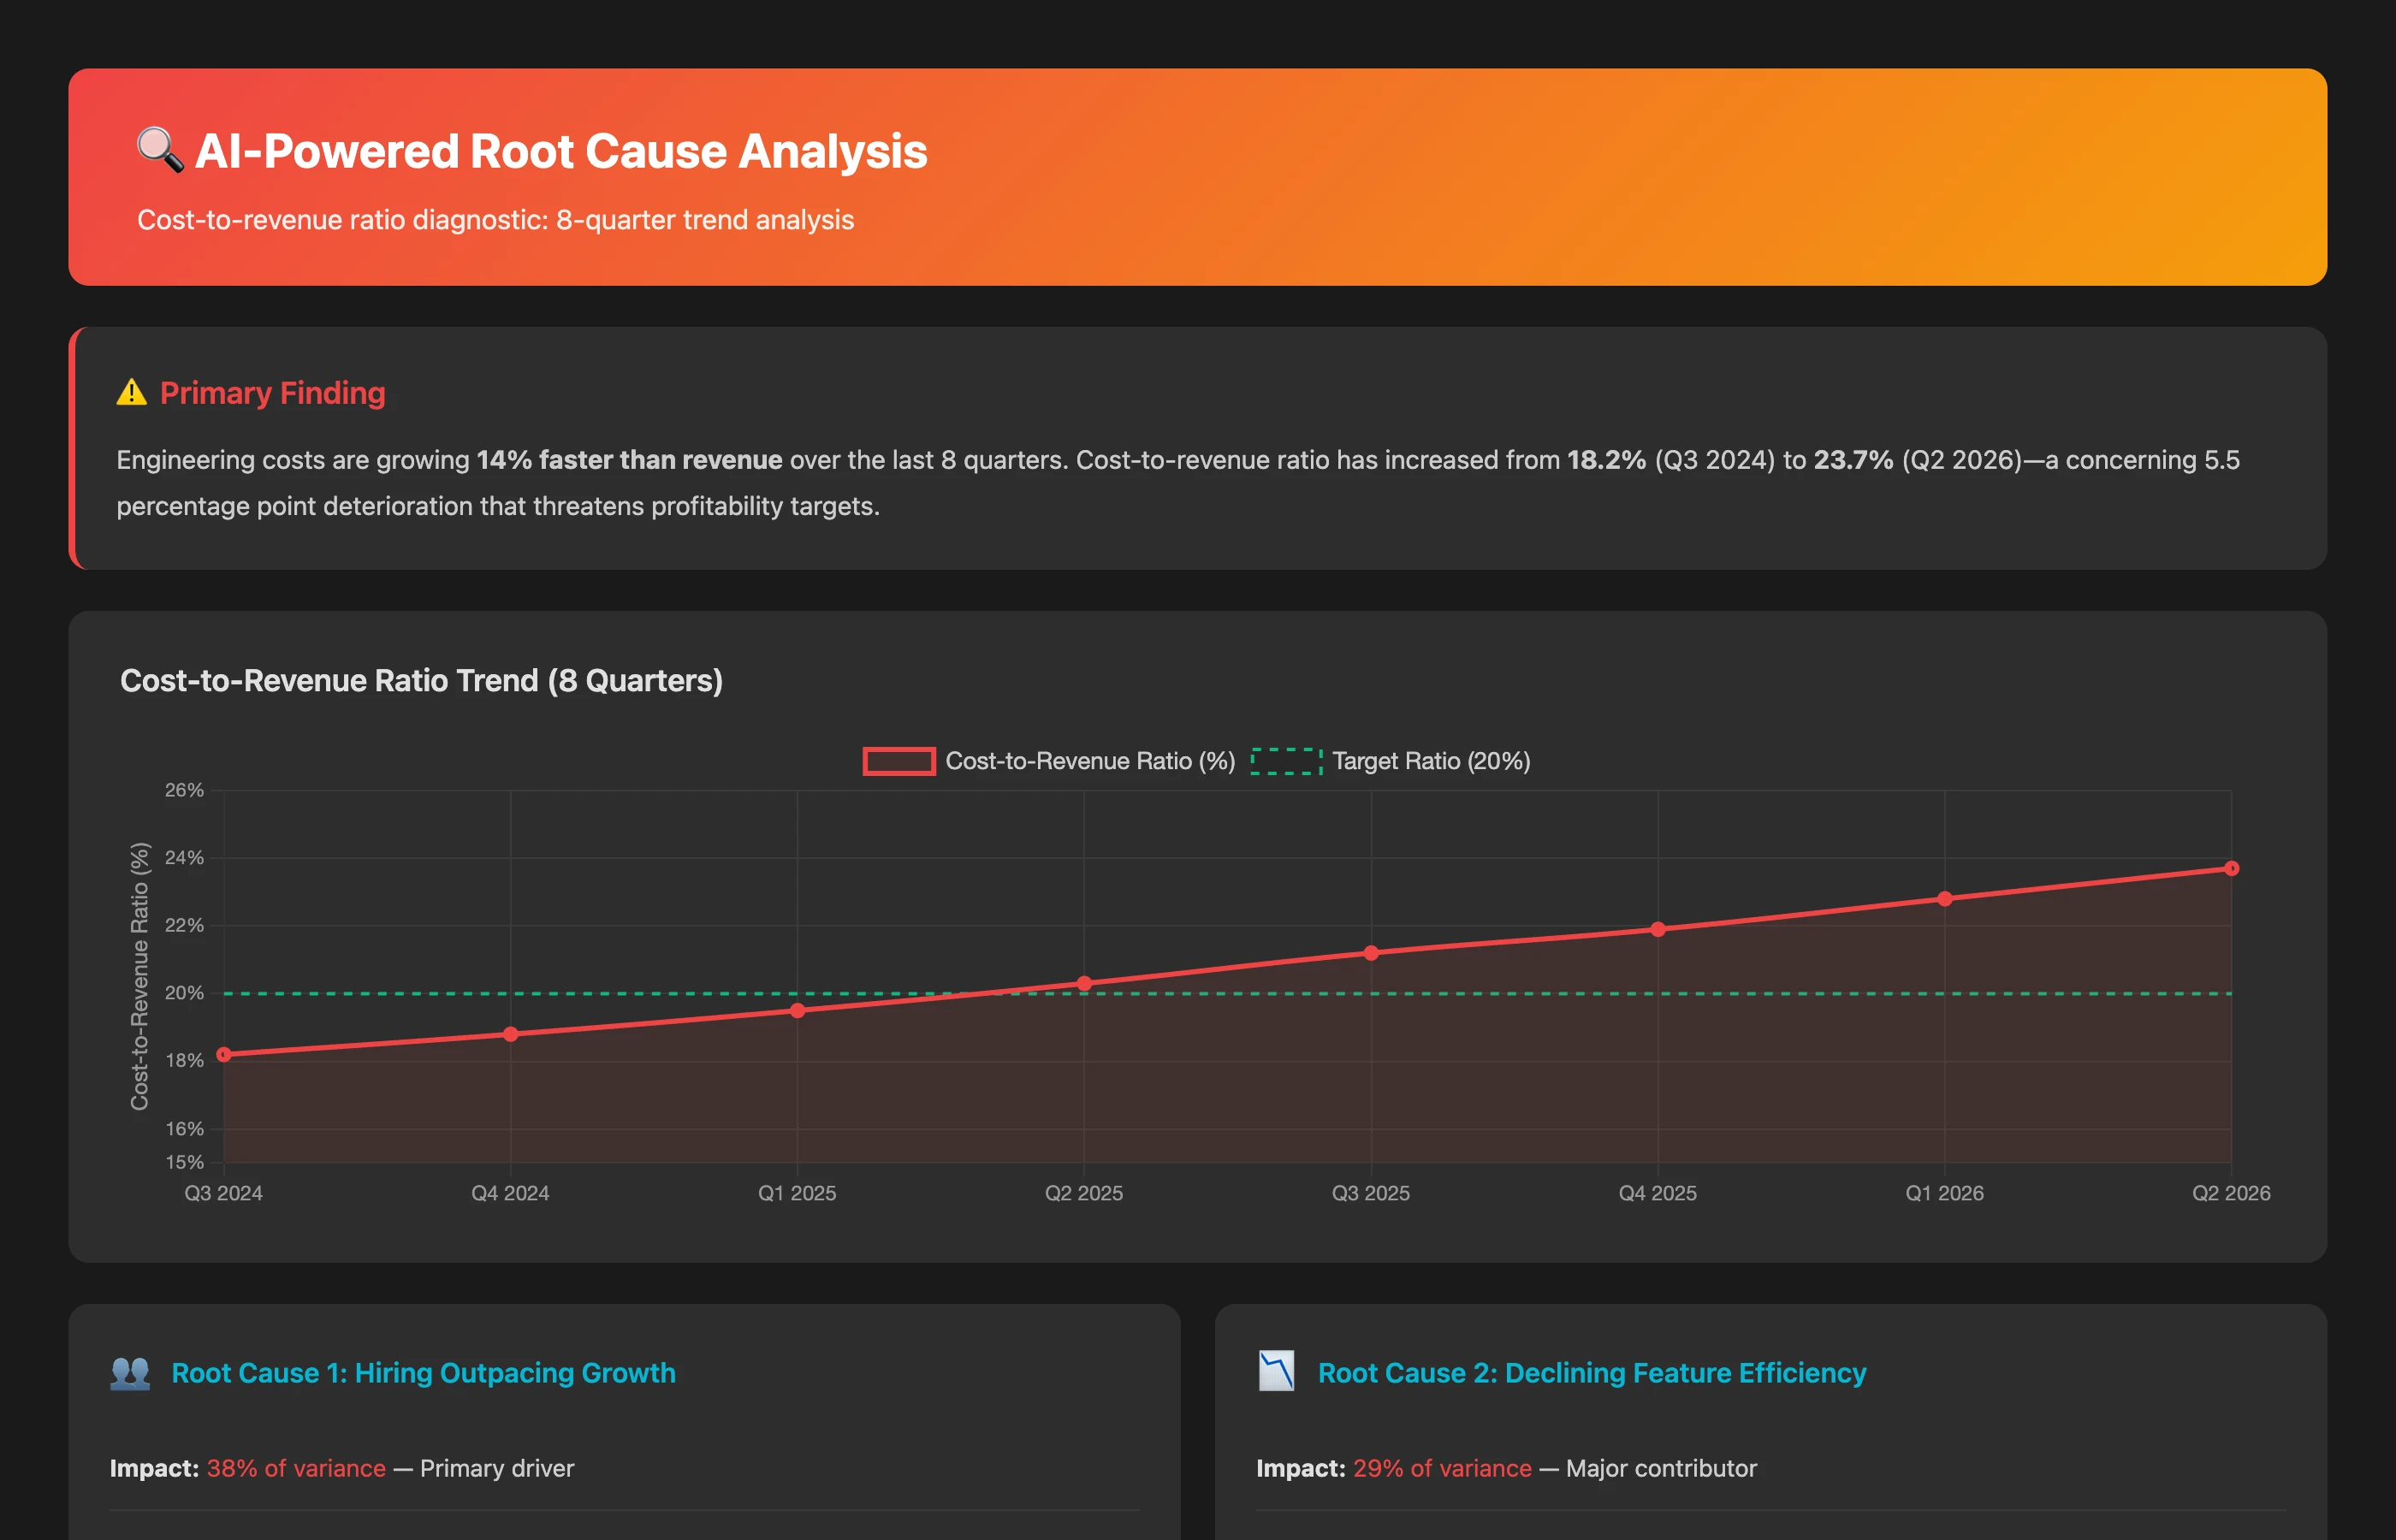
Our board is concerned that engineering costs are growing faster than revenue. Analyze our cost-to-revenue ratio trend over 8 quarters. Identify root causes: is it hiring outpacing growth, decreasing feature efficiency, increased infrastructure costs, or changing work allocation? Provide diagnosis with supporting data and recommend corrective actions.
The MCP Server performs comprehensive analysis across multiple data sources, identifies the primary drivers, and provides actionable recommendations—transforming a simple question into strategic intelligence.
Capability 3: Conversational Board Preparation
Most powerfully, Keypup MCP enables engineering leaders to prepare for board meetings conversationally, asking follow-up questions and exploring different perspectives until they have complete understanding.
Example Board Preparation Dialogue:
Generate a draft board report for Q2 2026 covering strategic delivery, financial efficiency, quality, capacity, and forward forecast.
[MCP generates comprehensive report]
The board will likely ask about our deployment frequency decrease in June. Provide root cause analysis and explain whether this is concerning.
[MCP analyzes deployment patterns, identifies the cause (planned infrastructure migration), and explains it's temporary with recovery expected in July]
Compare our cost per feature against industry benchmarks for Series C B2B SaaS companies with 50-150 engineers.
[MCP accesses benchmark data and positions company performance relative to peers]
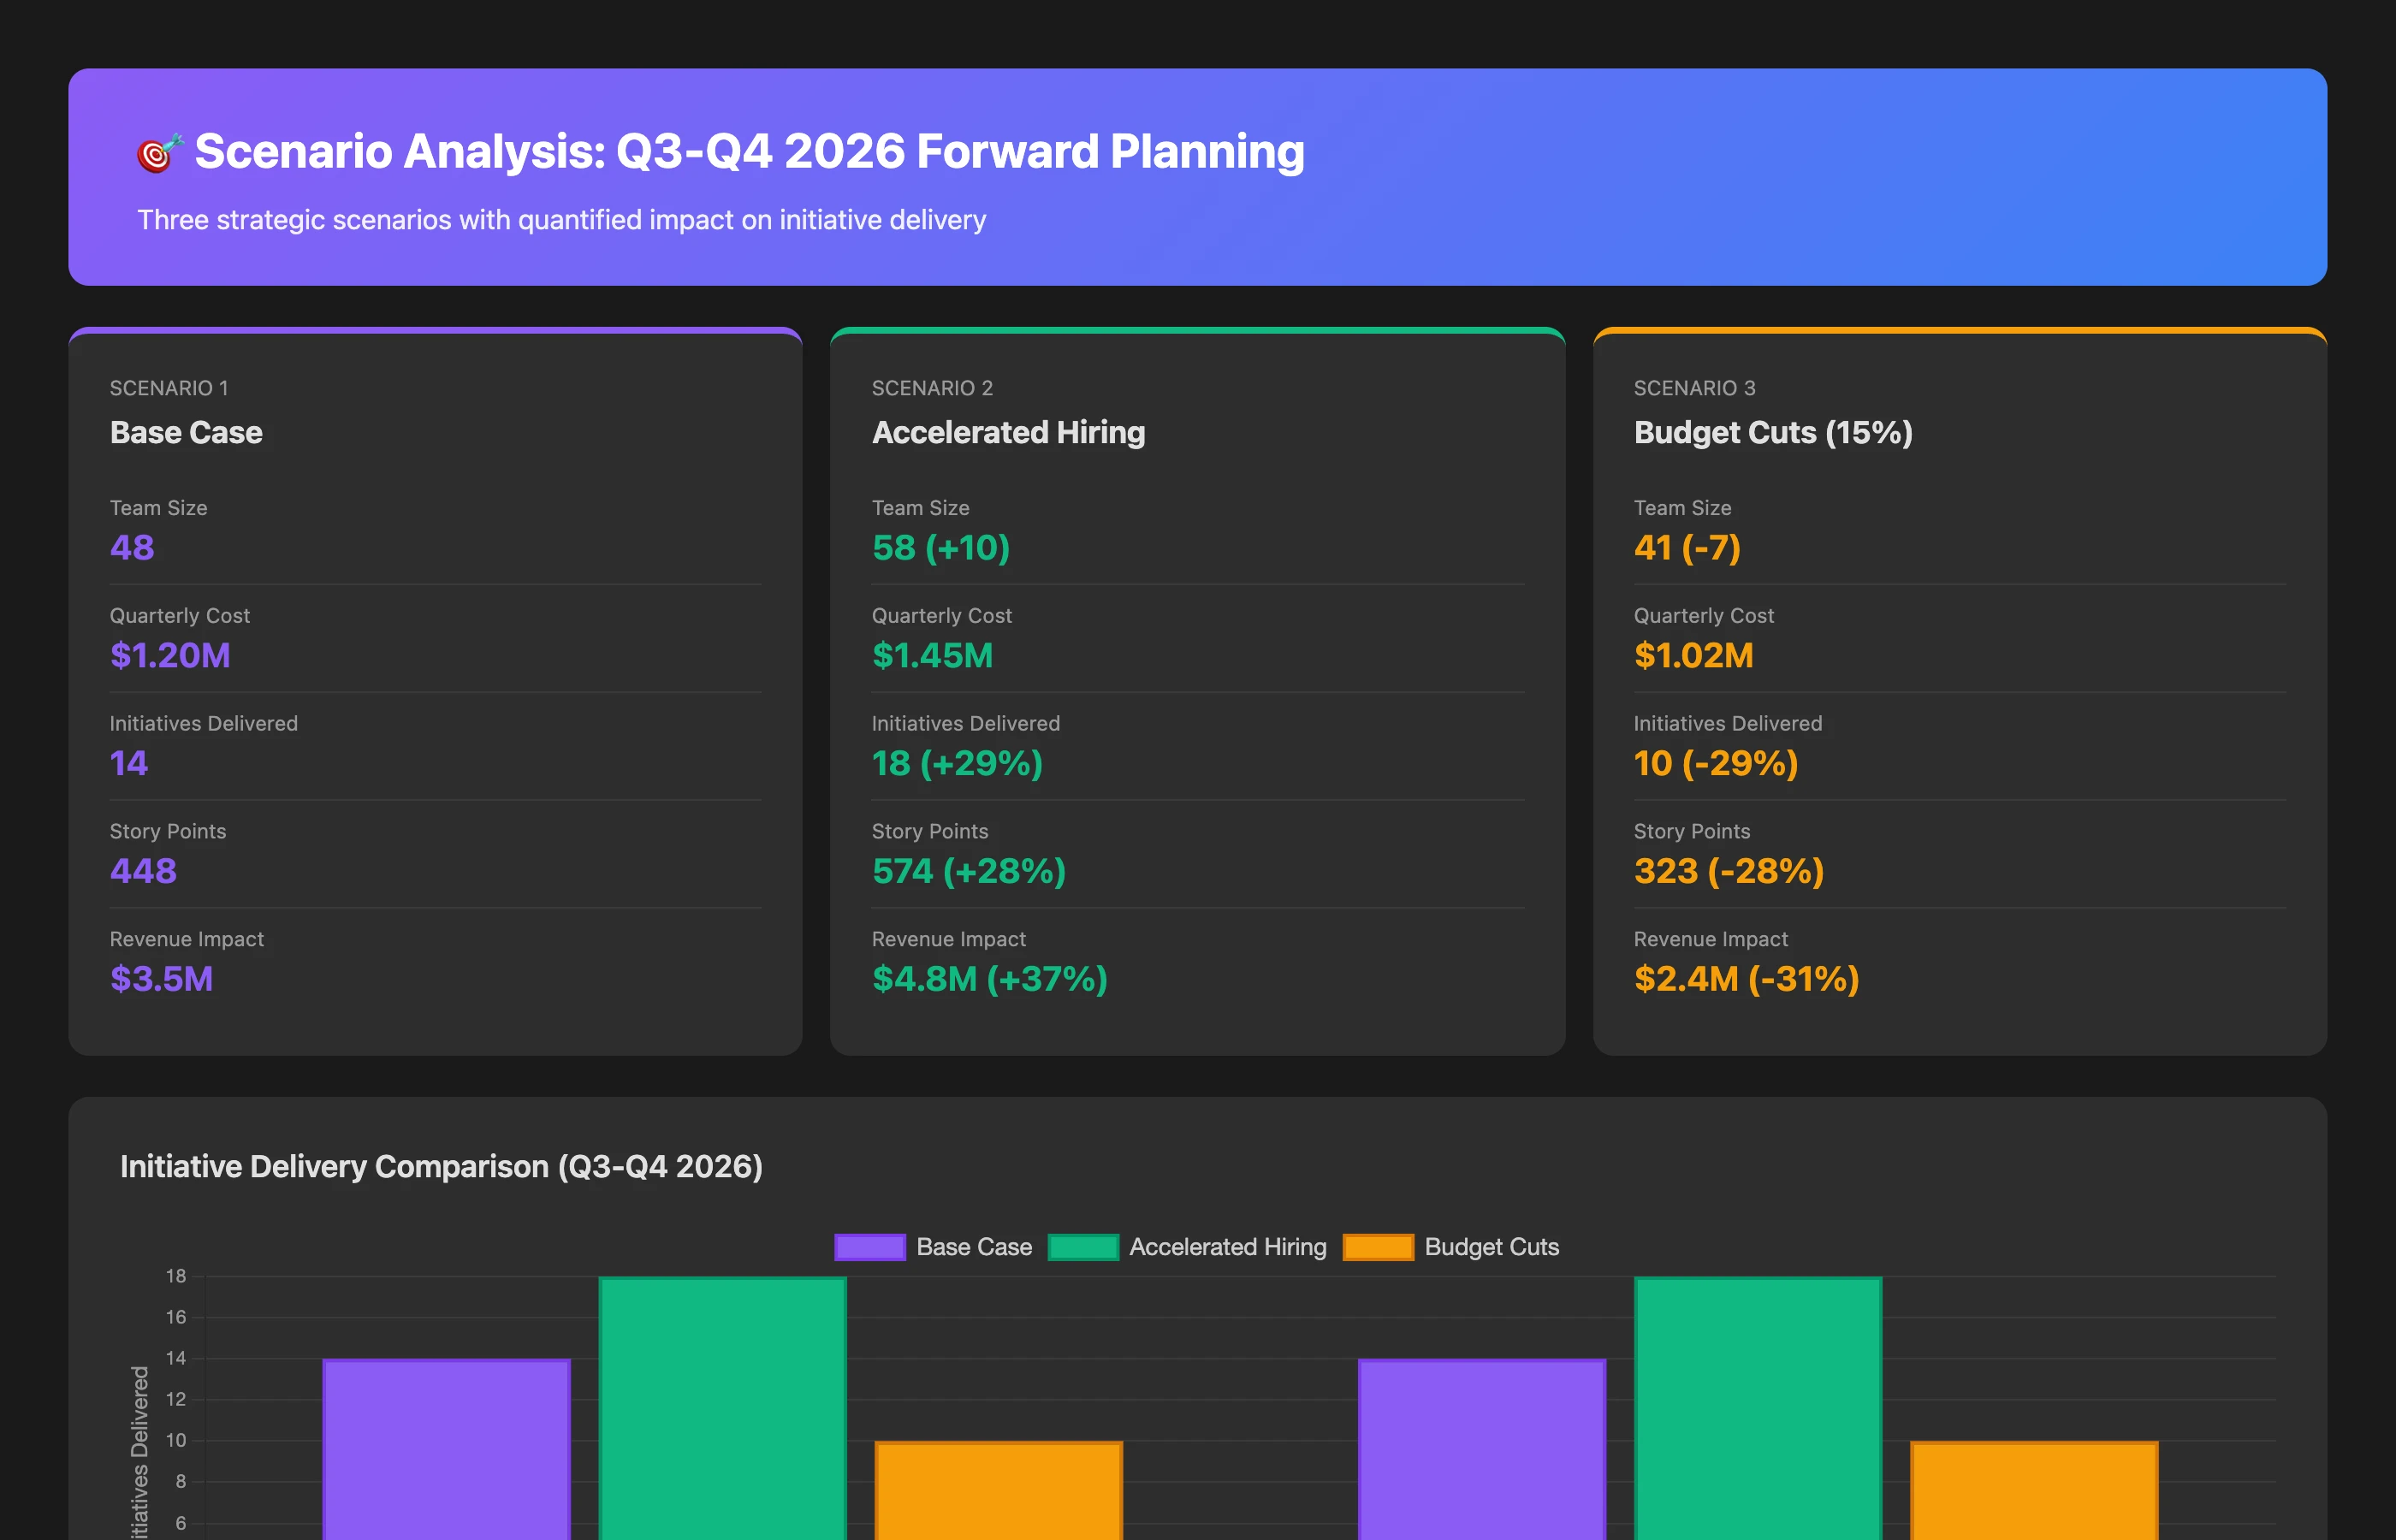
Create three forward-looking scenarios for Q3-Q4: base case, optimistic case with accelerated hiring, and constrained case with budget cuts. Show impact on strategic initiative delivery for each scenario.
[MCP generates detailed scenario analysis with quantified outcomes]
This conversational preparation ensures engineering leaders enter board meetings with comprehensive understanding and ready answers to likely questions—transforming board presentations from stressful unknowns to confident strategic discussions.
Practical Implementation: Getting Started with Board-Ready Reporting
Implementing effective board reporting requires both process changes and tooling enablement. Here's a practical roadmap:
Phase 1: Establish Reporting Framework (Month 1)
Step 1: Align with board on reporting priorities. Schedule a brief discussion with board members or your CEO to understand what questions they most want answered about engineering. Use the five categories in this article as a starting framework.
Step 2: Audit current data availability. Inventory what SDLC and financial data you can currently access and where gaps exist. Prioritize closing gaps that block core metrics.
Step 3: Define your metrics dictionary. Document which specific metrics you'll report, how they're calculated, and why they matter. This ensures consistency across quarters and eliminates confusion.
Phase 2: Connect Data Sources (Month 2)
Step 4: Connect Keypup MCP to your SDLC toolchain (Git platform, project management, CI/CD). This provides foundational engineering metrics access.
Step 5: Enable financial system integration. Work with your finance team to connect financial data sources to Keypup, ensuring proper access controls and data security.
Step 6: Validate data accuracy. Run test queries comparing Keypup outputs against manual calculations to ensure accuracy before relying on automated reporting.
Phase 3: Build Reporting Cadence (Month 3)
Step 7: Create quarterly reporting templates. Develop standard MCP query sets that generate each section of your board report, saving these as reusable templates.
Step 8: Implement monthly rehearsals. Don't wait for board meetings. Run your reporting queries monthly to track trends, identify issues early, and ensure data quality.
Step 9: Train your team. Ensure your engineering leadership team understands how to interpret metrics and can answer follow-up questions confidently.
Phase 4: Continuous Improvement (Ongoing)
Step 10: Solicit board feedback after each presentation. Ask what was helpful, what was confusing, and what additional questions they have. Refine your reporting based on this feedback.
Step 11: Expand financial correlation analysis. As you gather historical data, develop more sophisticated correlations between engineering metrics and business outcomes.
Step 12: Share insights beyond the board. The intelligence you develop for board reporting provides value across the organization. Share relevant insights with your engineering team, product leadership, and executive peers.
Conclusion: From Cost Center to Strategic Partner
Effective board reporting transforms how engineering leadership is perceived within organizations—from tactical executors to strategic partners who drive business outcomes. By connecting SDLC metrics with financial outcomes, providing predictive intelligence, and delivering diagnostic analysis, CTOs and VPs of Engineering demonstrate that engineering investment generates measurable returns and strategic capability.
Keypup MCP Server accelerates this transformation by eliminating the manual burden of data compilation and enabling conversational intelligence that answers board questions instantly. Instead of spending weeks assembling static reports that become obsolete immediately, engineering leaders can focus on strategic analysis, scenario planning, and proactive problem-solving.
The evolution from traditional engineering reporting to outcome-oriented board intelligence represents more than process improvement—it reflects software development's evolution from operational necessity to competitive differentiator. Companies that can demonstrate engineering efficiency, connect execution to business outcomes, and forecast capability with confidence gain strategic advantages: more efficient capital allocation, faster strategy adaptation, and stronger investor confidence.
Start your board reporting transformation today by connecting Keypup MCP to your SDLC and financial systems. The next time your board asks "What are we getting for our engineering investment?", you'll have comprehensive, data-backed answers that demonstrate strategic value and inform critical decisions. The era of guessing about engineering ROI is over—welcome to the age of strategic software development intelligence.
Ready to Transform Your Board Reporting?
Keypup MCP Server connects your entire SDLC and financial toolchain, enabling conversational queries that combine engineering metrics with business outcomes. Engineering leaders using Keypup reduce board reporting preparation from weeks to hours while delivering more comprehensive, accurate, and actionable intelligence.
Explore Keypup MCP Server →