TL;DR: Comprehensive issue and PR tracking shouldn't require switching between multiple dashboards or manually compiling reports. Keypup MCP Server enables engineering leaders to audit their entire development pipeline through simple natural language queries.
- Key Point 1: Query cycle times, identify bottlenecks, and analyze flow efficiency across your entire issue-to-PR-to-merge workflow using conversational prompts—no complex dashboard navigation required.
- Key Point 2: Detect "shadow work" (unlinked PRs), stale issues, zombie tasks, and pipeline health issues that traditional tools miss, ensuring accurate sprint metrics and velocity calculations.
- Key Point 3: Generate comprehensive audits in seconds that combine data from Jira, GitHub, GitLab, and other tools, providing executives and team leads with real-time visibility into development health and bottlenecks.
Introduction: The Hidden Cost of Poor Issue and PR Tracking
Engineering managers face a persistent challenge: maintaining accurate visibility into what their teams are actually working on. Despite investing in sophisticated project tracking tools like Jira, Linear, or ClickUp, and version control platforms like GitHub or GitLab, most organizations struggle with a fundamental disconnect between planned work (issues) and actual development activity (pull requests). This gap creates "shadow work"—development that happens off the radar—leading to inaccurate sprint metrics, unreliable velocity calculations, and frustrated stakeholders wondering why promised features aren't delivered on time.
The problem extends beyond just tracking. Engineering leaders need to understand where work gets stuck, why cycle times are increasing, and which processes are inefficient. Traditional approaches require manually correlating data across multiple tools, building complex dashboards, or running time-consuming queries that are outdated the moment they're generated. This reactive approach means bottlenecks are discovered too late, stale work accumulates unnoticed, and teams operate without the real-time feedback needed for continuous improvement.
The Keypup MCP (Model Context Protocol) Server changes this paradigm completely. Instead of navigating complex UIs or writing intricate queries, engineering managers can ask questions in plain English and receive comprehensive, data-driven answers in seconds. Want to know your average cycle time broken down by stage? Ask. Need to identify PRs that aren't linked to any Jira issue? Ask. Curious about flow efficiency across your entire development pipeline? Just ask. The MCP Server queries Keypup's unified data model—which harmonizes information from Git platforms, project trackers, and CI/CD systems—and delivers actionable insights exactly when you need them.
This article demonstrates how to leverage the Keypup MCP Server for comprehensive issue and PR tracking, analysis, and audit. Through seven real-world examples, you'll learn how to identify bottlenecks, eliminate shadow work, optimize flow efficiency, detect stale items, audit issue health, and generate executive-ready reports—all through simple, natural language queries. Whether you're an engineering manager seeking better visibility, a team lead troubleshooting delays, or an executive preparing for a board presentation, this guide will show you how the MCP Server transforms engineering intelligence from a dashboard-driven chore into a conversational, on-demand capability.
Before exploring solutions, it's essential to understand the depth of the tracking crisis facing modern engineering teams. The problem isn't a lack of data—organizations are drowning in metrics from Git commits, PR reviews, Jira updates, and CI/CD pipelines. The problem is that this data exists in silos, making it nearly impossible to answer fundamental questions about development efficiency without significant manual effort.
Consider these common scenarios: A product manager asks why a feature promised three sprints ago still isn't merged. The engineering manager must manually check Jira for the issue status, hop to GitHub to find linked PRs, verify review status, check CI/CD logs for deployment blockers, and piece together a narrative from fragments scattered across tools. A team lead suspects that PRs are sitting in review longer than usual but has no way to quantify the problem or identify which reviewers are overloaded without exporting data to spreadsheets and running manual analysis. An executive needs to understand overall development health for a quarterly review but receives conflicting metrics from different tools that don't align.
The frustration is palpable across engineering communities. Here's what developers and managers are saying:
We have all these fancy tools—Jira, GitHub, DataDog—but I can't get a simple answer to "how many PRs are sitting in review for more than 3 days?" without spending 30 minutes clicking through dashboards or writing a custom script that's obsolete next week.
This sentiment highlights a critical gap: data availability doesn't equal data accessibility. Another common complaint underscores the "shadow work" problem:
Our velocity metrics are a joke. We consistently show 40 story points completed per sprint, but I know developers are working on urgent fixes and refactoring that never gets tracked in Jira. We're flying blind on at least 20-30% of our engineering capacity.
Shadow work—development activity that isn't properly linked to tracked issues—is one of the most insidious problems in modern engineering organizations. It makes sprint planning unreliable, distorts productivity metrics, and leaves managers unable to defend their teams' actual accomplishments when velocity appears lower than reality. Traditional tools exacerbate this problem because linking PRs to issues is often manual, inconsistently enforced, and easy to forget during urgent firefighting.
Beyond shadow work, there's the "stale work" crisis: PRs and issues that languish for weeks or months, accumulating merge conflicts, blocking other work, and creating technical debt. A third complaint captures this frustration:
Our GitHub repo has over 50 open PRs, and probably half of them haven't been touched in weeks. Nobody knows what's still relevant, what should be closed, or what's blocking production. It's organizational chaos disguised as "work in progress."
Stale work isn't just clutter—it's a leading indicator of process breakdown. When PRs sit for weeks without activity, it signals reviewer overload, unclear priorities, scope creep, or abandonment. When issues remain "In Progress" despite no linked PR activity, it indicates miscommunication, context loss, or hidden blockers. Traditional tools show you the symptoms (open PRs, active issues) but don't help you diagnose the underlying disease.
The Keypup MCP Server addresses these challenges by providing a unified query interface over your entire development ecosystem. Instead of navigating multiple tools to piece together insights, you ask questions and receive complete, contextualized answers that connect Git activity with project tracking data. This approach eliminates the silos, manual effort, and delayed insights that plague traditional tools, enabling proactive management instead of reactive firefighting.
Use Case 1: Comprehensive Cycle Time Analysis
Understanding where time is spent in your development workflow is foundational to any improvement effort. However, calculating meaningful cycle times requires connecting data from multiple systems: issue creation dates from Jira, first PR creation from GitHub, review timestamps, approval times, and merge dates. Traditional approaches require exporting data, joining tables, and building complex calculations—a process that can take hours and produces snapshots that are immediately outdated.
The Keypup MCP Server makes cycle time analysis trivial through natural language queries that access Keypup's unified data model in real-time.
MCP Context
An engineering manager wants to understand where time is consumed across their entire issue-to-merge workflow. By asking the MCP Server to break down cycle times by stage, they can immediately identify which phases of development are consuming the most time and prioritize improvement efforts accordingly.
Prompt to Keypup MCP Server
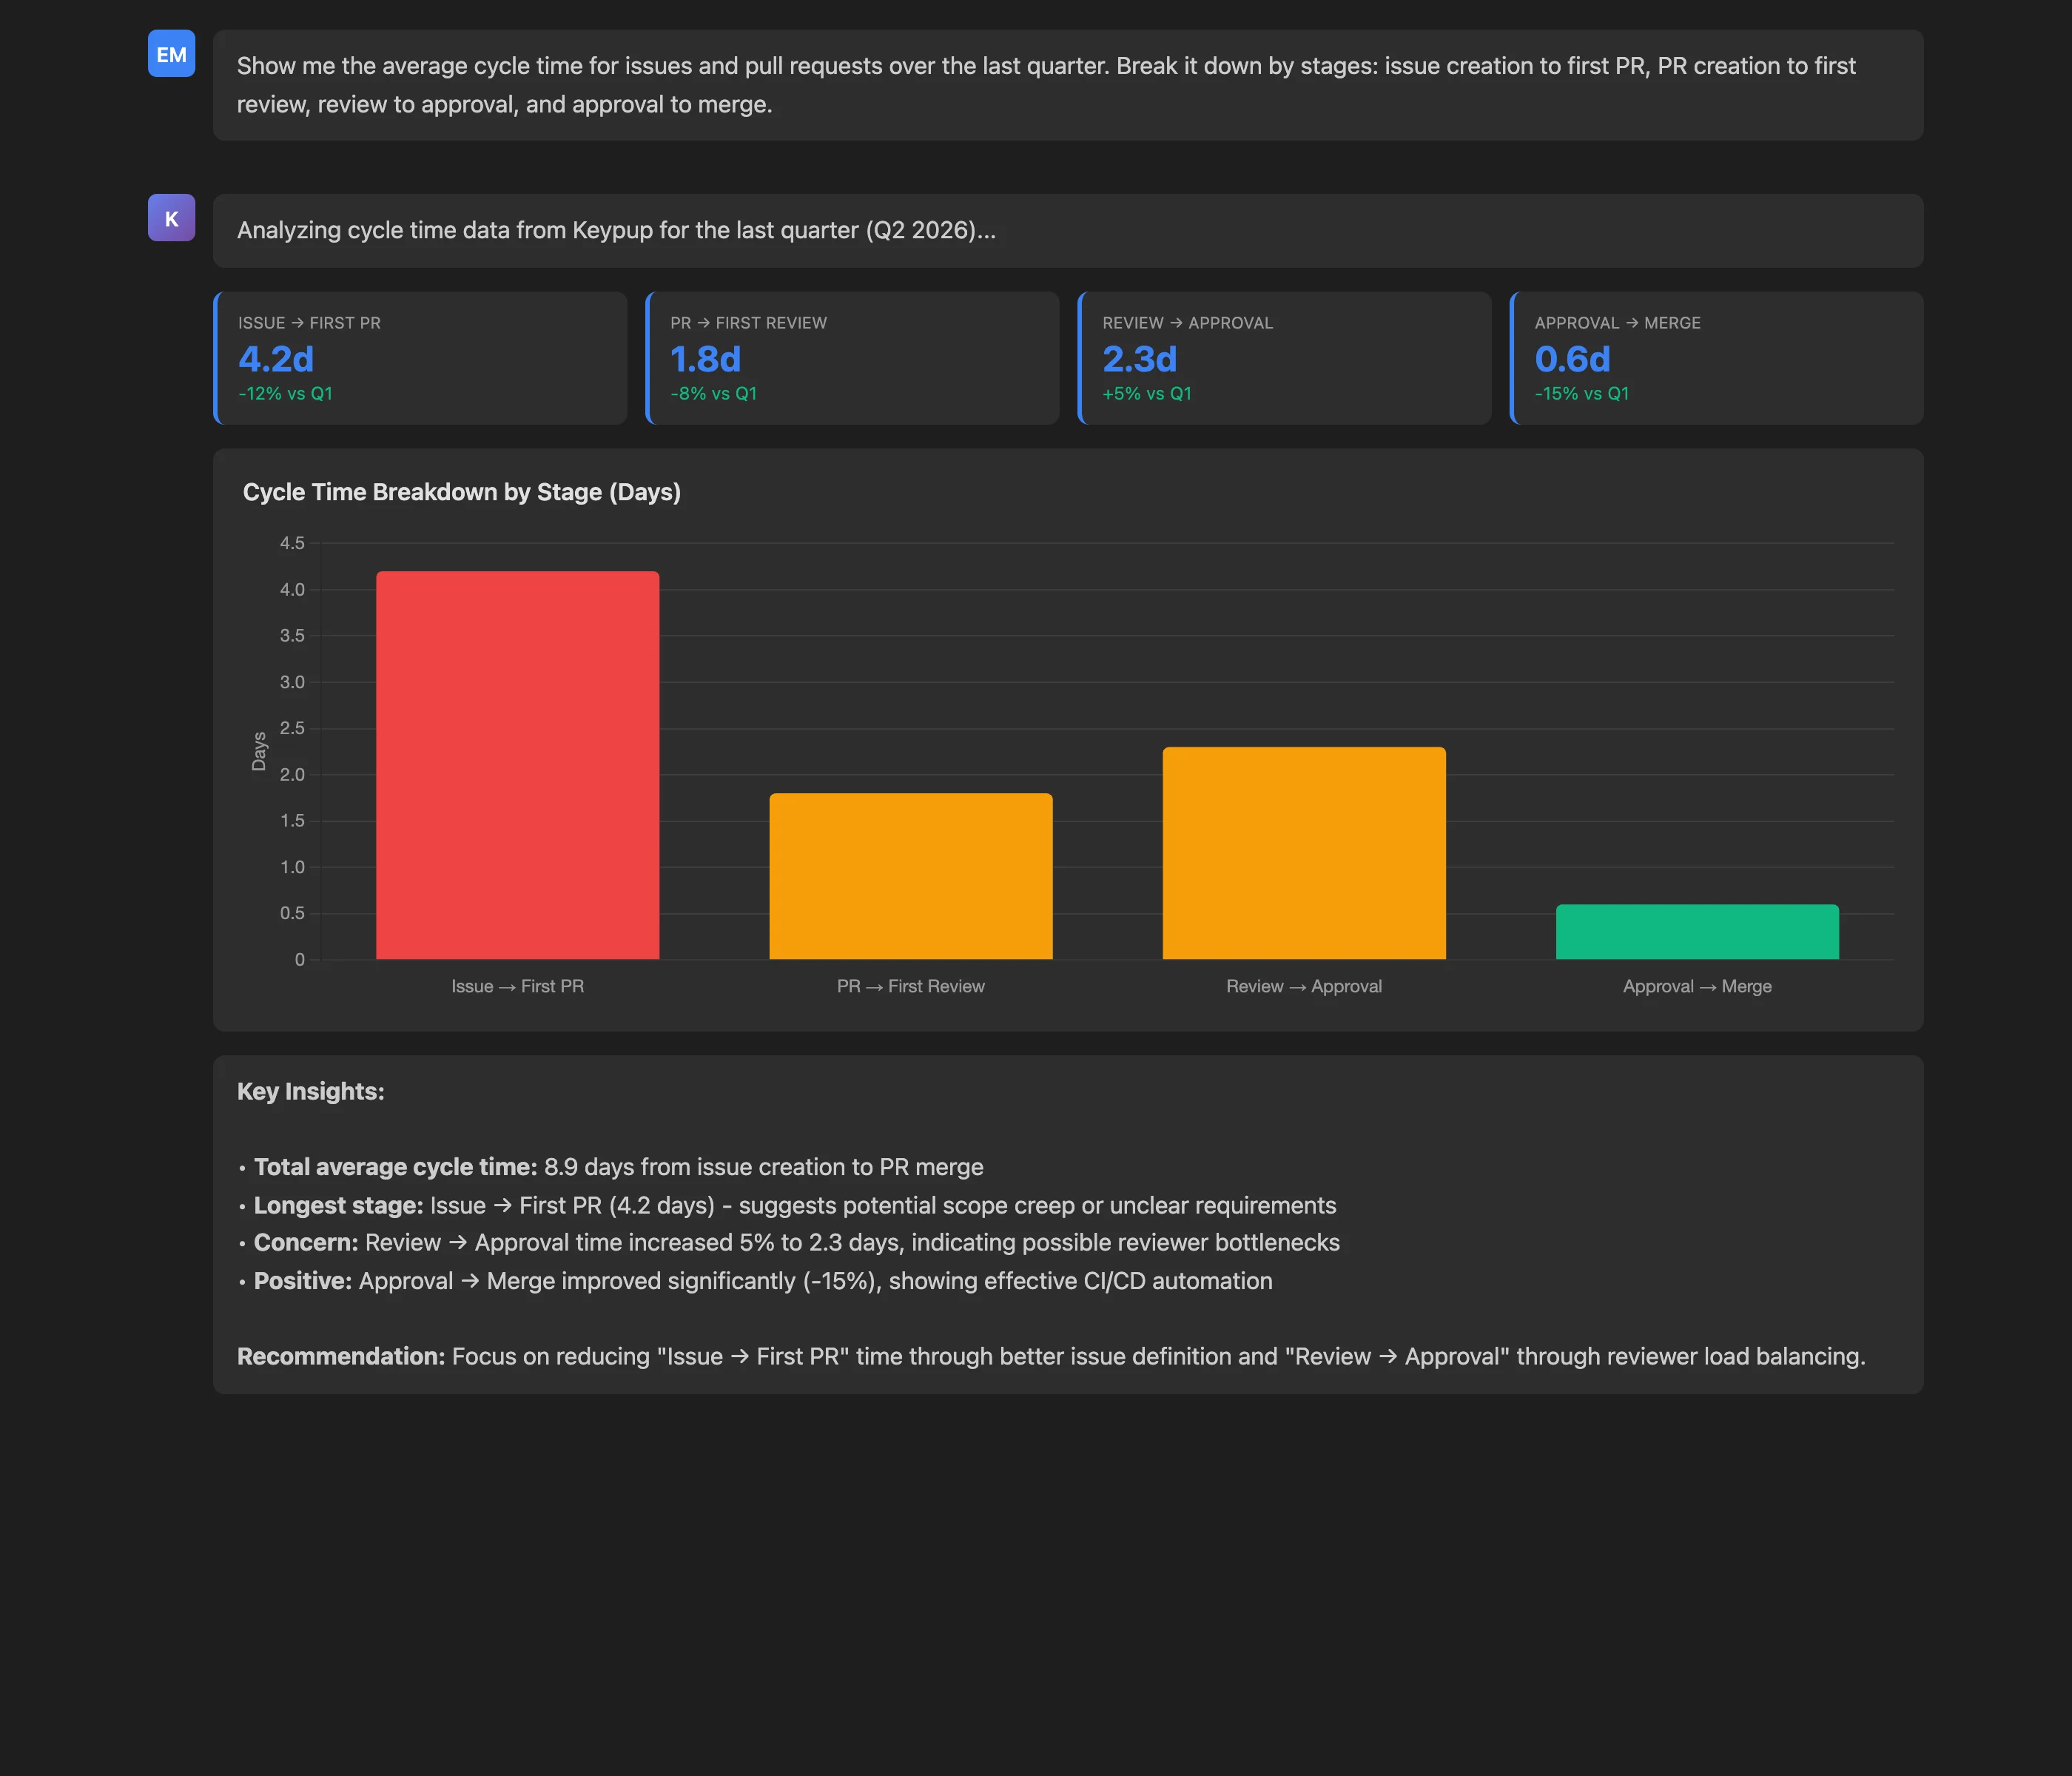
Show me the average cycle time for issues and pull requests over the last quarter. Break it down by stages: issue creation to first PR, PR creation to first review, review to approval, and approval to merge.
Key Insights: The MCP Server reveals that the average total cycle time is 8.9 days, with "Issue → First PR" consuming 4.2 days (47% of total time), followed by "Review → Approval" at 2.3 days. These insights immediately focus attention on the two stages with the highest improvement potential. Notably, the "Approval → Merge" stage is performing well at just 0.6 days, indicating effective CI/CD automation.
Actionable Outcomes: Armed with this breakdown, the engineering manager can:
- Investigate why issues take 4.2 days before work begins (scope creep, unclear requirements, priority confusion?)
- Address the 5% increase in review-to-approval time (reviewer overload, insufficient feedback clarity?)
- Celebrate the efficiency of merge automation while focusing improvement efforts where they'll have maximum impact
The beauty of this approach is its repeatability and real-time nature. The same query can be run weekly to track improvement trends, filtered by team or repository, or adjusted to different time periods—all through simple conversational modifications, no dashboard reconfiguration required.
Use Case 2: Identifying Workflow Bottlenecks
Cycle time analysis reveals what is slow, but bottleneck identification explains why. Bottlenecks are specific friction points where work accumulates, wait times spike, or throughput drops. They might be overburdened reviewers, unclear acceptance criteria causing excessive revision cycles, or process gaps like delayed reviewer assignment. Traditional tools show symptoms (long review times) but don't automatically connect them to root causes (specific reviewers handling 60% of PRs).
The MCP Server excels at bottleneck identification because it can correlate data across multiple dimensions—time, teams, reviewers, repositories, PR characteristics—and surface patterns that would require hours of manual analysis.
MCP Context
A team lead suspects that certain processes are creating delays but lacks concrete data to identify where intervention would be most effective. By querying the MCP Server for the top bottlenecks with affected PRs, delay metrics, and team impact, they can prioritize fixes based on actual data rather than intuition.
Prompt to Keypup MCP Server
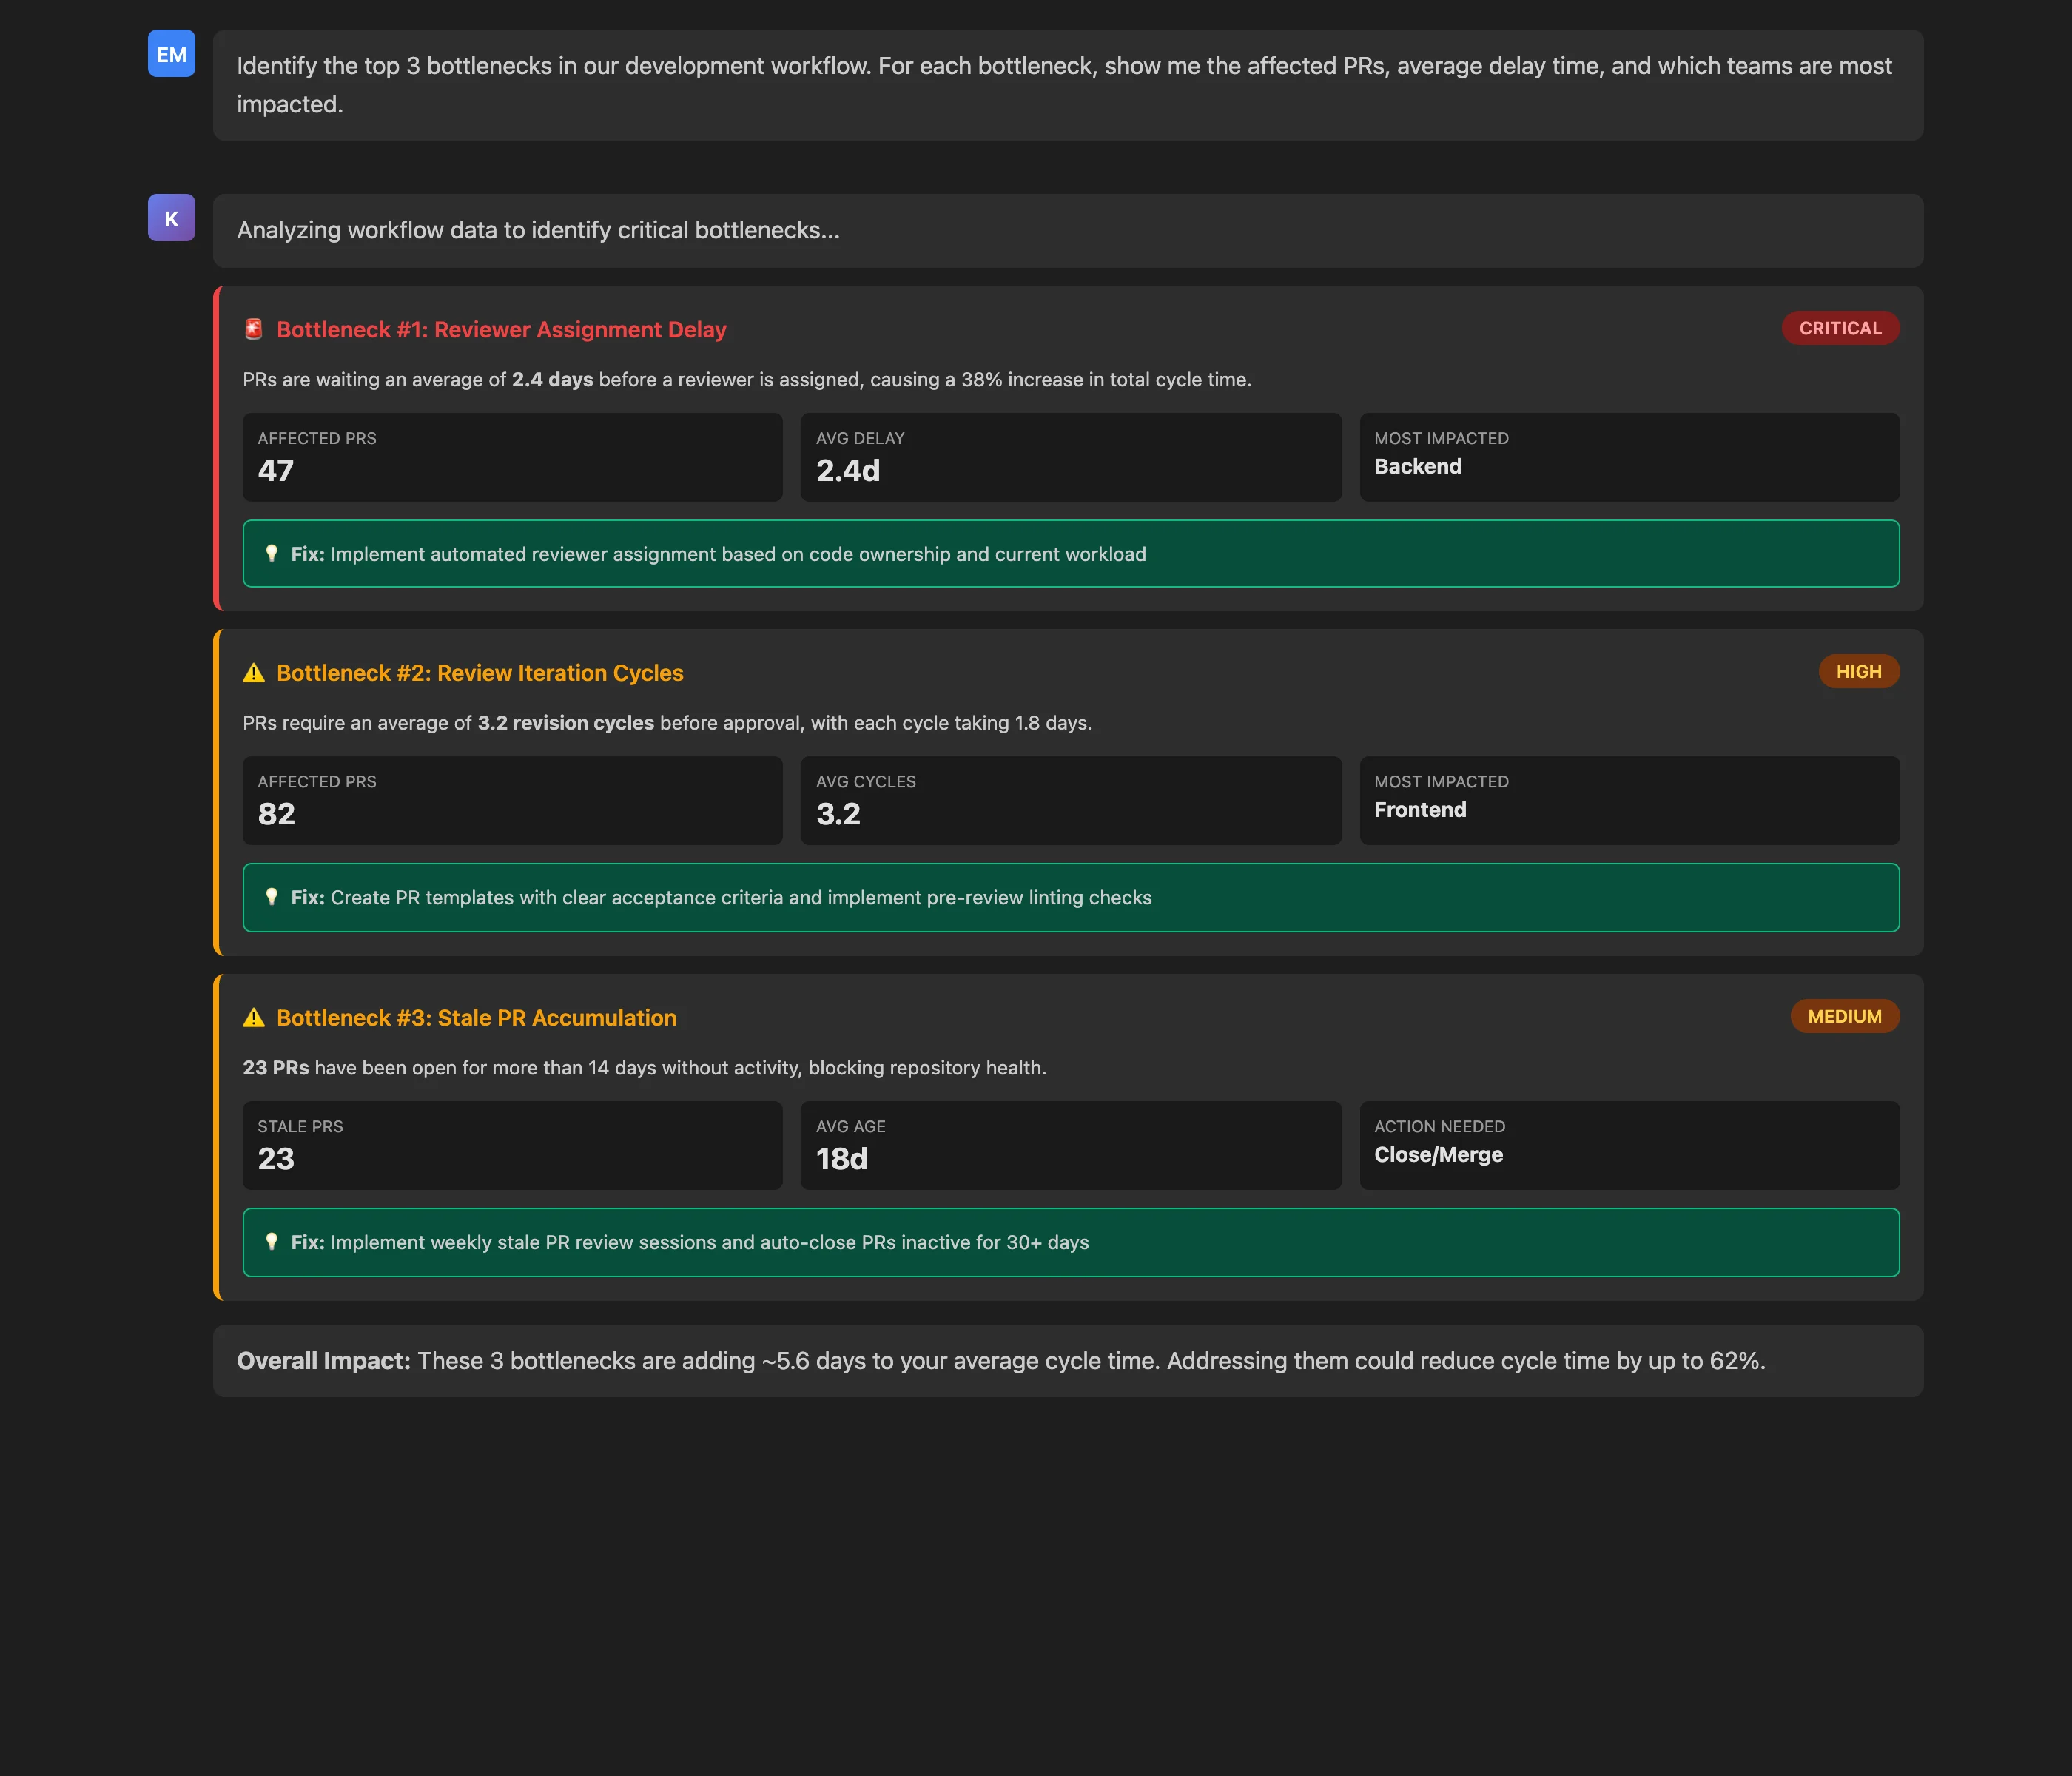
Identify the top 3 bottlenecks in our development workflow. For each bottleneck, show me the affected PRs, average delay time, and which teams are most impacted.
Key Insights: The analysis reveals three critical bottlenecks:
- Reviewer Assignment Delay (2.4 days, 47 PRs affected): PRs wait too long before anyone is assigned to review them, adding 38% to total cycle time
- Review Iteration Cycles (3.2 cycles, 82 PRs affected): PRs require multiple revision rounds, with each cycle taking 1.8 days
- Stale PR Accumulation (23 PRs, 18 days average age): Inactive PRs over 14 days are creating repository noise and merge conflicts
Actionable Outcomes: Each bottleneck comes with specific, data-driven recommendations:
- For assignment delays: Implement automated reviewer assignment based on code ownership and current workload
- For iteration cycles: Create PR templates with clear acceptance criteria and implement pre-review linting
- For stale PRs: Schedule weekly stale PR review sessions and auto-close PRs inactive for 30+ days
What makes this powerful is the granularity and context. The MCP Server doesn't just say "reviews are slow"—it identifies that the Backend team is most affected by assignment delays (47 PRs), while the Frontend team suffers from excessive iteration cycles (82 PRs). This level of detail enables targeted interventions rather than one-size-fits-all solutions.
Moreover, the MCP Server quantifies potential impact: "These 3 bottlenecks are adding ~5.6 days to your average cycle time. Addressing them could reduce cycle time by up to 62%." This business case makes it easier to justify process changes or tool investments to stakeholders.
Use Case 3: Detecting Shadow Work and Tracking Gaps
Shadow work—development activity not properly linked to tracked issues—is perhaps the most dangerous form of inefficiency because it's invisible to traditional project management tools. When 10-15% of PR activity isn't connected to Jira issues, sprint planning becomes guesswork, velocity metrics become fiction, and stakeholders lose confidence in engineering estimates. Yet detecting shadow work requires cross-referencing every PR against issue tracking systems, checking link validity, and verifying status alignment—a manual nightmare.
The Keypup MCP Server makes shadow work visible by querying across Git and project tracking platforms simultaneously, identifying PRs with missing or misaligned issue links.
MCP Context
An engineering director needs to understand the extent of untracked work in their organization. By querying for PRs that aren't linked to any Jira issue or are linked to issues with incorrect status, they can quantify the shadow work problem and implement governance measures to prevent future occurrences.
Prompt to Keypup MCP Server
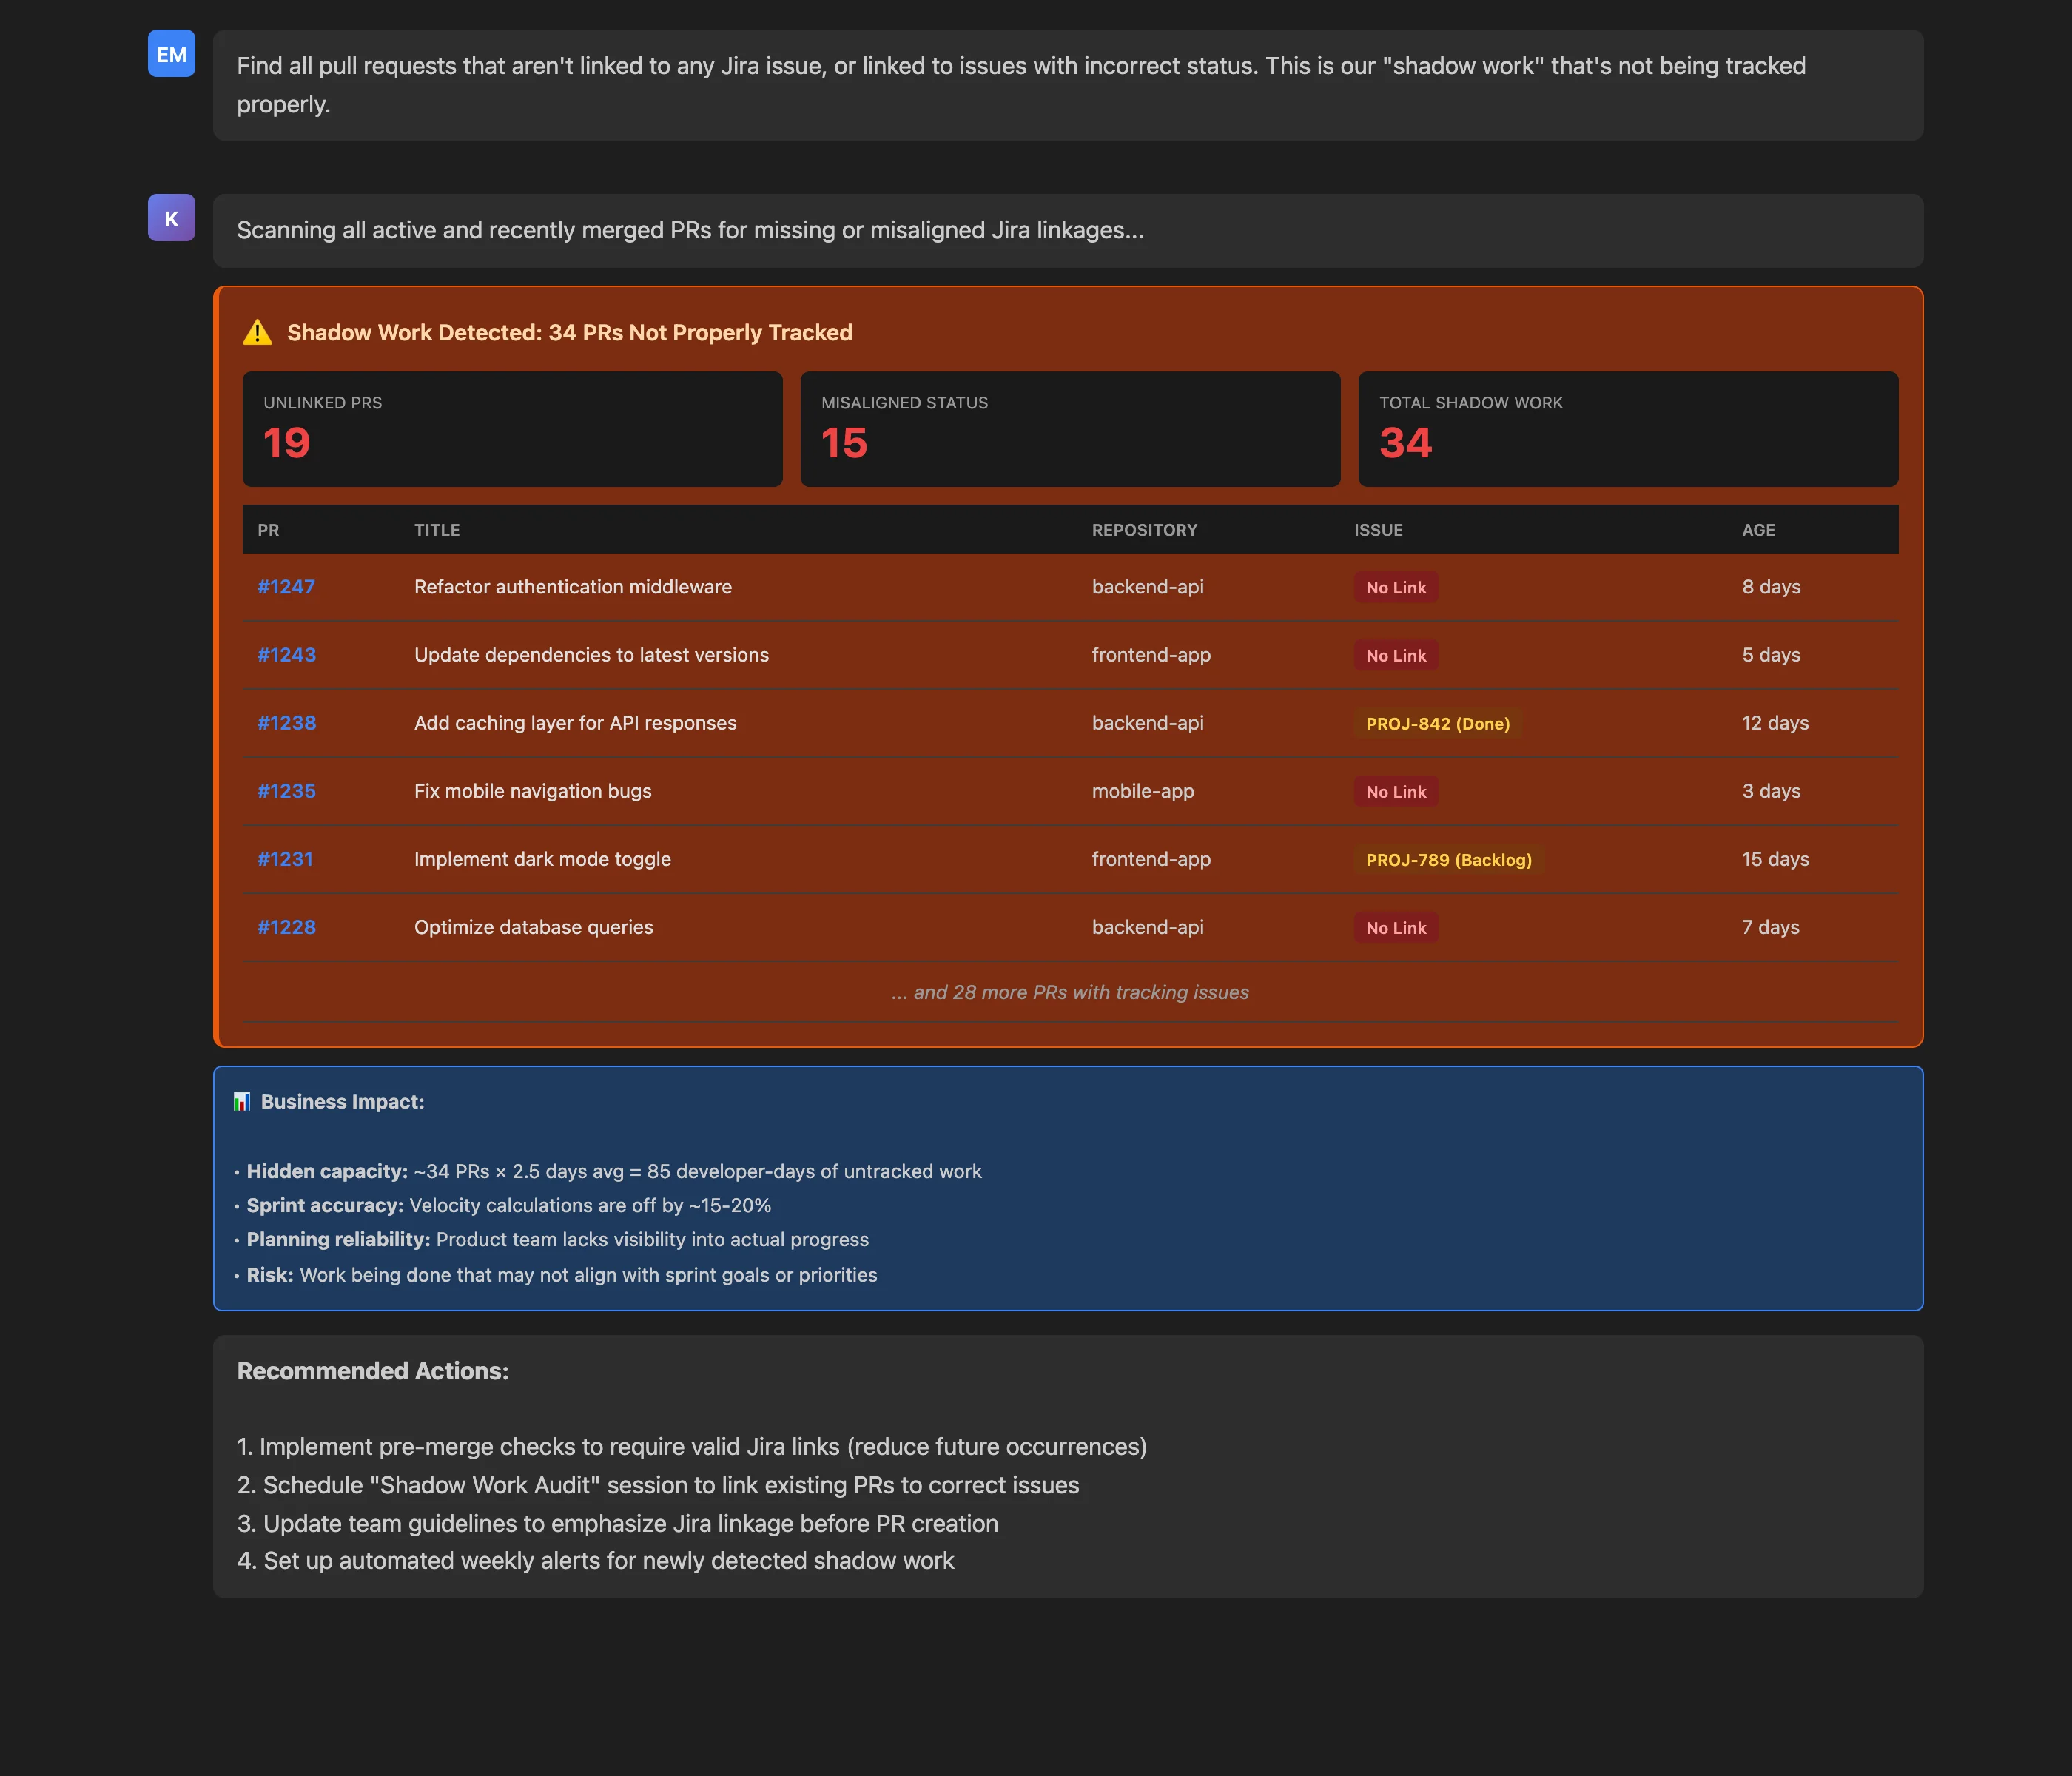
Find all pull requests that aren't linked to any Jira issue, or linked to issues with incorrect status. This is our "shadow work" that's not being tracked properly.
Key Insights: The analysis uncovers 34 PRs representing shadow work:
- 19 PRs completely unlinked to any Jira issue
- 15 PRs linked to issues with misaligned status (e.g., PR is active but Jira issue is "Done" or "Backlog")
The MCP Server goes beyond detection to quantify business impact:
- Hidden capacity: 34 PRs × 2.5 days average = 85 developer-days of untracked work
- Sprint accuracy: Velocity calculations are off by 15-20%
- Planning reliability: Product team lacks visibility into actual progress
- Risk: Work being done that may not align with sprint goals
Actionable Outcomes: The detailed list of specific PRs (with titles, repositories, and current status) enables immediate remediation:
- Short-term: Schedule "Shadow Work Audit" session to link existing PRs to correct issues
- Medium-term: Update team guidelines to emphasize Jira linkage before PR creation
- Long-term: Implement pre-merge checks requiring valid Jira links (preventing future shadow work)
- Ongoing: Set up automated weekly alerts for newly detected shadow work
This use case demonstrates a critical MCP Server strength: proactive governance. Instead of discovering shadow work during post-mortems ("Why did this sprint fail?"), teams can query weekly, catch issues early, and maintain tracking hygiene before problems compound.
Use Case 4: Measuring Flow Efficiency
Flow efficiency is a critical DevOps metric that measures what percentage of total cycle time is spent on value-adding activities (coding, review, testing) versus wait time (queues, handoffs, blocked states). High-performing teams typically achieve 30-40% flow efficiency, while struggling teams often operate below 20%. However, calculating flow efficiency requires detailed time tracking across every workflow stage—data that's scattered across multiple systems and rarely synthesized.
The Keypup MCP Server calculates flow efficiency automatically by analyzing timestamps from issue creation through PR merge, categorizing time into value-adding versus wait states based on activity signals.
MCP Context
An engineering leader wants to understand not just cycle time, but how that time is spent. By querying for flow efficiency, they can see the ratio of productive work to idle waiting, identify where work sits longest without activity, and benchmark their team against industry standards.
Prompt to Keypup MCP Server
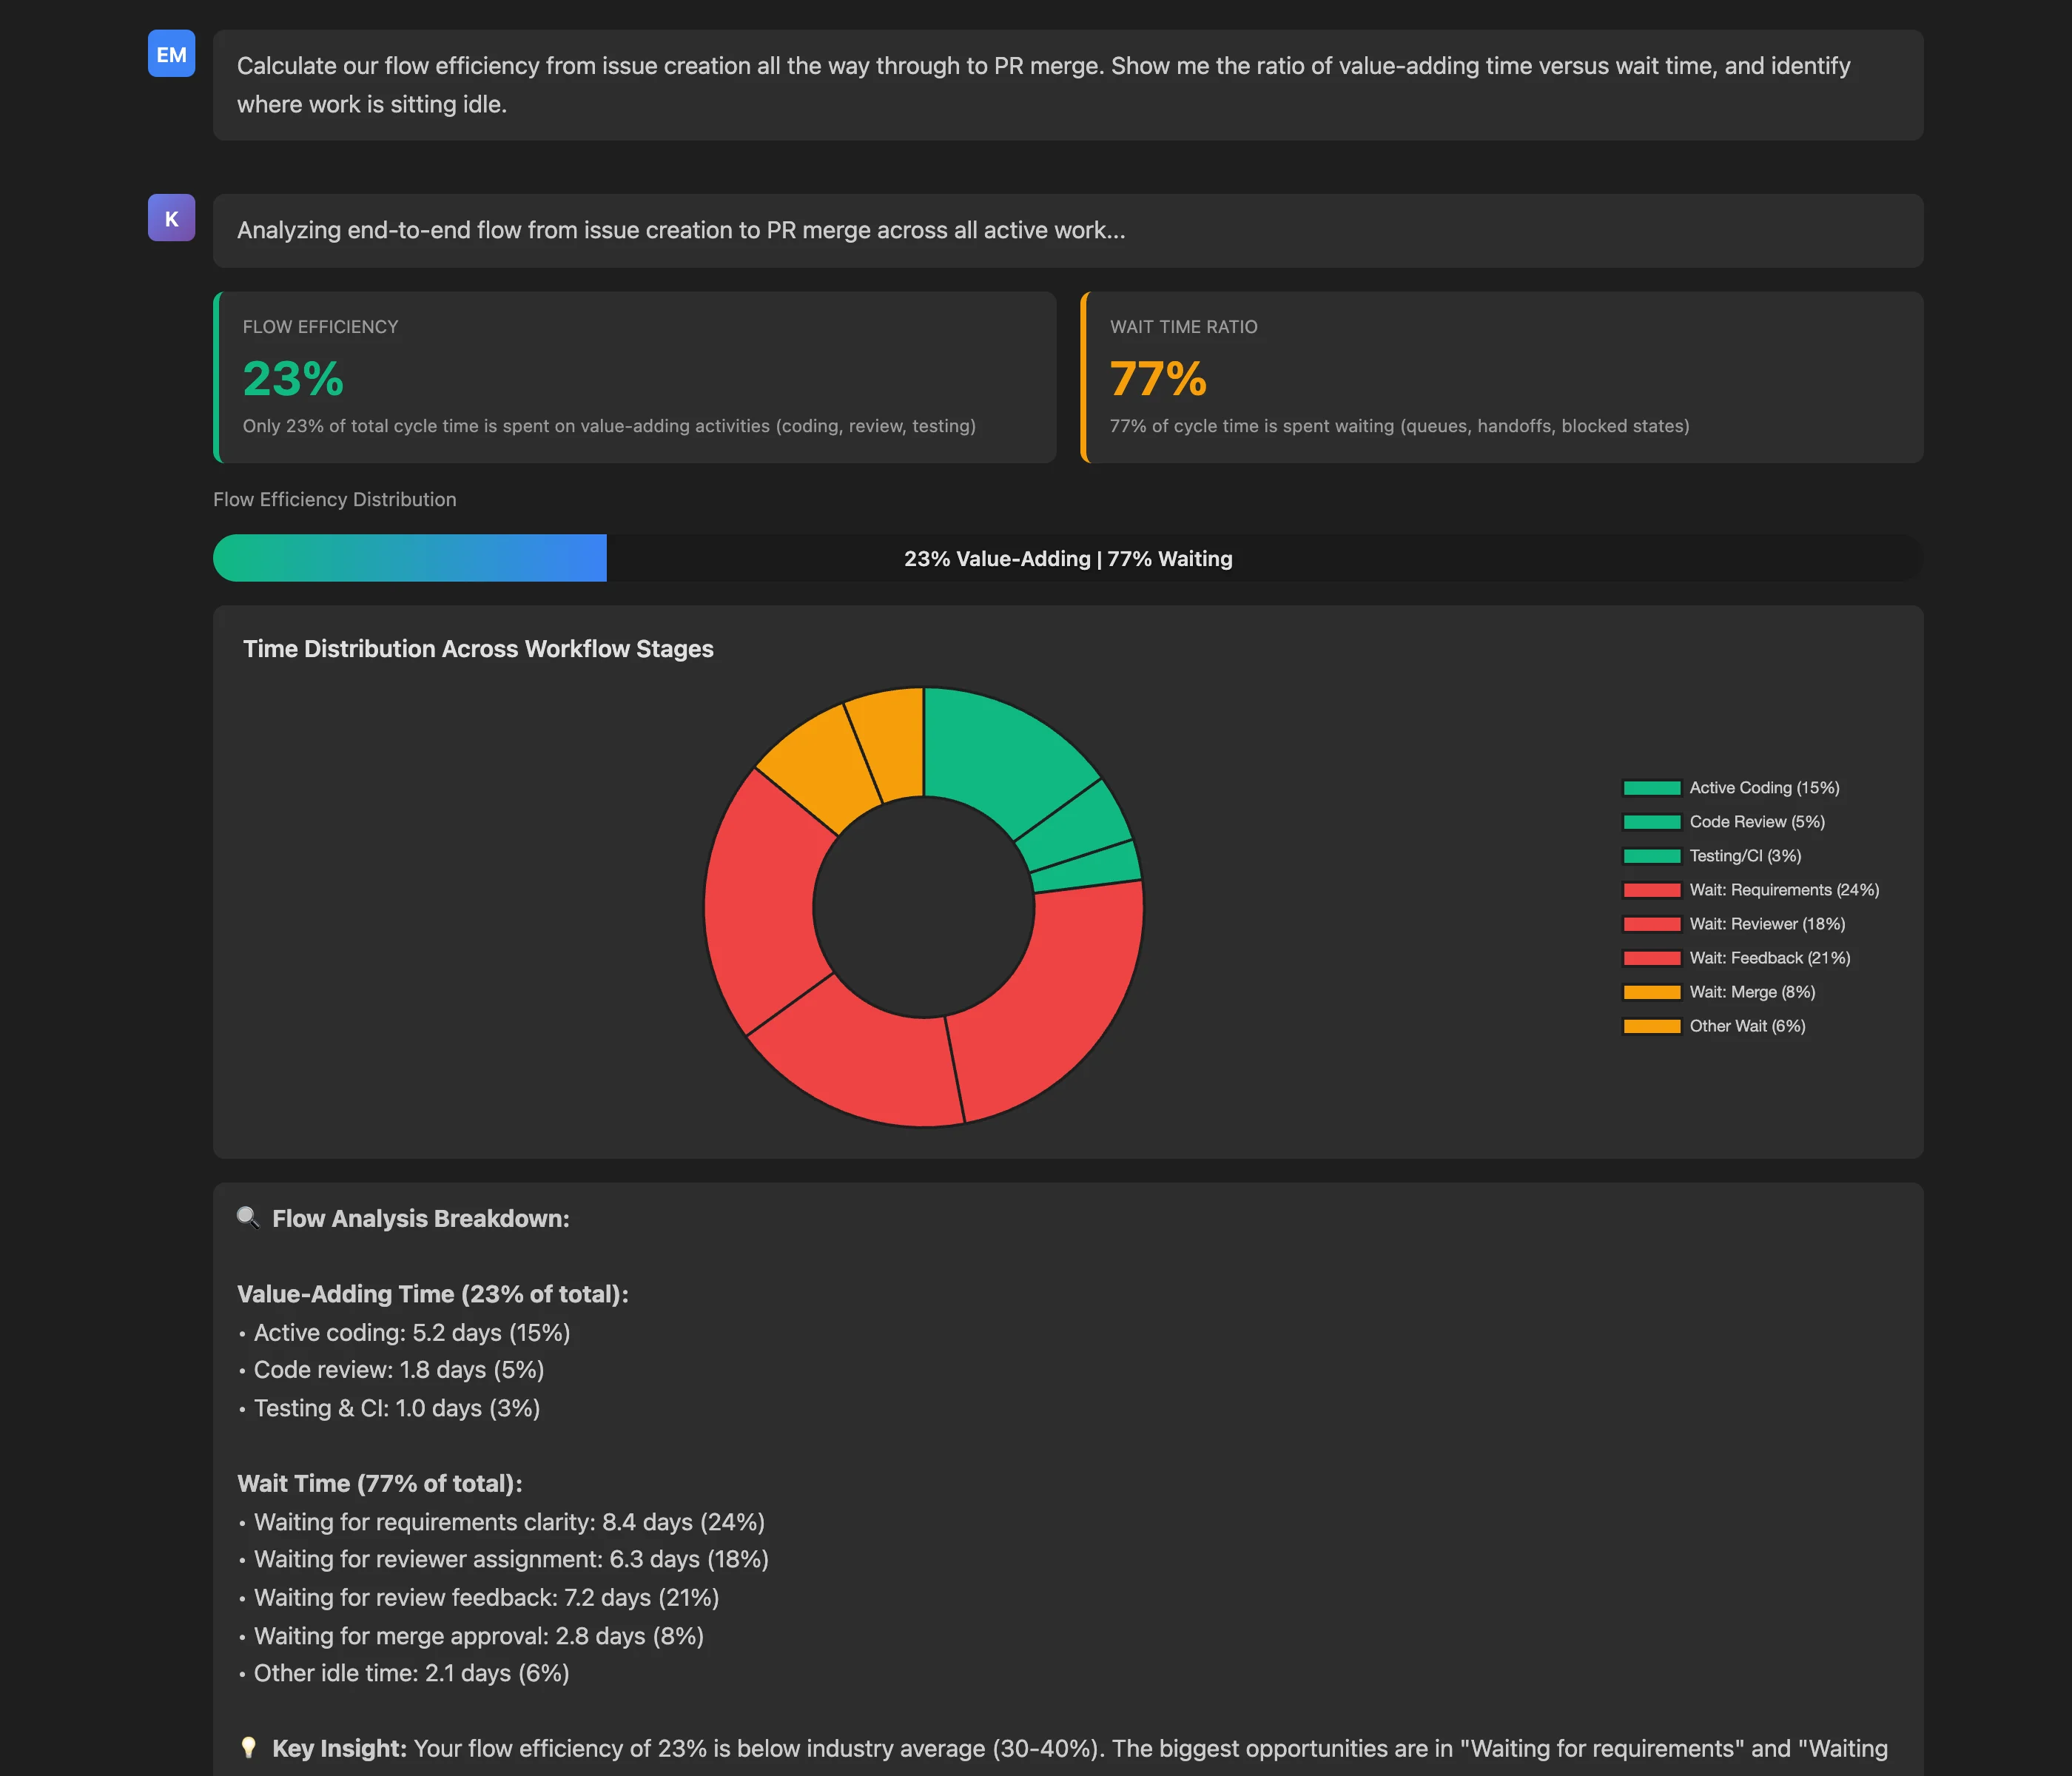
Calculate our flow efficiency from issue creation all the way through to PR merge. Show me the ratio of value-adding time versus wait time, and identify where work is sitting idle.
Key Insights: The flow efficiency analysis reveals troubling but actionable results:
- Flow Efficiency: 23% (below industry average of 30-40%)
- Wait Time: 77% (over three-quarters of cycle time is spent waiting, not working)
The MCP Server breaks down time distribution across workflow stages:
- Value-Adding Time (23% total):
- Active coding: 5.2 days (15%)
- Code review: 1.8 days (5%)
- Testing & CI: 1.0 days (3%)
- Wait Time (77% total):
- Waiting for requirements clarity: 8.4 days (24%)
- Waiting for reviewer assignment: 6.3 days (18%)
- Waiting for review feedback: 7.2 days (21%)
- Waiting for merge approval: 2.8 days (8%)
Actionable Outcomes: The detailed breakdown immediately highlights the biggest opportunities:
- Requirements clarity (8.4 days, 24% of total): Issues need better definition before work begins—implement definition-of-ready checklists
- Review feedback (7.2 days, 21% of total): Long gaps between review comments—implement SLAs for review responsiveness
- Reviewer assignment (6.3 days, 18% of total): Automate assignment based on code ownership and current workload
The MCP Server even provides benchmarking: "Your flow efficiency of 23% is below industry average (30-40%). Addressing 'Waiting for requirements' and 'Waiting for review feedback' could improve flow efficiency to 35-40%."
This insight transforms abstract cycle time numbers into concrete process improvements with quantifiable impact. Instead of vague directives like "we need to move faster," teams get specific targets: "Reduce requirements wait time from 8.4 days to 5 days, and you'll improve flow efficiency by 10 percentage points."
Use Case 5: Identifying Stale Pull Requests
Stale pull requests—those open for extended periods without activity—are symptoms of deeper organizational problems. They might indicate abandoned work, reviewer overload, scope creep, blocked dependencies, or simply forgotten PRs that should have been closed. Beyond creating repository clutter, stale PRs accumulate merge conflicts, make it harder to track truly active work, and represent sunk costs from developer time that may never deliver value.
Traditional tools show open PRs but don't distinguish active work from abandoned drafts. The MCP Server can identify stale PRs based on configurable criteria (age, inactivity period, missing links) and provide context for triage decisions.
MCP Context
A team lead wants to clean up their repository and understand which PRs need immediate attention versus which should be closed. By querying for PRs open more than 14 days with no recent activity, they can systematically triage stale work and establish policies to prevent future accumulation.
Prompt to Keypup MCP Server
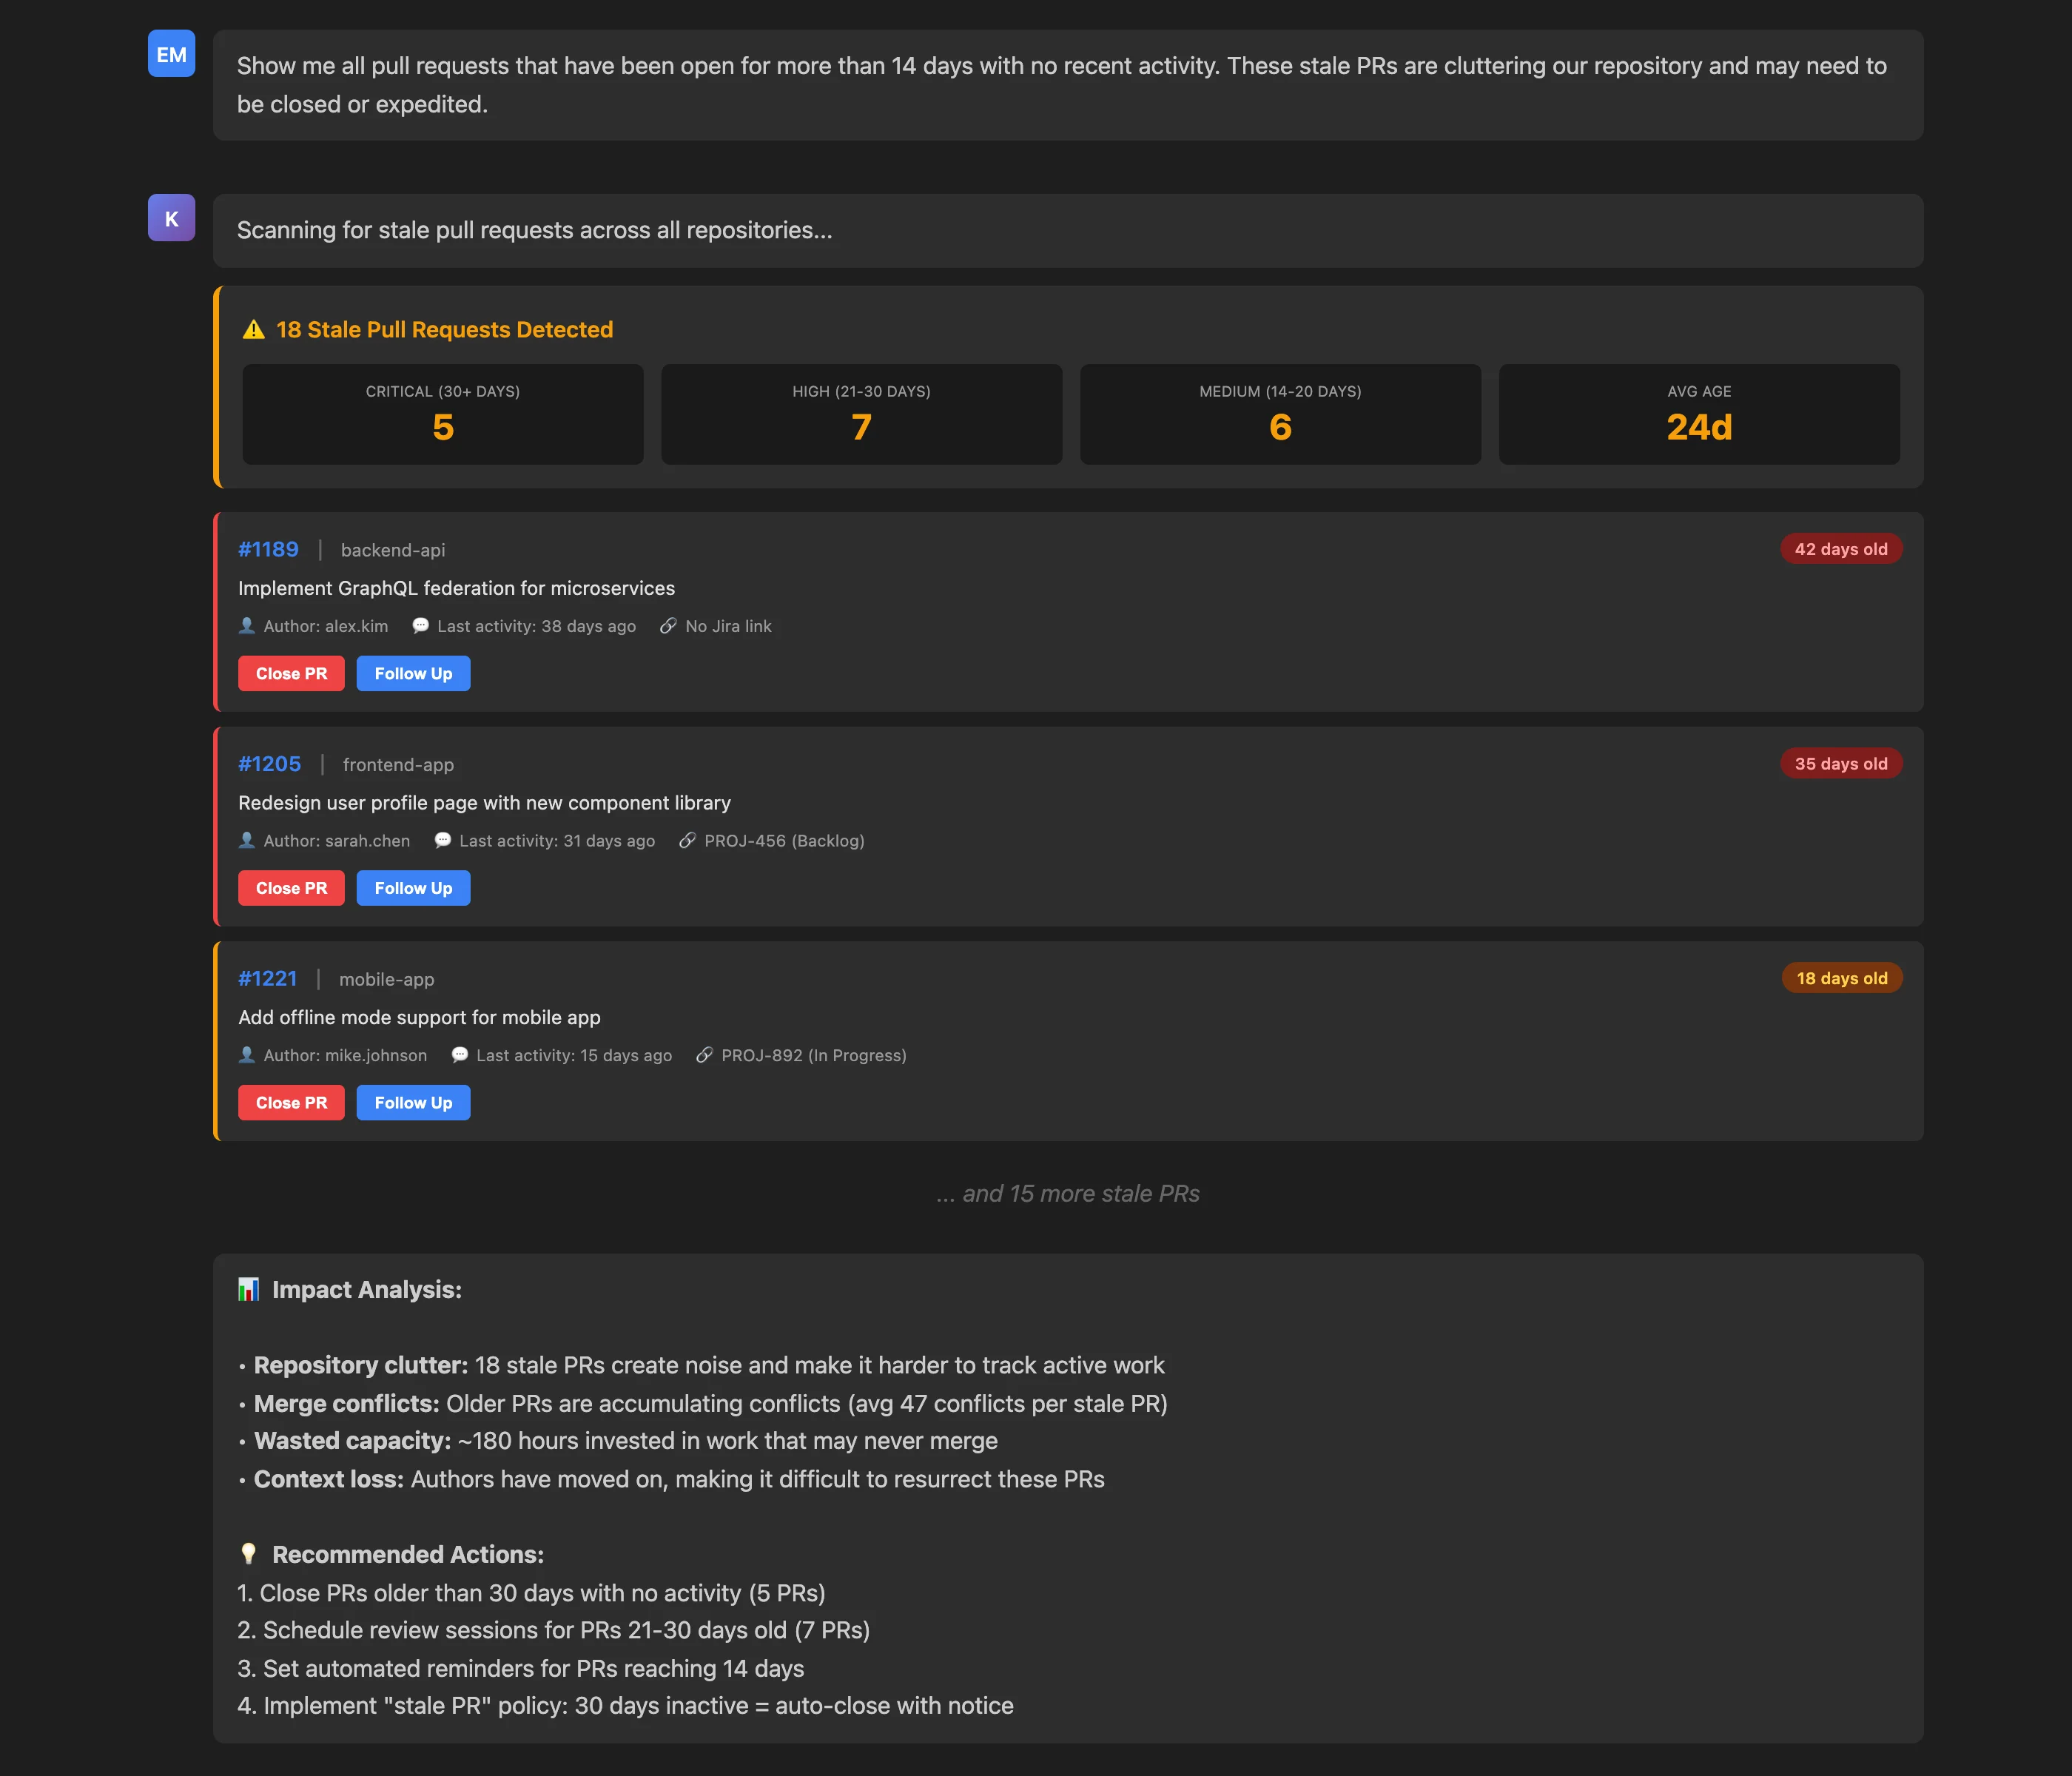
Show me all pull requests that have been open for more than 14 days with no recent activity. These stale PRs are cluttering our repository and may need to be closed or expedited.
Key Insights: The stale PR scan reveals 18 problematic PRs distributed across severity levels:
- Critical (30+ days): 5 PRs averaging 42 days old
- High (21-30 days): 7 PRs with no activity for weeks
- Medium (14-20 days): 6 PRs approaching stale threshold
For each PR, the MCP Server provides critical context:
- PR number and title: Quick identification
- Repository: Where the problem exists
- Author: Who to follow up with
- Last activity: How long since any action
- Jira link status: Whether tracked properly
Actionable Outcomes: The analysis quantifies impact and provides triage guidance:
- Repository clutter: 18 stale PRs create noise making active work harder to track
- Merge conflicts: Older PRs averaging 47 conflicts per stale PR
- Wasted capacity: ~180 hours invested in work that may never merge
- Context loss: Authors moved on, making resurrection difficult
Recommended actions are specific and prioritized:
- Close PRs older than 30 days with no activity (5 PRs)
- Schedule review sessions for PRs 21-30 days old (7 PRs)
- Set automated reminders for PRs reaching 14 days
- Implement "stale PR" policy: 30 days inactive = auto-close with notice
What makes this particularly valuable is the ongoing governance capability. By running this query weekly, teams can catch PRs before they become stale, establish accountability for long-running work, and maintain repository hygiene proactively rather than reactively cleaning up every quarter.
Use Case 6: Auditing Issue Health and Status Integrity
While stale PRs create Git repository problems, "zombie issues"—Jira issues marked "In Progress" despite no actual work happening—create planning chaos. These issues distort sprint capacity, mislead stakeholders about progress, and indicate organizational dysfunction. Similarly, issues that should be closed (all PRs merged) but remain open inflate backlog counts and waste time in planning sessions.
The Keypup MCP Server audits issue health by cross-referencing Jira status with actual Git activity, identifying misalignments that indicate stale, forgotten, or improperly managed work.
MCP Context
An engineering manager preparing for quarterly planning wants to ensure their issue tracker reflects reality. By running a comprehensive issue health check, they can identify zombie issues, issues ready to close, orphaned issues, and other anomalies before they distort planning decisions.
Prompt to Keypup MCP Server
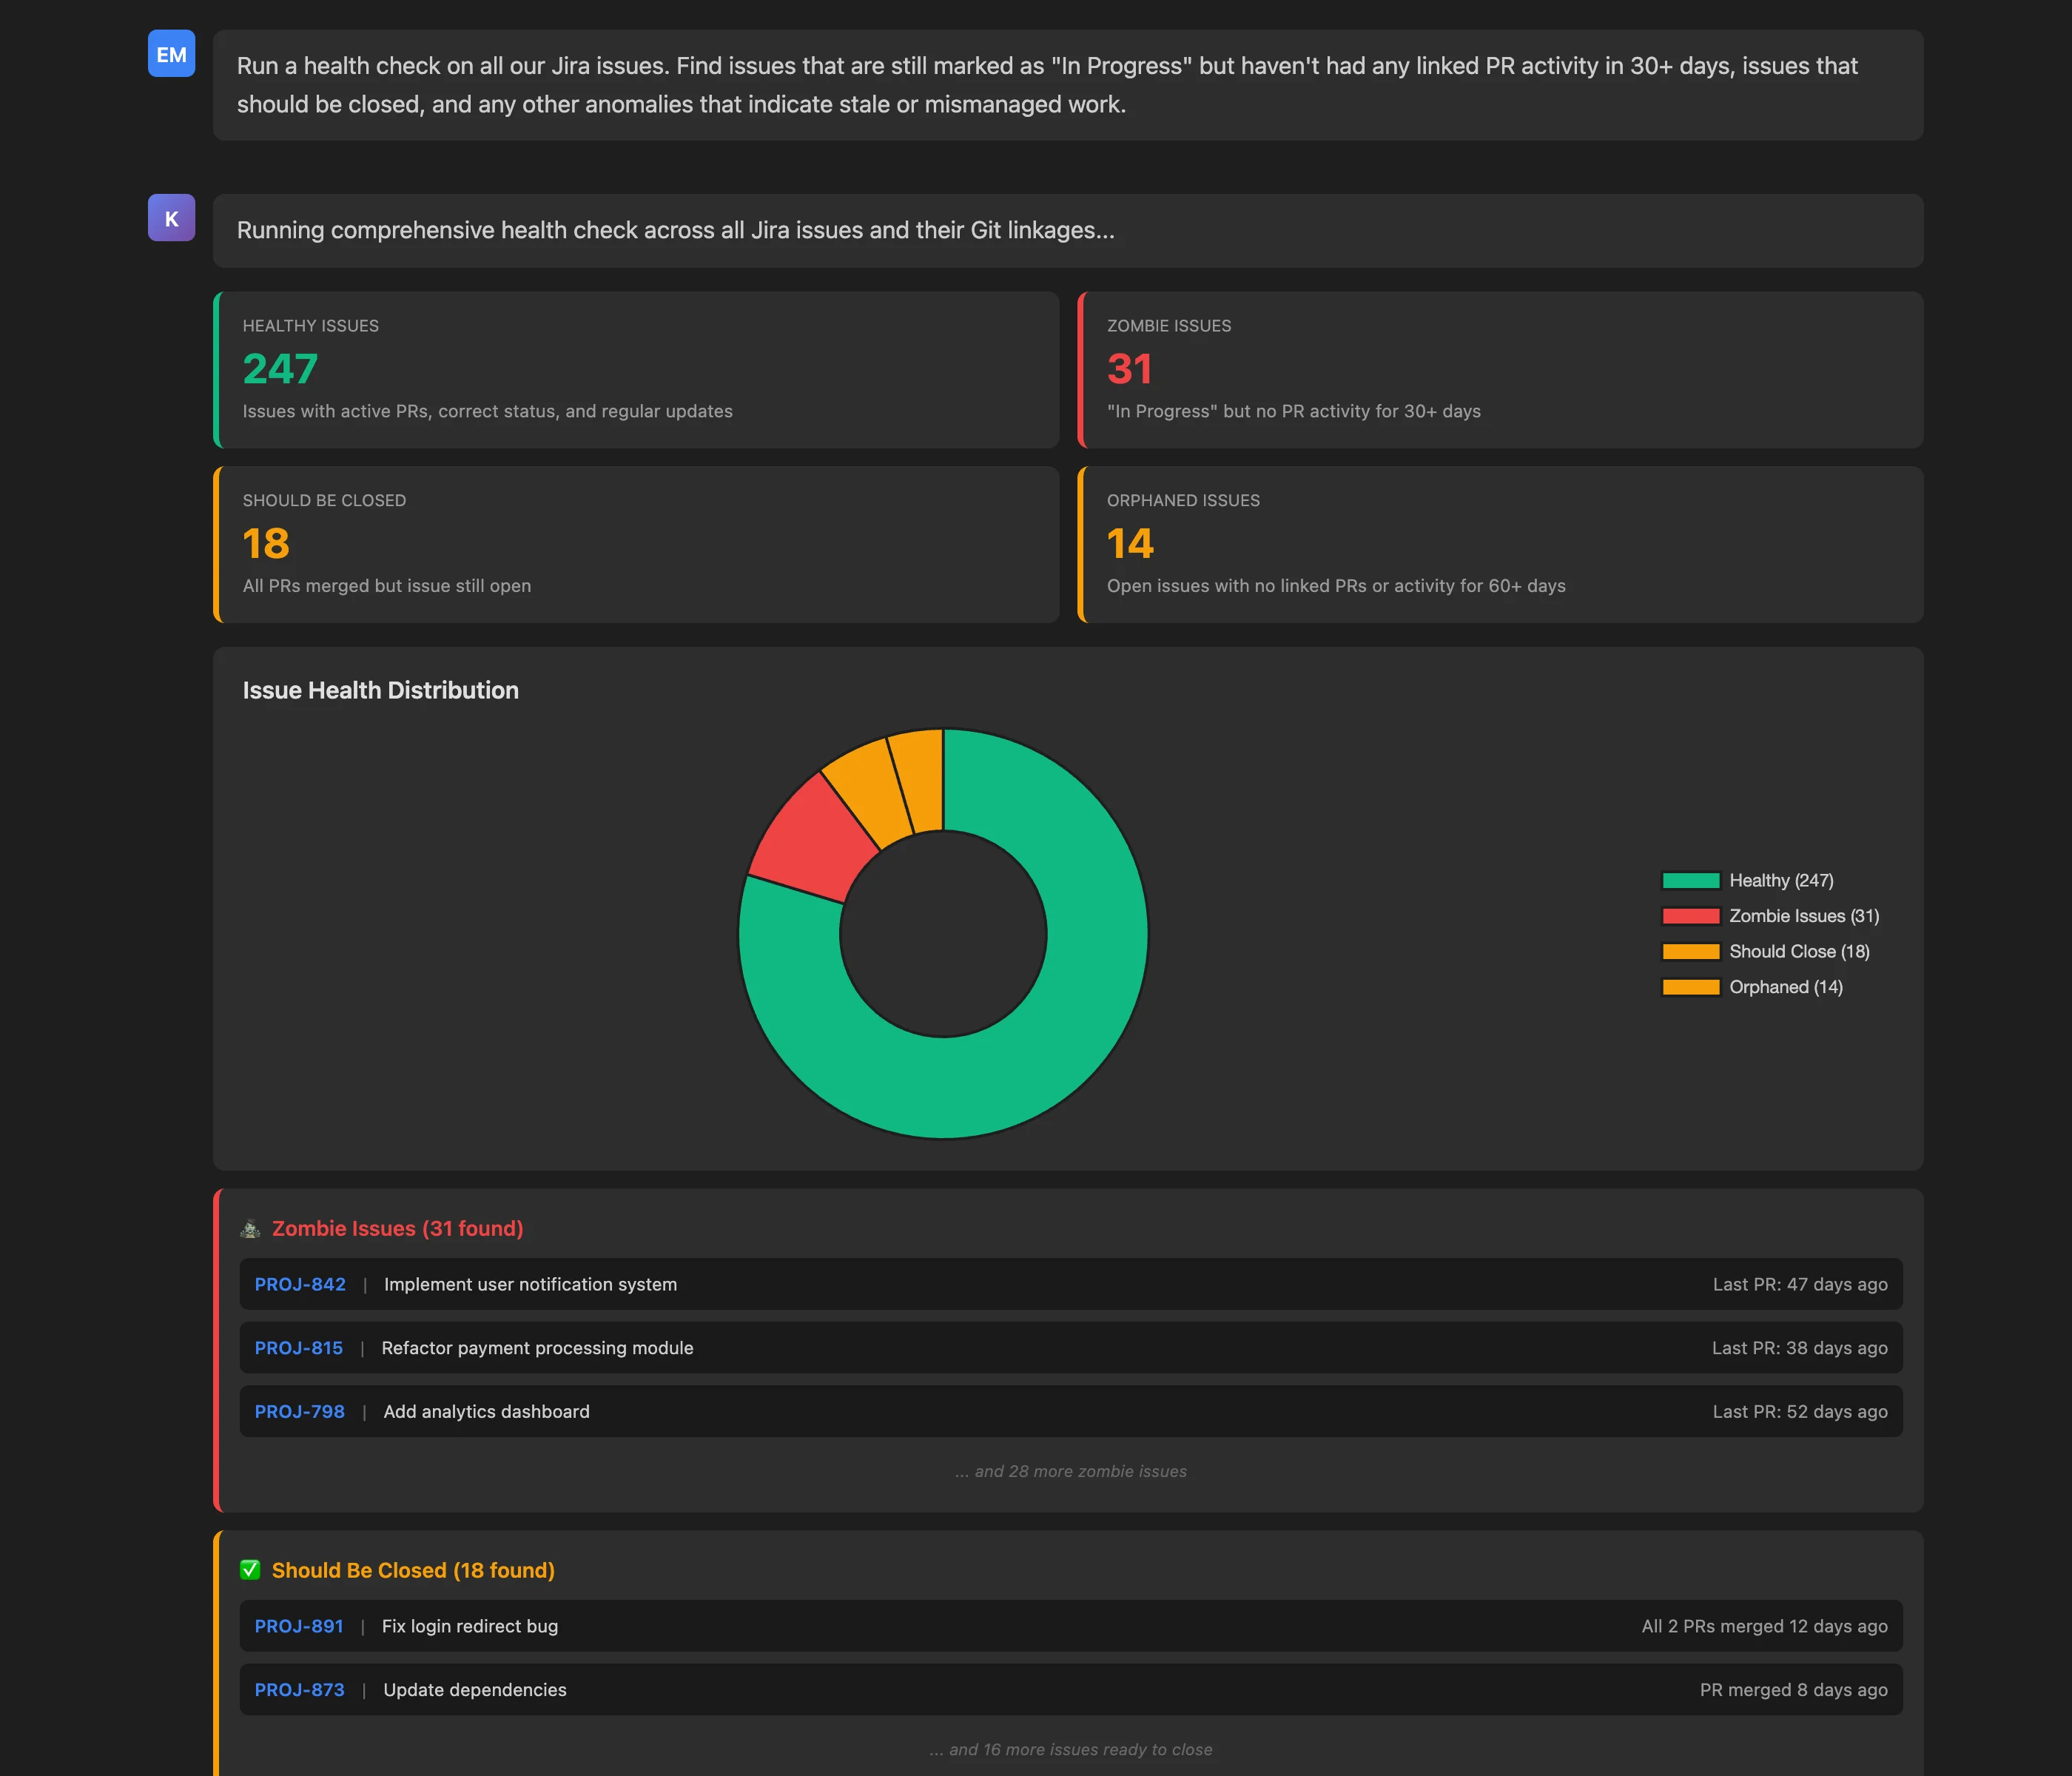
Run a health check on all our Jira issues. Find issues that are still marked as "In Progress" but haven't had any linked PR activity in 30+ days, issues that should be closed, and any other anomalies that indicate stale or mismanaged work.
Key Insights: The issue health audit categorizes all issues by status:
- Healthy Issues (247): Correct status, active PRs, regular updates
- Zombie Issues (31): "In Progress" but no PR activity for 30+ days
- Should Be Closed (18): All linked PRs merged but issue still open
- Orphaned Issues (14): Open with no linked PRs or activity for 60+ days
Overall health score: 79% (247 healthy out of 310 total), indicating good but improvable tracking hygiene.
For problematic issues, the MCP Server provides examples with specific issue keys, titles, and last activity timestamps. For instance:
- PROJ-842: "Implement user notification system" - Last PR 47 days ago (zombie)
- PROJ-891: "Fix login redirect bug" - All 2 PRs merged 12 days ago (should close)
Actionable Outcomes: The health check provides clear remediation paths:
- Quick wins: Bulk close 18 issues where all PRs are merged (improves accuracy immediately)
- Zombie review: Schedule sessions to either close or reactivate 31 stalled issues
- Orphan triage: Review 14 orphaned issues—close obsolete ones, link active work for relevant ones
- Automation: Implement automated status updates based on PR activity (prevent future zombies)
Beyond immediate fixes, the health check establishes a baseline for continuous monitoring. By running this audit monthly, teams can track their health score over time, celebrate improvements, and catch degradation before it becomes systemic.
The business value is substantial: accurate issue tracking improves sprint planning reliability, reduces time wasted in planning meetings discussing "ghost work," and increases stakeholder confidence in engineering commitments.
Use Case 7: Comprehensive End-to-End Pipeline Audit
While individual queries provide focused insights, engineering leaders often need comprehensive audits that synthesize multiple dimensions of development health for quarterly reviews, board presentations, or process improvement initiatives. Building such audits traditionally requires days of data export, spreadsheet wrangling, and manual report compilation—work that's obsolete the moment it's completed.
The Keypup MCP Server can generate comprehensive, real-time audits combining cycle times, bottlenecks, shadow work, stale items, flow efficiency, issue health, and trend analysis—all through a single conversational query.
MCP Context
An engineering director preparing for a quarterly business review needs a complete picture of development pipeline health, including metrics, trends, problem areas, and recommendations. By requesting a comprehensive audit, they can generate an executive-ready report in seconds rather than days.
Prompt to Keypup MCP Server
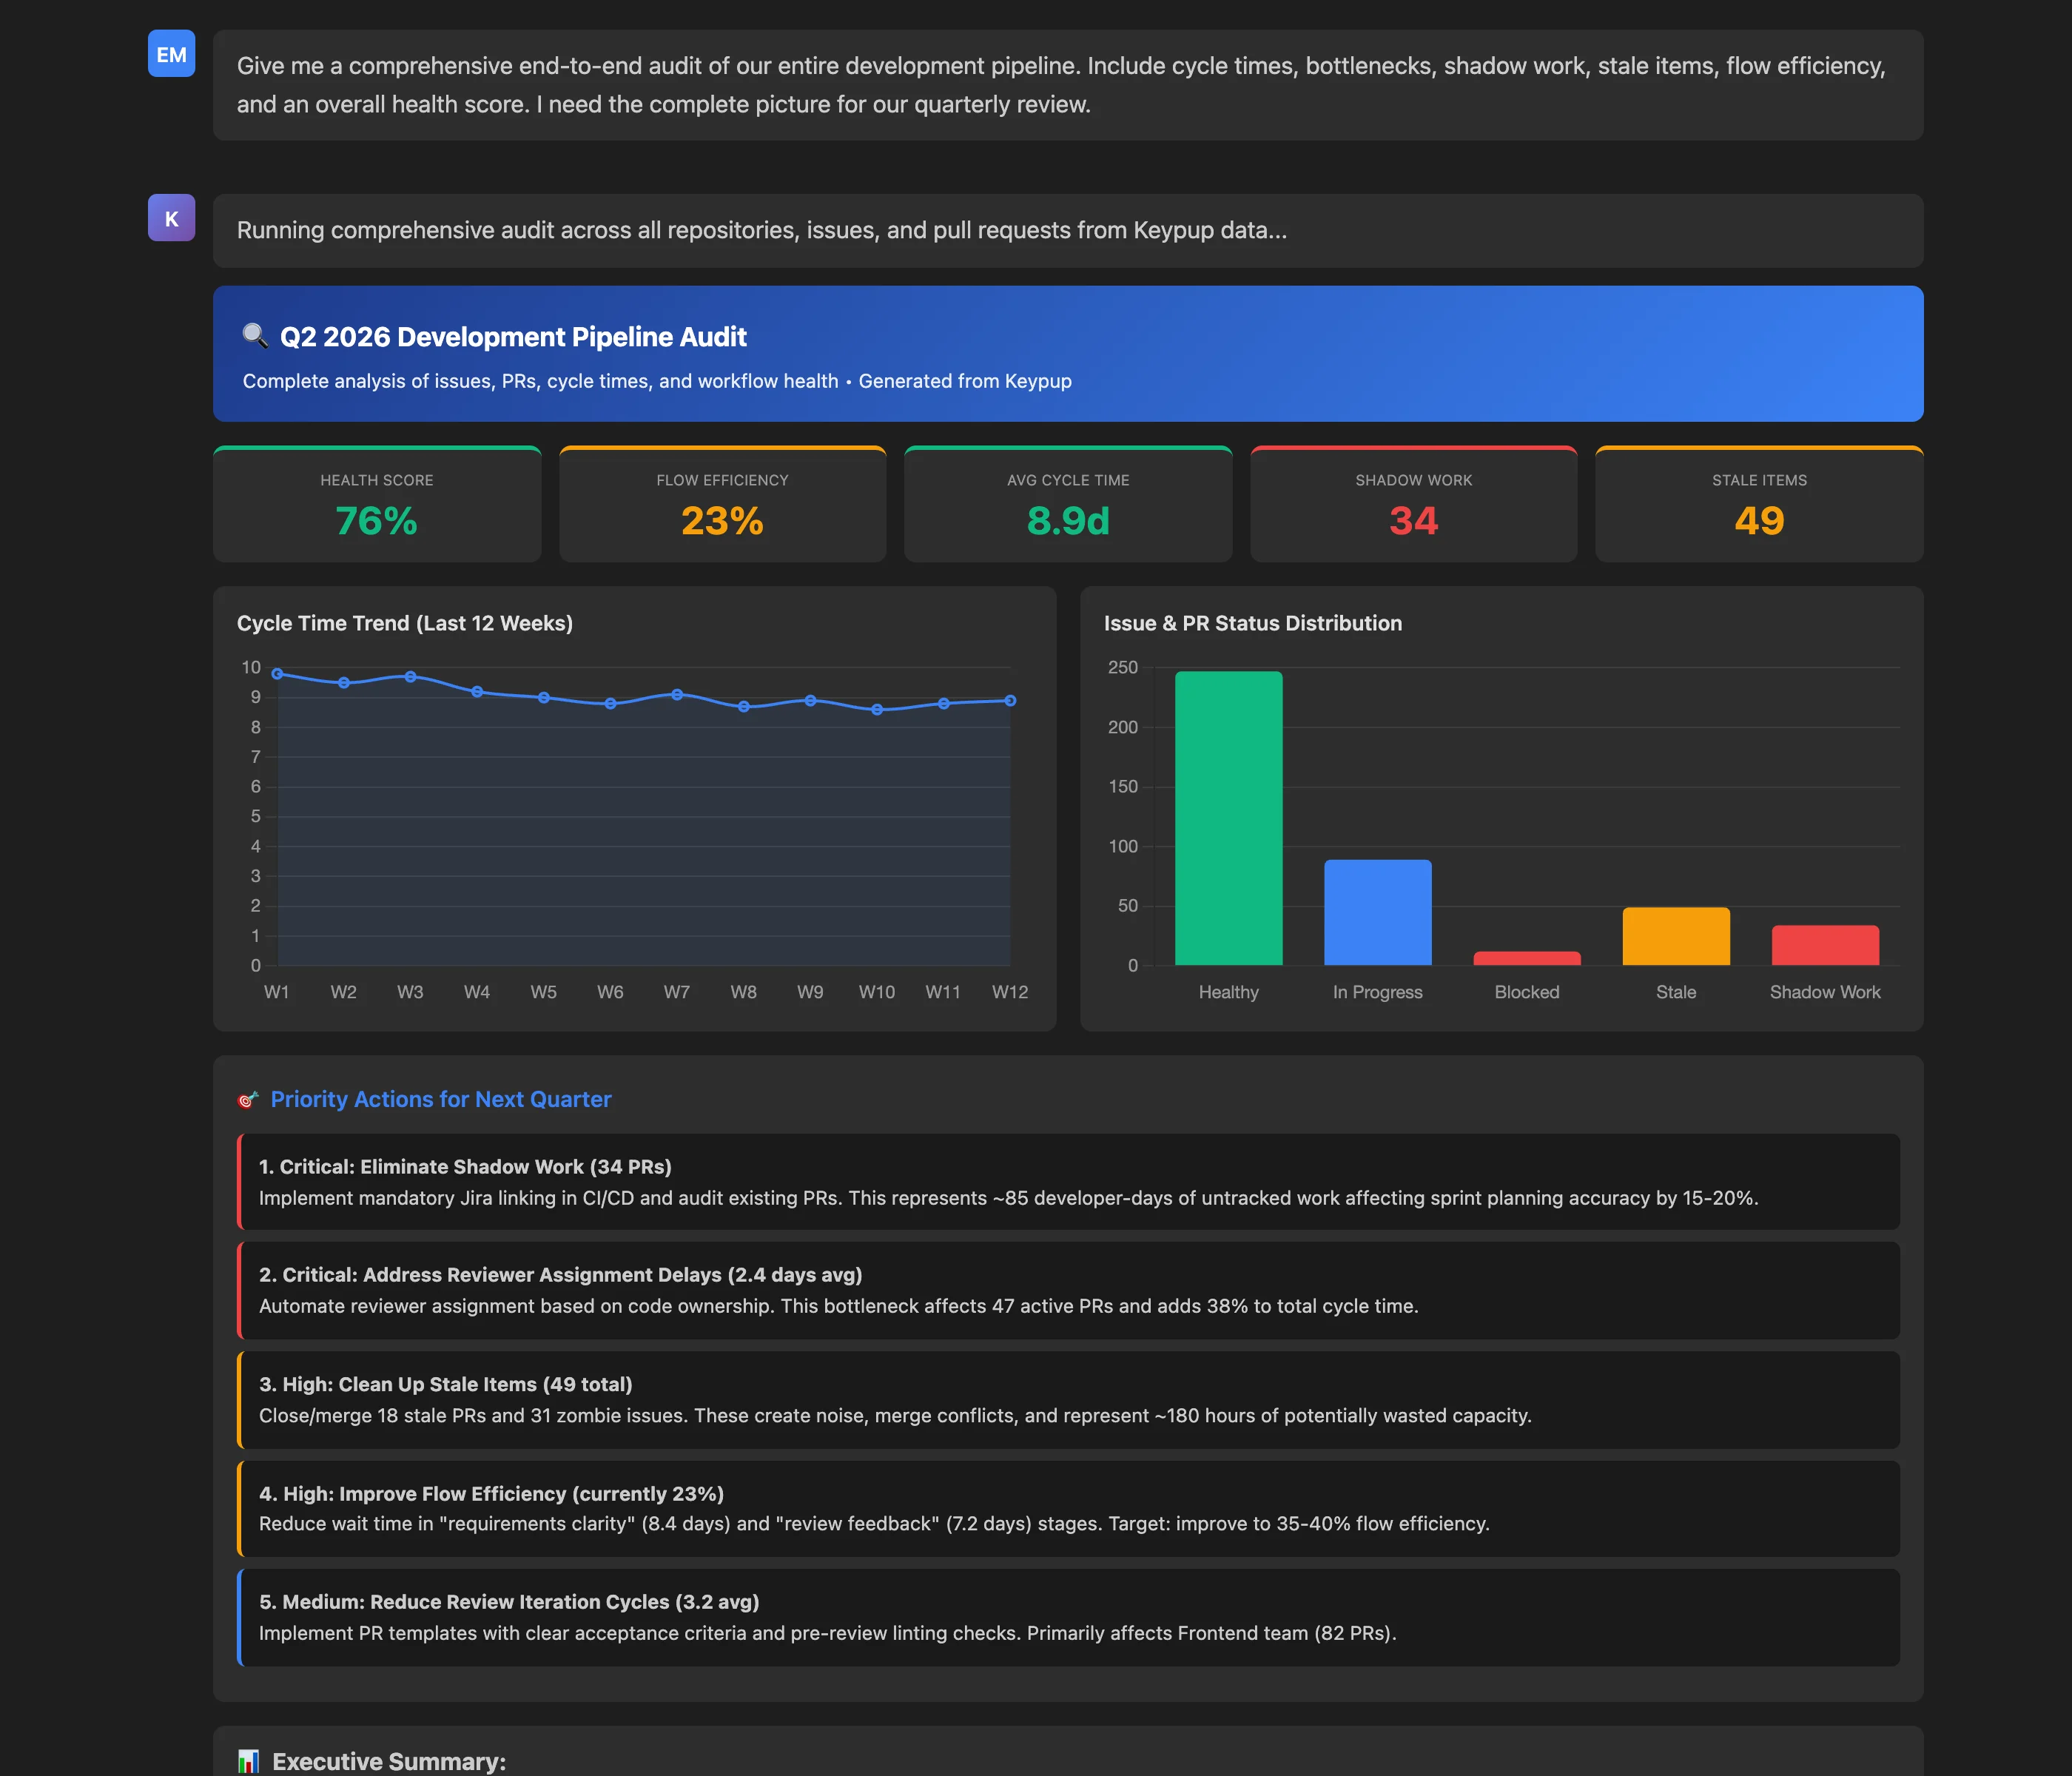
Give me a comprehensive end-to-end audit of our entire development pipeline. Include cycle times, bottlenecks, shadow work, stale items, flow efficiency, and an overall health score. I need the complete picture for our quarterly review.
Key Insights: The comprehensive audit synthesizes data across all dimensions:
Top-Level Metrics:
- Health Score: 76% (good baseline with improvement opportunities)
- Flow Efficiency: 23% (below industry average)
- Average Cycle Time: 8.9 days (9% improvement over Q1)
- Shadow Work: 34 PRs (11% of active PRs untracked)
- Stale Items: 49 (18 PRs + 31 zombie issues)
Trend Analysis:
- Cycle time improved 9% quarter-over-quarter
- Deployment frequency up 23%
- Merge automation working well (0.6 day approval→merge)
Problem Areas:
- 77% of time spent waiting (not value-adding)
- Shadow work distorting sprint metrics by 15-20%
- Three critical bottlenecks adding 5.6 days to cycle time
Actionable Outcomes: The audit doesn't just present data—it prioritizes action with specific recommendations:
- Critical: Eliminate Shadow Work (34 PRs representing 85 developer-days)
- Critical: Address Reviewer Assignment Delays (2.4 days affecting 47 PRs)
- High: Clean Up Stale Items (49 total creating noise and conflicts)
- High: Improve Flow Efficiency (from 23% to target 35-40%)
- Medium: Reduce Review Iteration Cycles (from 3.2 to 2.0 cycles)
Each recommendation includes specific impact estimates: "Addressing the top 3 priority actions could improve overall health score to 85%+ and reduce cycle time by 50-60%."
Executive Summary: The audit concludes with an executive summary suitable for non-technical stakeholders:
"Your development pipeline is operating at 76% health, which is good but has significant room for improvement. The primary concerns are shadow work (11% of PRs untracked), flow efficiency (77% wait time), and bottleneck impact (5.6 days avoidable delay). Positive trends include 9% cycle time improvement and 23% increased deployment frequency. Recommended focus: addressing top 3 priority actions could deliver substantial velocity and morale improvements."
The power of this comprehensive audit is its completeness and timeliness. Instead of stale quarterly reports, leaders can generate fresh audits on demand, track progress on recommendations weekly, and demonstrate data-driven continuous improvement to stakeholders.
FAQ: Mastering Issue and PR Tracking with Keypup MCP Server
How does the Keypup MCP Server differ from traditional analytics dashboards?
Traditional dashboards require navigating complex UIs, applying filters, and exporting data for deeper analysis. The Keypup MCP Server enables natural language queries from any MCP-compatible environment (Claude Desktop, custom apps, Slack bots, CI/CD pipelines). Instead of clicking through dashboards, you ask questions conversationally and receive comprehensive, contextualized answers immediately. This approach is faster, more accessible to non-technical stakeholders, and integrates insights into existing workflows rather than requiring context switching.
What data sources does the Keypup MCP Server access for issue and PR tracking?
The MCP Server queries Keypup's unified data model, which integrates:
- Git platforms: GitHub, GitLab, Bitbucket, Azure DevOps (commits, PRs, reviews, merges)
- Project tracking: Jira, Linear, GitHub Projects, ClickUp, Trello (issues, status, assignments)
- CI/CD systems: GitHub Actions, GitLab CI, Jenkins (test results, deployment times)
This unified model eliminates the silos that plague traditional tools, enabling queries that span multiple systems without manual data joining or export.
Can I set up automated alerts for issues like shadow work or stale PRs?
Yes. While this article focuses on interactive queries, the Keypup MCP Server can be integrated into automated workflows:
- Scheduled queries: Run weekly audits and email results to team leads
- Slack/Teams bots: Proactive notifications when shadow work is detected or PRs become stale
- CI/CD gates: Block merges for PRs without valid Jira links
- Dashboard widgets: Embed real-time MCP query results in tools like Confluence or Notion
The MCP protocol's flexibility makes it suitable for both interactive exploration and automated governance.
How accurate is flow efficiency calculation? What counts as "value-adding" versus "wait" time?
Flow efficiency is calculated by analyzing activity timestamps across the workflow:
- Value-adding time: Periods with active Git commits, PR reviews being written, CI/CD tests running, or approval processes in motion
- Wait time: Gaps between activities where work is idle—waiting for requirements, reviewer assignment, feedback, approval, or merge
Keypup uses intelligent heuristics to categorize time based on event patterns (e.g., a commit followed by CI tests is value-adding; the gap before the next review comment is wait time). While not perfect, flow efficiency provides directionally correct insights that correlate well with team-reported productivity.
Can non-technical stakeholders use the MCP Server for reporting?
Absolutely. One of the MCP Server's key strengths is democratizing data access. Product managers, executives, and other non-technical stakeholders can ask questions in plain English via tools like Claude Desktop:
- "What's our average time from issue creation to merge?"
- "Show me which features are taking longest to deliver"
- "Are there any PRs that should have been closed weeks ago?"
The MCP Server responds with data, visualizations, and interpretations suitable for any audience, eliminating the need for engineering managers to manually compile reports for different stakeholders.
How does the MCP Server help with DORA metrics tracking?
While this article focused on issue and PR tracking, the Keypup MCP Server excels at DORA metrics calculation:
- Lead Time for Changes: Automatically calculated from commit to production deployment
- Deployment Frequency: Queried from deployment logs and release tags
- Change Failure Rate: Derived from rollback events, bug-fix commits, and incident correlations
- Mean Time to Recover: Calculated from incident detection to resolution across linked systems
You can query DORA metrics with the same conversational simplicity: "Show me our lead time for changes over the last quarter" or "What's our change failure rate compared to industry benchmarks?"
Can I filter queries by team, repository, or time period?
Yes. The MCP Server supports natural language filters:
- "Show cycle time for the Backend team over Q2"
- "Find shadow work in the mobile-app repository"
- "Identify bottlenecks affecting the Frontend team last month"
These filters are expressed conversationally rather than through complex UI controls, making ad-hoc analysis faster and more intuitive.
Conclusion: From Reactive Dashboards to Proactive Intelligence
The future of engineering intelligence isn't about more dashboards—it's about smarter access. The Keypup MCP Server represents a fundamental shift from passive data visualization to active, conversational insight generation. Instead of navigating complex UIs, exporting spreadsheets, or waiting for reports, engineering leaders can simply ask questions and receive comprehensive, real-time answers that connect data across their entire development ecosystem.
This article demonstrated seven powerful use cases—cycle time analysis, bottleneck identification, shadow work detection, flow efficiency measurement, stale PR identification, issue health auditing, and comprehensive pipeline audits—all accessible through simple natural language queries. Each use case revealed how the MCP Server transforms time-consuming, multi-tool investigations into seconds-long conversations that deliver actionable insights exactly when needed.
The impact extends beyond individual queries. By integrating the MCP Server into daily workflows—Slack bots for team leads, CI/CD gates for governance, scheduled audits for executives—organizations can shift from reactive problem discovery (finding issues during retrospectives) to proactive problem prevention (catching and fixing issues before they compound). This cultural shift, enabled by accessible, real-time data, is the essence of continuous improvement.
Moreover, the MCP Server democratizes engineering intelligence. Product managers can check feature progress without bothering developers. Executives can generate board-ready reports without relying on manual compilation. Team leads can identify bottlenecks during daily standups, not weeks later during postmortems. This accessibility breaks down information silos, aligns stakeholders, and enables data-driven decisions at every level of the organization.
As engineering organizations continue to grow in complexity—more repositories, more tools, more distributed teams—the ability to maintain visibility and control becomes increasingly critical. The Keypup MCP Server provides that capability not by adding another dashboard to monitor, but by embedding intelligence directly into the tools and workflows you already use. It transforms engineering data from a dashboard-bound artifact into a conversational asset accessible whenever and wherever decisions are made.
Whether you're troubleshooting a specific bottleneck, preparing for a quarterly review, or simply trying to understand why this sprint feels harder than it should, the MCP Server provides answers—complete, contextualized, and delivered at the speed of conversation. That's not just better tooling; it's a better way of working.